Article

Field Observations of a Multilevel Beach Cusp System and Their Swash Zone Dynamics

1
Marine Renewable Energy Ireland (MaREI) Centre, Environmental Research Institute (ERI), University College Cork (UCC), P43 C573 Cork, Ireland
2
School of Civil, Structural and Environmental Engineering, University College Cork (UCC), T12 K8AF Cork, Ireland
3
Department of Geography, University College Cork (UCC), T12 K8AF Cork, Ireland
*
Author to whom correspondence should be addressed.
Geosciences 2021, 11(4), 148; https://doi.org/10.3390/geosciences11040148
Submission received: 14 February 2021 / Revised: 14 March 2021 / Accepted: 18 March 2021 / Published: 24 March 2021

Abstract

:
This paper presents the observed morphological evolution of a multilevel beach cusp system in Long Strand, Co. Cork, Ireland. The surveys were carried out with an Unmanned Aerial Vehicle (UAV) system between March and September 2019. From this site, three levels of beach cusps on the beachface (i.e., lower beach level, mid beach level and upper beach level), and critical cusp parameters are reported, including cusp spacing, cusp elevation, cusp depth, and cusp amplitude. Thus far, such an extensive dataset has not previously been reported in the literature from a single site. The evolution of the different cusp parameters is then linked with the hydrodynamics in the study area, and new prediction theories are proposed for the different cusp parameters. The Lower beach level cusps (1 < z < 2.5 m Irish Transverse Mercator (ITM)) changed with every tide and appeared when surf-similarity parameter-ξ0 < 1.55. These cusps had a mean cusp spacing of λmean = 11.09 m, which are closely linked with the predictions of the self-organisation theory (p < 0.05). In contrast, the Mid beach level cusps (2.5 < z < 3.5 m ITM) are less dynamic compared to the Lower beach level cusps and can persist between spring tidal cycles. They had a mean cusp spacing of λmean = 18.17 m. The Upper beach level cusps (approximately z = 6 m ITM) are above astronomical tide levels and have a mean cusp spacing of λmean = 40.26 m. They did not change significantly over the survey period due to a lack of major storm events. These findings give a better understanding of the evolution of different cusp parameters for a multilevel beach cusp system and can be used to formulate a global theory regarding their change over time.

1. Introduction

The swash zone is located at the landward edge of the surf zone, on the upper part of the beach profile. It is characterised by inundations from incoming waves from the surf zone, which force oscillatory motion on the shoreline at a variety of frequencies; (1) Short Waves (1 < Tp < 20 s); and (2) Long or Infragravity Waves (25 < Tp < 250 s). The continuous input of energy from waves, tides and currents, and the dissipation of such energy through a wide number of processes (e.g., wave breaking, run-up), transports sediment, which leads to erosion and/or accretion of the beachface [1,2].
Swash motion itself can be broken down into two different flows: (1) Uprush, and (2) Backwash. During the uprush, the flow velocity increases quickly from zero to its maximum after the arrival of the incident wave. Afterwards, the flow velocity decreases steadily to zero during the remainder of the uprush. On the contrary, during the backwash, flow velocity increases gradually under gravity from zero to maximum, until it meets the next incoming wave, noting that the duration of the backwash is typically longer than the uprush. The morphology of the beach is changed by these flows and, consequently, swash motion leads to sediment transport on the beachface. Initially, the sediment is moving in the same direction as the swash flow, i.e., onshore during uprush and offshore during backwash. The asymmetry of the swash flow during uprush and backwash, leads to net asymmetric sediment transport [3], which changes the cross-shore bed profile and alongshore morphological features. The interaction between hydrodynamics and morphology, and the asymmetric sediment transport, can generate striking shoreline patterns and produce rhythmic features over a wide range of scales [4]. Features may be periodic in either the cross-shore (e.g., sandbars) or alongshore direction (e.g., cusps). This study focuses on the evolution of beach cusps in the swash zone. Previous studies [5,6,7,8] have confirmed that beach cusps develop and are maintained by swash zone circulation patterns.
Beach cusps are described as crescentic morphological undulations in the beachface. These striking patterns in the swash zone display complex behaviour, seemingly at odds with their simplicity and rhythmicity, repeating itself alongshore with remarkable regularity in spacing. They are commonly found on beaches worldwide and are characterised by a defined sequence of a horn-bay-horn [7]. The horns are steep protruding features extending seaward, whereas the bays are gently sloped landward extensions. They have been observed to form under a wide range of conditions and beach types, though are acknowledged to form mostly during low energy, shore-normal incident wave forcing, on reflective, medium- to coarse-grained beaches [9,10,11,12]. The cusp spacing can vary from metres to tens of metres, scaling with the cross-shore extent of swash motions. Several studies have quantified cusp spacing by means of an empirical expression [10,11,13] or to establish a predictive relationship between measured beach cusp parameters and hydrodynamic conditions [14,15].

2. Beach Cusp Evolution

2.1. Beach Cusp Predictions

The predictive relationships mainly focus on cusp spacing and wave forcing, based upon two main theories: (1) Standing Edge Wave Theory, and (2) Self-Organisation Theory.
In early 1970s, it was believed that the formation of beach cusps was linked to the presence of edge waves [16,17,18]. Edge waves are defined as longshore periodic gravity waves, trapped along the edge of water bodies by refraction. Their amplitude is maximal at the shoreline and dissipates exponentially offshore. Edge waves vary sinusoidally alongshore, which results in a regular longshore variation of wave run-up on beaches. This variation is linked with the wavelength, as it is assumed that the wavelength of the edge wave is related to cusp spacing [17]. The formation from standing edge waves can then be subdivided in subharmonic and synchronous edge waves [18,19,20,21]. This theory results in a predicted cusp spacing equal to:
λ c = m g π T 2 s i n β
with: m = 1 for subharmonic edge wave; m = 0.5 for synchronous edge waves; g is gravitational acceleration; β is the tangent of the beach slope; and T is the period of the incident waves.
The self-organisation theory is described by Werner and Fink [22]. It proposes an interaction between regular waves, currents, and sediment over time, which creates feedback loops. The approach is related to the coupling of hydrodynamics and sediment, which organises itself into rhythmic patterns without any external spatially distributed forcing. The theory has been supported by Coco et al. [23] and expresses cusp spacing as a function of the horizontal swash excursion, S:
λ c = f S
where f is a non-dimensional constant estimated at approximately f = 1.6 [22].
To date, the only other attempt to predict cusp spacing is developed by Sunamura [24]. He proposed a model based on the theoretical concept that the extent of wave run-up at a cusp horn is related to the cusp spacing, and that the flow path is affected by the grain size of the beach sediment:
λ c = A φ T g H
where φ is a coefficient related to the mean grain size and A is a constant (estimated to be A = 1.35).
Despite the interest in the development of beach cusps, there is still a considerable debate on their fundamental processes (e.g., formation, evolution, their link with hydrodynamics). This is especially true for multilevel beach cusp systems.

2.2. Multilevel Beach Cusp System

Multilevel beach cusp systems have not yet been heavily investigated, mainly due to the lack of three-dimensional observations and only a few references are found in the literature. Antia [25] observed several tidal and morphodynamic beaches on the Nigerian coast. The field examination showed that cusp parameters were primarily controlled by the foreshore slope and that two levels of cusps were typical of medium- to coarse-grained, reflective, and macrotidal beaches. In addition, cusps were most prevalent during calm conditions and their cusp spacing was noted to improve with an increase in beach reflectivity.
Carter and Orford [26] focused their research on coarse clastic beaches and reported that three or four levels of cusps are commonly present on Portmore Strand, Malin Head, Ireland. The observed cusp spacing for the different levels are, respectively: 5.5 m, 14 m, 25 m, and 53 m, corresponding to edge wave periods of: 3.8 s, 6.1 s, 8.1 s, and 11.2 s. They conclude that the cusp spacing of the different cusp levels decrease with decreasing wave period and tidal elevation. Additionally, cusps were observed during reflective wave conditions together with large, relative immobile clasts, which form steep slopes and lead to the development of low mode harmonic and subharmonic edge waves.
Vousdoukas [27] examined daily variations, over a five-month period, of cusp spacing using coastal imagery. Faro Beach is characterised as a mesotidal, steep beach, located in the Algarve, Portugal. Two different levels of beach cusps are observed ranging between 8 m and 67 m. The upper beach (z = 3 m Mean Sea Level (MSL)) clearly showing a larger cusp spacing than the lower level (z = 1 m MSL), with their evolution being controlled by; (1) Wave forcing, (2) Tidal elevation, and (3) Interaction between existing beach cusp levels. In fact, the study argues that lower beach level cusps changed constantly and often merge with the upper beach level cusps, typically when the significant wave height exceeded Ho > 1.5 m. The merging and interaction of different cusp levels was also highlighted by Almar et al. [28]. The evolution of a beach cusp system was analysed using a three-year dataset of coastal imagery collected at Tairue Beach, New Zealand. They report observations of changes in cusp spacing and allocate that change to the merging of adjacent cusps within the cusp field, with the overall cusp spacing readjusting to accommodate the disappearance of a cusp horn.
Topographical surveys of Grand Popo Beach, Benin also showed a double beach cusp system [29,30,31]. The beach is characterised by a low-tide terrace and a high-tide reflective part, with cusp spacing on the upper beach approximately 45 m and on the lower beach approximately 35 m. They also highlighted that the beach cusps higher on the beach are often asymmetric, compared to the lower beach cusps which appear to be more symmetric. They argue that the destruction of the lower beach cusp is related to accretion conditions and/or calm conditions. Senechal et al. [30] also highlights the merging of individual features, which causes the disappearance of the upper beach cusps.
In conclusion, these studies confirm that beach cusps on the upper beachface are characterised by wider, more stable cusp systems, whereas the cusps located near the water level, in general, are of a smaller dimension and are more dynamic, often changing on a daily basis.
The aforementioned predictive formulations and the evolution of (multilevel) beach cusp systems mainly focuses on the quantification of cusp spacing. Multiple other beach cusp parameters are also relevant and can be obtained from these features (Figure 1), i.e., Cusp Amplitude, Cusp Elevation, and Cusp Depth [32]. Cusp spacing (Cs) is defined as the horizontal distance alongshore between the points of the highest relief on two cusp horns; Cusp elevation (Ce) is the highest point on the cusp horn above MSL; Cusp depth (Cd) is the distance from the maximum high point on the cusp horn to the limit of swash excursion in the rear of the bay; and Cusp amplitude (Ca) is defined as the maximum height difference of the cusp horn and the cusp bay.
Nolan et al. [32], and more recently van Gaalen et al. [33], provided measurements of the different cusp parameters simultaneously. If any correlations between different beach cusp parameters and wave conditions are to be analysed, there is a need for a large dataset, in order to obtain a significant statistical correlation. Moreover, the data should preferably be collected on the same field site. However, van Gaalen’s work only refers to a five-day period and Nolan’s is from multiple sites. In this regard, a more comprehensive understanding of the link between more cusp parameters and shoreline hydrodynamics may provide a better insight into what processes interact in cusp formation and evolution.
The aim of this research is to obtain a better understanding of the evolution of a multilevel beach cusp system, with the following objectives:
  • To quantify four different cusp parameters (i.e., Cusp Spacing, Cusp Elevation, Cusp Amplitude, and Cusp Depth) of a three-tiered cusp system during a six-month period;
  • To link their change over time with the hydrodynamics occurring in the study area;
  • To provide insightful information regarding the current predictive formulations for cusp spacing;
  • To formulate new predictive theories for the other cusp parameters (i.e., Cusp Elevation, Cusp Amplitude, and Cusp Depth).
As far as the authors are aware, the dataset presented in this paper has not yet been available in the literature, neither on a three-tiered beach cusp system nor on such an extensive dataset covering the different cusp parameters from a single site. This dataset will greatly contribute to the understanding of the evolution of a multilevel beach cusp system and could be used in the future to formulate a global theory regarding their change over time.

3. Methodology

3.1. Study Area

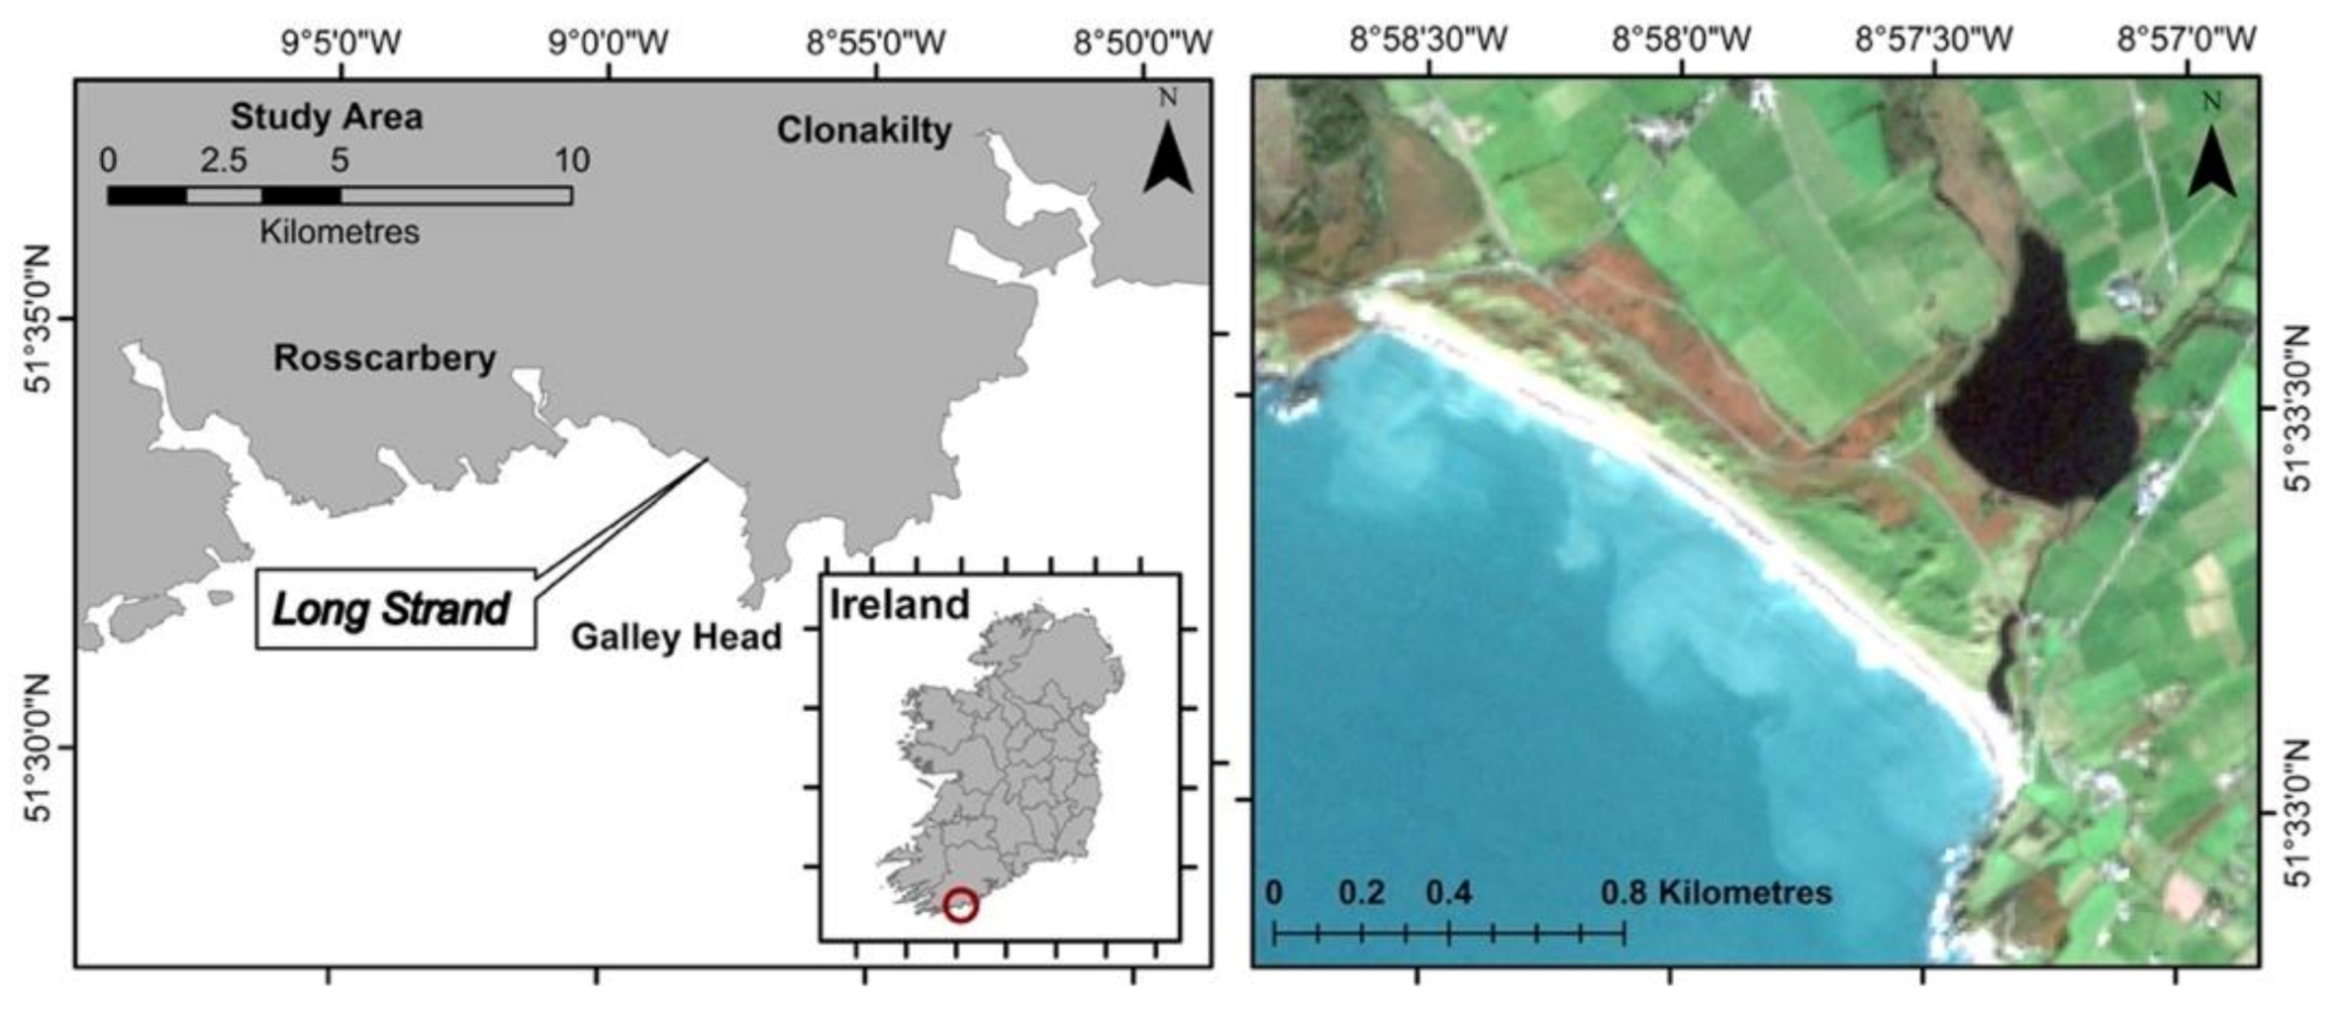
The beach is located in the south-west of Ireland within Rosscarbery Bay and is approximately 1.8 km long (Figure 2). The bay is situated near Galley Head, which shelters the bay from waves propagating from east to south directions. It is a sandy beach with sediments consisting of mainly well-sorted quartz. There is an extensive dune system behind the beach, ranging from a width of 150 m in the west to 250 m in the east. Finally, there is a river outlet channel draining Kilkeran Lake on the east side of the beach.
Statistical analysis of deep-water wave data between 2009 and 2019 (reanalysis data from European Centre for Medium-Range Weather Forecast (ECMWF)) shows that the deep-water wave conditions in Rosscarbery Bay are characterised by mean annual significant wave height Ho = 1.33 m, a mean annual peak wave period Tp = 9.98 s, and a mean annual wave direction of 225° (SW). Records from the tide gauge, the closest to the study Castletownbere (51°39′05.9″ N, 9°54′37.1″ W), show a tidal range between −1.75 m and 1.7 m Irish Transverse Mercator (ITM), which allows Long Strand to be classified as a mesotidal beach. The vertical datum in ITM refers to Ordnance Datum Malin Head.
Intertidal beach profiles indicate that the offshore slope is relatively even and regular (tan β = 0.03) with a steep beach gradient (tan β = 0.11). The median grain size is D50 = 0.673 mm, classified as coarse sand in accordance with the Udden–Wentworth grade scale [34].

3.2. Hydrodynamics

To analyse the impact of hydrodynamics, it was necessary to obtain detailed information on wave conditions near Long Strand. As such, a numerical model was designed to provide wave conditions and incident on the beach, during the survey period. Data input was provided from the ECMWF. The data from the ECMWF was downloaded in NetCDF format and a Python (Python 3.7) script was developed to extract the necessary data at a specific location. The closest data point near Long Strand is 51°30′0″ N, 9°0′0″ W, which is approximately 6 km offshore from the beach. These data were then used as input for MIKE 21 Spectral Waves FM model to obtain specific wave conditions near the beach.
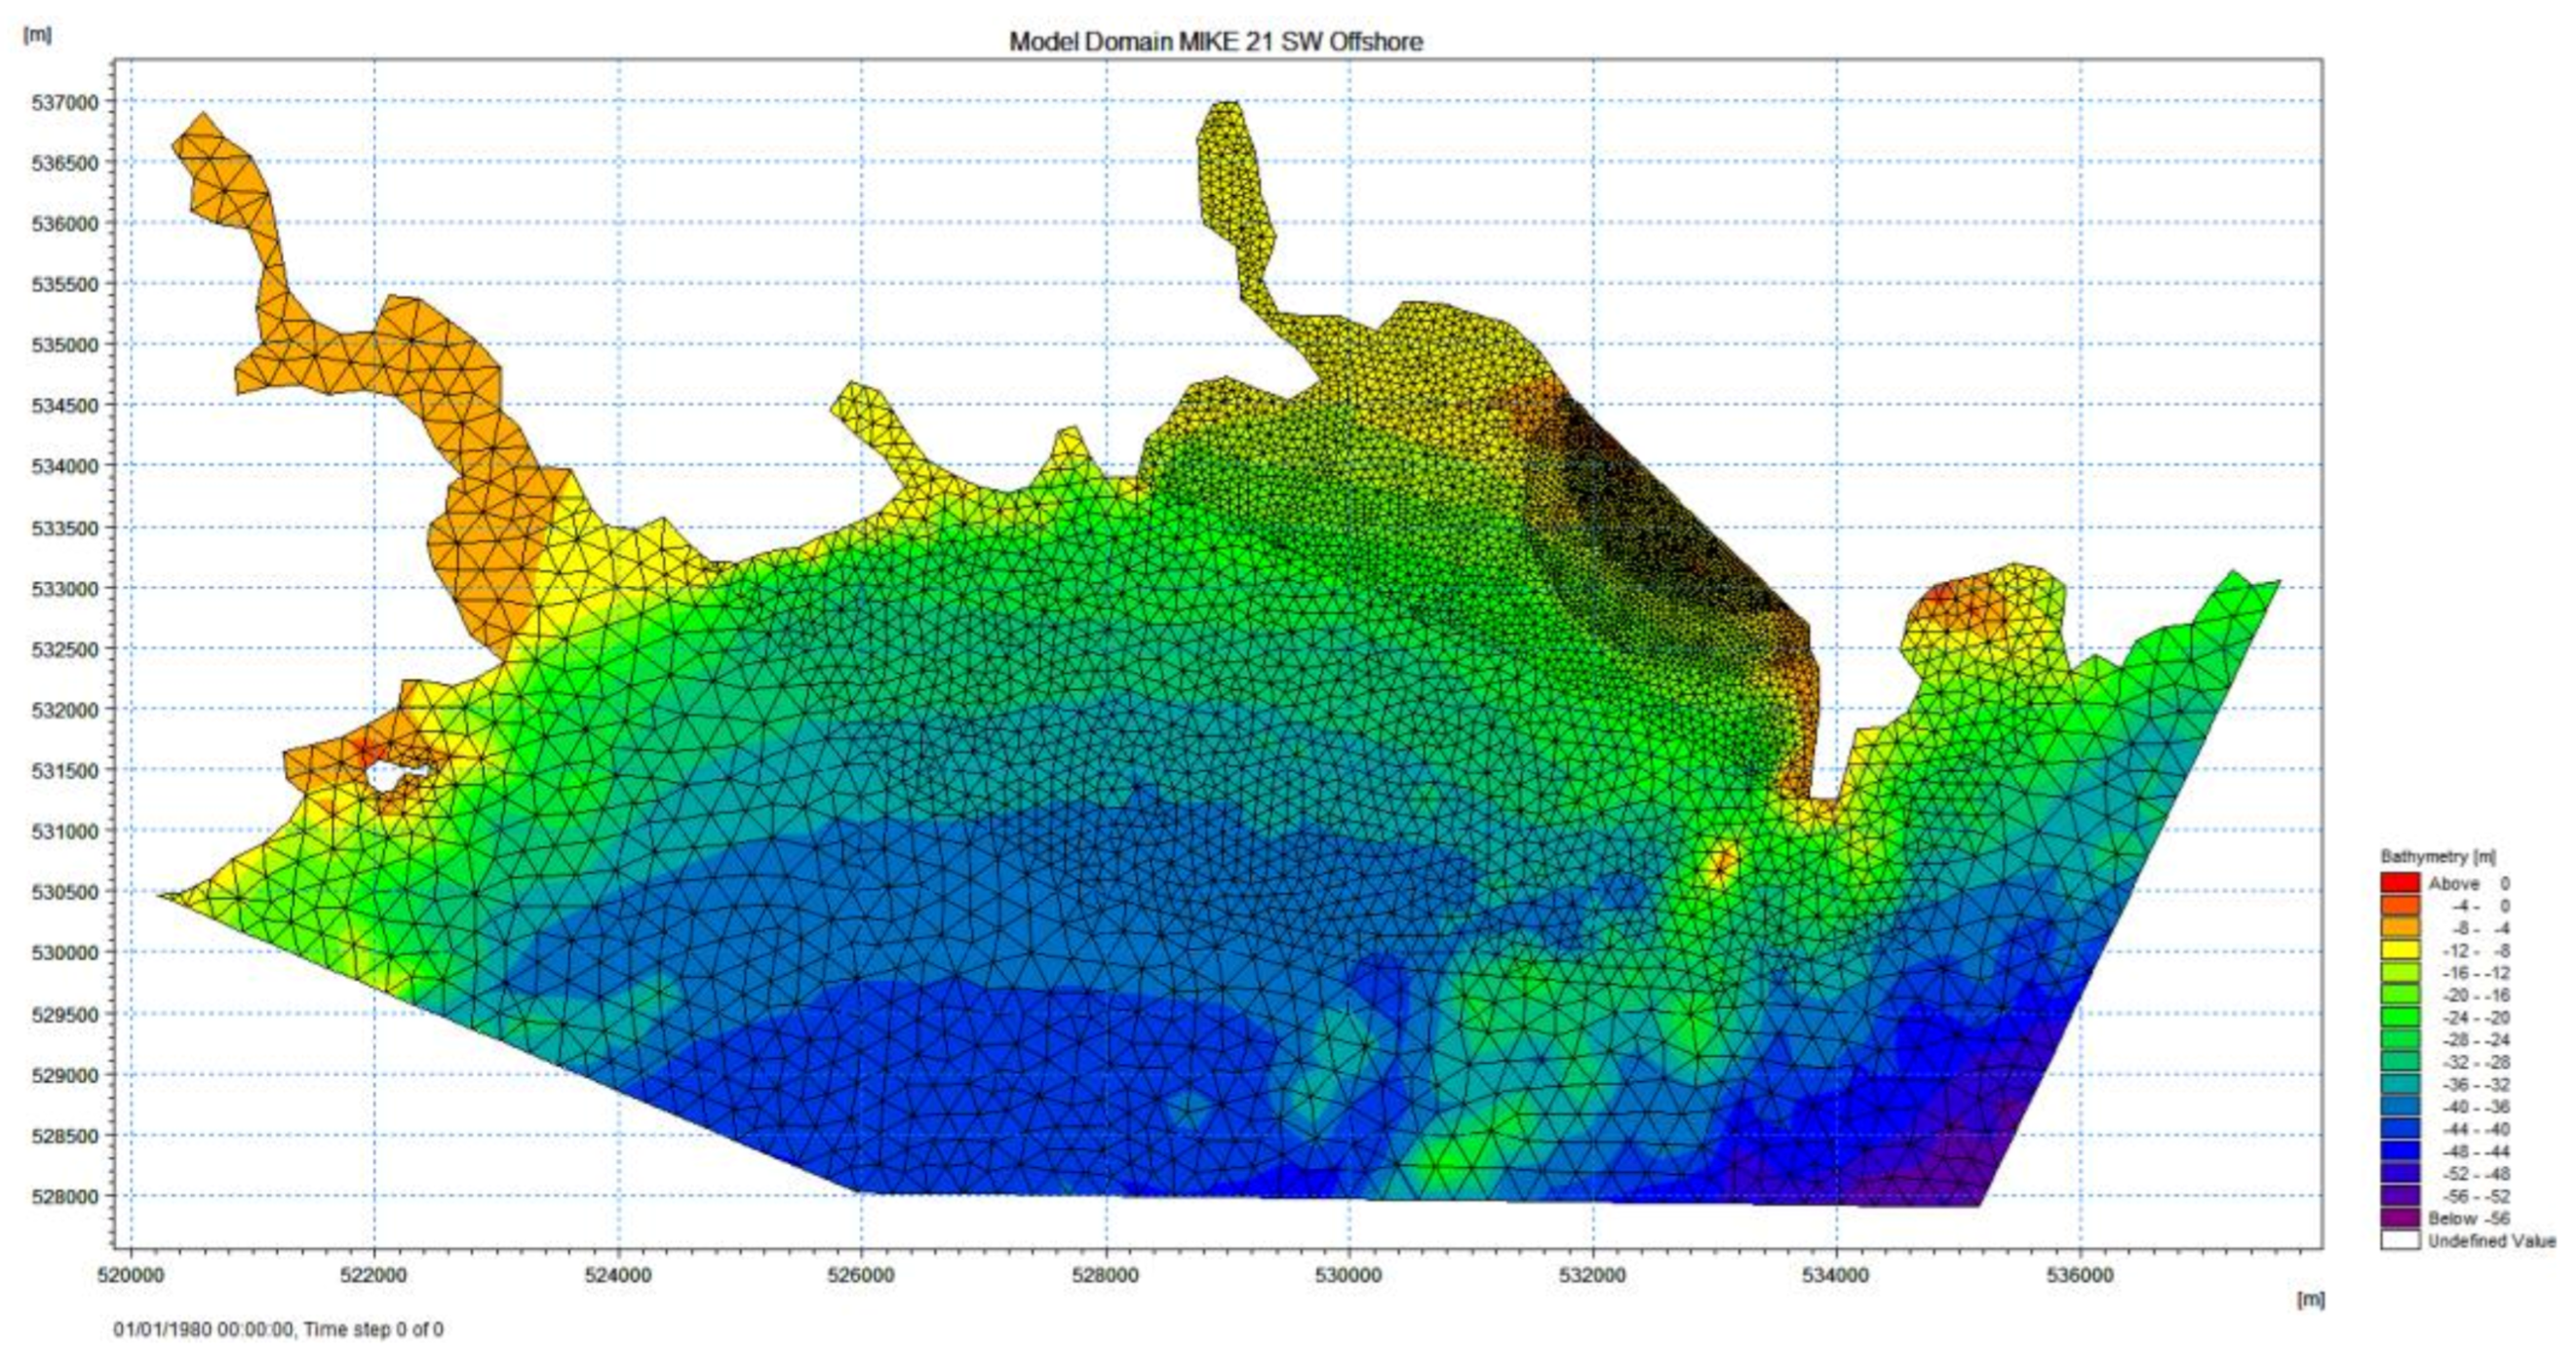
The model domain for MIKE 21 Spectral Wave FM covers Rosscarbery Bay and the offshore area closest to the ECMWF data points. The mesh cell density varied based on the complexity of the bathymetry, with density increasing moving from open ocean in the south towards Rosscarbery Bay. The model domain was represented on an unstructured mesh. In order to reduce computational time, the model domain was split in two different models; the first model domain has five distinct levels of mesh density, with a maximum area of, respectively: 45,000, 15,000, 5000, 2000, 800; decreasing from offshore towards the swash zone in Long Strand, Figure 3. The southern boundaries represent the ECMWF datapoints and are used as wave boundary conditions.
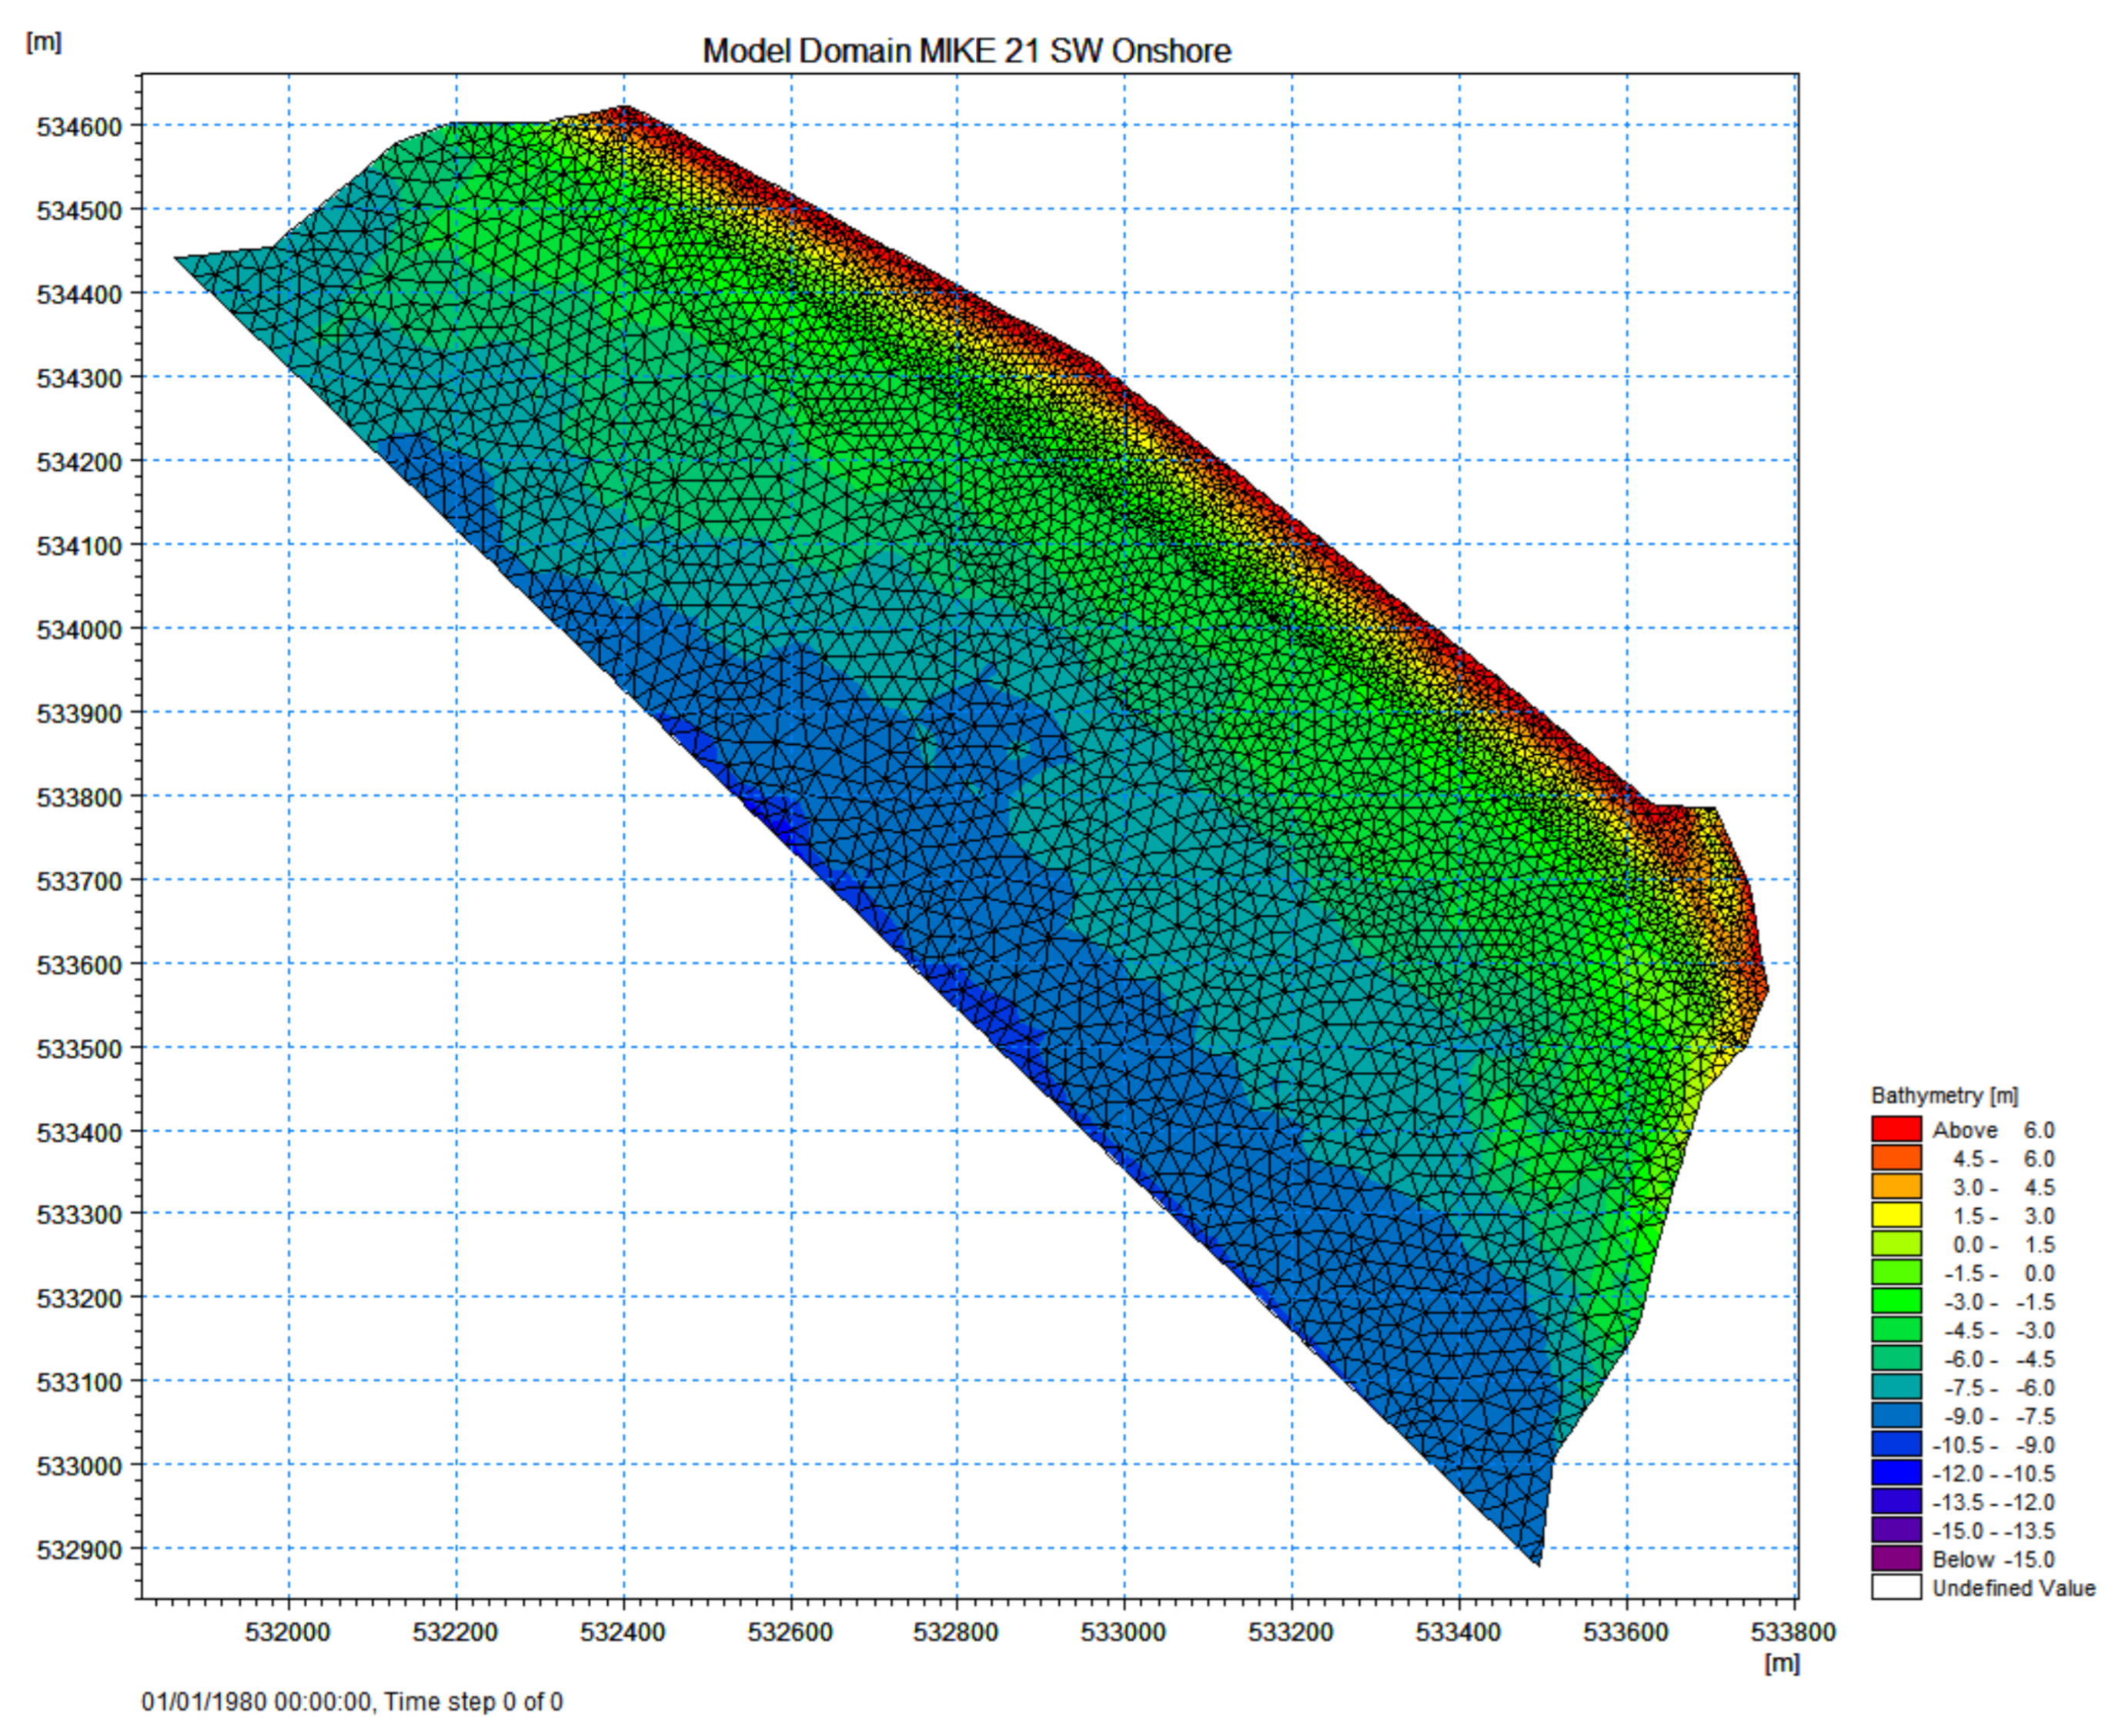
The second model domain, Figure 4, has three distinct levels of mesh density, with a maximum area of, respectively: 500, 250, and 100; decreasing from offshore towards the beachface in Long Strand. Reducing the density of the mesh in the deeper areas of the model domain, where the bathymetry is more homogeneous, reduces the calculation of the different nodes, which then decreases the computational time of the model.
The data for the bathymetry of the model is a combined dataset from the Integrated Mapping for the Sustainable Development of Ireland’s Marine Resource (INFOMAR) (https://jetstream.gsi.ie/iwdds/map.jsp, accessed on: 21 September 2020), which provides data offshore, and data collected closer to the beach, using a Personal Watercraft (PWC) in combination with a single beam echosounder. The bathymetric survey was undertaken in Rosscarbery Bay with the PWC and using a Leica RTK-GNSS system, in combination with a SonarM8 single beam echosounder, in September 2020. The depths and position of the antenna are logged every 1 Hz. The bathymetric survey began during high tide, in order to cover a wide range, with transects running perpendicular and along the beachface. The whole area in front of Long Strand was covered to a water depth of 10 m.
Records for tidal elevation were included as well and downloaded from the Marine Institute (http://data.marine.ie/geonetwork/srv/eng/catalog.search#/metadata/ie.marine.data:dataset.2774, accessed on 1 October 2019), using data from their tide gauge network. The closest to the study area is Castletownbere (51°39′05.9″ N, 9°54′37.1″ W). Lastly, MIKE21 is able to simulate the growth, decay, and transformation of wind generated waves and swells, both in offshore and coastal areas. As such, wind data were included in the MIKE 21 SW models. Hourly wind data were downloaded from Met Eireann (https://www.met.ie/climate/available-data/historical-data, accessed on: 2 October 2019) from Sherkin Island (51° 28′ 4.008″ N, 9° 25′ 5.0592″ W), the closest station to Long Strand, Co. Cork, Ireland.
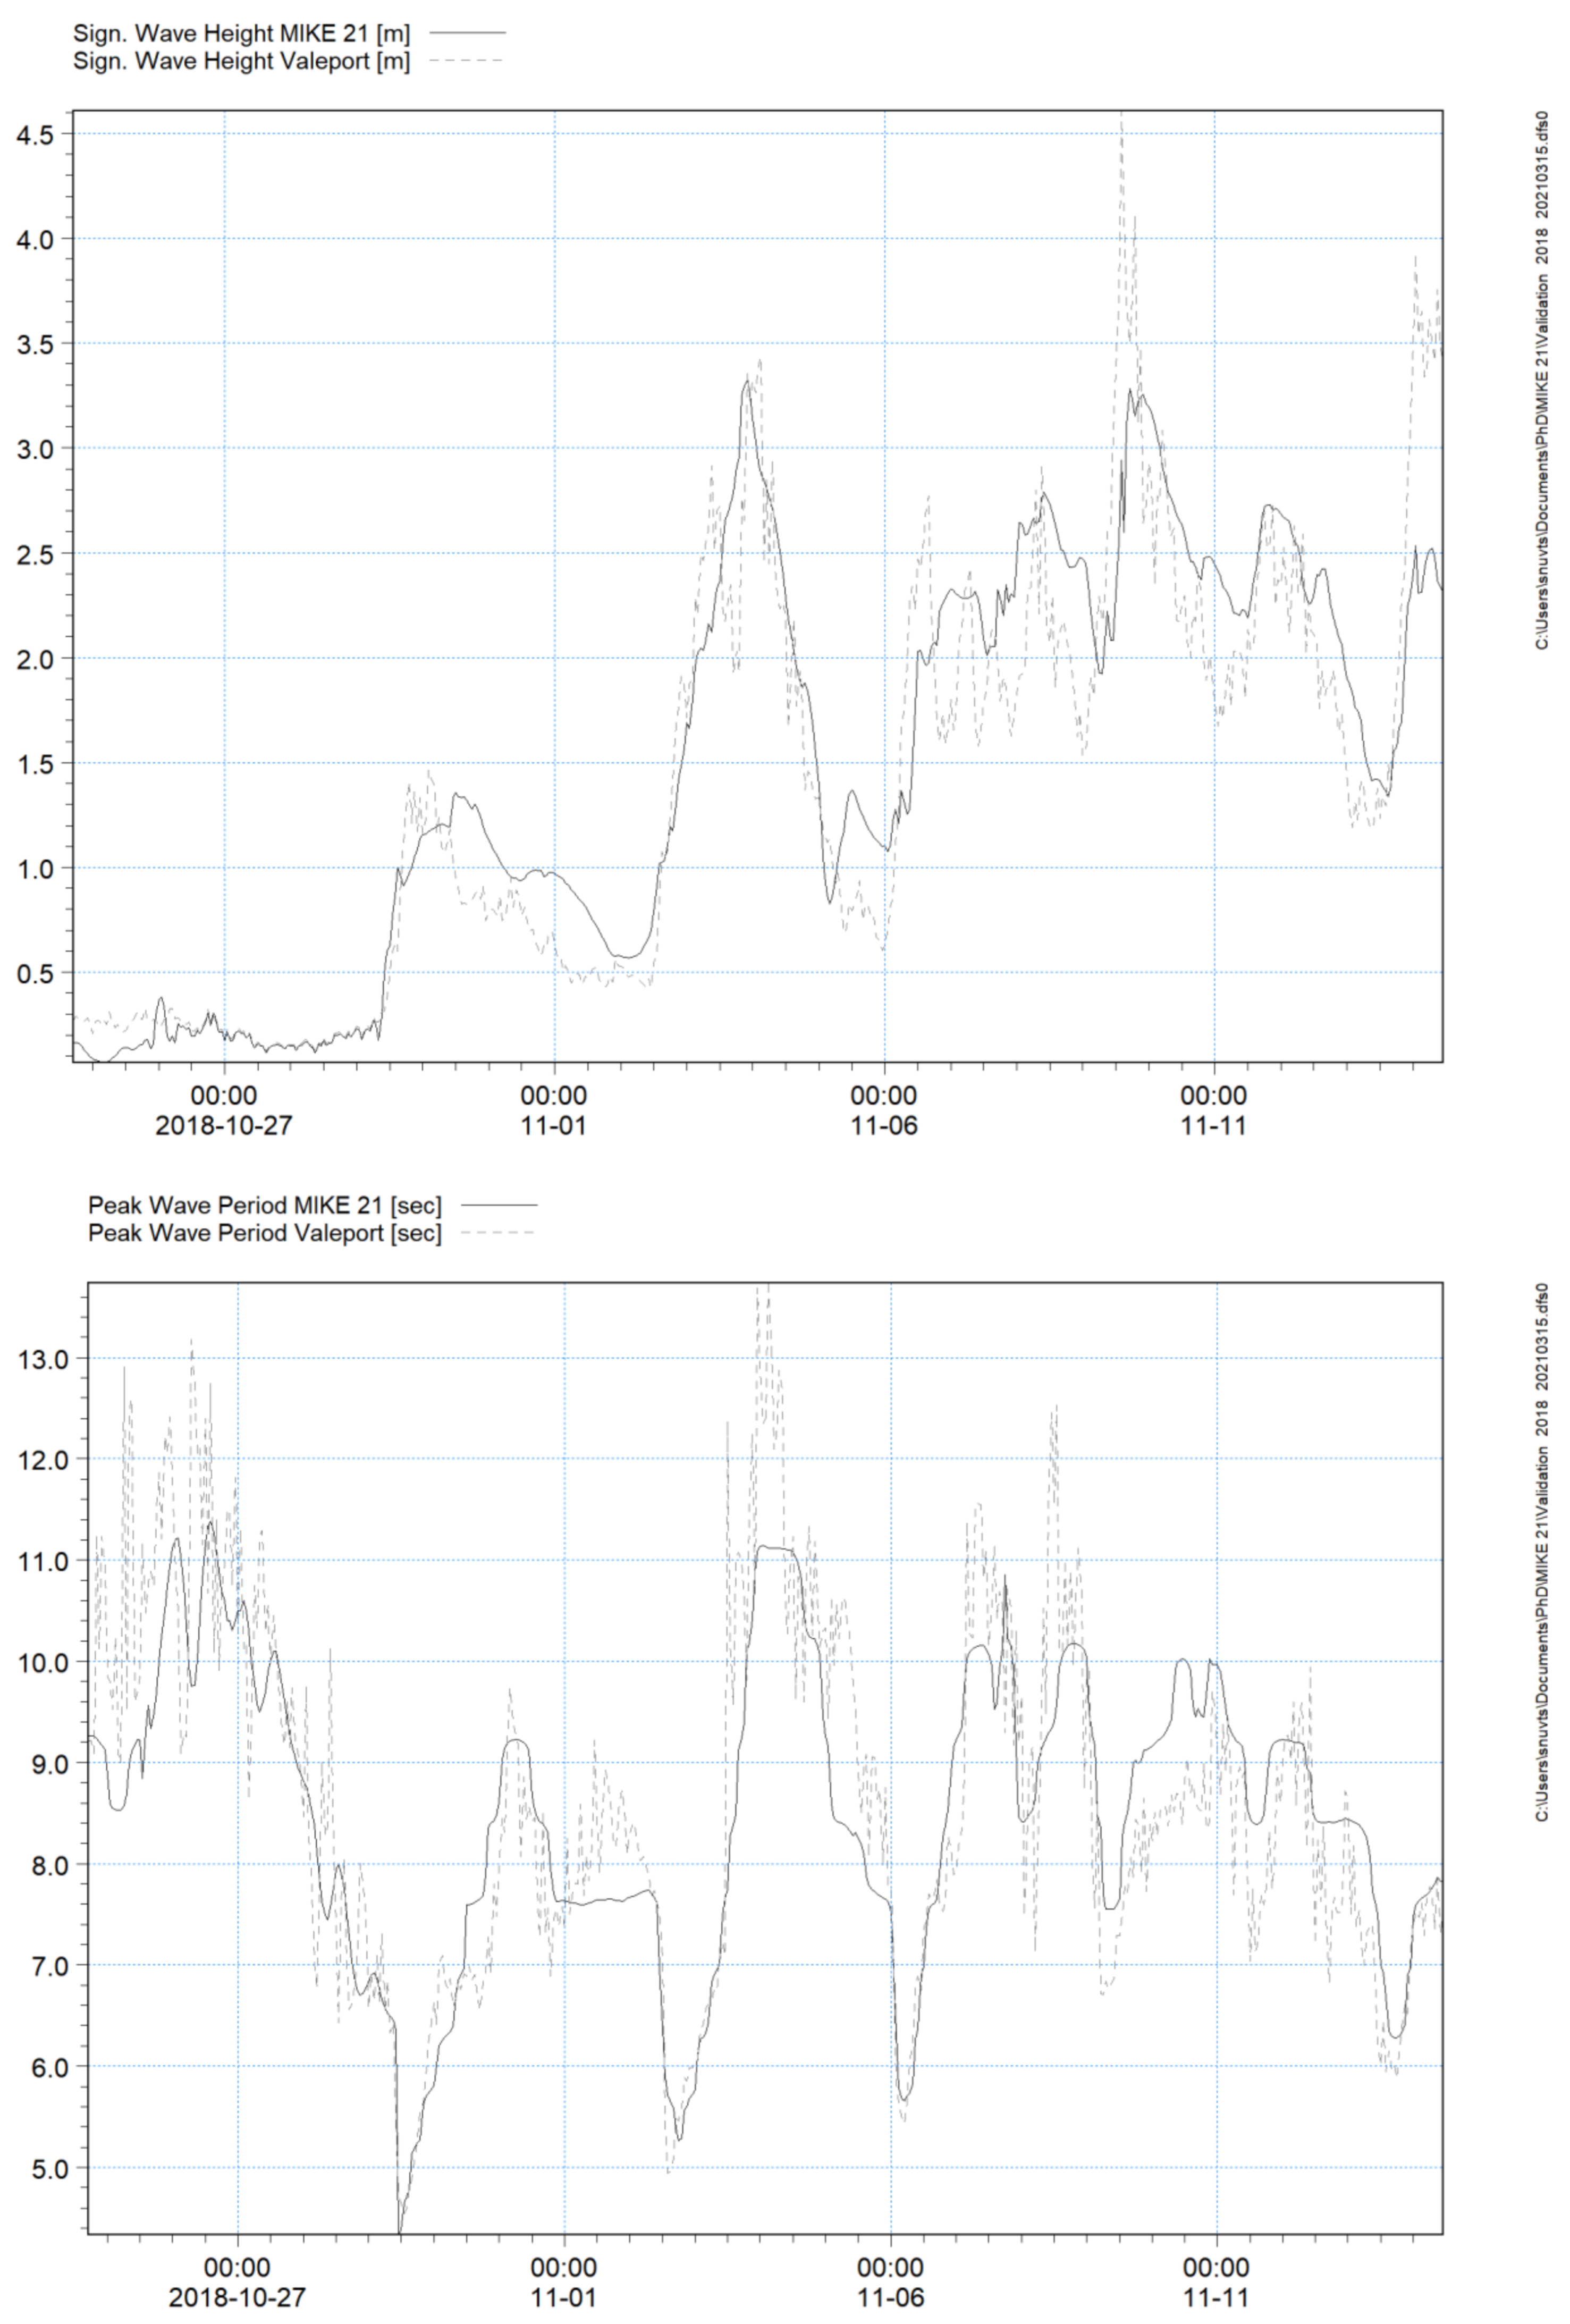
The wave conditions were validated using in situ collected data in October/November 2018. The hydrodynamic data collection consisted of utilising Valeport bottom-mounted pressure sensors. The recording interval details are show in Table 1.
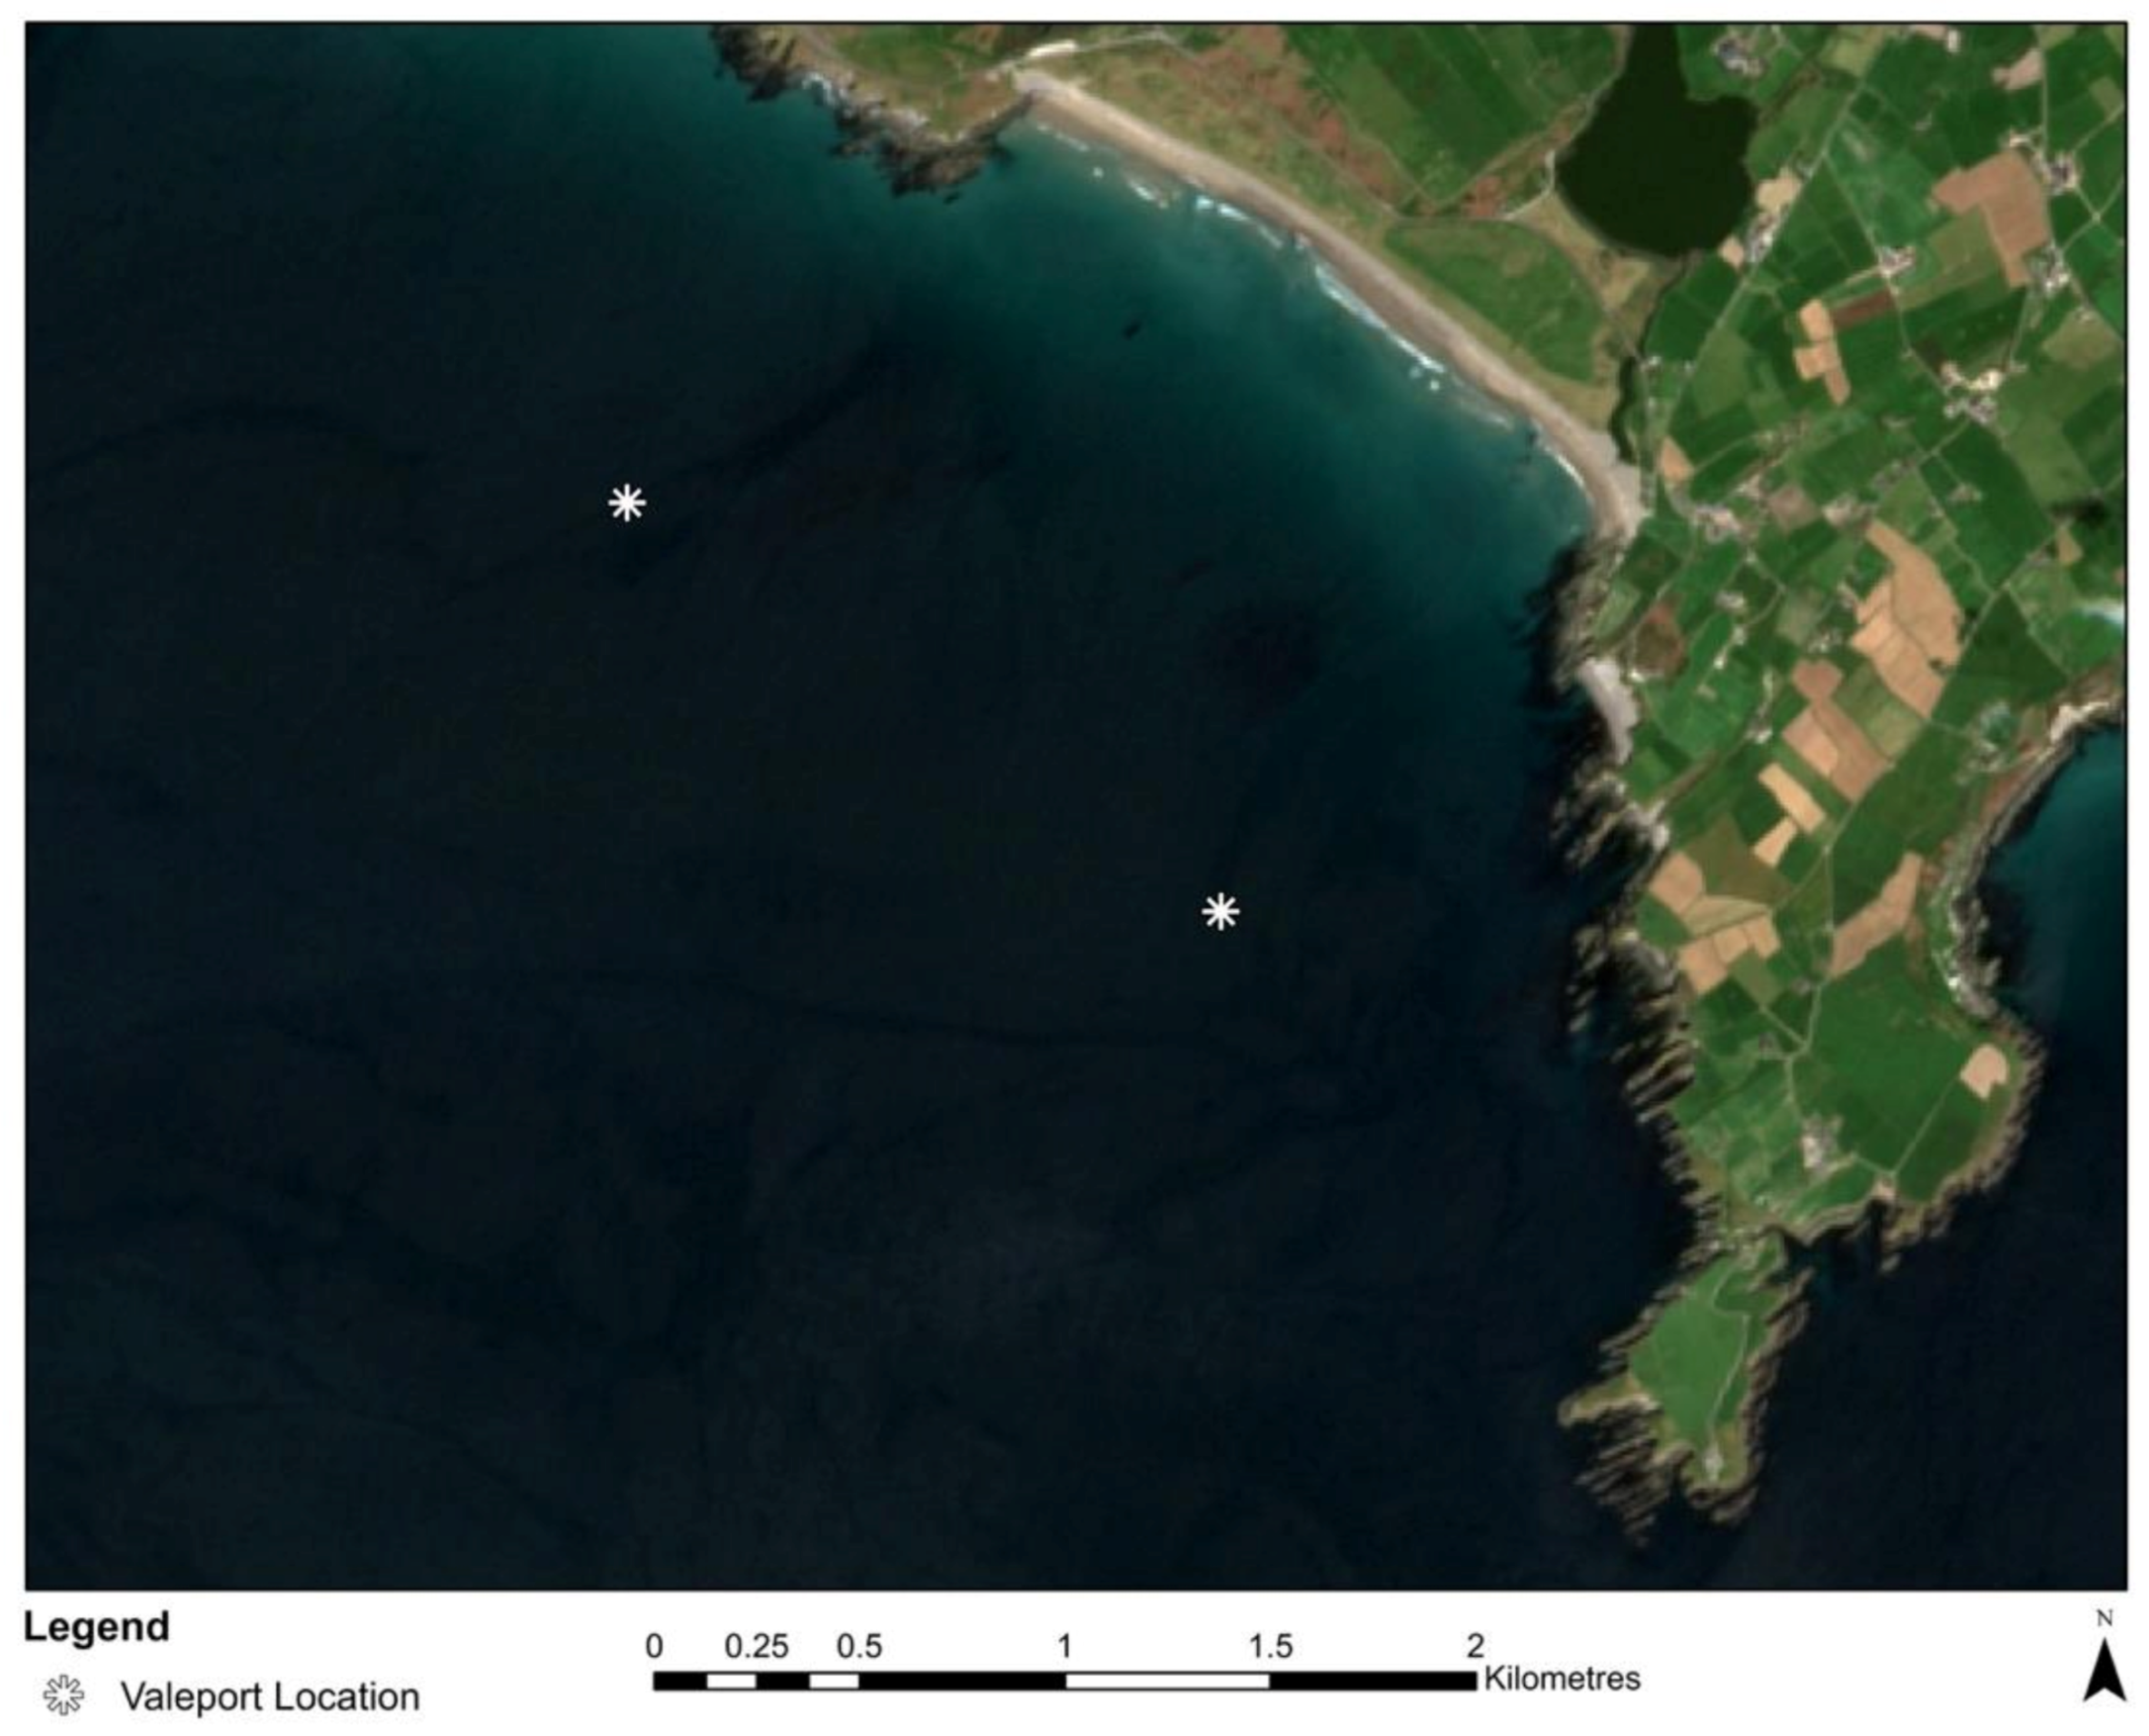
The Valeports were placed offshore in Rosscarbery Bay, approximately at 10 m water depth at a distance of 1 km offshore from the beach in Long Strand and collected data for a 30-day period in October/November 2018, location shown in Figure 5.
The wave height and wave period from MIKE 21, using default settings, were then validated against the Valeport data. The significant wave height shows good correlation between the modelled and the observed data. The peak wave period is not always able to correctly model peaks, but statistical parameters show a good agreement between modelled and observed data, Table 2. Note that only the Valeport in the east successfully recorded data. This datapoint was then the location were nearshore data were extracted from.
The comparison between the values of Hs and Tp simulated by MIKE 21 SW, and Hs and Tp recorded by the Valeport is presented in Figure 6, with the solid line representing modelled data and the dashed line observed data.
Empirical parameterisation of horizontal swash excursion was essential as this data was not collected for the field site. The swash excursion is used, for example, in the self-organisation theory, so a reliable estimation of swash excursion is fundamental to improve the understanding of the beach cusp dynamics. The wave run-up, and therefore the swash excursion, is a key component used to evaluate inundation hazards and vulnerability to storm impacts [35,36,37]. A variety of predictors have been developed for vertical run-up (R) and swash (S) on sandy beaches, e.g., [36,38,39,40,41].
Stockdon et al. [36] is the most commonly used empirical parameterisation of run-up, which is defined as the total swash:
S T o t = S i n 2 + S i g 2
where Sin and Sig are the incident and infragravity components of swash. Stockdon et al. [36] used regression techniques to obtain relationships for Sin and Sig:
S i n = 0.75 β H o L o
S i g = 0.06 H o L o
< η >   = 0.35   t a n β H o L o
T W L = S t o t + < η > +   t i d e s
These parameterisations are widely used in academia, due them having better accuracy than others [42]. As such, they are adopted in this study as well. The horizontal swash excursion, denoted by S, was used for the analysis instead of the vertical swash excursion (Equation (4)). In order to increase the accuracy of the empirical parameters, the foreshore beach slope (tan β) is measured during each survey and is defined as the average slope over a region between ±2σ of the mean water level, where σ is defined as the standard deviation of the continuous water level. The total water level (TWL) (Equation (8)) is expressed by the vertical swash excursion (Stot), the wave setup (<η>), and the tidal elevation (tides) [36,43].
Lastly, both nearshore and breaking wave heights, and directions were estimated from the offshore data. The sediment fall velocity was estimated following the approach of Ferguson and Church [44], and taking a mean grain size of D50 = 0.673 mm. The surf similarity parameter was estimated considering the offshore wave height and the beachface slope. The mean annual surf similarity parameter is ξo= 1.18 ( ξ 0 = t a n β H o / L o 1 / 2 ) and the mean annual dimensionless fall velocity [45] is Ω = 2.06 ( Ω = H b W s T ). These parameters indicate that Long Strand can be classified as a reflective/intermediate beach with predominately plunging breakers (surf-scaling parameter ε = 3.24) ( ε = 0.5 H b σ 2 g t a n 2 β ).

3.3. UAV Survey Method

Nuyts et al. [46] proposed a methodology to investigate a multilevel beach cusp system and link their change with the hydrodynamics in the study area. Their methodology has been adopted for this study as well. It was demonstrated that the multilevel beach cusp system can be analysed using a sub-centimetre Digital Surface Model (DSM) using inexpensive Unmanned Aerial Vehicle (UAV) technology and Structure from Motion (SfM) analysis techniques.
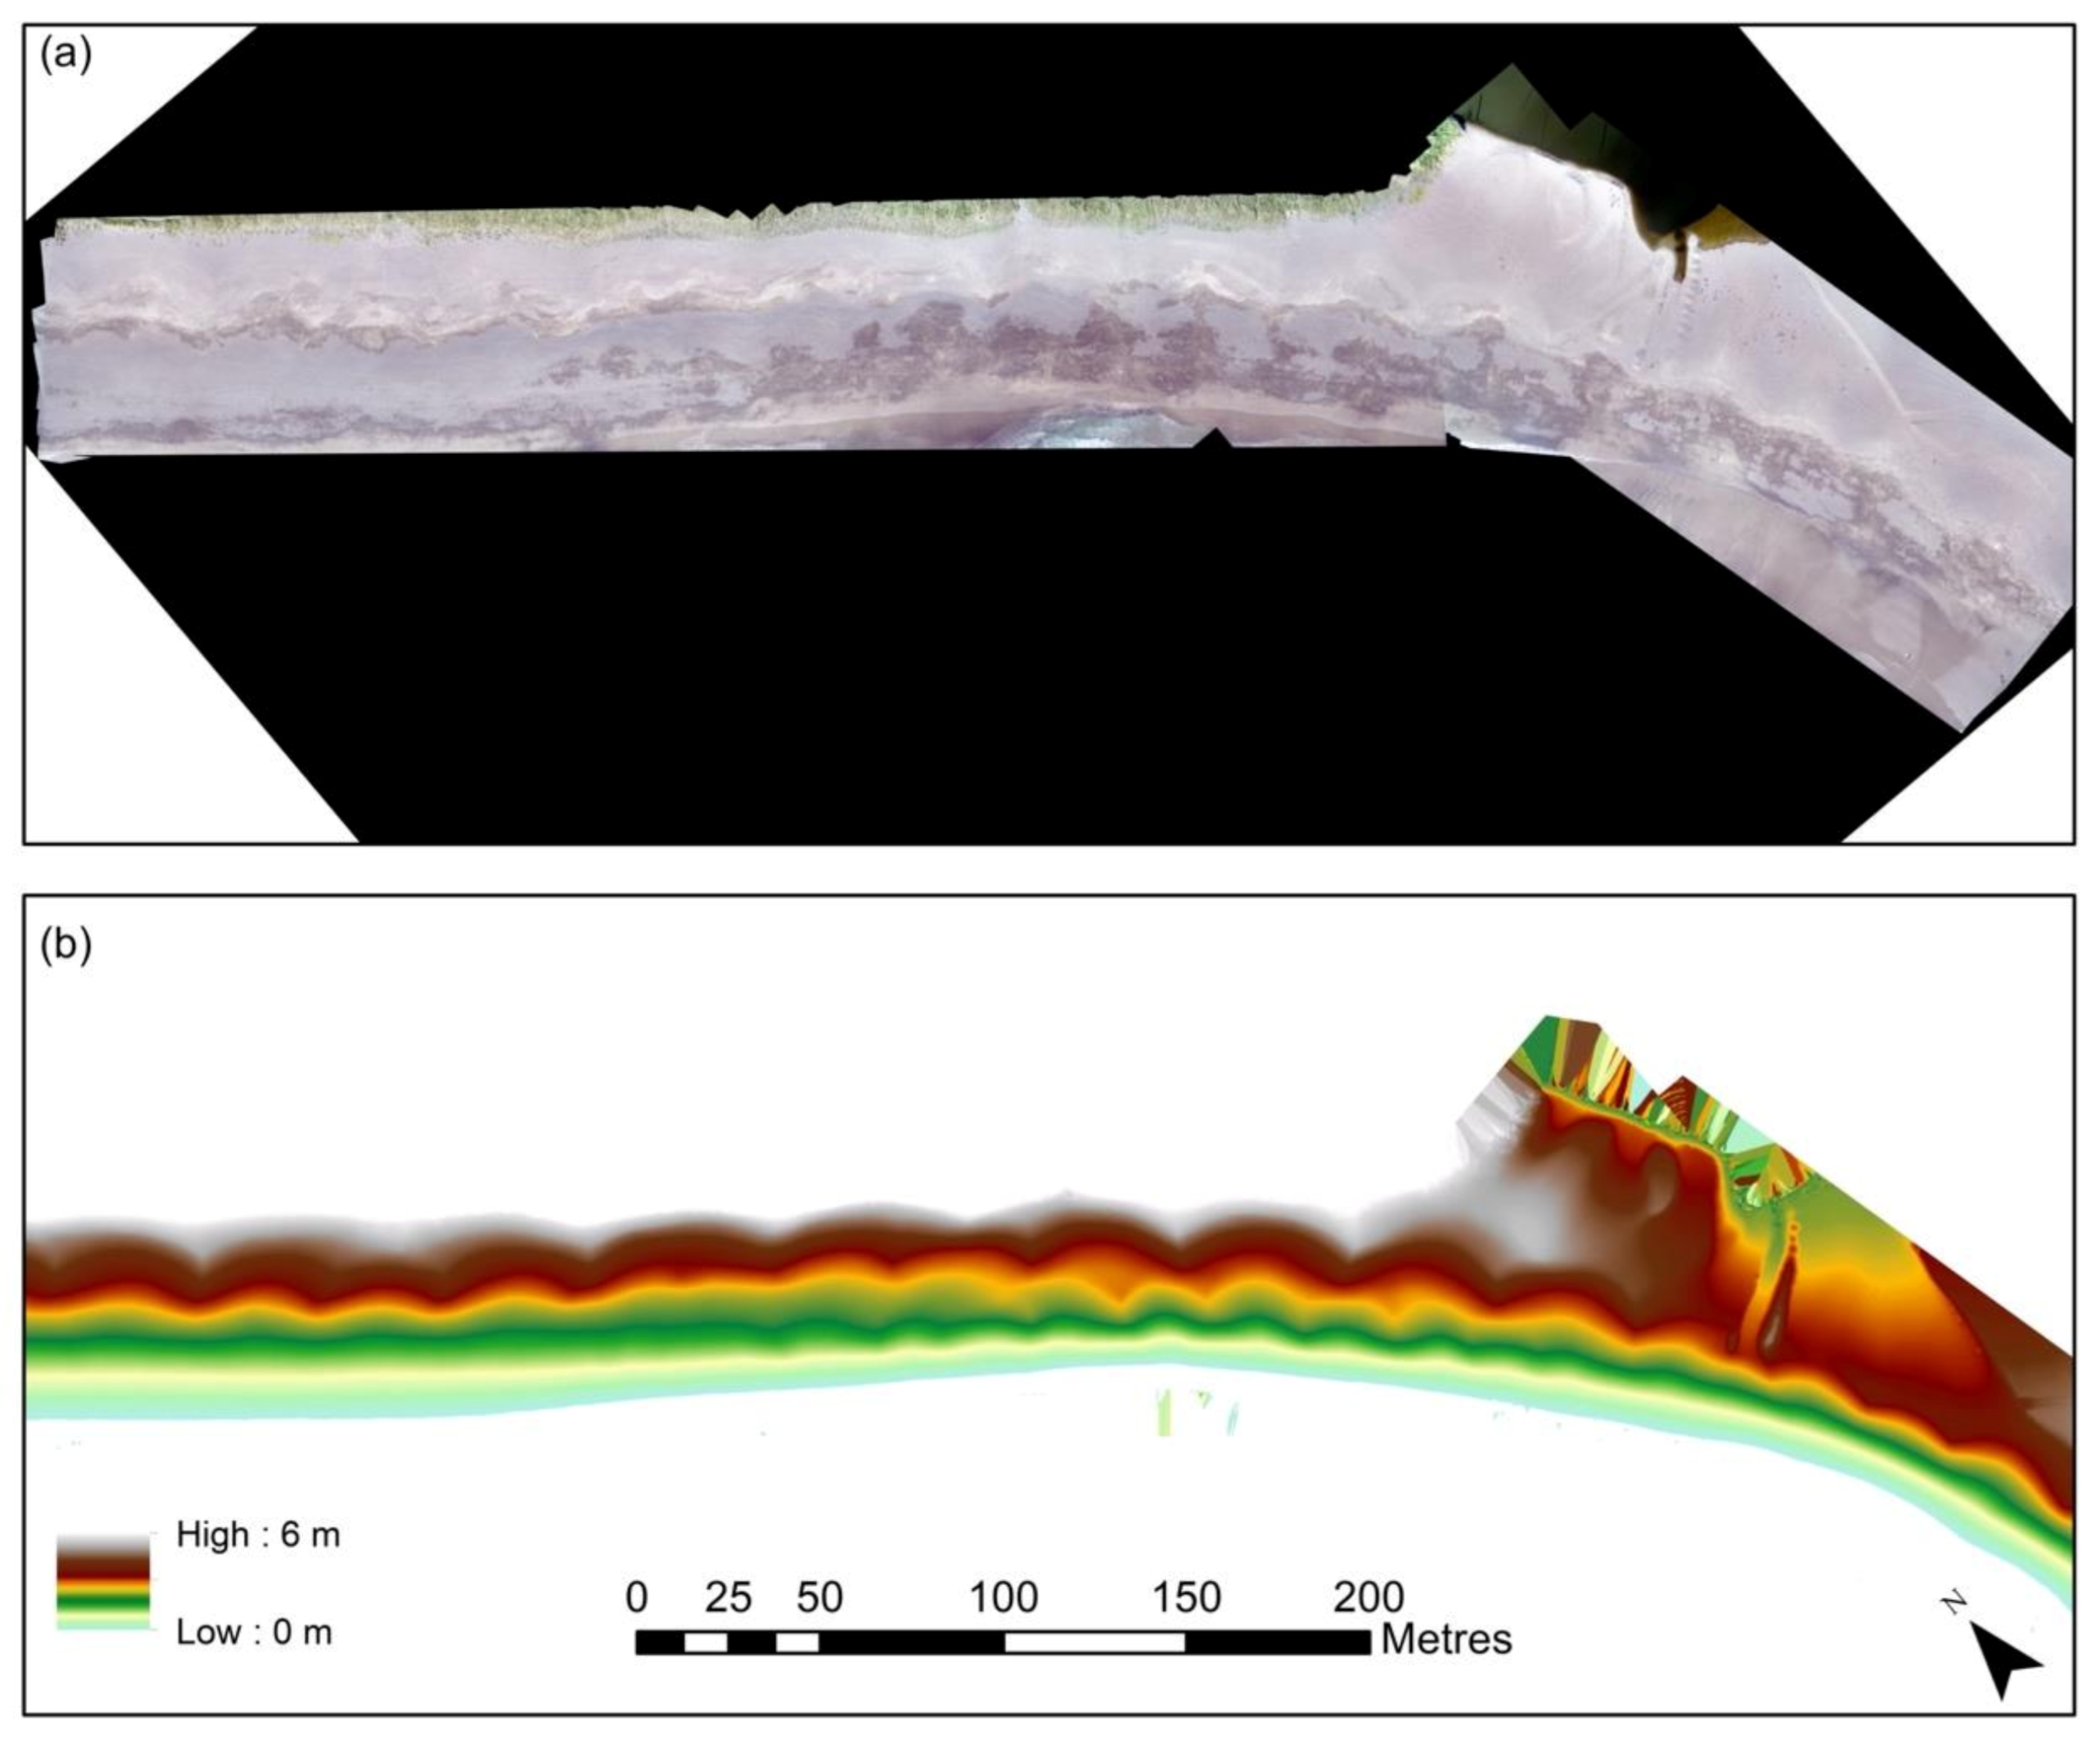
The flight altitude of the UAV was 30 m with a 75% image overlap in the footprint of successive images and parallel transects, resulting in a Ground Sampling Distance (GSD) of 0.84 cm/px. A total area of 600 m × 50 m was surveyed during low tide. A total of 8 Ground Control Points (GCP) were placed along the study area and measured with a RTK-GNSS. In the next step, the pictures (a total of around 1000) and the GCPs were imported in Pix4D (Pix4D 4.5.6) and analysed using the Inverse Distance Weighting (IDW) interpolation method. The first result of the SfM processing includes a point cloud that is derived from matching points in all the images. The point cloud can then be converted into an orthomosaic of images and be used to create a DSM (Figure 7).
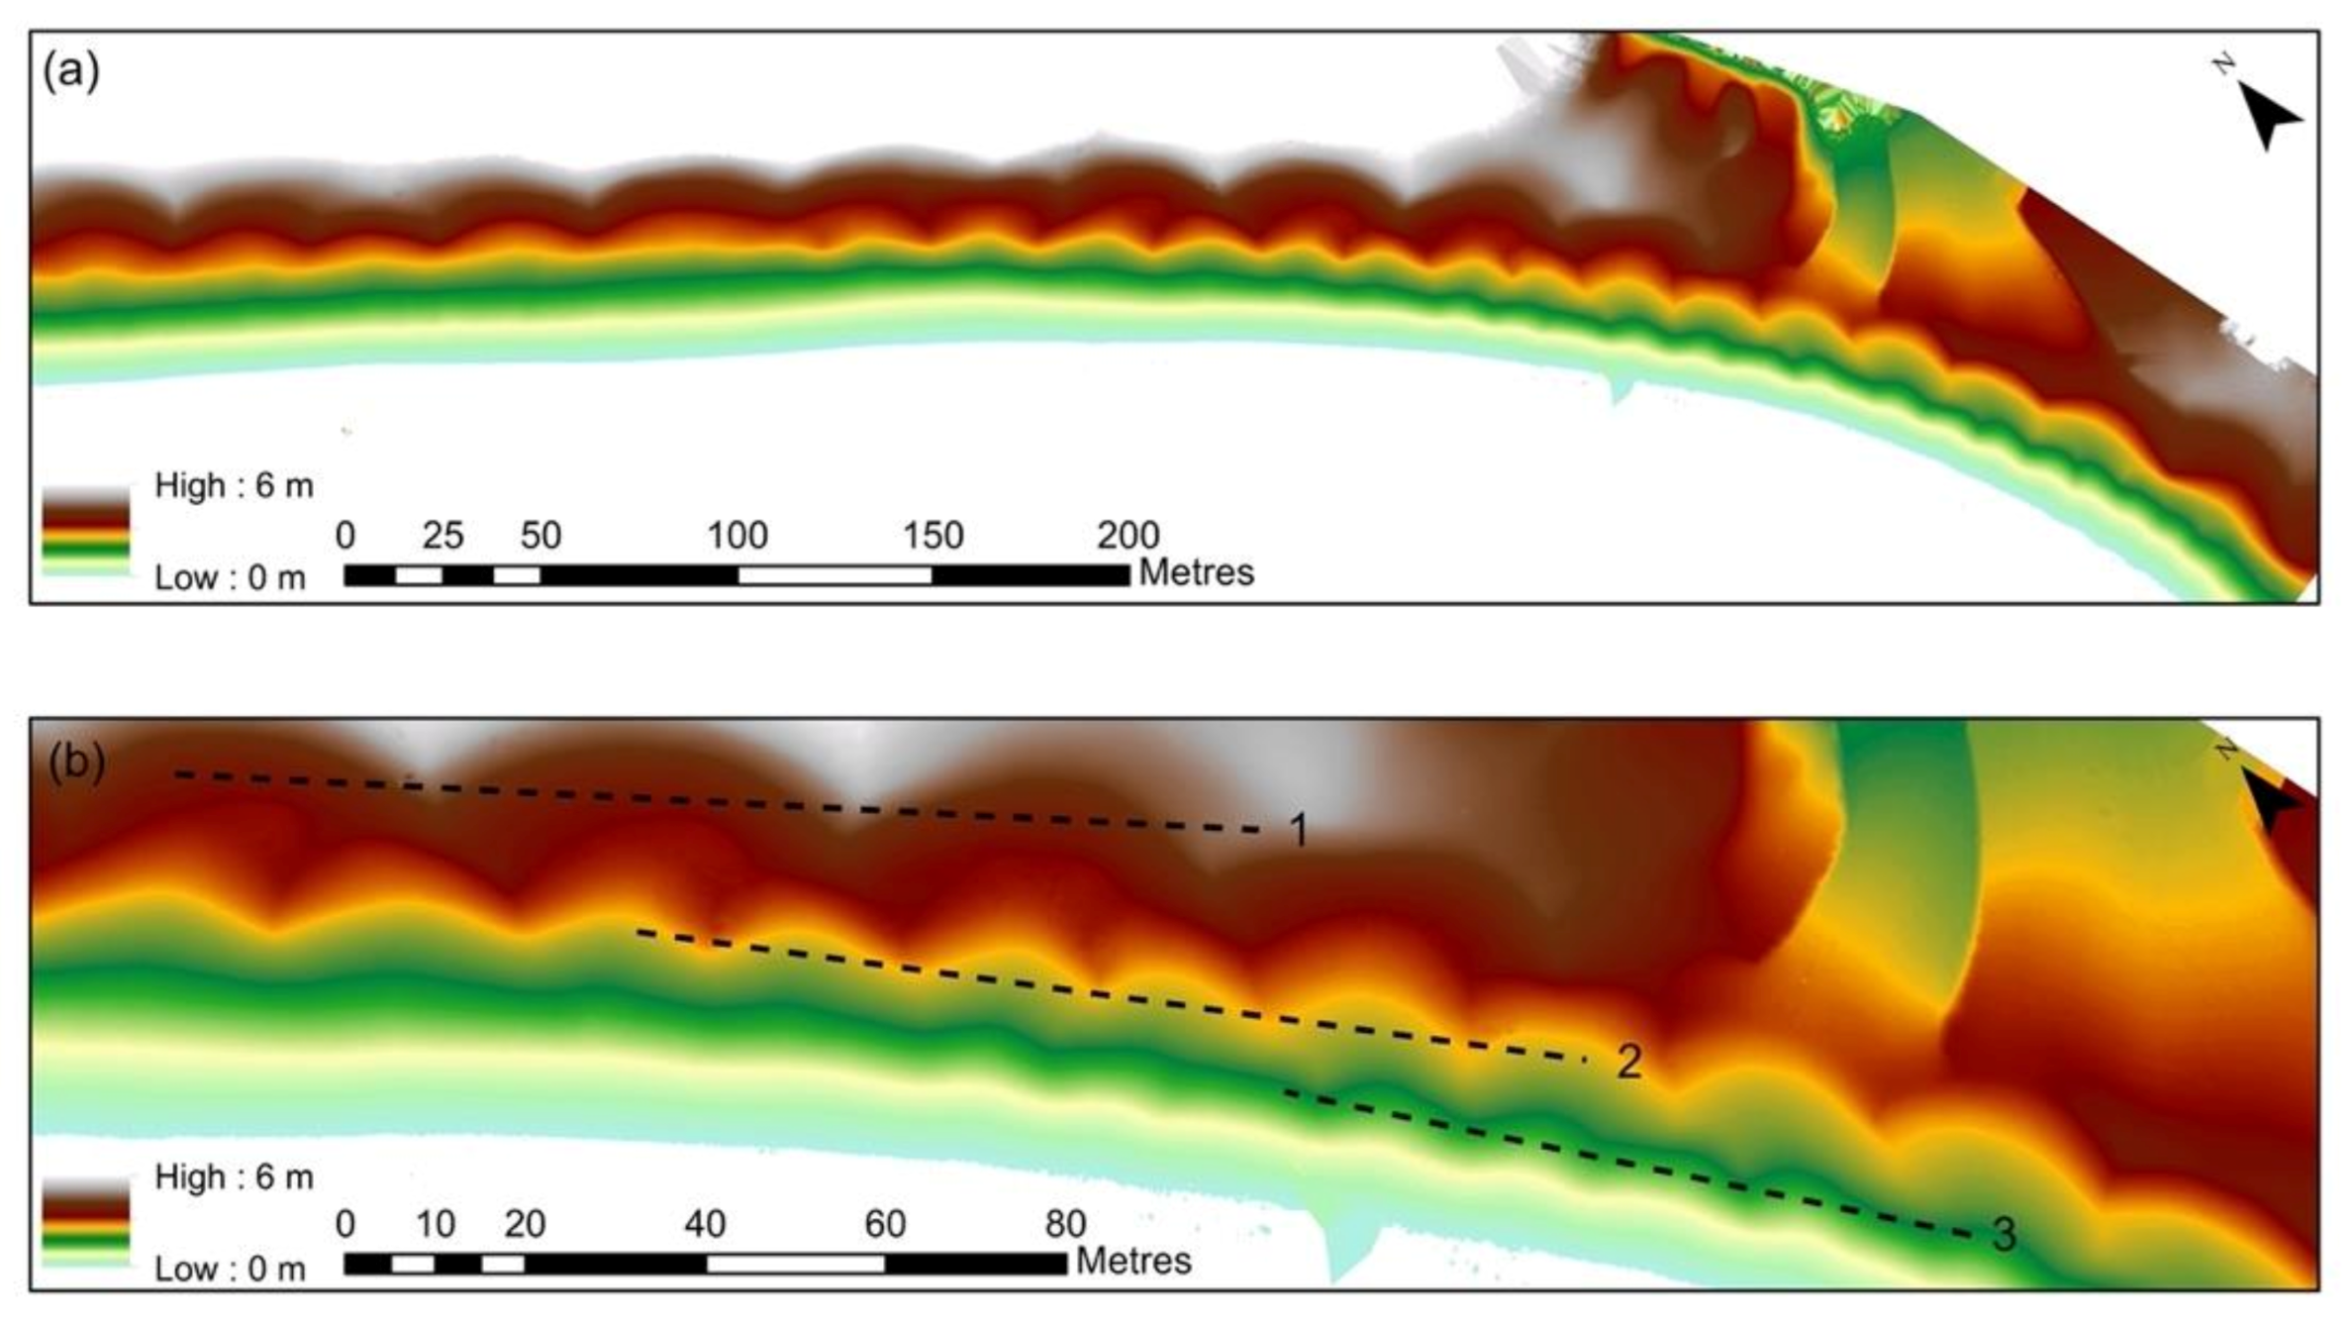
Transects were drawn over the DSMs with 0.2 m spacing, using ArcMap 10.6. The transect with the highest cusp amplitude, during the specific survey, was then selected for further analysis, using in-house developed Python scripts. For each survey, four different parameters (i.e., Cusp spacing, Cusp elevation, Cusp amplitude, Cusp depth) were quantified for three different beach cusps levels (Figure 8); (1) “Upper beach level”, for the cusps located near the dunes (approximately z = 6 m ITM); (2) “Mid beach level”, for cusps located between 2.5 < z < 3.5 m ITM; and (3) “Lower beach level”, for the cusps located near the water level (ranging between 1 < z < 2.5 m ITM). A total of 23 surveys were carried out over a period of 6 months (March–September 2019).

4. Results

4.1. Hydrodynamics

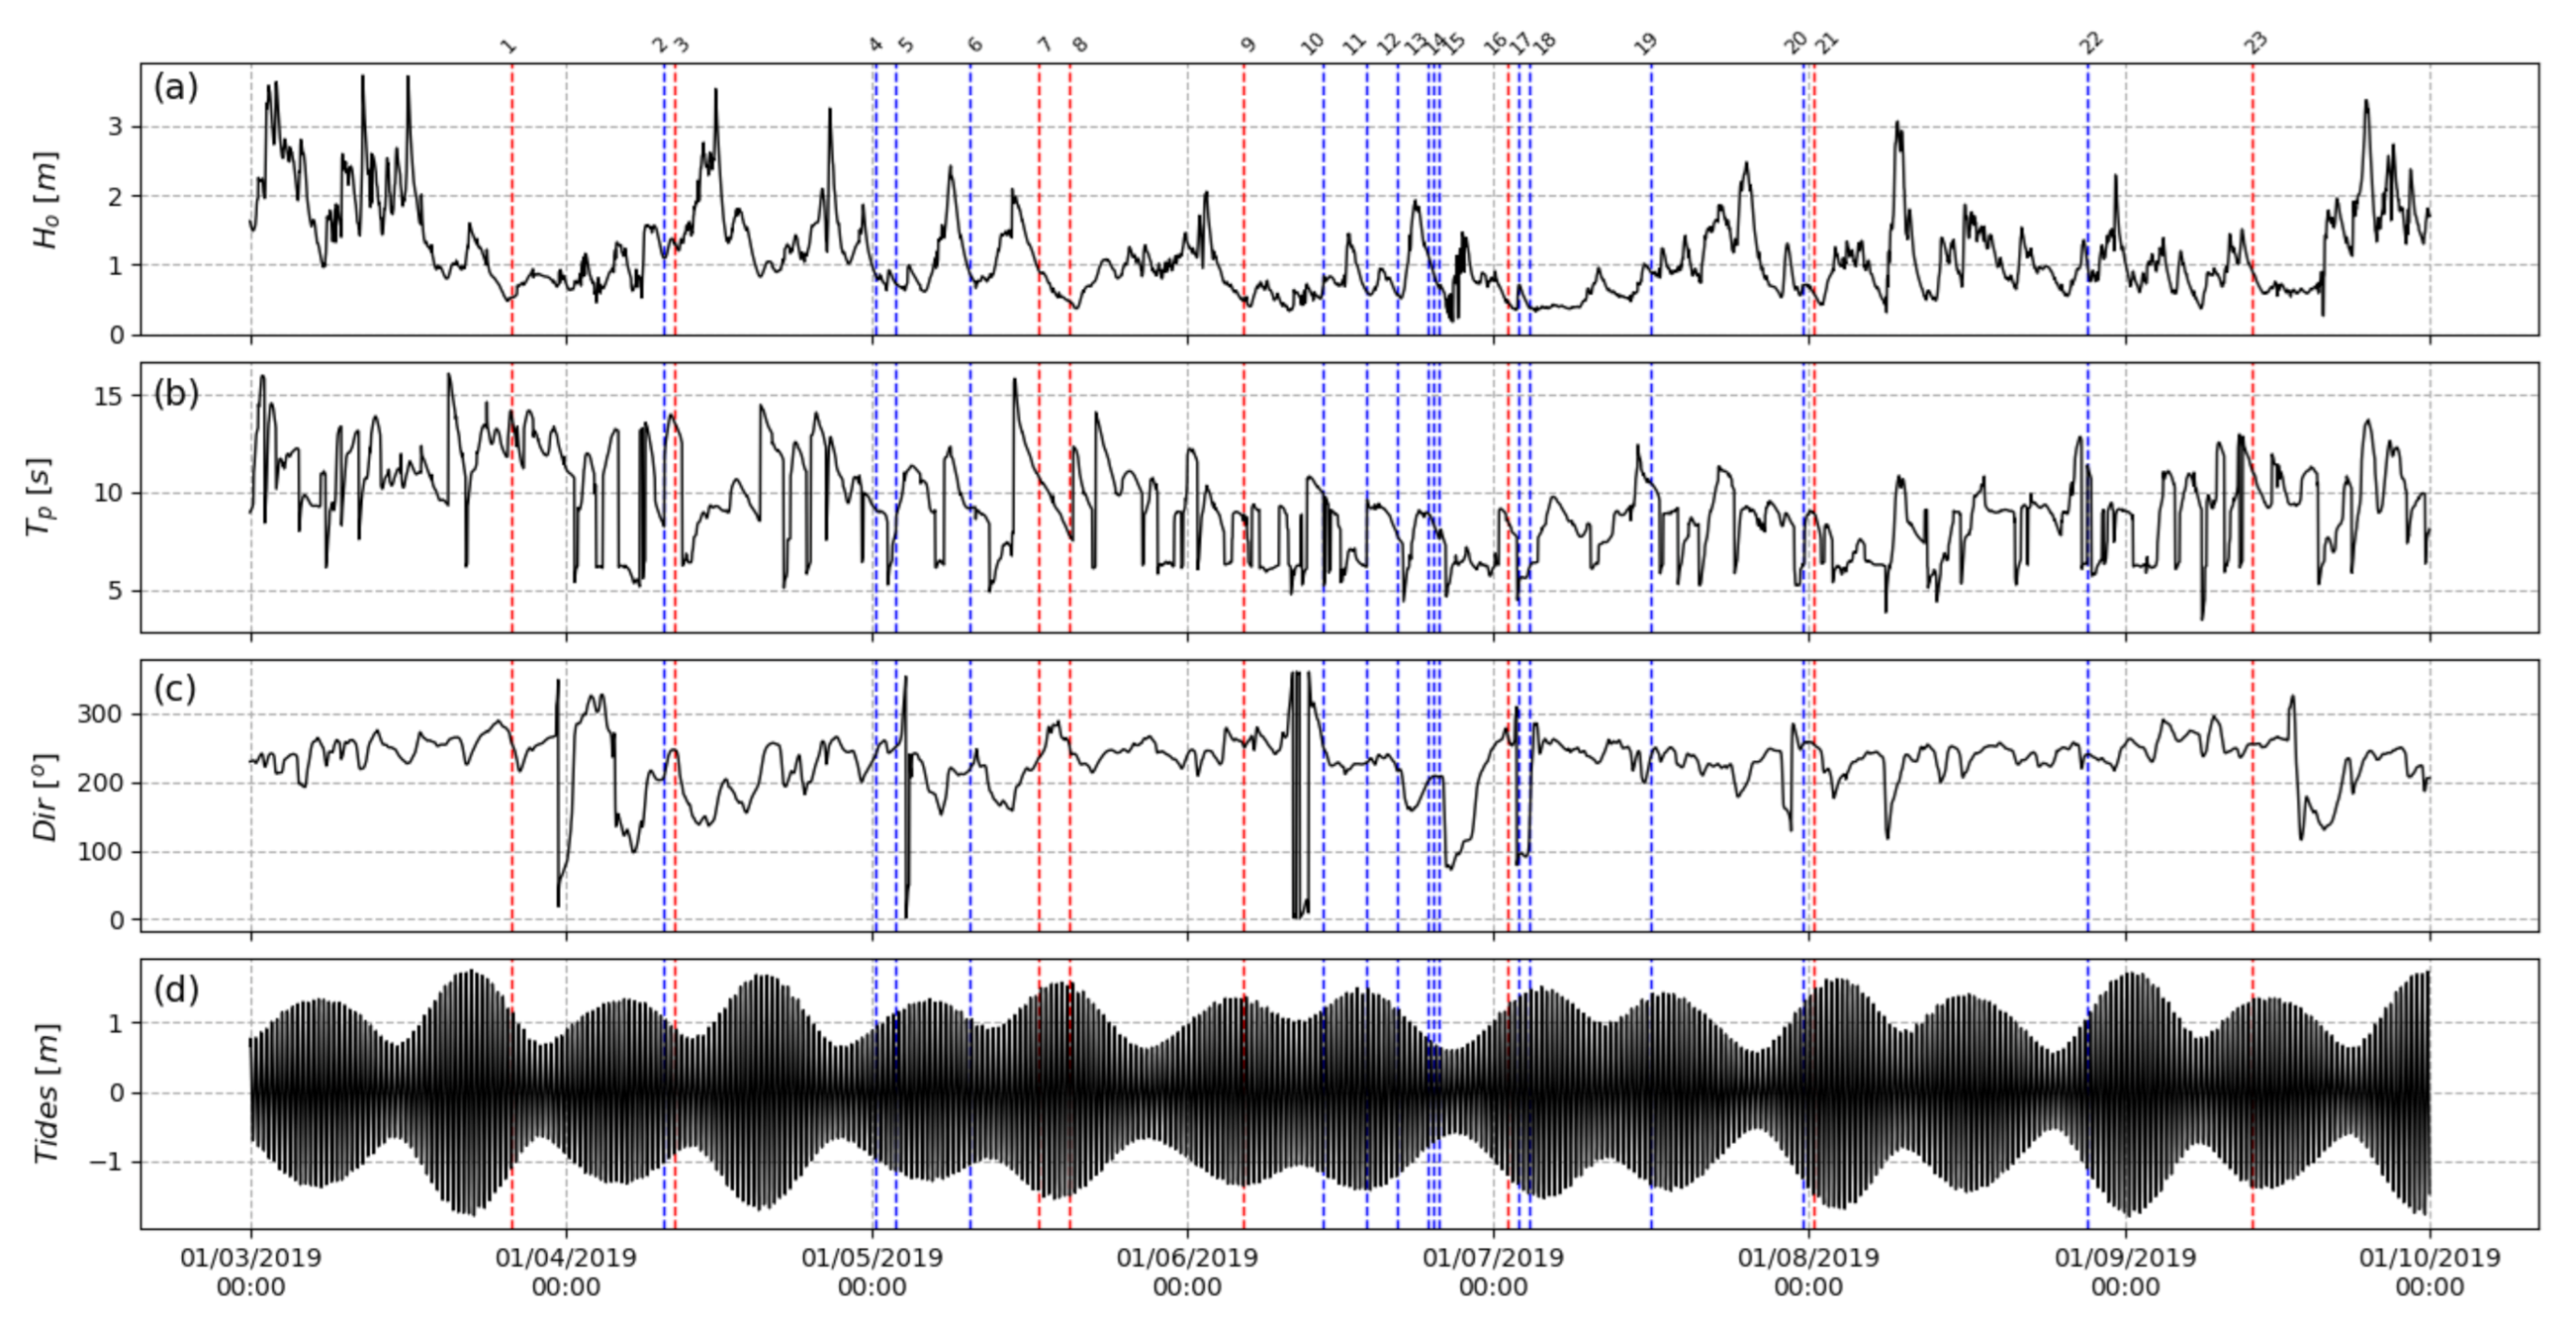
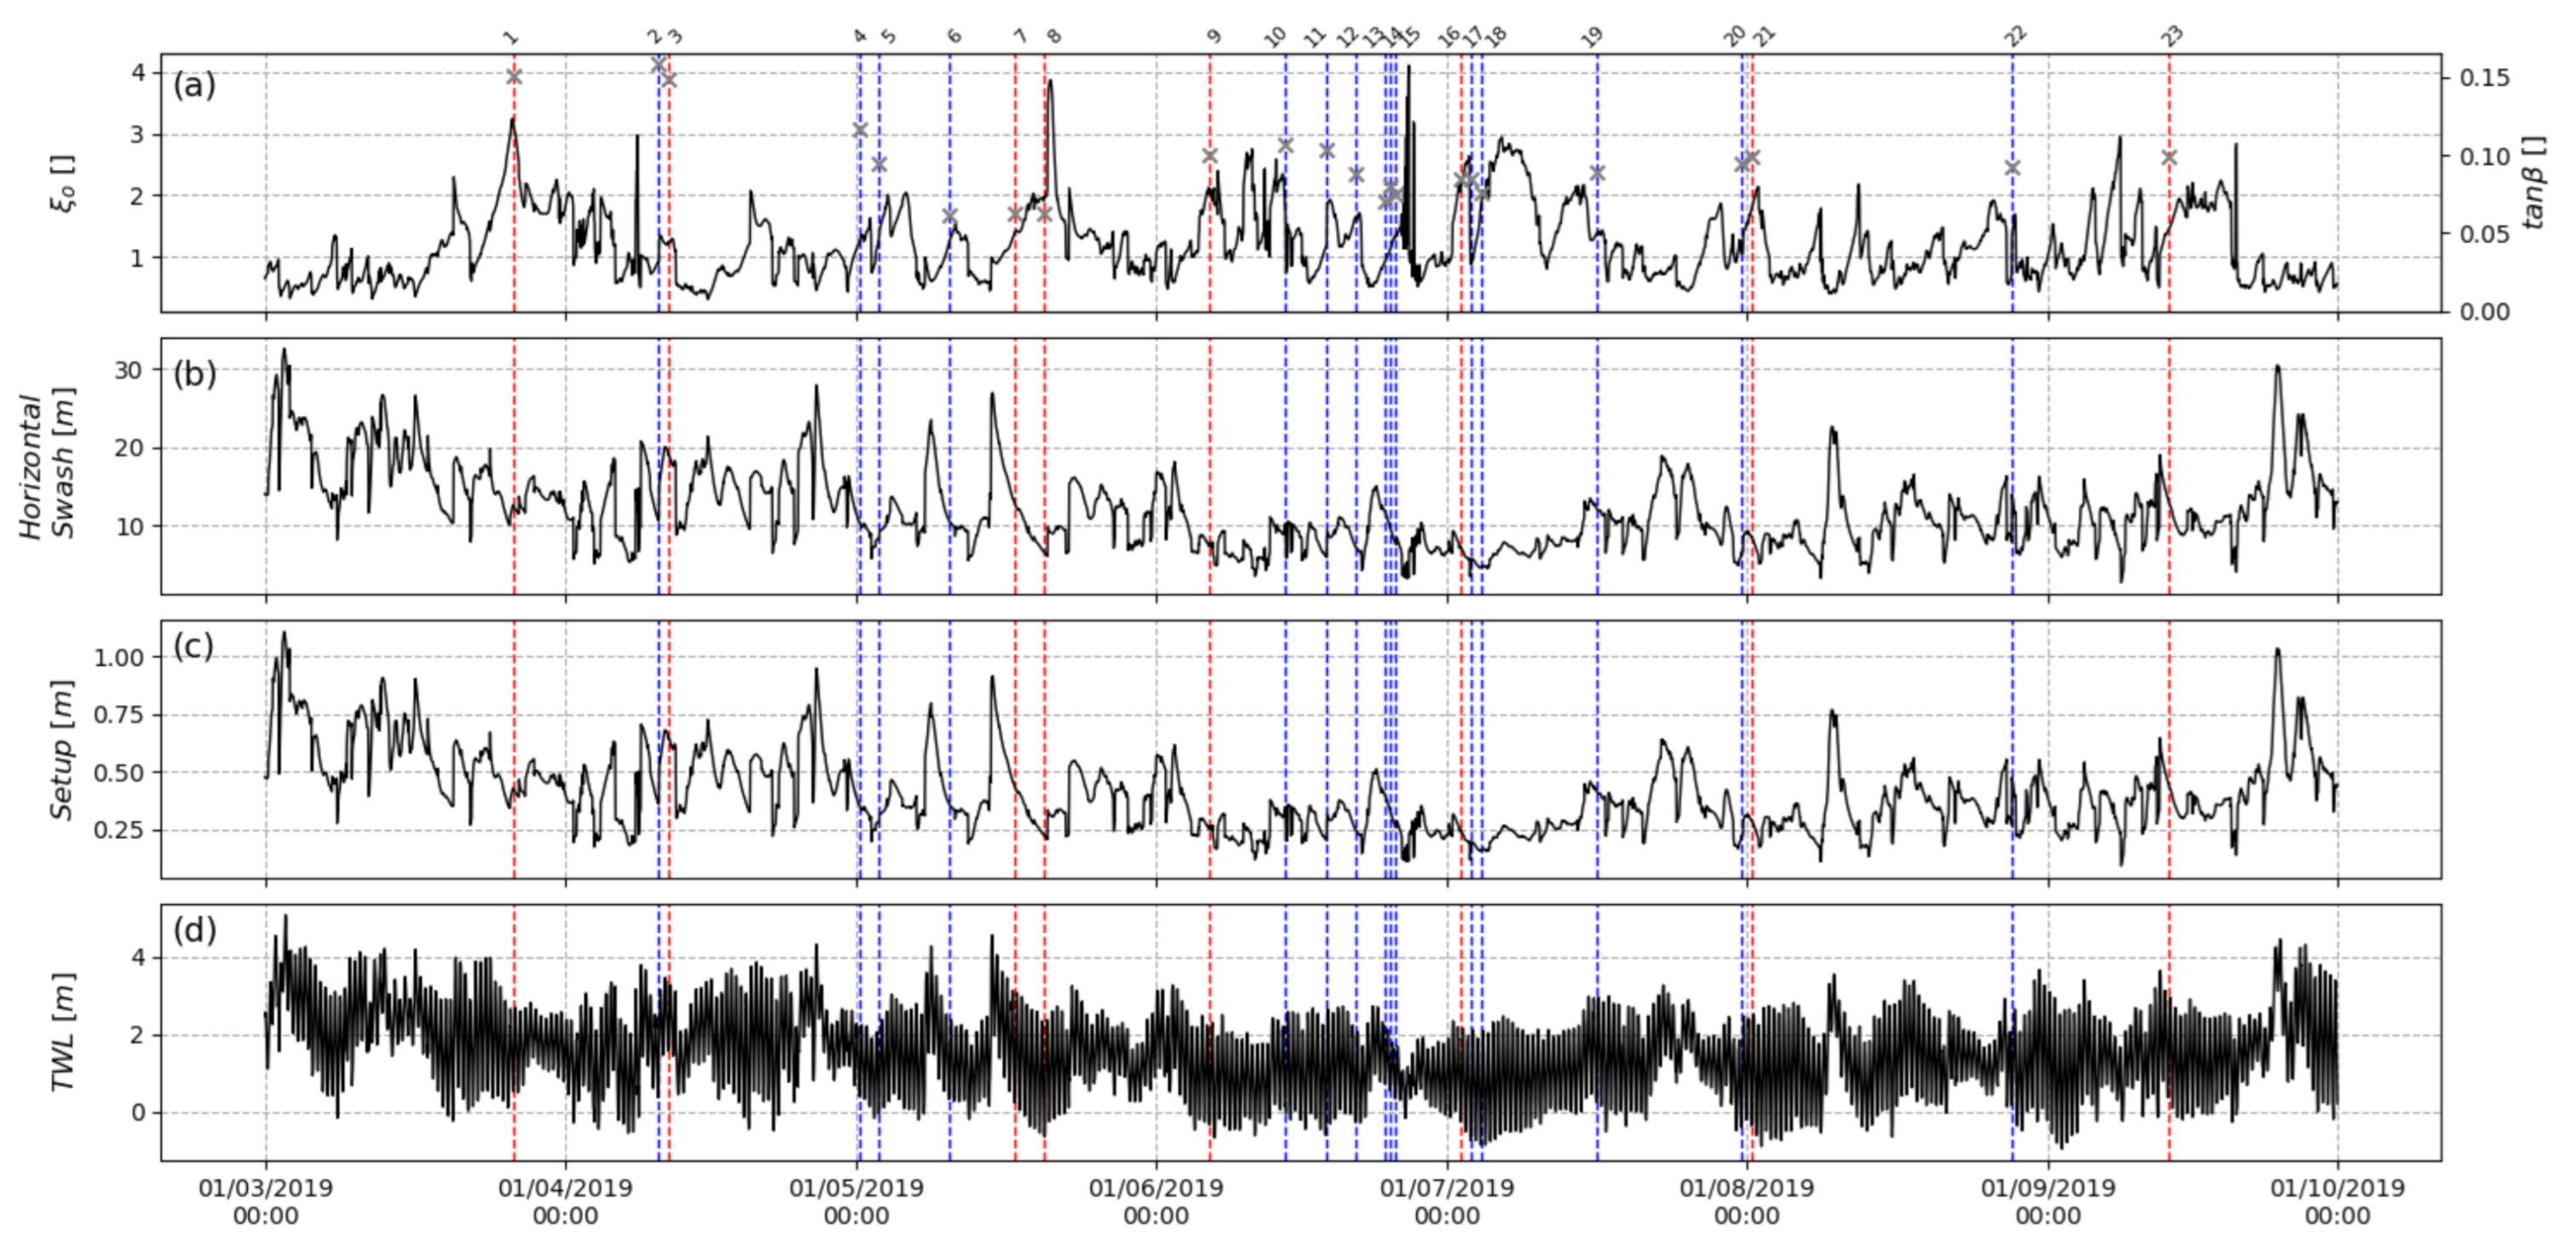
The monitoring period covered the spring and summer of 2019 (26 March 2019 to 13 September 2019), during which the mean offshore significant wave height was Ho,mean = 1.12 m, the average offshore peak period Tp,mean = 9.31 s, and the mean direction Dirmean = 227°. Figure 9 shows the time series for the different wave conditions considered in the study. Figure 10 highlights the Iribarren number, with the beach slope during the survey, the horizontal swash excursion, the wave setup, and the total water level.

4.2. Cusp Parameters

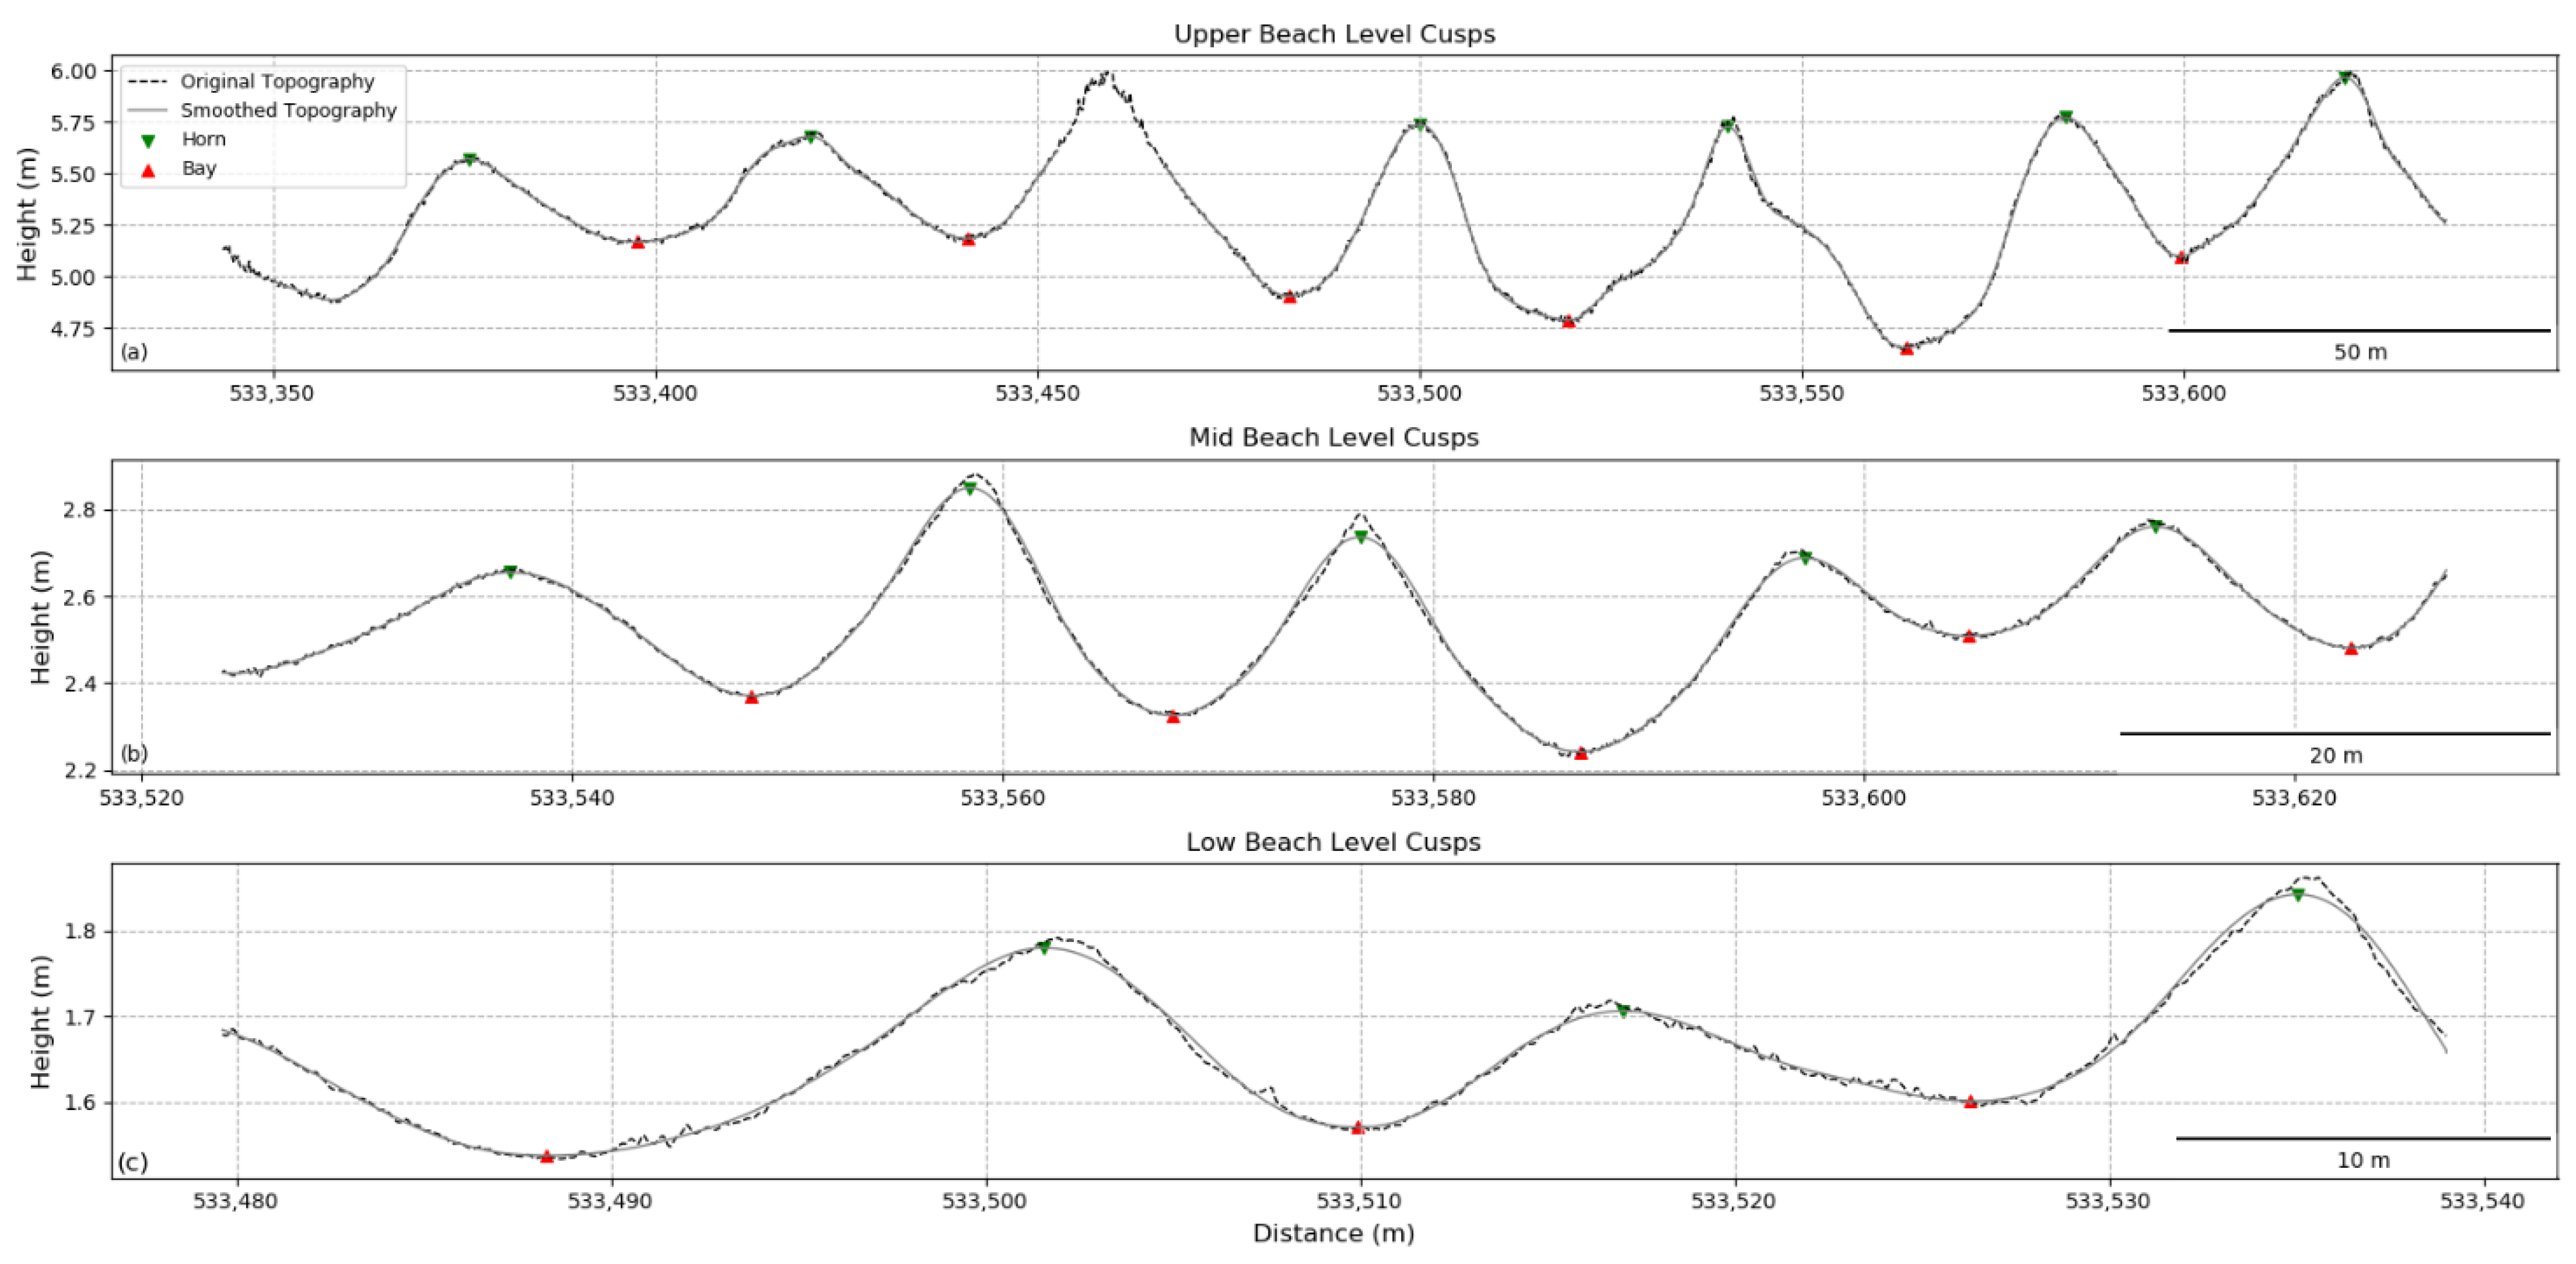
The resulting DSMs from the UAV surveys show the presence of a multilevel beach cusp system in Long Strand. The selected transect (Figure 8) is then used for further analysis in Python (Figure 11).
Three different levels of beach cusps are visible during most of the surveys (blue vertical lines in Figure 9). From Table 3, it is clear that the Mid beach level cusps and the Upper beach level cusps are always present, but that the Lower beach level cusps are not always visible during some of the surveys, due to the wave conditions at the time of the survey. It is important to note that the regular cusp geometry, commonly described in the literature as a simplified scheme (Figure 1), is not always observed in the field. The tip of the horns of the beach cusps are for example not always at the same elevation, nor located along the same straight line. In addition, the horns are not necessarily parallel to one another and the different cusps are not always symmetric.
Table 4 shows the mean of the Cusp Spacing for each of the cusp levels, as well as the Standard Deviation (StD) and the Coefficient of Variation (CV), highlighting that the simplified scheme in the literature is not always observed in the field.

4.3. Beach Cusp Predictions

4.3.1. Lower Beach Level Cusps

The beach cusps appearing on the low beach level were characterised by the smallest dimensions compared to the mid beach level and upper beach level cusps, with λc,mean = 11.09 m; λc,min = 6.5 m; and λc,max = 16.7 m. They are the most dynamic and changing with every tide. As such, their formation and evolution can be linked to the hydrodynamics of the previous high tide. On 15 different surveys, beach cusp formation episodes were observed on the lower beachface. The observed cusp parameters were analysed and compared to those predicted by the edge-wave and self-organisation theories, as well as according to [24], corresponding to Equations (1)–(3), respectively.
Among the three tested formulations, the values predicted using the self-organisation theory showed the best agreement with the observations (Root Mean Square Error (RMSE) = 4.71 m; regression coefficient r2 = 0.642), with the coefficient f = 1.6, as proposed by Werner and Fink [22]. The predictive capacity of the edge wave theory had a similar RMSE (RMSE = 4.79 m). However, the regression coefficient was unsatisfactory (r2 = 0.087). The Sunamura [24] equation resulted in a clear overestimation of the observed cusp spacing but with fairly good agreement (RMSE = 10.59 m; regression coefficient r2 = 0.47), when taking into account A = 1.35, as proposed by Sunamura [24].
After adapting a coefficient f value of f = 1.1628, the predictive capacity of the self-organisation theory had a lower RMSE (RMSE = 2.03 m). The Sunamura [24] equation showed comparable results after reducing the constant A to A = 0.7032 (RMSE = 2.37 m). After linear regression fitting, the edge-wave theory resulted in the poorest representation (RMSE = 4.78 m), Table 5.
Due to the dynamic nature of the low beach level cusps, it is possible to look into trends linking the hydrodynamics and the beach cusp evolution. Figure 10 shows that beach cusps occur on the lower beach level when the surf-similarity parameter: ξo <1.55. The wave setup and the TWL seem to have less impact on the evolution and formation of the lower beach level cusps.

4.3.2. Mid Beach Level Cusps

The mean spacing of the Mid beach level cusps λc,mean = 18.17 m; λc,min = 11.1 m; and λc,max = 38.5 m, located at 2.5 m < z < 3.5 m (ITM). The mid beach level cusps are less dynamic than the low beach level cusps. The low beach level cusps change every tide, whereas the mid beach level cusps change when the horizontal swash excursion is significantly high to affect them. As such, it is important to note that the cusp parameters recorded for the mid beach level cusps are only a snapshot of a situation that might have occurred previously to the survey. It is therefore nearly impossible to analyse their cusp parameters and link them with the hydrodynamics on the day of the survey.
Nevertheless, considering the relationship between Equation (2) and the observed spacing for the low beach level cusps (p < 0.05), the hydrodynamics responsible for the cusp parameters of the mid beach level cusps, can be obtained. Indeed, using the cusp spacing prediction from the self-organisation theory provides the opportunity to link the observed spacing with the hydrodynamics most likely responsible for this parameter. Table 6 gives an overview of the resulting cusp spacings.
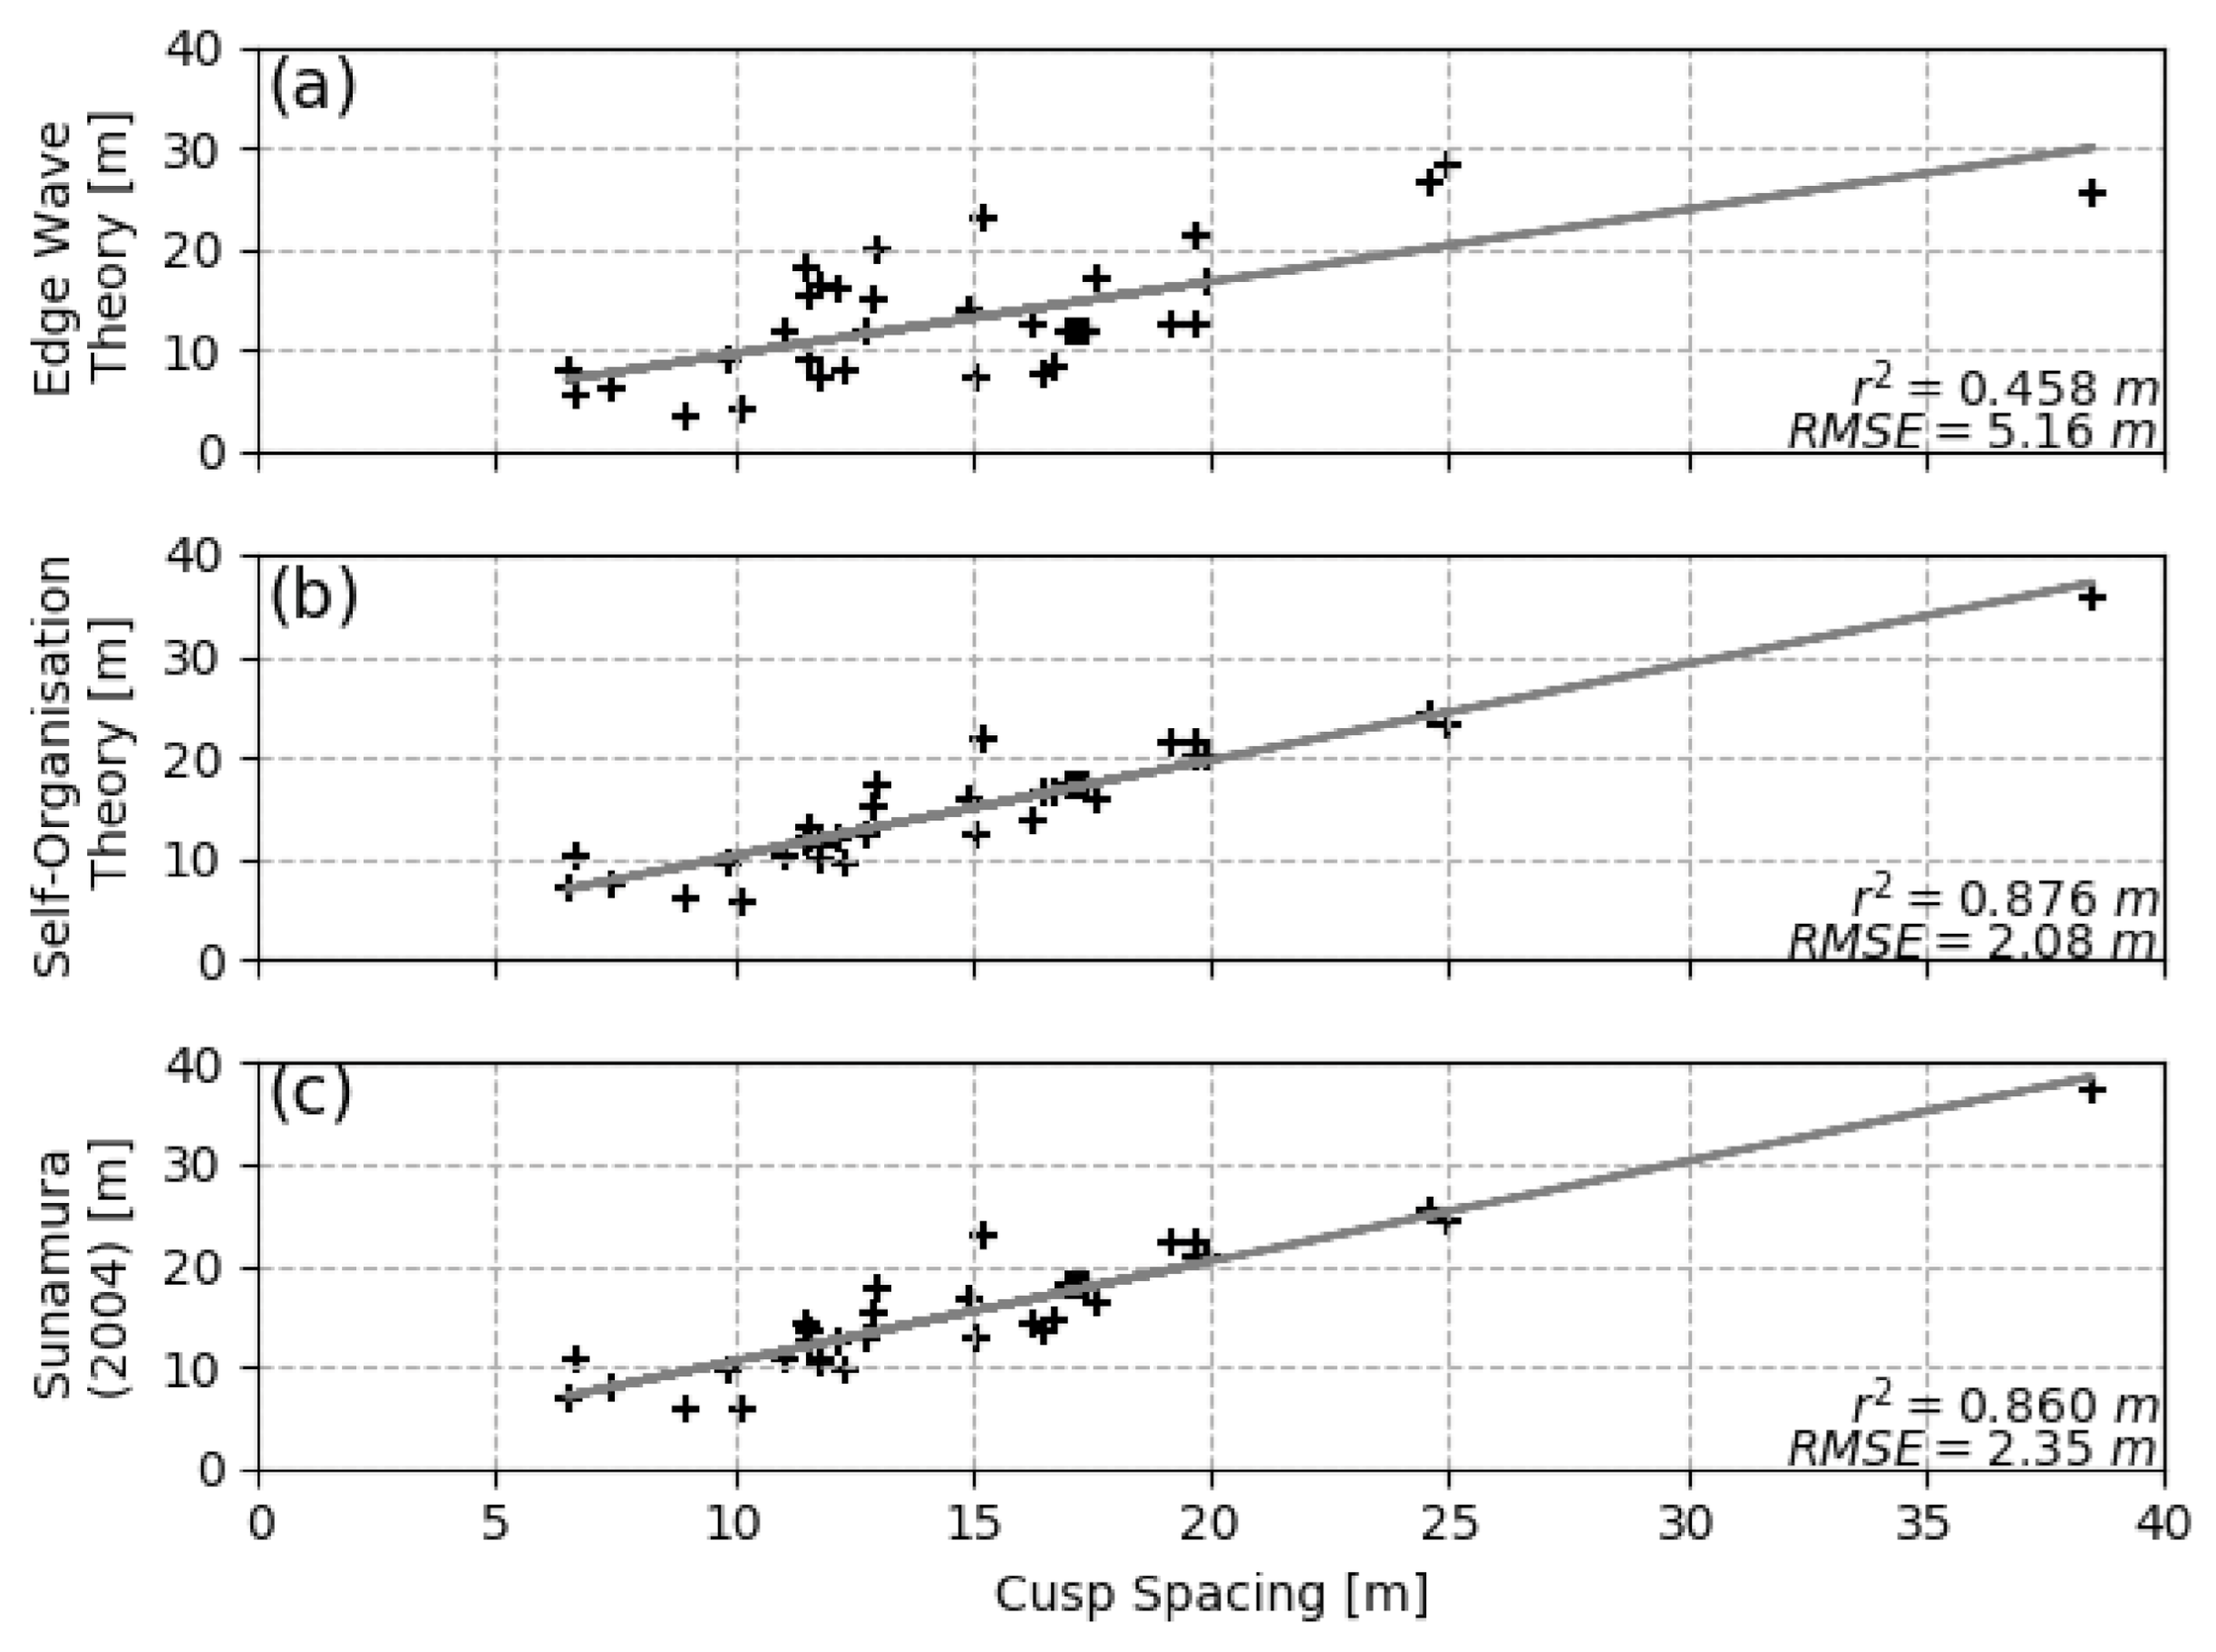
When this data is added to the different predictive formulations, the self-organisation theory still provides the best agreement (Figure 12).

4.3.3. Upper Beach Level Cusps

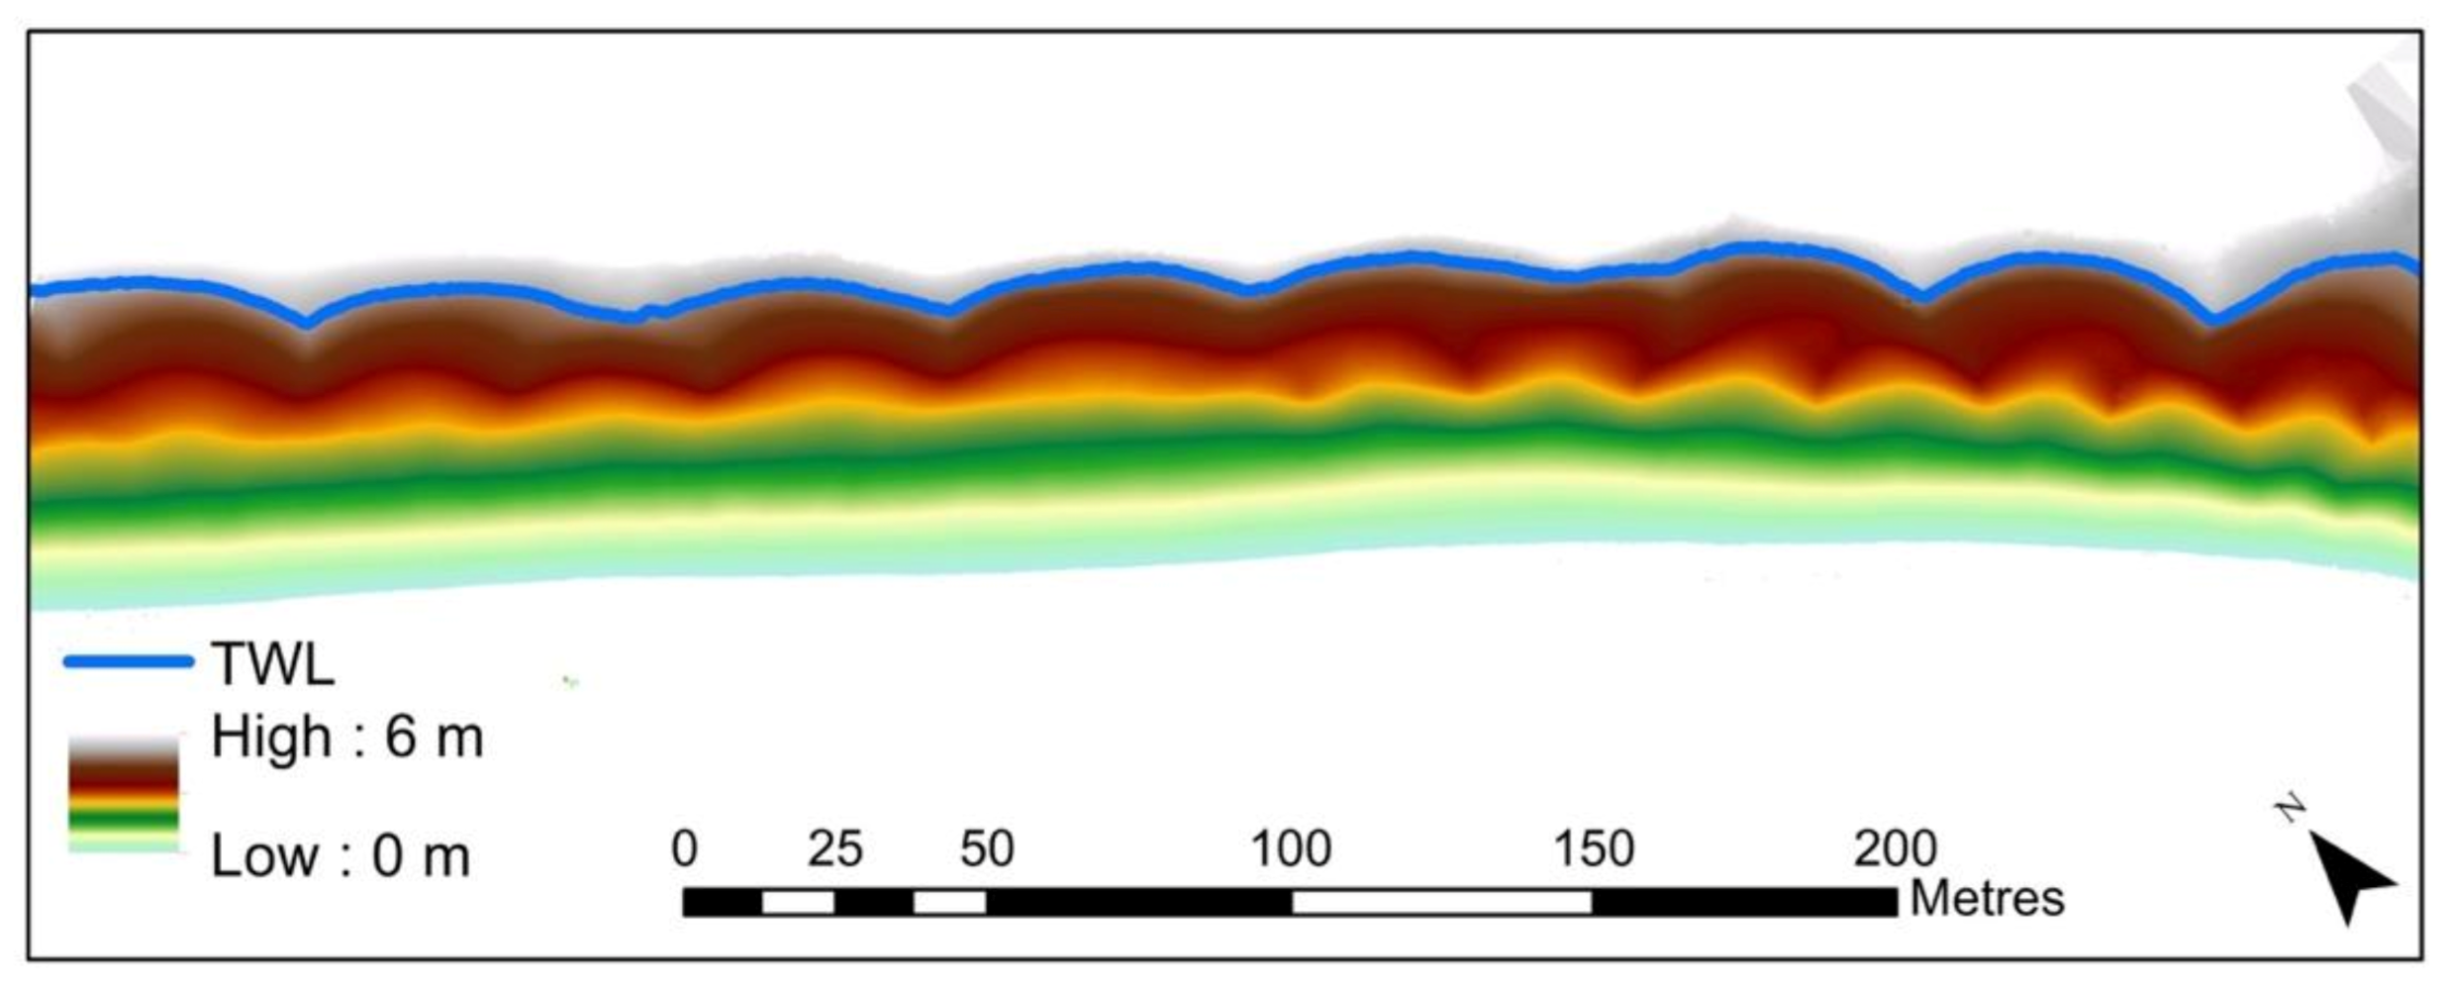
On the majority of the surveys, the mean spacing of the Upper beach level cusps λc,mean = 40.26 m; λc,min = 39.7 m; and λc,max = 40.9 m, were located approximately at z = 6 m ITM. These cusps are always clearly identifiable and are characterised by the highest cusp parameters. The cusps located on this level are only once “active” (3 March 2019) and are for the remaining of the survey period a relict feature on the beachface, as the horizontal swash excursion nor the TWL reaches the upper beach level cusps in order to change their parameters. Figure 13 shows the maximum extent of the TWL on 3 March 2019, clearly reaching to the highest levels of the beachface. Such high TWL is not observed again during the survey period, so the cusps on the upper beach level can persist for a relatively long time and eventually stabilize. From Table 3, it shows that the cusp parameters show no significant difference over a period of six months.

4.4. Prediction Theory Cusp Parameters

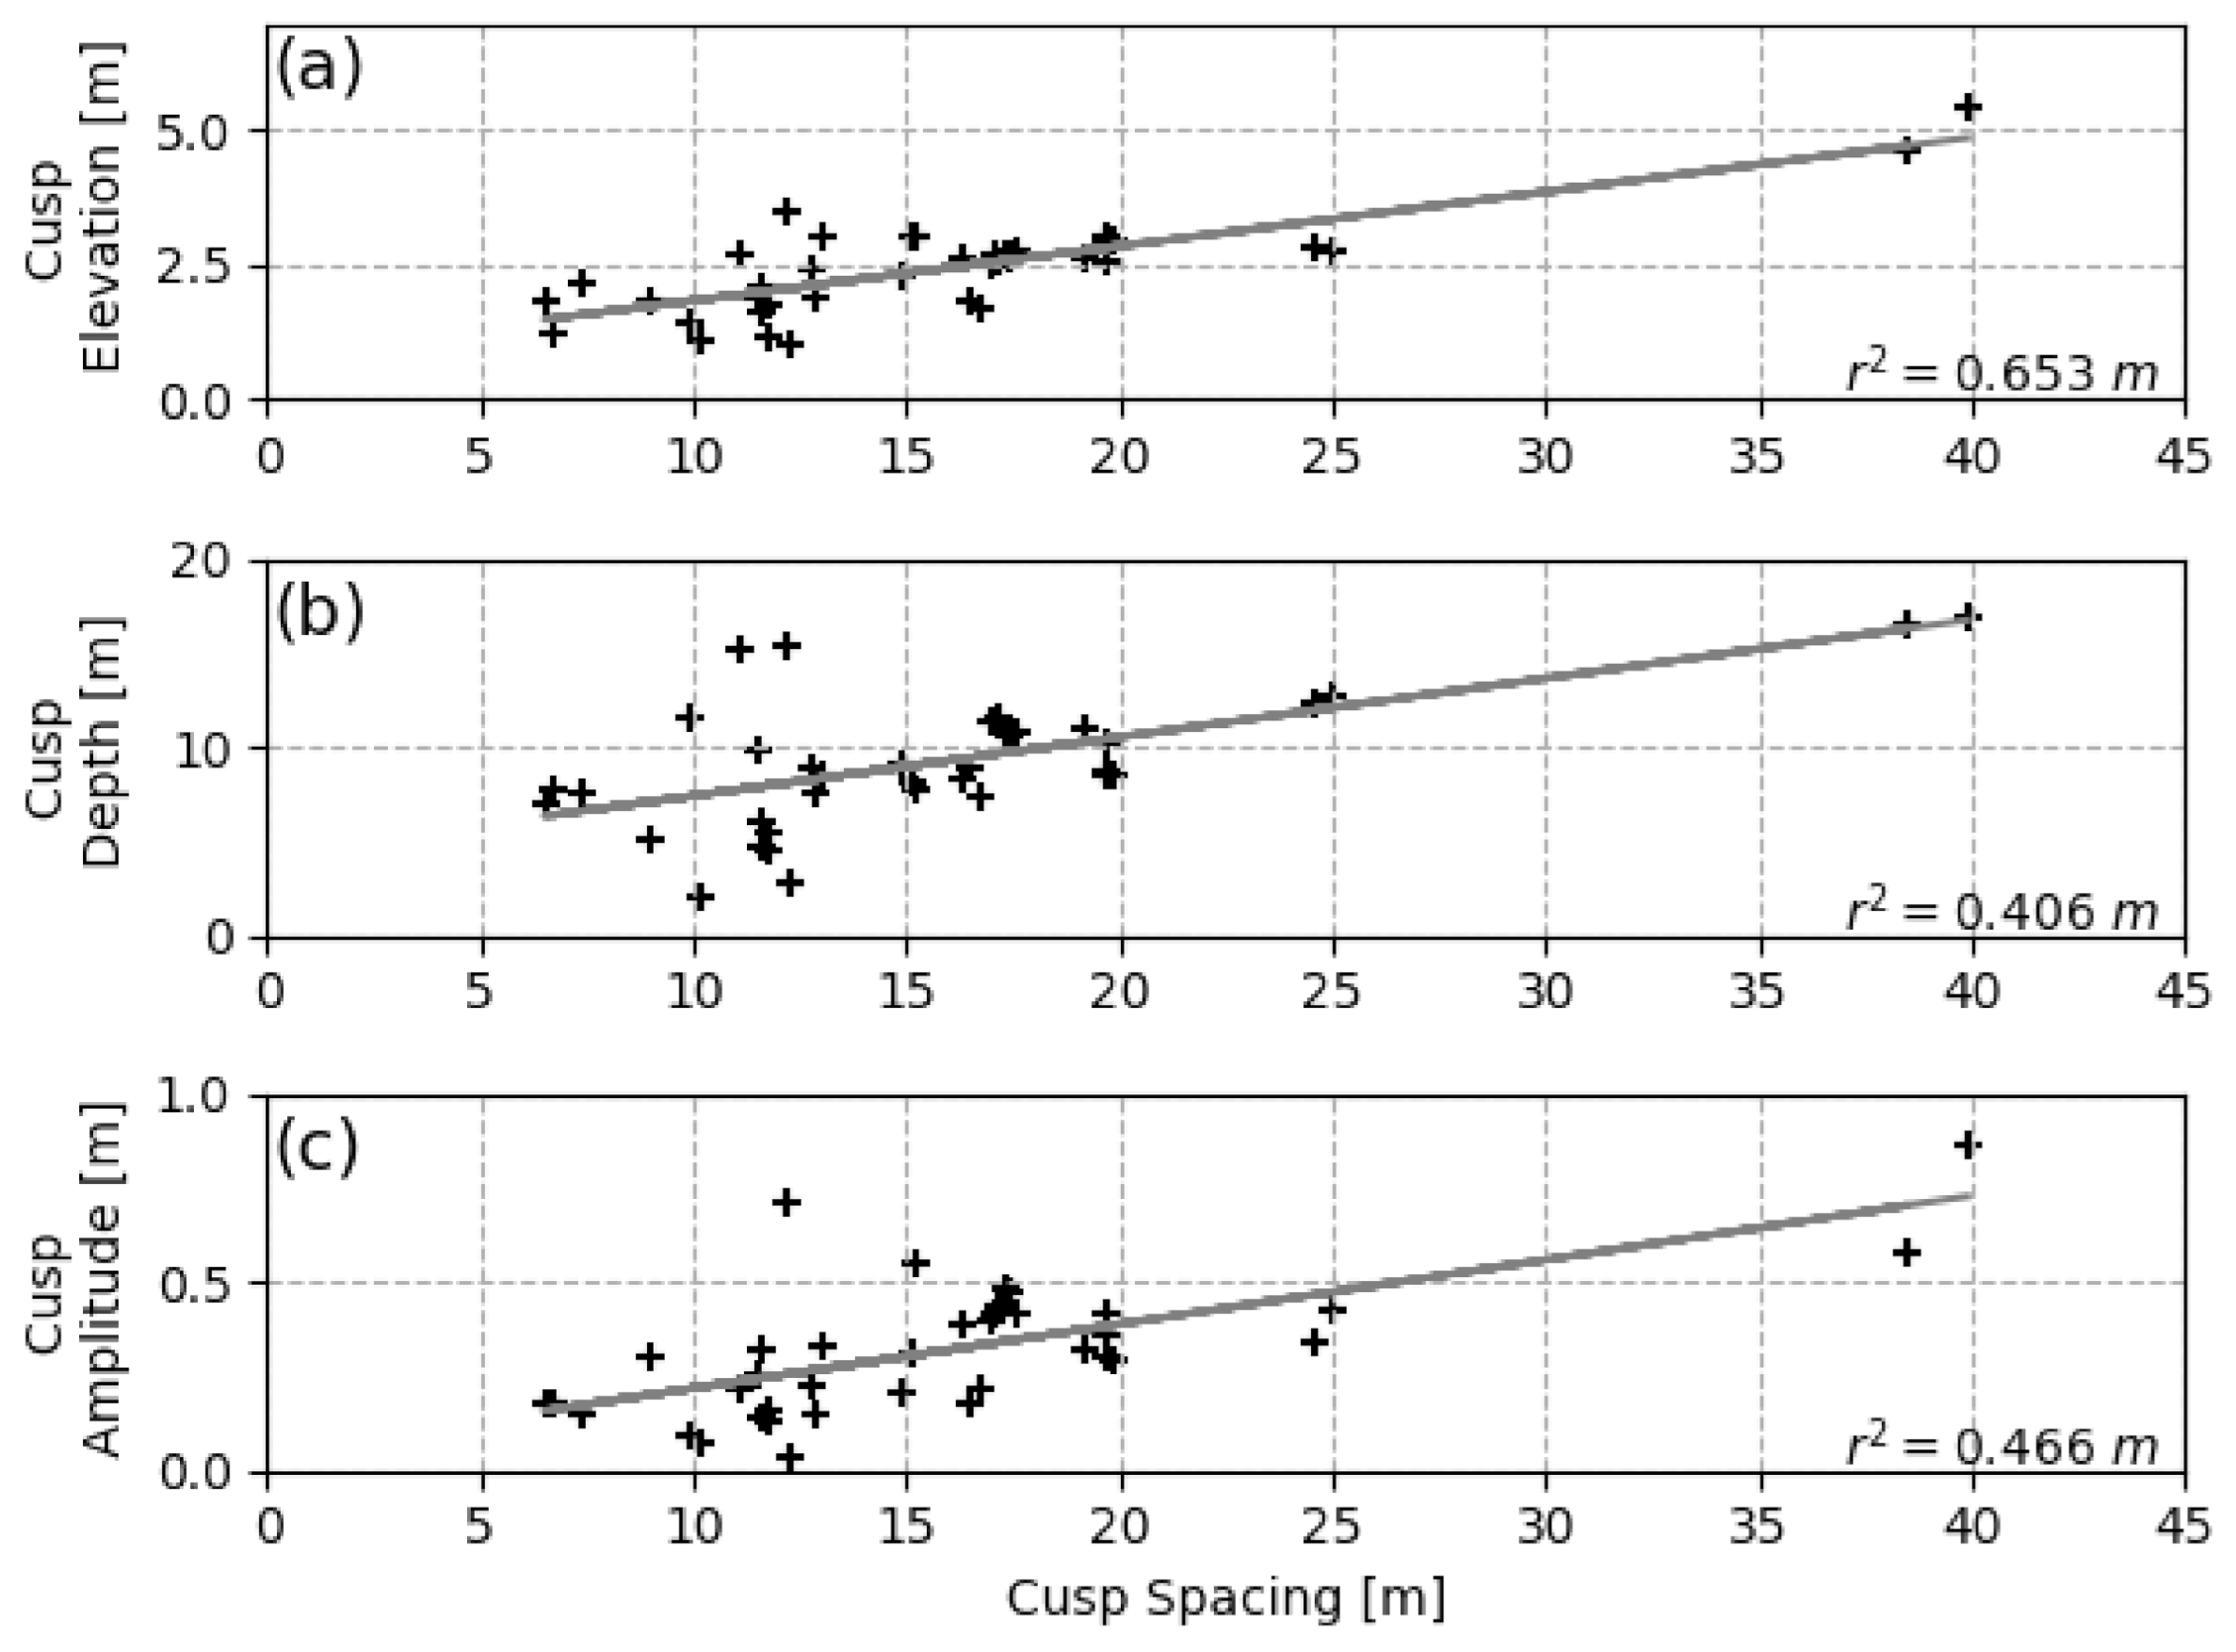
The predictions highlighted earlier are only based on the cusp spacing, but different other cusp parameters can be derived from beach cusps. This section aims to suggest other prediction theories, for the first time, based on the observations from Long Strand. The cusp spacing has a clear correlation with the other different cusp parameters (Figure 14).
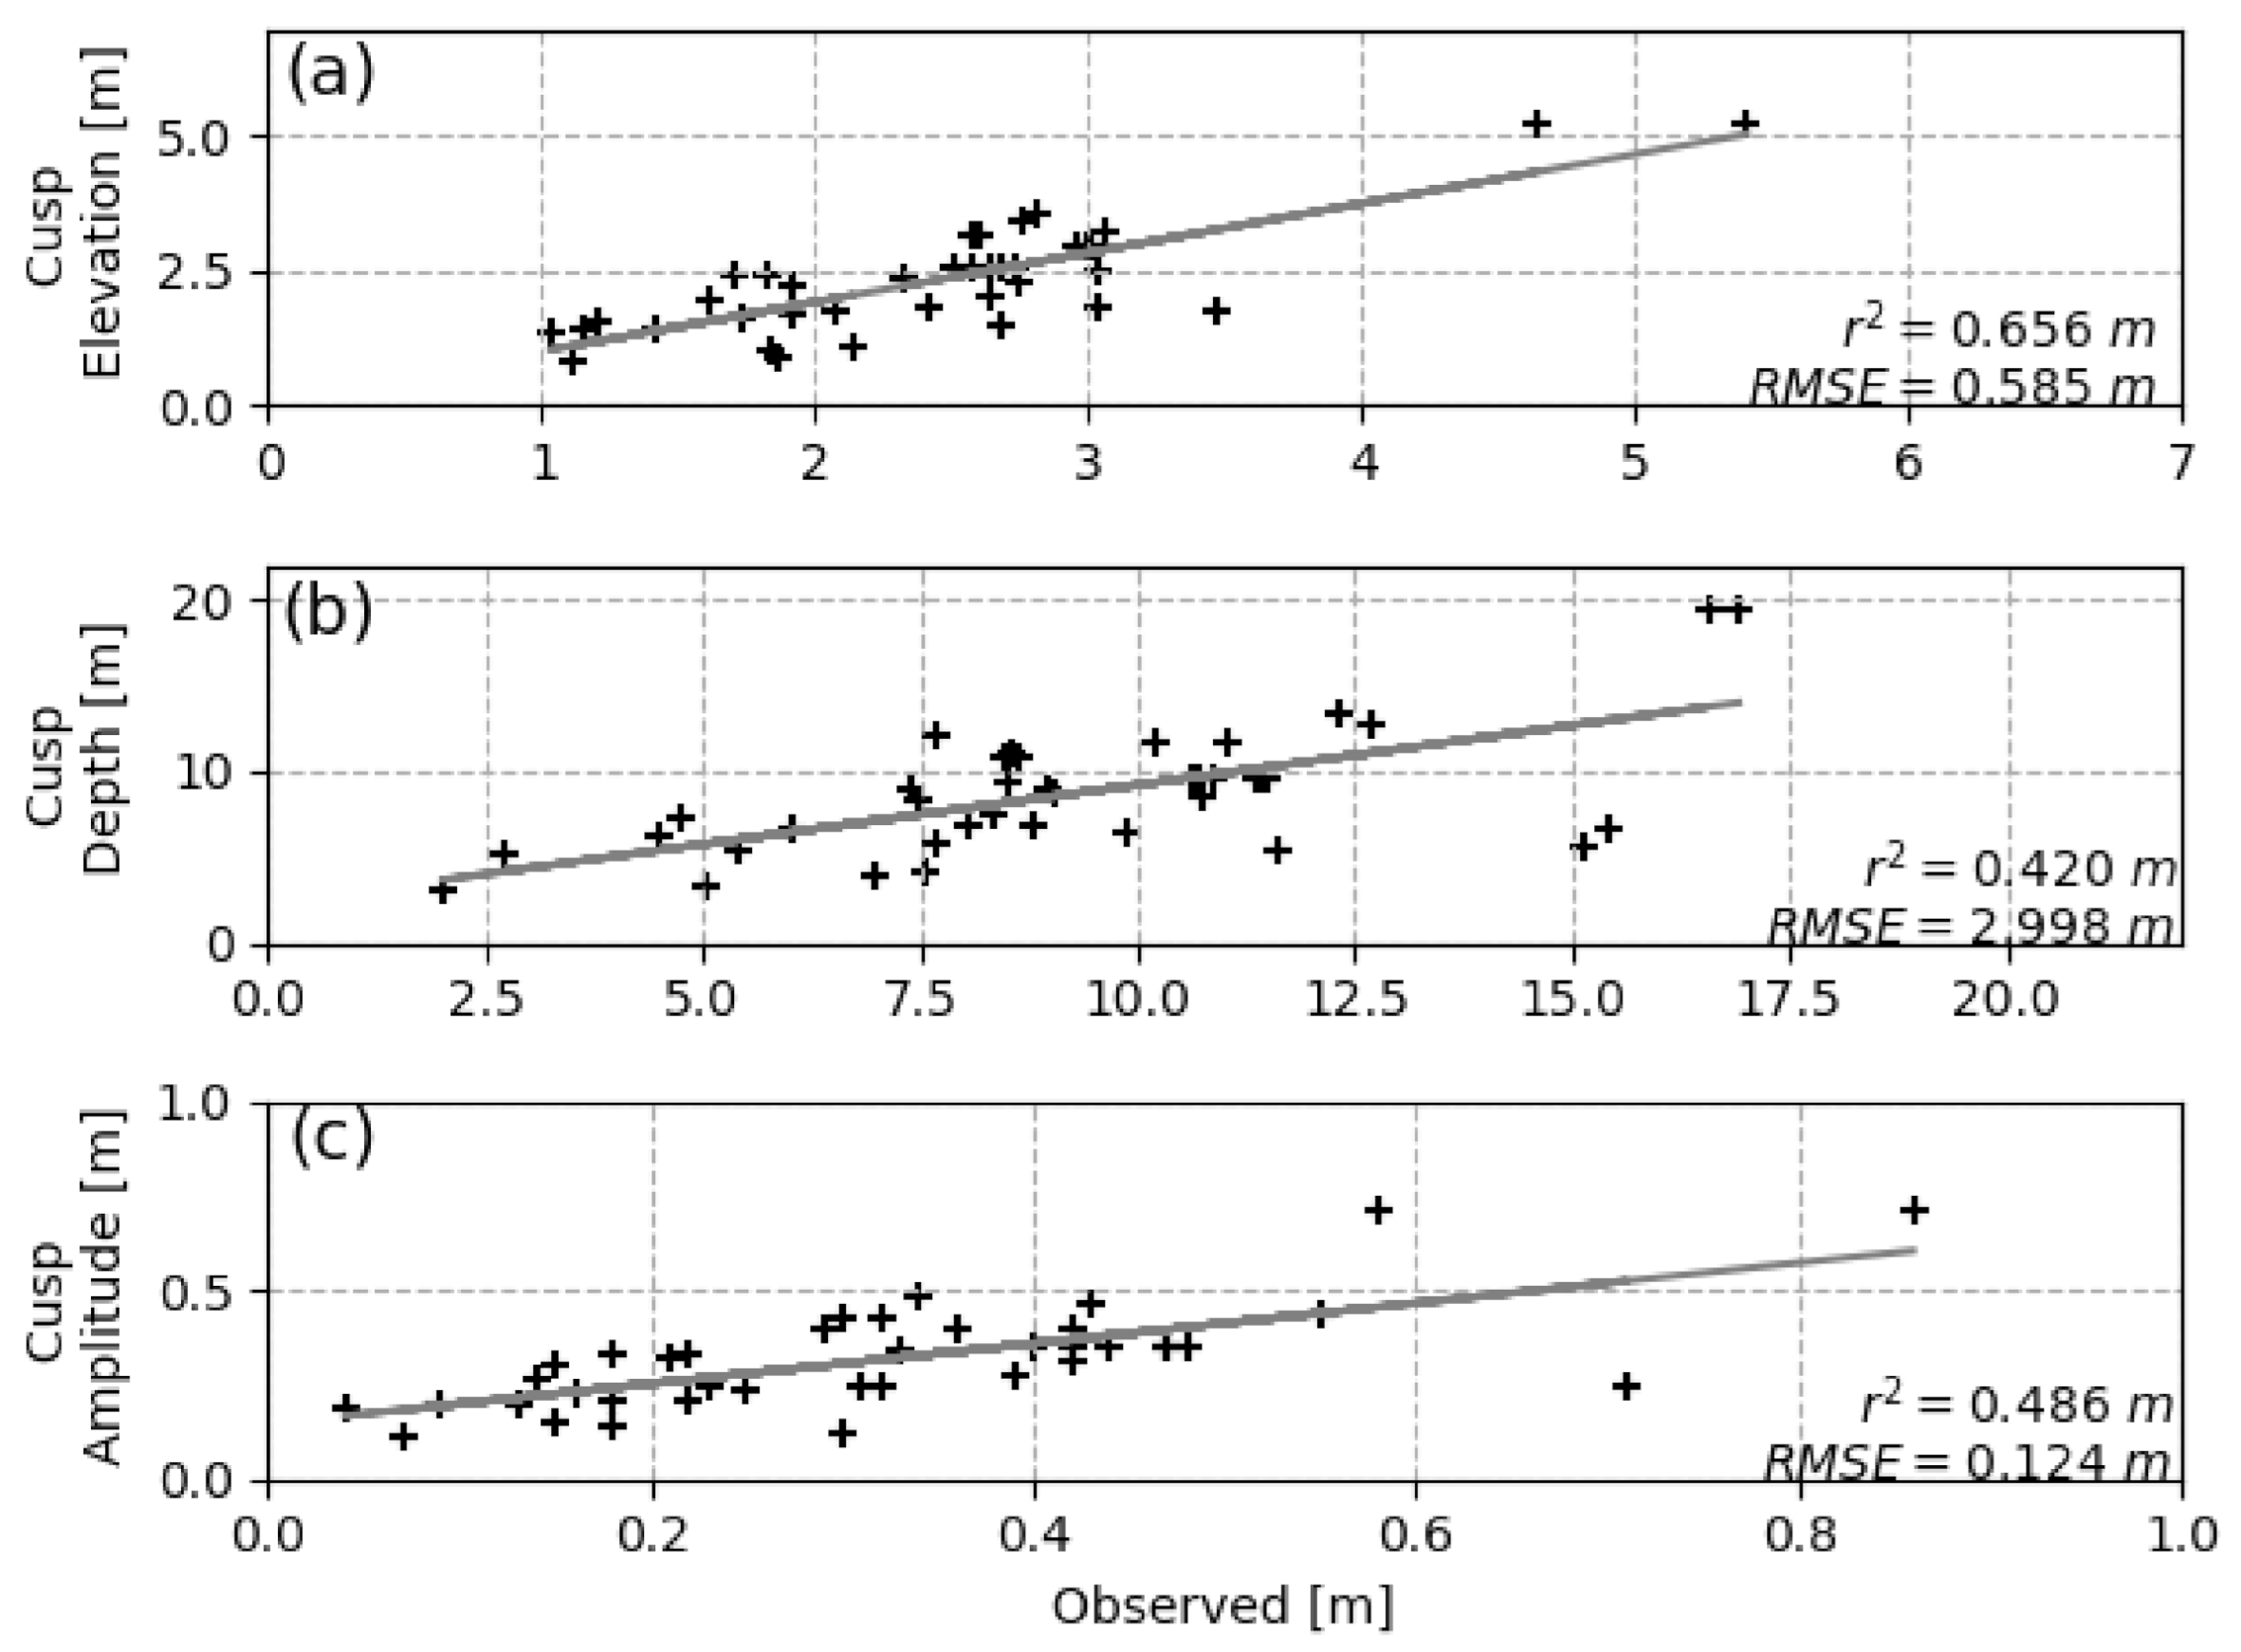
The cusp spacing is linked to the horizontal swash excursion, based on the self-organization theory. As such, the predictions for the other cusp parameters (Cusp elevation, Cusp depth, and Cusp amplitude) are derived from the horizontal swash excursion. The prediction theories for the other cusp parameters are highlighted in Table 7 and Figure 15. All cusp parameters are statistically significant with the horizontal swash excursion (p < 0.001).

5. Discussion

5.1. Cusp Parameters

In this section, the different cusp parameters will be analysed (Figure 1). Four different parameters are quantified in this study: Cusp spacing, Cusp elevation, Cusp amplitude, and Cusp depth.
As previously mentioned, the detail of the current dataset has not been presented in the literature before, neither on a three-tiered beach cusp system or on such an extensive dataset covering the different cusp parameters from a single site. Only a few recent studies have presented limited measurements and analysis of other cusp parameters than cusp spacing [32,33,47]. In addition, most long-term studies rely primarily on optical imagery, which limits the elevation information that can be extracted from the data [11,27,28]. Hence, the factors controlling these different cusp parameters and the relationship between different hydrodynamic and morphological parameters remain relatively unknown. The different cusp parameters extracted in this study will be used to investigate the link between their change and the hydrodynamics influencing them.
The cusp spacing is more regular on the upper beach face, whereas cusps located near the water level have smaller cusp spacings (Table 3, Figure 11). There is a tendency for the regularity of cusp spacing to build up with an increasing mean cusp spacing (Table 4). There is indeed a strong correlation between the mean cusp spacing and the mean cusp elevation (r2 = 0.653). This was also highlighted by Nolan et al. [32]. The different cusp parameters (elevation, depth, and amplitude) are linearly related to the cusp spacing to a moderate degree. Past studies [5,22,48] already demonstrated beach cusp spacing to be linearly related to the horizontal swash excursion. In fact, an increase in the cusp spacing corresponded to an increase in the horizontal swash excursion. The other cusp parameters (cusp elevation, amplitude, and depth) are well-correlated with the mean cusp spacing (Figure 14).
Previous studies assessing the relationship between different cusp parameters are relatively scarce. Nolan et al. [32] reported on the different correlations between the cusp parameters but their data showed a much lower correlation coefficient (Cusp spacing and cusp amplitude: r2 = 0.23), noting that their dataset covered several sites. O’Dea and Brodie [49] reported on cusp spacing and cusp amplitude as well (r2 = 0.94), which is higher than the findings in this study. The results presented here demonstrate that the cusp parameters may be strongly related to cusp spacing during or near formation, which is then closely related to the horizontal swash excursion.
Predictions of the other cusp parameters have not been proposed previously in the literature. This is mainly due to the lack of an extensive dataset from a single site covering the four different parameters. In addition, using the UAV system, it is possible to obtain high spatial accuracy of the different parameters. As such, the fitting coefficients highlighted in Table 7 should be used as a starting point for future predictions of the cusp parameters. The focus has been mainly on the cusp spacing but these observations show that other predictions can be made using the horizontal swash excursion, taking into account that these predictions are probably site specific.
It is however important to note that, in this study, the horizontal swash excursion is derived from empirical analysis. Previous study [6] already highlighted that vertical swash excursion are larger on cusp horns, while horizontal swash excursion is larger in cusp bays. Such differences are not taken into account in this study, which would potentially improve the analysis of the relationship between the different cusp parameters and the horizontal swash excursion.

5.2. Beach Cusp Predictions

Among the three formulas tested, the self-organisation, in its original form, estimated cusp spacing values in the correct range. The formula results in an RMSE = 4.71 m, for the low beach level cusps. The edge wave theory had a similar RMSE (RMSE = 4.79 m) but represented a low agreement. The Sunamura (2004) gives a clear overestimation of the cusp spacing (RMSE = 10.59 m) on the lower level. This overestimation could be attributed to spatial variations in grain size controlling φ.
Adjusting the self-organisation formula to f = 1.1628 reduced the RMSE further to 2.03 m for the lower beach cusps, which results in the lowest RMSE of all three predictions. However, the self-organisation formula is based on a conceptual model due to the empirical parametrisation of the run-up (Equation (4)). Given this conceptual model, site-specific parameters such as the beachface slope and roughness, as well as the wave spectrum itself, are likely to alter the run-up. As such, further research should be done to measure run-up on the beachface.
The edge wave formula has an RMSE of 4.79 m. Adjusting the fitting coefficient to m = 0.4845, results in an RMSE of 4.78 m. In addition, the regression coefficient is unsatisfactory, arguing that the edge wave theory has the lowest agreement between the observed and predicted cusp spacing. If edge waves are apparent on the beach in Long Strand, they would be synchronous, according to the edge wave theory (synchronous edge waves: m = 0.5) [18,19,20,21]. In comparison to the self-organisation theory, the edge wave theory addresses only the flow patterns prior to the beach cusp formation and evolution, represented by wave parameters. As such, both theories do assume an equilibrium state, while conditions in nature are rarely stationary. This can result in a potential source of errors as the coupling between the observed cusp dimensions with the wave parameters results in a lag between the hydrodynamic forcing and the beach cusp response. This is especially true for the edge wave theory as field wave spectra are seldom monochromatic, making identification of a specific incident wave period difficult. As the cusp spacing prediction of the edge wave theory scales as the square of the incident wave period, small errors in the incident wave period may result in relatively large errors in the predicted cusp spacing.
The Sunamura [24] formula had initially the highest RMSE of all three equations, in its original form. After linear regression fitting, the constant A could be adjusted to A = 0.7033. This gives an RMSE = 2.37 m, which is close to the self-organisation theory. Sunamura [24] suggested that the A-value falls in a range from A = 0.7 and A = 2.0 for field observations, with an average of A = 1.35. The study also highlights that a reduction in the A-value is most likely caused due to waves with larger wave heights and longer wave periods that control the spacing of the cusps.
The edge wave predictions and self-organisation prediction are directly linked with the beach slope. The choice of the beach slope in these formulas is complex, as natural beaches are rarely planar. The beach slope was calculated after each survey, following Stockdon et al. [36], which can be used to analyse hydrodynamics and cusp parameters during the survey. However, the mean beach slope is used for the remaining of the analysis. The mean beach slope used in these predictions often differs substantially from the plane beach equations. The interpretation of these findings as conclusive proof of the different theories and predictions is probably erroneous but shows that, for example, collecting field data on horizontal/vertical swash excursion could significantly improve the different findings.
In addition, it is beyond the scope of this study to find conclusive proof for the formation of beach cusps. Nevertheless, the cusp spacing was largely related to the horizontal swash excursion, supporting the self-organisation model of beach cusp formation. Initially, edge waves were hypothesised to contribute to the formation of beach cusps [16], although it has been later argued that edge waves are not persistent enough to form these features [50]. There were, however, no observational data available to conclusively discount the edge wave theory of cusp formation. The edge wave theory does not take into account the feedback between hydrodynamics, sediment processes, and the evolving morphology. As such, this theory is incompatible with the non-linear and open nature of natural nearshore systems [4,51]. Lastly, beach cusp “formation” assumes featureless shorelines, whether such shorelines are produced naturally (e.g., storms) [7,21] or artificially (e.g., using bulldozers) [52]. As such, beach cusp “evolution” or “readjustment” would be a more accurate term to discuss the morphological changes apparent on Long Strand, as there are always at least two levels of beach cusps clearly identifiable.

5.3. Multilevel Beach Cusp System

During the survey period of Long Strand (March–September 2019), a defined cusp system is clearly visible on different levels of the beach. At least two different levels of beach cusps persisted for the full period (Upper and Mid) and during the calmer conditions (ξo < 1.55), a third level of beach cusps was observed near the water level (Low). In order to adequately record the morphological changes, hydrodynamics between two consecutive topographical surveys were considered. The influence of preceding hydrodynamics is important to understand the natural evolution of multilevel beach cusp systems.
The low beach level cusps are very dynamic and change every high tide. This is probably related to the cusp elevation (1 < z < 2.5 m), as it is immersed during every high tide. These are subject to surf zone sediment transport processes, which are expected to reset the local morphology, allowing new rhythmical patterns to emerge during most tidal cycles. It is clear that they form during mild conditions (i.e., ξo < 1.55) and disappear once the surf similarity parameter increases to ξo > 1.55. Their cusp parameters are then closely linked to the horizontal swash excursion and in particular to the self-organisation theory, described by Werner and Fink [22].
The Mid beach level cusps can be divided in two different states, as highlighted by previous studies; (1) as independent formations, typically growing during spring tides and/or mild hydrodynamic conditions; or (2) as part of the larger upper beach level cusps. In fact, studies show that the mid beach level cusps often merge with the upper beach level cusps. The merging of current and new cusp features was for example reported by van Gaalen et al. [33]. Several other authors [10,27,28,53] described merging events between different levels of beach cusps. They suggested that upper beach level cusps could provide a morphological template that can initiate cusp formation on other levels of the beach. In this study, it is clear that there is no merging/interaction between the lower beach level cusps and the mid beach level cusps. However, during some surveys, the mid beach level cusps are part of the larger upper beach level cusps, when the horns of the different levels align.
In particular, Holland and Holman [10] highlighted that the second set of cusps form with a spacing of half the pre-existing cusp spacing. The dataset presented here does indeed show that when the mid beach level cusps have a spacing approximately half of the spacing of the upper beach level cusps, that they eventually are part of the larger upper beach level cusps (Table 3). Almar et al. [28] suggested that upper beach level cusps are the driving force behind the formation of cusps at a lower level. In their case, the morphological response of the lower beach level cusps is a result of a slight decrease in tidal elevation or a change in incident wave conditions, morphologically forced by the higher, larger cusps. It is possible that the morphological response of the mid beach level cusps, following a slight decrease in tidal elevation or a change in incident wave conditions, may be morphologically forced by the upper beach level cusps. Coco et al. [52] also suggests that this could lead to merging of individual features. However, these studies suggest that the upper beach level cusps are the driving force behind the formation of cusps at a lower level, at half the cusp spacing of the larger cusps.
This is certainly not the case for the beach cusps at Long Strand. The upper beach level cusps are not the driving force for the cusps located lower on the beachface. The hydrodynamics responsible for the change of the upper beach level cusps and the lower/mid beach level cusps are of different significance. As such, it is unlikely that the dataset reported here shows evidence of merging due to the upper beach level cusps. It can be assumed that due to the increasing wave conditions, the larger horizontal swash excursion results in either the destruction of every second cusp, due to horn overtopping or that the hydrodynamic conditions eventually lead to the cusp parameters of the upper beach level cusps changing and the creation of a second set of cusps on the lower level of the beachface.
The upper beach level cusps are only active once at the beginning of the survey period and remain a relict feature for the remaining surveys. The TWL has an impact on the evolution but does not show a significant correlation with any of the cusp parameters. The main driving force of their change is linked with the horizontal swash excursion. It is clear that higher wave periods and increasing wave height lead to an increase in the horizontal swash excursion, which will then influence the different cusp parameters (e.g., increase in cusp spacing with increasing wave conditions). In addition, the upper beach level cusps are stable and persistent, characterised by a large cusp spacing, and high cusp amplitude and cusp depth. These cusps will only be affected during high energy wave conditions (e.g., storms) or during spring tides. During the monitoring campaign, the upper beach level cusps result in similar cusp parameters. The highest values of the horizontal swash excursion during the monitoring campaign occurred on 3 March 2019 (S = 32.52 m, which would result in a cusp spacing of Cs = 37.81 m). Such high values did not occur again during the observation period. As such, the hydrodynamics between March and September 2019 did not reach significant levels in order to establish new cusp dimensions on the upper beach level.
This observation is consistent with previous studies [6,27], which highlighted that beach cusp morphology is persistent in nature. These studies argued for example that once a cusp spacing is incised into the beach face, it will dominate the mean spacing. Moreover, this spacing is likely to remain unchanged unless intense wave conditions establish a radically different spacing, or storms destroy the system entirely.

6. Conclusions

Linking hydrodynamics and beach cusp formation/evolution on steep sandy beaches has proven to be complex and challenging. It is clear that the complexity of processes involved, in both the hydrodynamics and the morphology, influences and co-determine each other. A high spatial dataset of both the hydrodynamics and the topography of the beach will eventually lead to a better understanding of the different processes. This study presents six months of observation of a multilevel beach cusp system, containing three different levels of cusps. It is the first time that such an extensive dataset of four different cusp parameters (i.e., cusp spacing, cusp elevation, cusp depth, and cusp amplitude) on three different levels of beach cusps is presented from a single site. The wave conditions near the beach consisted of an analysis of 10 years of data (2009–2019), in order to give an understanding of the wave climate in the study area. The beach in Long Strand was then monitored, using an UAV system, in different morphological states, from which the evolution of the multilevel beach cusp system was quantified and linked with the hydrodynamics, using numerical modelling.
Different correlations between the horizontal swash excursion and cusp parameters (Figure 15) have been reported for the first time and can bring more insight into the evolution of a multilevel beach cusp system. The equations resulting from these correlations (Table 7) can now be used to predict more than cusp spacing, including cusp elevation, cusp depth, and cusp amplitude.
The observations also indicate that steep sloping beaches can be very dynamic, sometimes changing on a daily basis. Both the intertidal beach topography and the beach cusp systems appeared to be very sensitive to variations in the wave climate. In particular, the surf similarity parameter appears to be a defining factor in the beach cusp formation of the lower beach cusps (e.g., when ξo < 1.55). The findings in this paper confirm with previous studies that beach cusp spacing is linked to the self-organisation theory.
The upper beach level cusps were characterized by the presence of a wider and stable cusp system (Cs,mean: 40.26m; Ce,mean: 5.65m; Cd,mean: 15.38m; Ca,mean: 0.84m). This cusp system showed to be persistent during the monitoring campaign, as the cusp parameters did not change significantly. In practice, the hydrodynamics (e.g., horizontal swash excursion) during the monitoring campaign were not significant enough in order to establish new cusp dimensions.
The beach cusps on the Mid beach level face were in general of smaller dimensions, with Cs,mean: 18.17m; Ce,mean: 2.78m; Cd,mean: 10.72m; and Ca,mean: 0.39m. These cusps were more dynamic, sometimes changing every few days up to being persistent for a few weeks. Theses cusps were also found to fluctuate between two states: (1) as an independent cusp system, or (2) as part of the larger upper beach face cusps.
The lower beach level cusps were characterized by the smallest cusp parameters (Cs,mean: 11.09m; Ce,mean: 1.63m; Cd,mean: 6.52m; Ca,mean: 0.17m), changing after each tidal cycle. These cusps form during mild wave conditions (i.e., ξo < 1.55) and disappear once the surf similarity parameter increases to ξo > 1.55. This parameter is an update from the findings of Masselink and Pattriaratchi [7], as they only made the link with the breaker wave height.
Although the self-organisation theory provides a better fit to the data and theory, we were unable to conclusively disprove any of the mechanisms causing beach cusp formation since the existing theories, standing edge wave, self-organization, and Sunamura (2004), can predict the trend in the observed beach cusp spacing. In addition, the term cusp “evolution” or cusp “readjustment” would be a more appropriate term than “formation” as cusps are always identifiable on the beach in Long Strand.
The cusp parameters described in this study and their link with the hydrodynamic changes in the study area show that beach cusps can markedly change over a single tidal cycle, as well as significantly change over longer time periods. This shows as well that feedback between the hydrodynamics and topography in the swash zone almost certainly plays a role in the cusp growth and evolution, but the initial formation is still unclear. This highlights the need for high spatial and temporal resolution in order to address questions related to investigate the formation and the evolution of a multilevel beach cusp system.

Author Contributions

Conceptualization, S.N.; methodology, S.N.; formal analysis, S.N.; writing—original draft preparation, S.N.; writing—review and editing, J.M., Z.L., and K.H.; supervision, J.M., Z.L., and K.H.; All authors have read and agreed to the published version of the manuscript.

Funding

This research received no external funding.

Institutional Review Board Statement

Not applicable.

Informed Consent Statement

Not applicable.

Data Availability Statement

The main reported data can be found in the tables in this paper.

Acknowledgments

The authors would like to acknowledge DHI for the sponsored MIKE21 DHI license files.

Conflicts of Interest

The authors declare no conflict of interest. The funders had no role in the design of the study; in the collection, analyses, or interpretation of data; in the writing of the manuscript, or in the decision to publish the results.

References

  1. Elfrink, B.; Baldock, T. Hydrodynamics and sediment transport in the swash zone: A review and perspectives. Coast. Eng. 2002, 45, 149–167. [Google Scholar] [CrossRef]
  2. Masselink, G.; Russell, P. Field measurements of flow velocities on a dissipative and reflective beach? Implications for swash sediment transport. Coast. Dyn. 2006, 1–13. [Google Scholar] [CrossRef]
  3. Aagaard, T.; Hughes, M.G. Sediment suspension and turbulence in the swash zone of dissipative beaches. Mar. Geol. 2006, 228, 117–135. [Google Scholar] [CrossRef]
  4. Coco, G.; Murray, A.B. Patterns in the sand: From forcing templates to self-organization. Geomorphology 2007, 91, 271–290. [Google Scholar] [CrossRef]
  5. Dean, R.G.; Maurmeyer, E.M. Beach cusps at point reyes and drakes bay beaches, California. In Proceedings of the Coastal Engineering 1980, Sydney, Australia, 23–28 March 1980; pp. 863–884. [Google Scholar] [CrossRef]
  6. Masselink, G.; Hegge, B.J.; Pattiaratchi, C.B. Beach cusp morphodynamics. Earth Surf. Process. Landf. 1997, 22, 1139–1155. [Google Scholar] [CrossRef]
  7. Masselink, G.; Pattiaratchi, C.B. Morphological evolution of beach cusps and associated swash circulation patterns. Mar. Geol. 1998, 146, 93–113. [Google Scholar] [CrossRef]
  8. Dodd, N.; Stoker, A.M.; Calvete, D.; Sriariyawat, A. On beach cusp formation. J. Fluid Mech. 2008, 597, 145–169. [Google Scholar] [CrossRef] [Green Version]
  9. Sallenger, J.A.H. Inverse grading and hydraulic equivalence in grain-flow deposits. J. Sediment. Res. 1979, 49, 553–562. [Google Scholar] [CrossRef]
  10. Holland, K.; Holman, R. Field observations of beach cusps and swash motions. Mar. Geol. 1996, 134, 77–93. [Google Scholar] [CrossRef]
  11. Holland, K.T. Beach cusp formation and spacings at Duck, USA. Cont. Shelf Res. 1998, 18, 1081–1098. [Google Scholar] [CrossRef]
  12. Coco, G.; Huntley, D.A.; O’Hare, T.J. Investigation of a self-organization model for beach cusp formation and development. J. Geophys. Res. Ocean. 2000, 105, 21991–22002. [Google Scholar] [CrossRef]
  13. Masselink, G. Alongshore variation in beach cusp morphology in a coastal embayment. Earth Surf. Process. Landf. 1999, 24, 335–347. [Google Scholar] [CrossRef]
  14. Aoki, H.; Sunamura, T. A laboratory experiment on the formation and morphology of beach cusps. Chikei 2000, 21, 291–306. [Google Scholar]
  15. Pais-Barbosa, J.; Veloso-Gomes, F.; Taveira-Pinto, F. Coastal features in the energetic and mesotidal West Coast of Portugal. J. Coast. Res. 2007, 50, 459–463. [Google Scholar]
  16. Bowen, A.J.; Bowen, A. Edge Waves and the littoral environment. In Proceedings of the 13th International Conference on Coastal Engineering, Vancouver, BC, Canada, 10–14 July 1972. [Google Scholar] [CrossRef]
  17. Guza, R.T.; Inman, D.L. Edge waves and beach cusps. J. Geophys. Res. Atmos. 1975, 80, 2997–3012. [Google Scholar] [CrossRef]
  18. Kaneko, A. Formation of beach cusps in a wave tank. Coast. Eng. 1985, 9, 81–98. [Google Scholar] [CrossRef]
  19. Seymour, R.J.; Aubrey, D.G. Rhythmic beach cusp formation: A conceptual synthesis. Mar. Geol. 1985, 65, 289–304. [Google Scholar] [CrossRef]
  20. Sherman, D.J.; Orford, J.D.; Carter, R.W.G. Development of cusp-related, gravel size and shape facies at Malin Head, Ireland. Sedimentology 1993, 40, 1139–1152. [Google Scholar] [CrossRef]
  21. Ciriano, Y.; Coco, G.; Bryan, K.R.; Elgar, S. Field observations of swash zone infragravity motions and beach cusp evolution. J. Geophys. Res. Ocean. 2005, 110. [Google Scholar] [CrossRef] [Green Version]
  22. Werner, B.T.; Fink, T.M. Beach cusps as self-organized patterns. Science 1993, 260, 968–971. [Google Scholar] [CrossRef]
  23. Coco, G.; O’Hare, T.J.; Huntley, D.A. Beach cusps: A comparison of data and theories for their formation. J. Coast. Res. 1999, 15, 741–749. [Google Scholar]
  24. Sunamura, T. A predictive relationship for the spacing of beach cusps in nature. Coast. Eng. 2004, 51, 697–711. [Google Scholar] [CrossRef]
  25. Antia, E. Preliminary field observations on beach cusp formation and characteristics on tidally and morphodynamically distinct beaches on the Nigerian coast. Mar. Geol. 1987, 78, 23–33. [Google Scholar] [CrossRef]
  26. Carter, R.W.G.; Orford, J.D. The morphodynamics of coarse clastic beaches and barriers: A short- and long-term perspective. J. Coast. Res. 1993, 15, 158–179. [Google Scholar]
  27. Vousdoukas, M. Erosion/accretion patterns and multiple beach cusp systems on a meso-tidal, steeply-sloping beach. Geomorphology 2012, 141–142, 34–46. [Google Scholar] [CrossRef]
  28. Almar, R.; Coco, G.; Bryan, K.R.; Huntley, D.; Short, A.; Senechal, N. Video observations of beach cusp morphodynamics. Mar. Geol. 2008, 254, 216–223. [Google Scholar] [CrossRef]
  29. Almar, R.; Hounkonnou, N.; Anthony, E.J.; Castelle, B.; Senechal, N.; Laibi, R.; Mensah-Senoo, T.; Degbe, G.; Quenum, M.; Dorel, M.; et al. The Grand Popo beach 2013 experiment, Benin, West Africa: From short timescale processes to their integrated impact over long-term coastal evolution. J. Coast. Res. 2014, 70, 651–656. [Google Scholar] [CrossRef]
  30. Sénéchal, N.; Laibi, R.; Almar, R.; Castelle, B.; Biausque, M.; Lefebvre, J.-P.; Anthony, E.J.; Dorel, M.; Chuchla, R.; Hounkonnou, M.; et al. Observed destruction of a beach cusp system in presence of a double-coupled cusp system: The example of Grand Popo, Benin. J. Coast. Res. 2014, 70, 669–674. [Google Scholar] [CrossRef]
  31. Angnuureng, D.B.; Bonou, F.; Sohou, Z.; Almar, R.; Alory, G.; Du Penhoat, Y. Shoreline and beach cusps dynamics at the low tide terraced grand Popo Beach, Bénin (West Africa): A statistical approach. J. Coast. Res. 2018, 81, 138–144. [Google Scholar] [CrossRef]
  32. Nolan, T.; Kirk, R.; Shulmeister, J. Beach cusp morphology on sand and mixed sand and gravel beaches, South Island, New Zealand. Mar. Geol. 1999, 157, 185–198. [Google Scholar] [CrossRef]
  33. Van Gaalen, J.F.; Kruse, S.E.; Coco, G.; Collins, L.; Doering, T. Observations of beach cusp evolution at Melbourne Beach, Florida, USA. Geomorphology 2011, 129, 131–140. [Google Scholar] [CrossRef]
  34. Blott, S.J.; Pye, K. Particle shape: A review and new methods of characterization and classification. Sedimentology 2008, 55, 31–63. [Google Scholar] [CrossRef]
  35. Bosom, E.; Jiménez, J.A. Probabilistic coastal vulnerability assessment to storms at regional scale—Application to Catalan beaches (NW Mediterranean). Nat. Hazards Earth Syst. Sci. 2011, 11, 475–484. [Google Scholar] [CrossRef] [Green Version]
  36. Stockdon, H.F.; Sallenger, A.H.; Holman, R.A.; Howd, P.A. A simple model for the spatially-variable coastal response to hurricanes. Mar. Geol. 2007, 238, 1–20. [Google Scholar] [CrossRef]
  37. Serafin, K.A.; Ruggiero, P.; Stockdon, H.F. The relative contribution of waves, tides, and non-tidal residuals to extreme total water levels on US West Coast sandy beaches. Geophys. Res. Lett. 2017, 44, 1839–1847. [Google Scholar] [CrossRef]
  38. Guza, R.T.; Thornton, E.B. Swash oscillations on a natural beach. J. Geophys. Res. Ocean. 1982, 87, 483–491. [Google Scholar] [CrossRef]
  39. Holman, R.A.; Sallenger, A.H. Setup and swash on a natural beach. J. Geophys. Res. Space Phys. 1985, 90, 945. [Google Scholar] [CrossRef]
  40. Holman, R. Extreme value statistics for wave run-up on a natural beach. Coast. Eng. 1986, 9, 527–544. [Google Scholar] [CrossRef]
  41. Ruessink, B.G.; Kleinhans, M.G.; van de Beukel, P.G.L. Observations of swash under highly dissipative conditions. J. Geophys. Res. Ocean. 1998, 103, 3111–3118. [Google Scholar] [CrossRef]
  42. Passarella, M.; De Muro, S.; Ruju, A.; Coco, G. An assessment of swash excursion predictors using field observations. J. Coast. Res. 2018, 85, 1036–1040. [Google Scholar] [CrossRef]
  43. Vousdoukas, M.; Velegrakis, A.; Dimou, K.; Zervakis, V.; Conley, D. Wave run-up observations in microtidal, sediment-starved pocket beaches of the Eastern Mediterranean. J. Mar. Syst. 2009, 78, S37–S47. [Google Scholar] [CrossRef]
  44. Ferguson, R.; Church, M. A simple universal equation for grain settling velocity. J. Sediment. Res. 2004, 74, 933–937. [Google Scholar] [CrossRef]
  45. Wright, L.; Short, A. Morphodynamic variability of surf zones and beaches: A synthesis. Mar. Geol. 1984, 56, 93–118. [Google Scholar] [CrossRef]
  46. Nuyts, S.; Murphy, J.; Li, Z.; Hickey, K. A methodology to assess the morphological change of a multilevel beach cusp system and their hydrodynamics: Case study of Long Strand, Ireland. J. Coast. Res. 2020, 95, 593–598. [Google Scholar] [CrossRef]
  47. Garnier, R.; Sánchez, M.O.; Losada, M.Á.; Falqués, A.; Dodd, N. Beach cusps and inner surf zone processes: Growth or destruction? A case study of Trafalgar Beach (Cádiz, Spain). Sci. Mar. 2010, 74, 539–553. [Google Scholar] [CrossRef] [Green Version]
  48. Takeda, I.; Sunamura, T. Formation and Spacing of Beach Cusps. Coast. Eng. Jpn. 1983, 26, 121–135. [Google Scholar] [CrossRef]
  49. O’Dea, A.; Brodie, K.L. Spectral analysis of beach cusp evolution using 3D lidar scans. Coast. Sediments 2019, 657–673. [Google Scholar] [CrossRef]
  50. Qi, H.; Cai, F.; Lei, G.; Cao, H.; Shi, F. The response of three main beach types to tropical storms in South China. Mar. Geol. 2010, 275, 244–254. [Google Scholar] [CrossRef]
  51. Van Enckevort, I.M.J.; Turner, I.L.; Plant, N.; Holman, R.A.; Ruessink, B.G.; Coco, G.; Suzuki, K. Observations of nearshore crescentic sandbars. J. Geophys. Res. Ocean. 2004, 109. [Google Scholar] [CrossRef]
  52. Coco, G.; Burnet, T.K.; Werner, B.T.; Elgar, S. Test of self-organization in beach cusp formation. J. Geophys. Res. Atmos. 2003, 108. [Google Scholar] [CrossRef]
  53. Castelle, B.; Ruessink, B.G.; Bonneton, P.; Marieu, V.; Bruneau, N.; Price, T.D. Coupling mechanisms in double sandbar systems. Part 1: Patterns and physical explanation. Earth Surf. Process. Landf. 2010, 35, 476–486. [Google Scholar] [CrossRef]
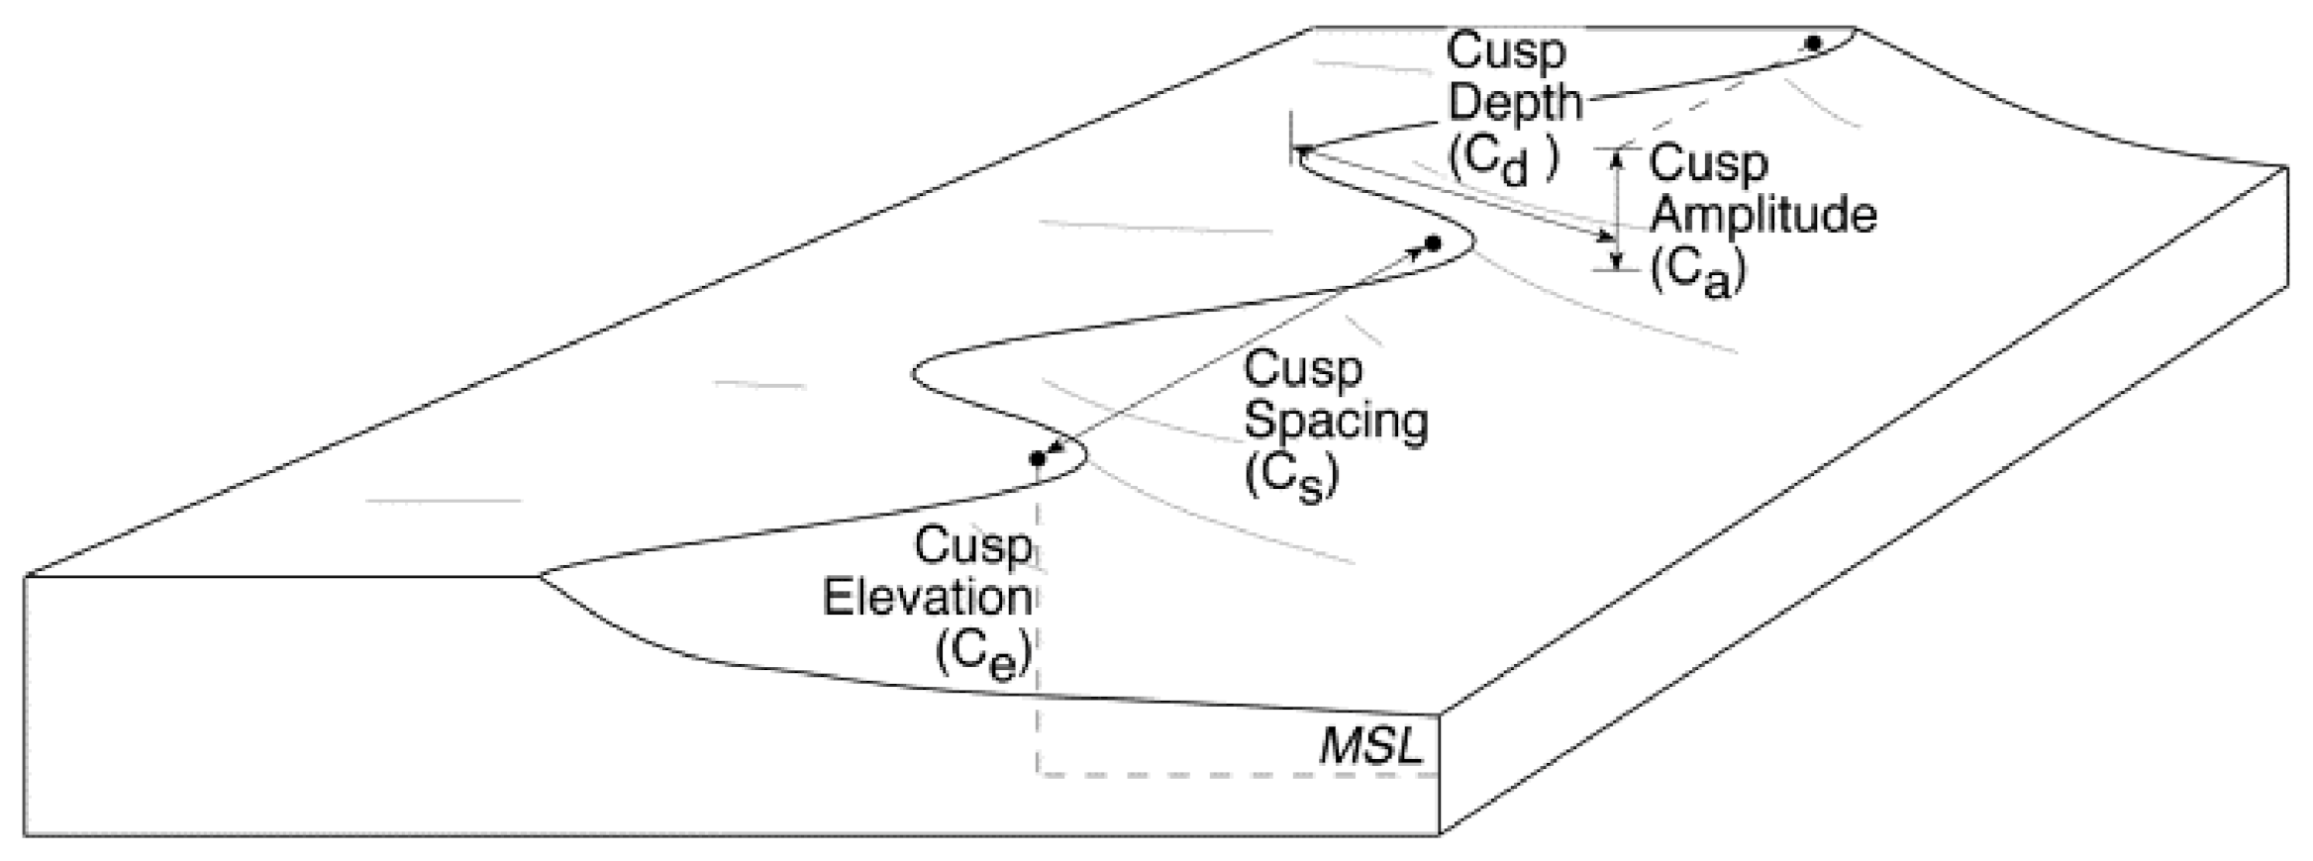
Figure 1. Definition of beach cusp parameters measured, introduced by Nolan et al. [32].
Geosciences 11 00148 g001
Figure 2. Study area (left) in Rosscarbery Bay on the south-west coast of Ireland, and (right) satellite image of Long Strand (from European Space Agency ESA-Sentinel 2).
Geosciences 11 00148 g002
Figure 3. Unstructured mesh used for model domain offshore area MIKE 21 SW.
Geosciences 11 00148 g003
Figure 4. Unstructured mesh used for model domain onshore area MIKE 21 SW.
Geosciences 11 00148 g004
Figure 5. Location Valeport in Rosscarbery Bay (October 2018).
Geosciences 11 00148 g005
Figure 6. Modelled vs. Observed (Top) Significant wave height (Hs), and (Bottom) Peak wave period (Tp), for October/November 2018.
Geosciences 11 00148 g006
Figure 7. Structure from Motion (SfM) products: (a) Orthomosaic composed in Pix4D, and (b) Digital Surface Model (DSM) constructed from point cloud visualized in ArcMap 10.6.
Geosciences 11 00148 g007
Figure 8. (a) Resulting DSM from 28 August 2019 showing three levels of beach cusps, and (b) detail of selected transects used for further analysis, with (1) the selected transect for Upper beach level cusps, (2) the selected transect for Mid beach level cusps, and (3) the selected transect for Lower beach level cusps.
Geosciences 11 00148 g008
Figure 9. The wave conditions in the study area from the numerical model; (a) the significant wave height (Ho), (b) Peak wave period (Tp), (c) Mean wave direction, and (d) Tidal elevation. The vertical lines represent surveys, with blue lines showing a three-level beach cusp system, and red showing a two-level beach cusp system.
Geosciences 11 00148 g009
Figure 10. Time series of hydrodynamics in the study area from empirical parameterization; (a) Surf-similarity parameters (ξo) and beach slope (tan β) during the topographical survey; (b) Horizontal swash Excursion (S), (c) the Wave setup (<η>), and (d) Total water level (TWL). The vertical lines represent surveys, with blue lines showing a three-level beach cusp system, and red showing a two-level beach cusp system.
Geosciences 11 00148 g010
Figure 11. Results of analysed transect from DSM in Python, with (a) the upper beach level cusps, (b) the mid beach level cusps, and (c) the Low beach level cusps. The x-axis showing length on the beach (ITM) and y-axis, the height of the cusps above MSL (ITM).
Geosciences 11 00148 g011
Figure 12. Scatter plots of the observed cusp spacings (x-axis), and predicted values (y-axis), according to (a) edge wave theory, (b) self-organisation theory, and (c) Sunamura (2004). Trendline and Root Mean Square Error (RMSE) corresponding to the best-fit case.
Geosciences 11 00148 g012
Figure 13. Detail of TWL on the beachface on 3 March 2019. The blue line represents the highest elevation of the TWL, reaching the top of the beachface and allowing to change the Upper beach level cusps.
Geosciences 11 00148 g013
Figure 14. Scatter plots of the observed cusp spacing (x-axis), and other observed cusp parameters (y-axis), with (a) Cusp elevation, (b) Cusp Depth, and (c) Cusp amplitude. The trendline corresponds to the best-fit case.
Geosciences 11 00148 g014
Figure 15. Scatter plots of the observed cusp parameters (x-axis) and predicted values (y-axis) according to prediction theories highlighted in Table 7, for (a) Cusp elevation, (b) Cusp depth, and (c) Cusp amplitude. The trendline corresponds to the best-fit case.
Geosciences 11 00148 g015
Table 1. Overview burst scheme Valeport.
Sampling Setup 730D Valeport
ParameterValueUnit
Rate1Hz
Tide Burst Duration20Seconds
Tide Burst Interval60Minutes
Wave Burst Duration1024Samples
Wave Burst Interval60Minutes
Table 2. Statistical parameters computed for significant wave height (Hs) and peak wave period (Tp).
Statistical Parameters Model Validation
Wave ParameterRRMSEBias
Hs0.9190.4010.081
Tp0.8401.0050.129
Table 3. Overview observed beach cusp parameters.
Overview Cusp Parameters
DateLevelCusp
Spacing (m)
Cusp
Amplitude (m)
Cusp
Elevation (m)
Cusp Depth (m)
126 MarchUpper Beach39.90.865.4116.91
Mid Beach38.50.583.1416.57
Low Beach-
210 AprilUpper Beach40.30.835.4615.01
Mid Beach24.60.342.8112.31
Low Beach11.50.251.919.87
311 AprilUpper Beach39.20.875.6214.98
Mid Beach25.00.432.7612.69
Low Beach-
401 MayUpper Beach38.91.054.8715.67
Mid Beach14.90.212.339.06
Low Beach11.60.322.086.01
503 MayUpper Beach37.70.815.6913.24
Mid Beach12.80.232.428.81
Low Beach12.30.041.032.73
610 MayUpper Beach37.90.795.6812.32
Mid Beach19.90.292.968.55
Low Beach16.50.181.828.97
717 MayUpper Beach40.90.865.7115.94
Mid Beach19.70.363.018.48
Low Beach-
820 MayUpper Beach40.90.865.7215.40
Mid Beach19.70.422.998.62
Low Beach-
906 JuneUpper Beach40.80.865.7315.39
Mid Beach11.10.222.6815.14
Low Beach-
1014 JuneUpper Beach40.90.845.7215.02
Mid Beach12.20.713.4715.42
Low Beach11.80.131.155.39
1118 JuneUpper Beach40.20.845.8115.47
Mid Beach15.10.313.048.06
Low Beach7.40.152.147.54
1221 JuneUpper Beach40.90.855.7415.53
Mid Beach16.30.392.648.35
Low Beach9.90.091.4111.61
1324 JuneUpper Beach40.90.845.6815.35
Mid Beach17.00.402.5111.43
Low Beach16.70.221.717.39
1425 JuneUpper Beach40.80.835.7417.21
Mid Beach17.10.422.7311.36
Low Beach11.60.141.624.75
1525 JuneUpper Beach40.80.835.6717.25
Mid Beach17.20.442.5711.49
Low Beach11.80.161.734.50
1602 JulyUpper Beach40.80.845.7114.93
Mid Beach17.40.472.6810.60
Low Beach-
1703 JulyUpper Beach40.80.855.6915.35
Mid Beach17.30.482.6810.85
Low Beach6.50.181.846.96
1804 JulyUpper Beach40.90.835.6915.06
Mid Beach17.40.472.6410.71
Low Beach9.00.301.865.01
1916 JulyUpper Beach40.80.855.7115.21
Mid Beach17.60.422.7410.73
Low Beach12.90.151.927.48
2031 JulyUpper Beach40.70.855.8015.36
Mid Beach19.20.322.611.04
Low Beach10.20.071.112.0
2101 AugUpper Beach40.80.855.7915.41
Mid Beach19.70.302.5710.22
Low Beach-
2228 AugUpper Beach39.40.785.6116.39
Mid Beach15.20.553.067.68
Low Beach6.70.181.217.66
2313 SeptUpper Beach40.80.855.7315.37
Mid Beach13.00.333.038.50
Low Beach-
Table 4. Statistical analysis of cusp spacing for the different cusp levels.
Statistical Analysis Cusp Spacing
Mean (m)Standard Deviation (m)Coefficient of Variation
Upper beach level40.260.950.02
Mid beach level18.175.480.30
Low beach level11.092.910.26
Table 5. Performance of different theories to predicting Cusp spacing, as measured by Root Mean Square Error (RMSE), Regression coefficient (r2), and best-fit parameters.
Performance Cusp Spacing Predictions
TheoryRMSE (m)r2EquationFitting Coefficient
Edge-Wave Theory4.780.087 λ c = m g π T 2 s i n β m = 0.4845
Self-Organisation Theory2.030.642 λ c = f S f = 1.1628
Sunamura (2004)2.370.473 λ c = A φ T g H A = 0.7032
Table 6. Highlighting the hydrodynamics most likely responsible for the changing mid beach level cusp spacing, based on the relationship found between the self-organisation theory and the analysis of the lower beach level cusps.
Resulting Hydrodynamics for Mid Beach Level Cusps
SurveyDateObserved Cusp Spacing (m)Predicted Self Organisation (m)Occurrence
126 March38.4837.8103/03/2019T00:00
210 April24.6422.9009/04/2019T04:00
311 April25.0523.2211/04/2019T08:00
401 May14.9714.9730/04/2019T18:00
503 May12.8412.2701/05/2019T08:00
610 May19.9020.0409/05/2019T10:00
717 May19.7119.6316/05/2019T10:00
820 May19.6819.6316/05/2019T10:00
906 June11.1511.8904/06/2019T06:00
1014 June11.1911.2413/06/2019T14:00
1118 June15.0712.0316/06/2019T22:00
1221 June16.3112.8519/06/2019T22:00
1324 June17.0517.4523/06/2019T18:00
1425 June17.1217.4523/06/2019T18:00
1525 June17.1517.4523/06/2019T18:00
1602 July17.3717.4523/06/2019T18:00
1703 July17.3117.4523/06/2019T18:00
1804 July17.3917.4523/06/2019T18:00
1916 July17.5515.6315/07/2019T20:00
2031 July19.2320.7425/07/2019T22:00
2101 Aug19.6520.7425/07/2019T22:00
2228 Aug15.1918.9127/08/2019T19:00
2313 Sept13.0116.7913/09/2019T05:00
Table 7. Performance of different equations in predicting cusp parameters (cusp elevation, cusp depth, and cusp amplitude), as measured by Root Mean Square Error (RMSE), Regression coefficient (r2), and best-fit parameter.
Prediction Cusp Parameters
ParameterEquationFitting CoefficientRMSE (m)R
Cusp Elevation C e = n e   S ne = 0.1710.5850.810
Cusp Depth C d = n d   S nd = 0.6362.9980.648
Cusp Amplitude C a = n a   S na = 0.0230.1240.697
Publisher’s Note: MDPI stays neutral with regard to jurisdictional claims in published maps and institutional affiliations.