2. Proposed Kinetic Equation
It is proposed that the reactions to reduce the frame pressure are proportional to the frame pressure
, to the pore surface area,
, to the frame surface area,
, and to one (or a sum of) Arrhenius factors,
. The exponent 1.33 = 4/3 is the fractal dimension of a percolation front and twice the surface dimension 2/3 of smooth solids. R is the ideal gas constant (8.314 J/(mol·deg K), T is temperature in Kelvin. The fractional change in
thus proposed and supported is
or equivalently
The Arrhenius frequency factor, A, is not expected to depend
strongly on T for the surface reaction. Here
m and
n are expected to be close to 1.0 and greater than 0.5, contact areas being less than fractal because of the finite size of atoms. m and n may be different because water-to-grain and grain-to-grain interfaces differ. Notably this mechanism is primarily a dimensional argument and lacks terms relating to the sizes, shapes, and composition of pores and grains. (For
more inclusive approaches see [
4]). Fractional water saturation,
, might reduce compaction but is set to 1 and omitted hereafter.
3. Data
Porosity versus depth profiles from the literature [
5,
6,
7,
8,
9] for six shale sections are used here. The shales are unrelated and not chosen because of similarities. Sample-based profiles were included in a recent comprehensive survey of 21 geologic sections and laboratory studies of clays [
10]. All profiles are included in an engineering correlation [
11] which included two seismicly-inferred porosity profiles [
6]. They were chosen because geologic age ranges, basin types, and basin names were available [
11]. All porosity—depth profiles will be referred to as ‘wells’ for brevity. Map coordinates were known only for the two Makran seismically-inferred porosity-depth profiles. For actual wells, no formal well names were given, and data from several local wells were combined. Temperatures are not available for any wells. Paleo surface temperature estimates are made on the basis of paleoenvironments, paleolatitude, and geologic age,
Table 1. Sediment surface temperatures of 3 °C are assigned to wells from abyssal plains. Shallow sea [
8] or lake environments [
9] are assigned expected land paleotemperatures, corrected for paleolatitudes, and for any intervening high temperature events such as the Eocene high [
12]. If two estimates are made they are averaged. The sediment surface temperature used for the Sulu Sea, 13 °C, was known for the deepest point [
13]. The paleo-surface-temperature estimates are less important to this study than are paleo-geothermal-gradients, as the compaction mechanism discussed hereafter becomes noticable deeper at the higher well temperatures and at porosities less than 0.5. Because the Earth is cooling as radioactivity and initial energy of assembly decline, and because these wells were drilled/investigated in areas where temperatures were supposed to be high enough to generate petroleum, minimum paleo-geothermal-gradients of 0.03 °C/m were initially assigned. The well surface and temperature gradient estimates used here are well within present day experience [
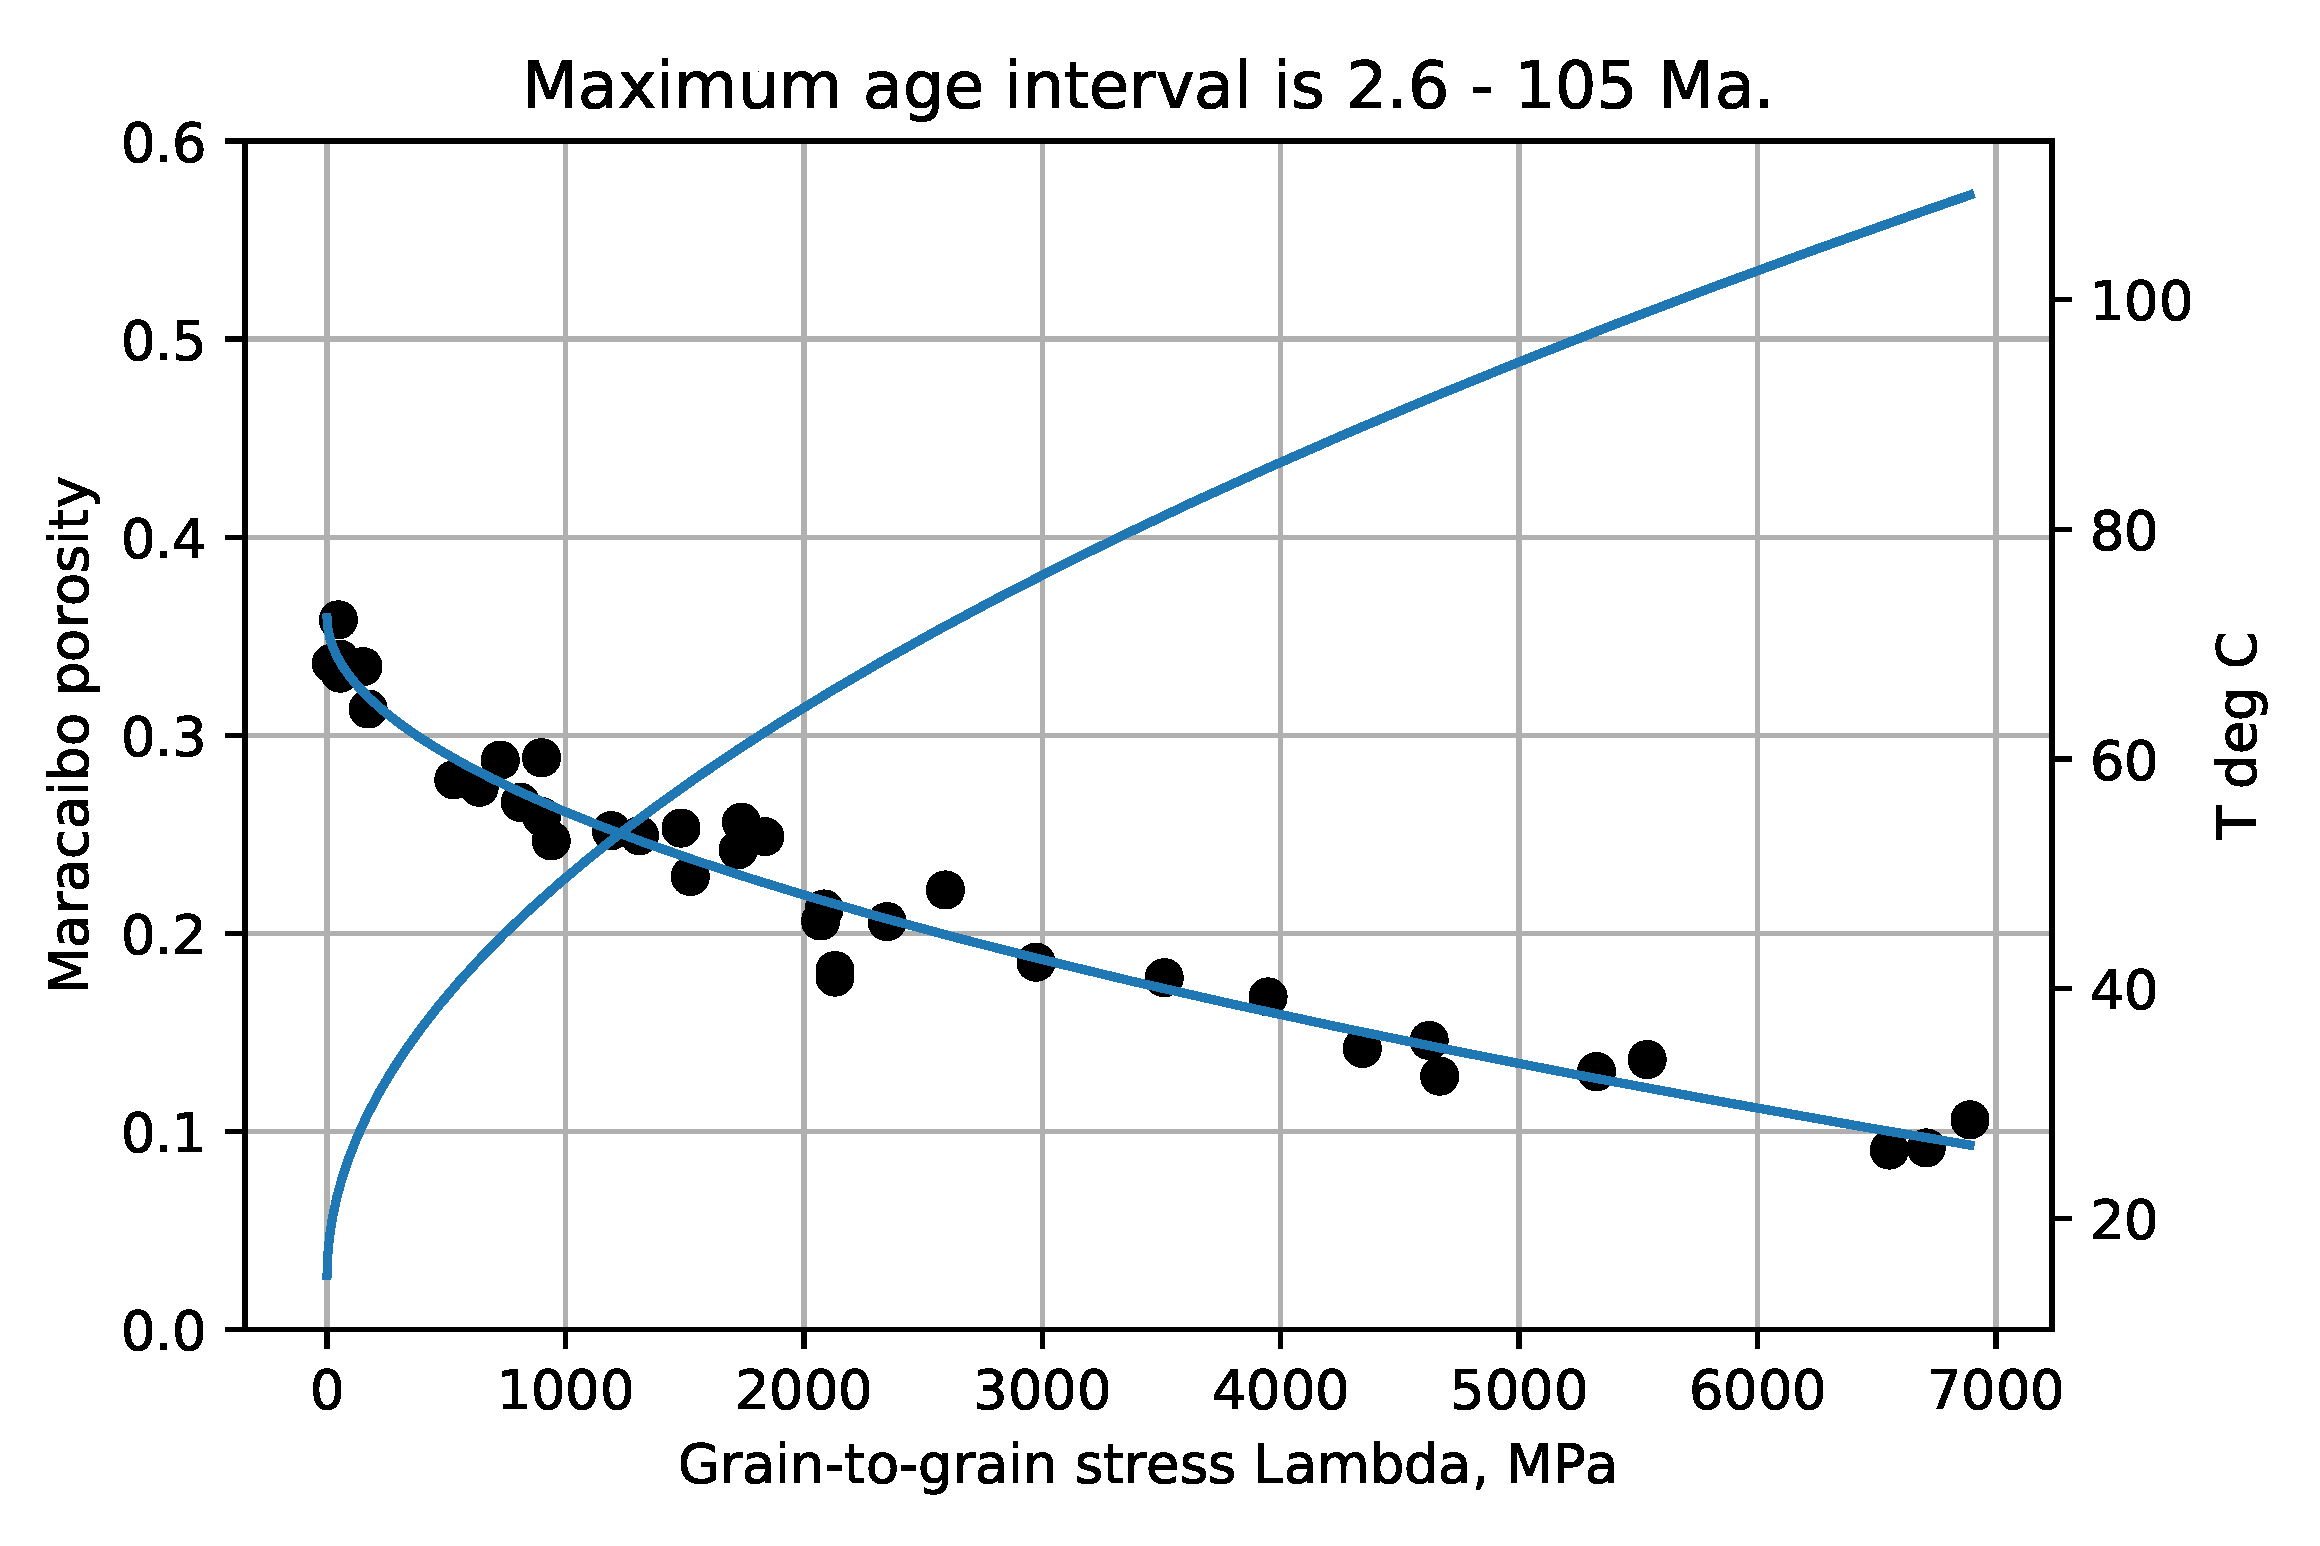
14]. A paleo-geothermal-gradient of 0.05 °C/m was assigned to the Akita well, and to the Maracaibo back-arc well, on the basis of necessary organic maturity [
5]. In Northeast Oklahoma nearby sedimentary rock mineralization and granite outcrop [
15] suggest a higher paleo-geothermal-gradient, perhaps 0.06 °C/m as assigned.
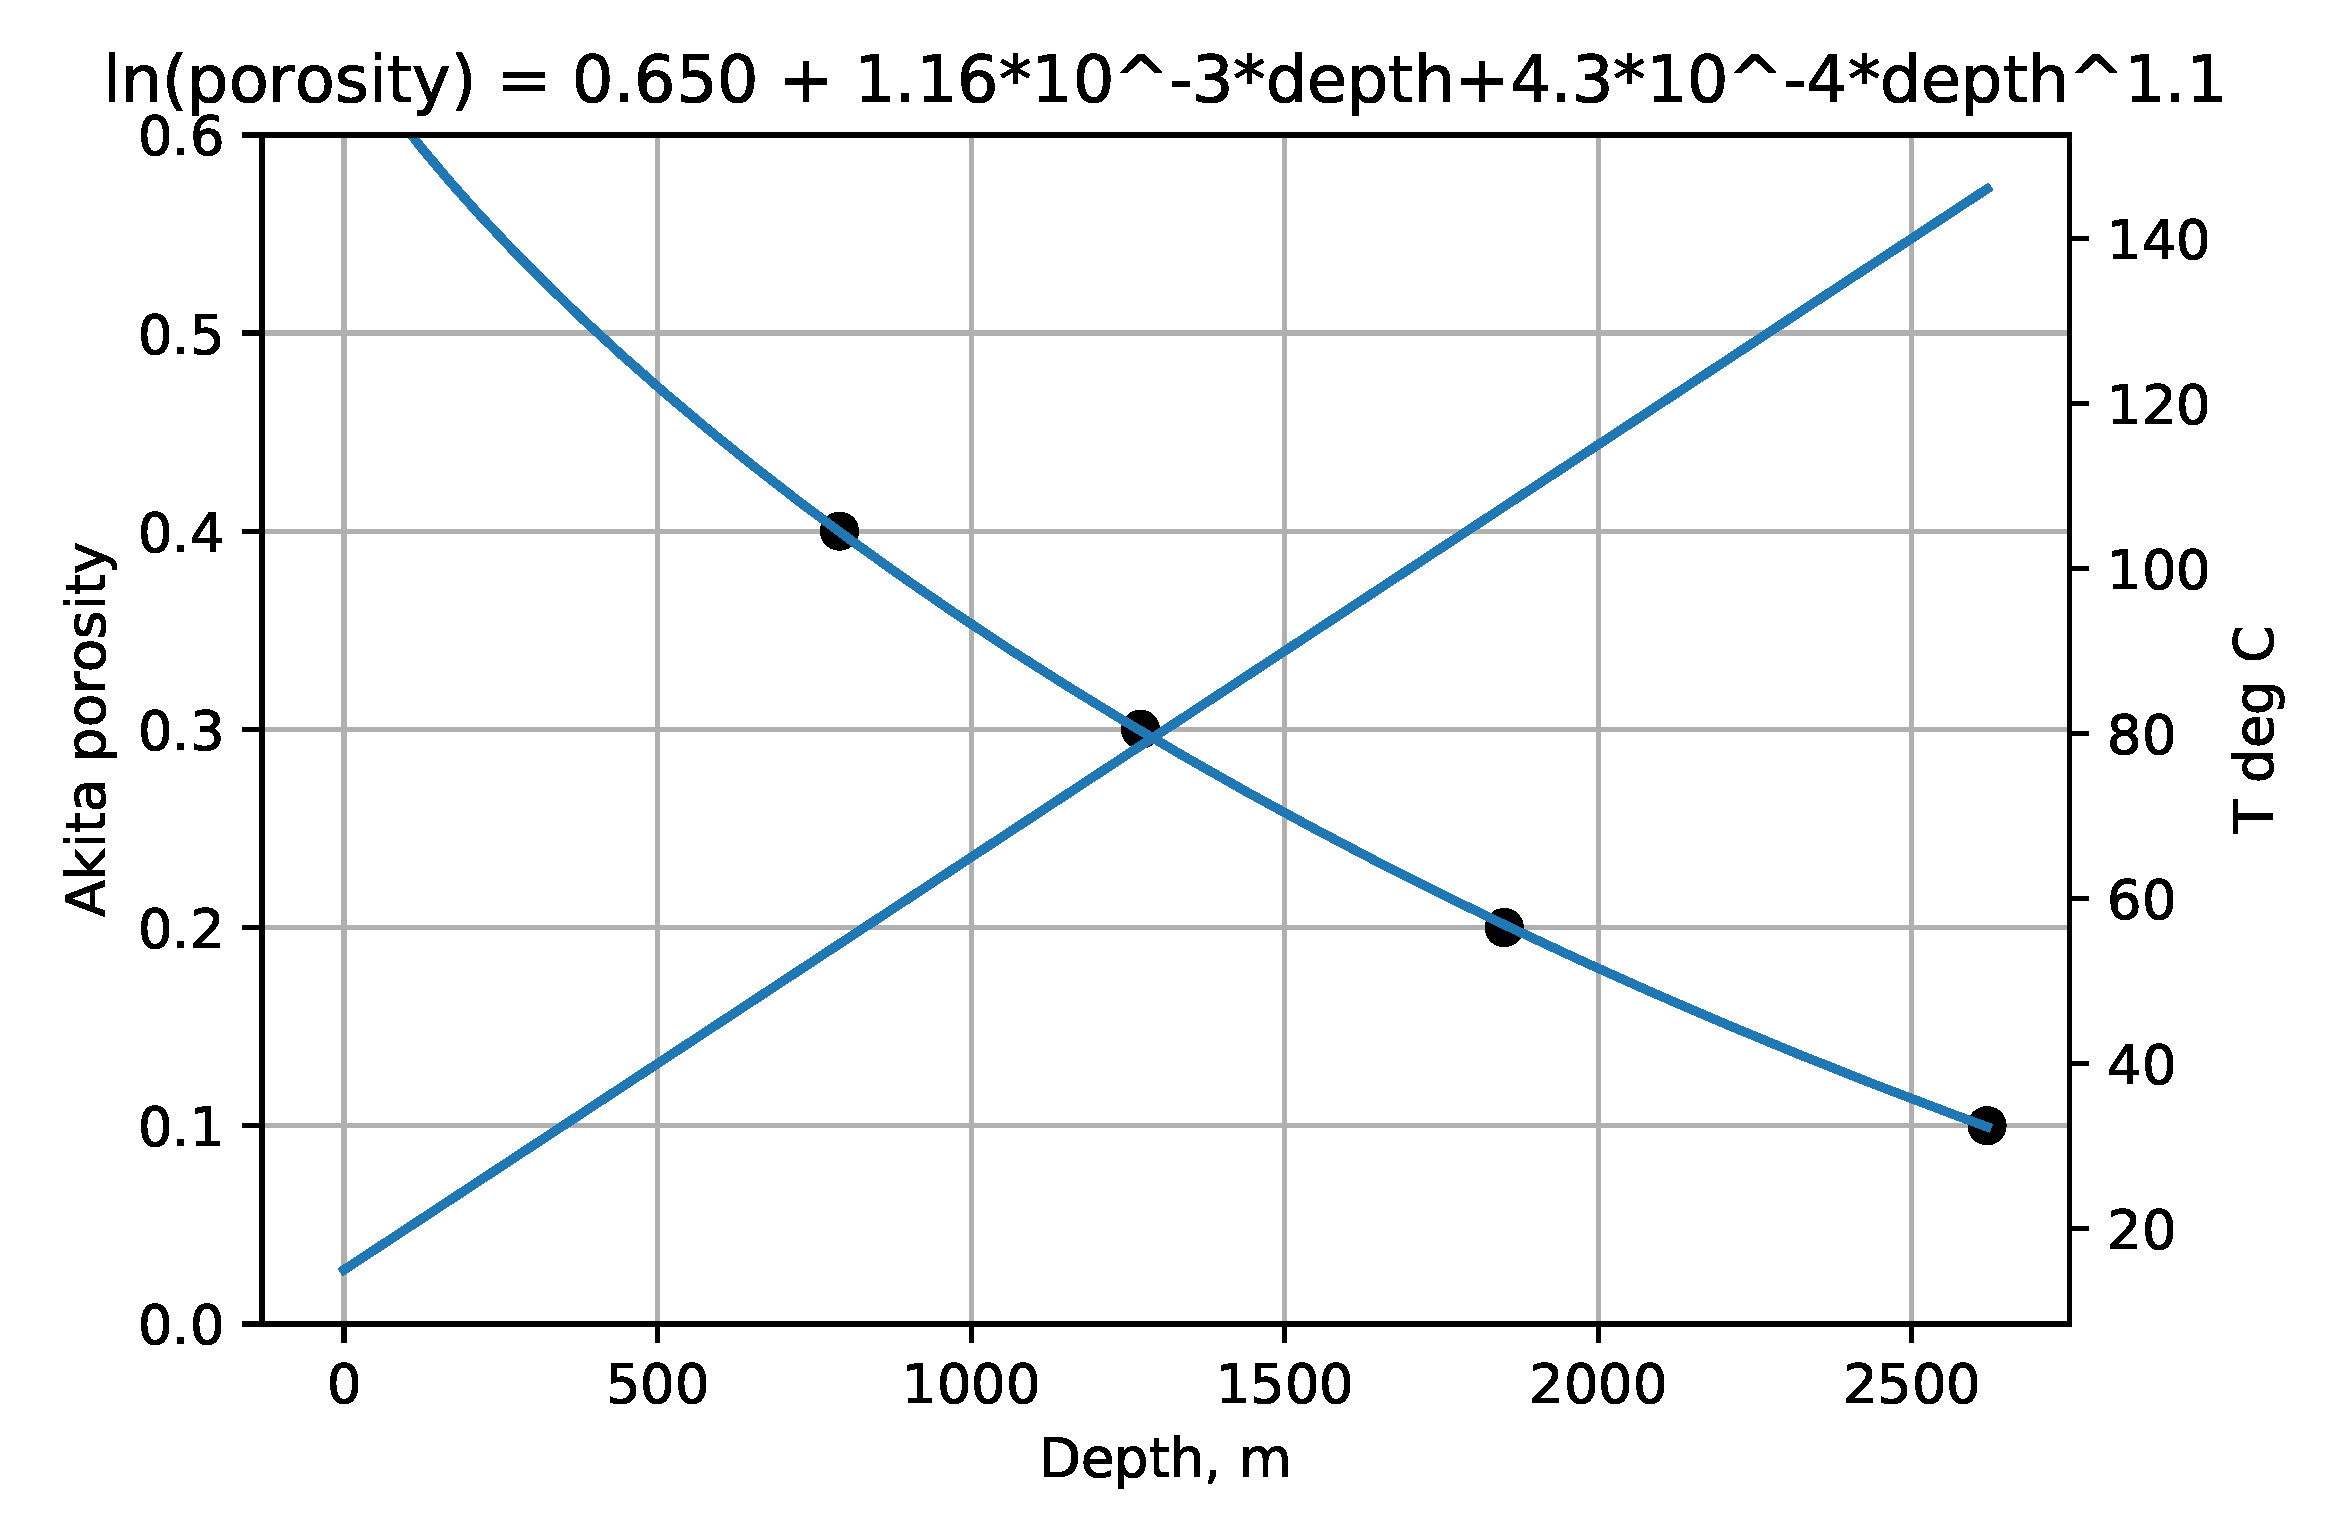
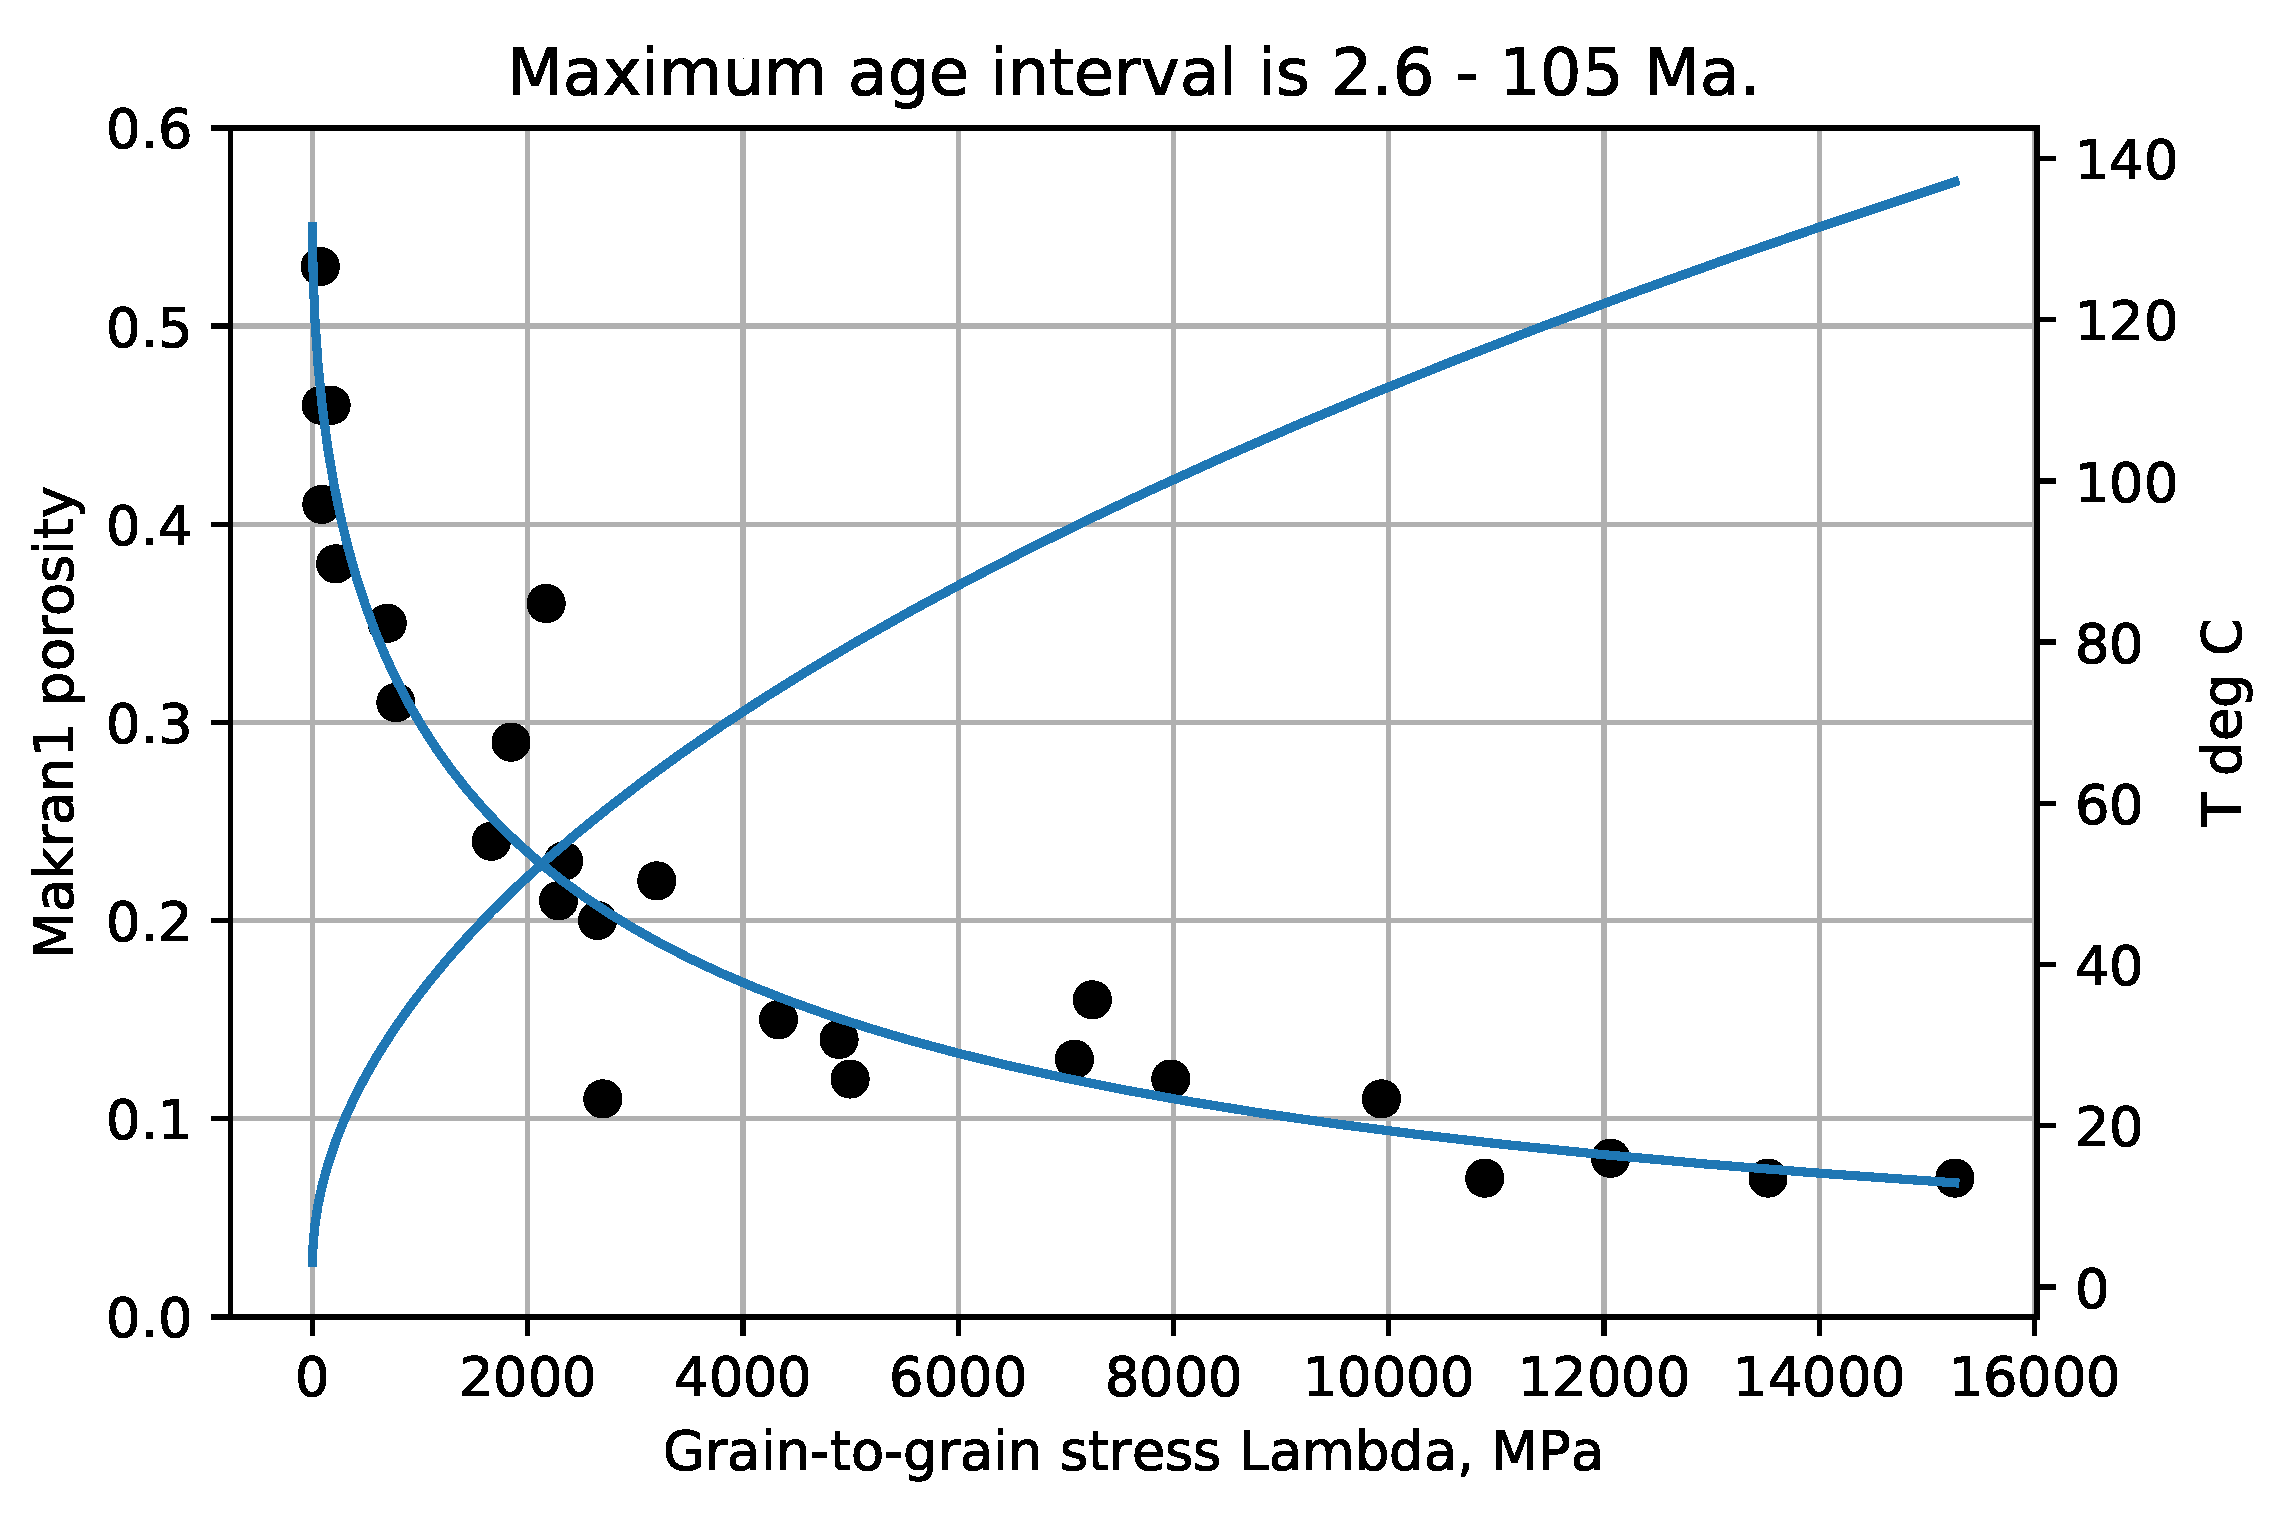
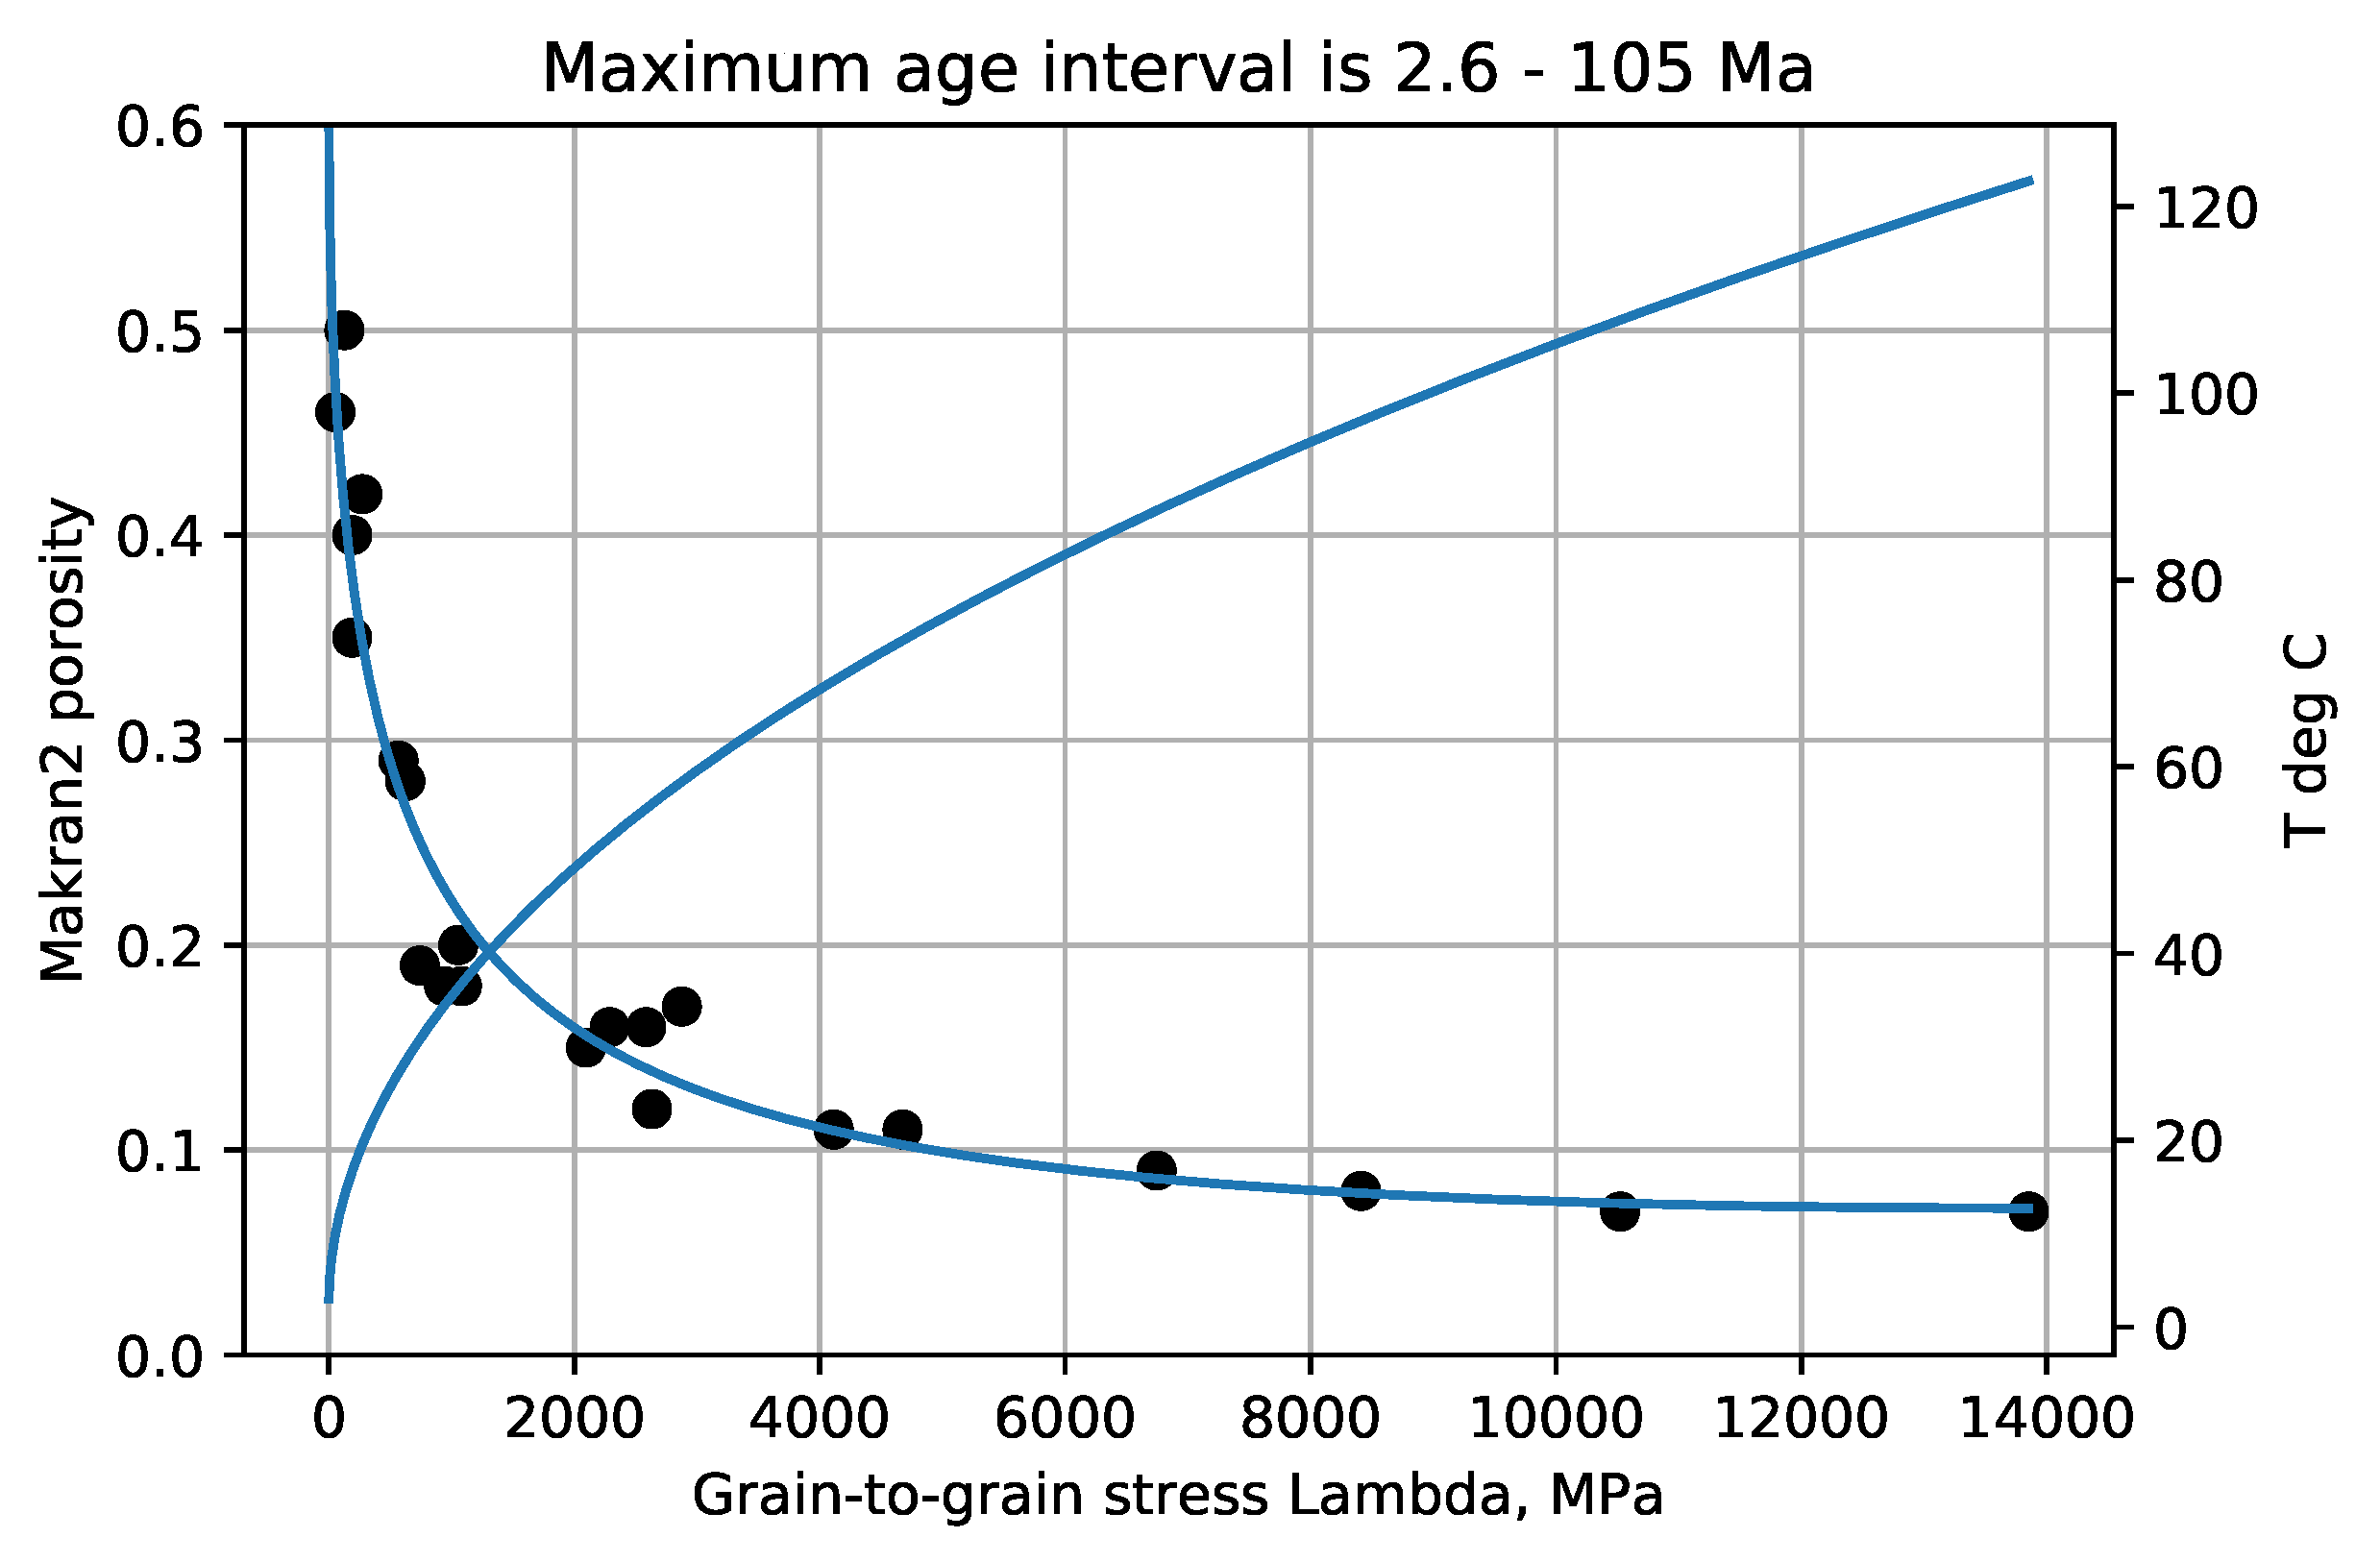
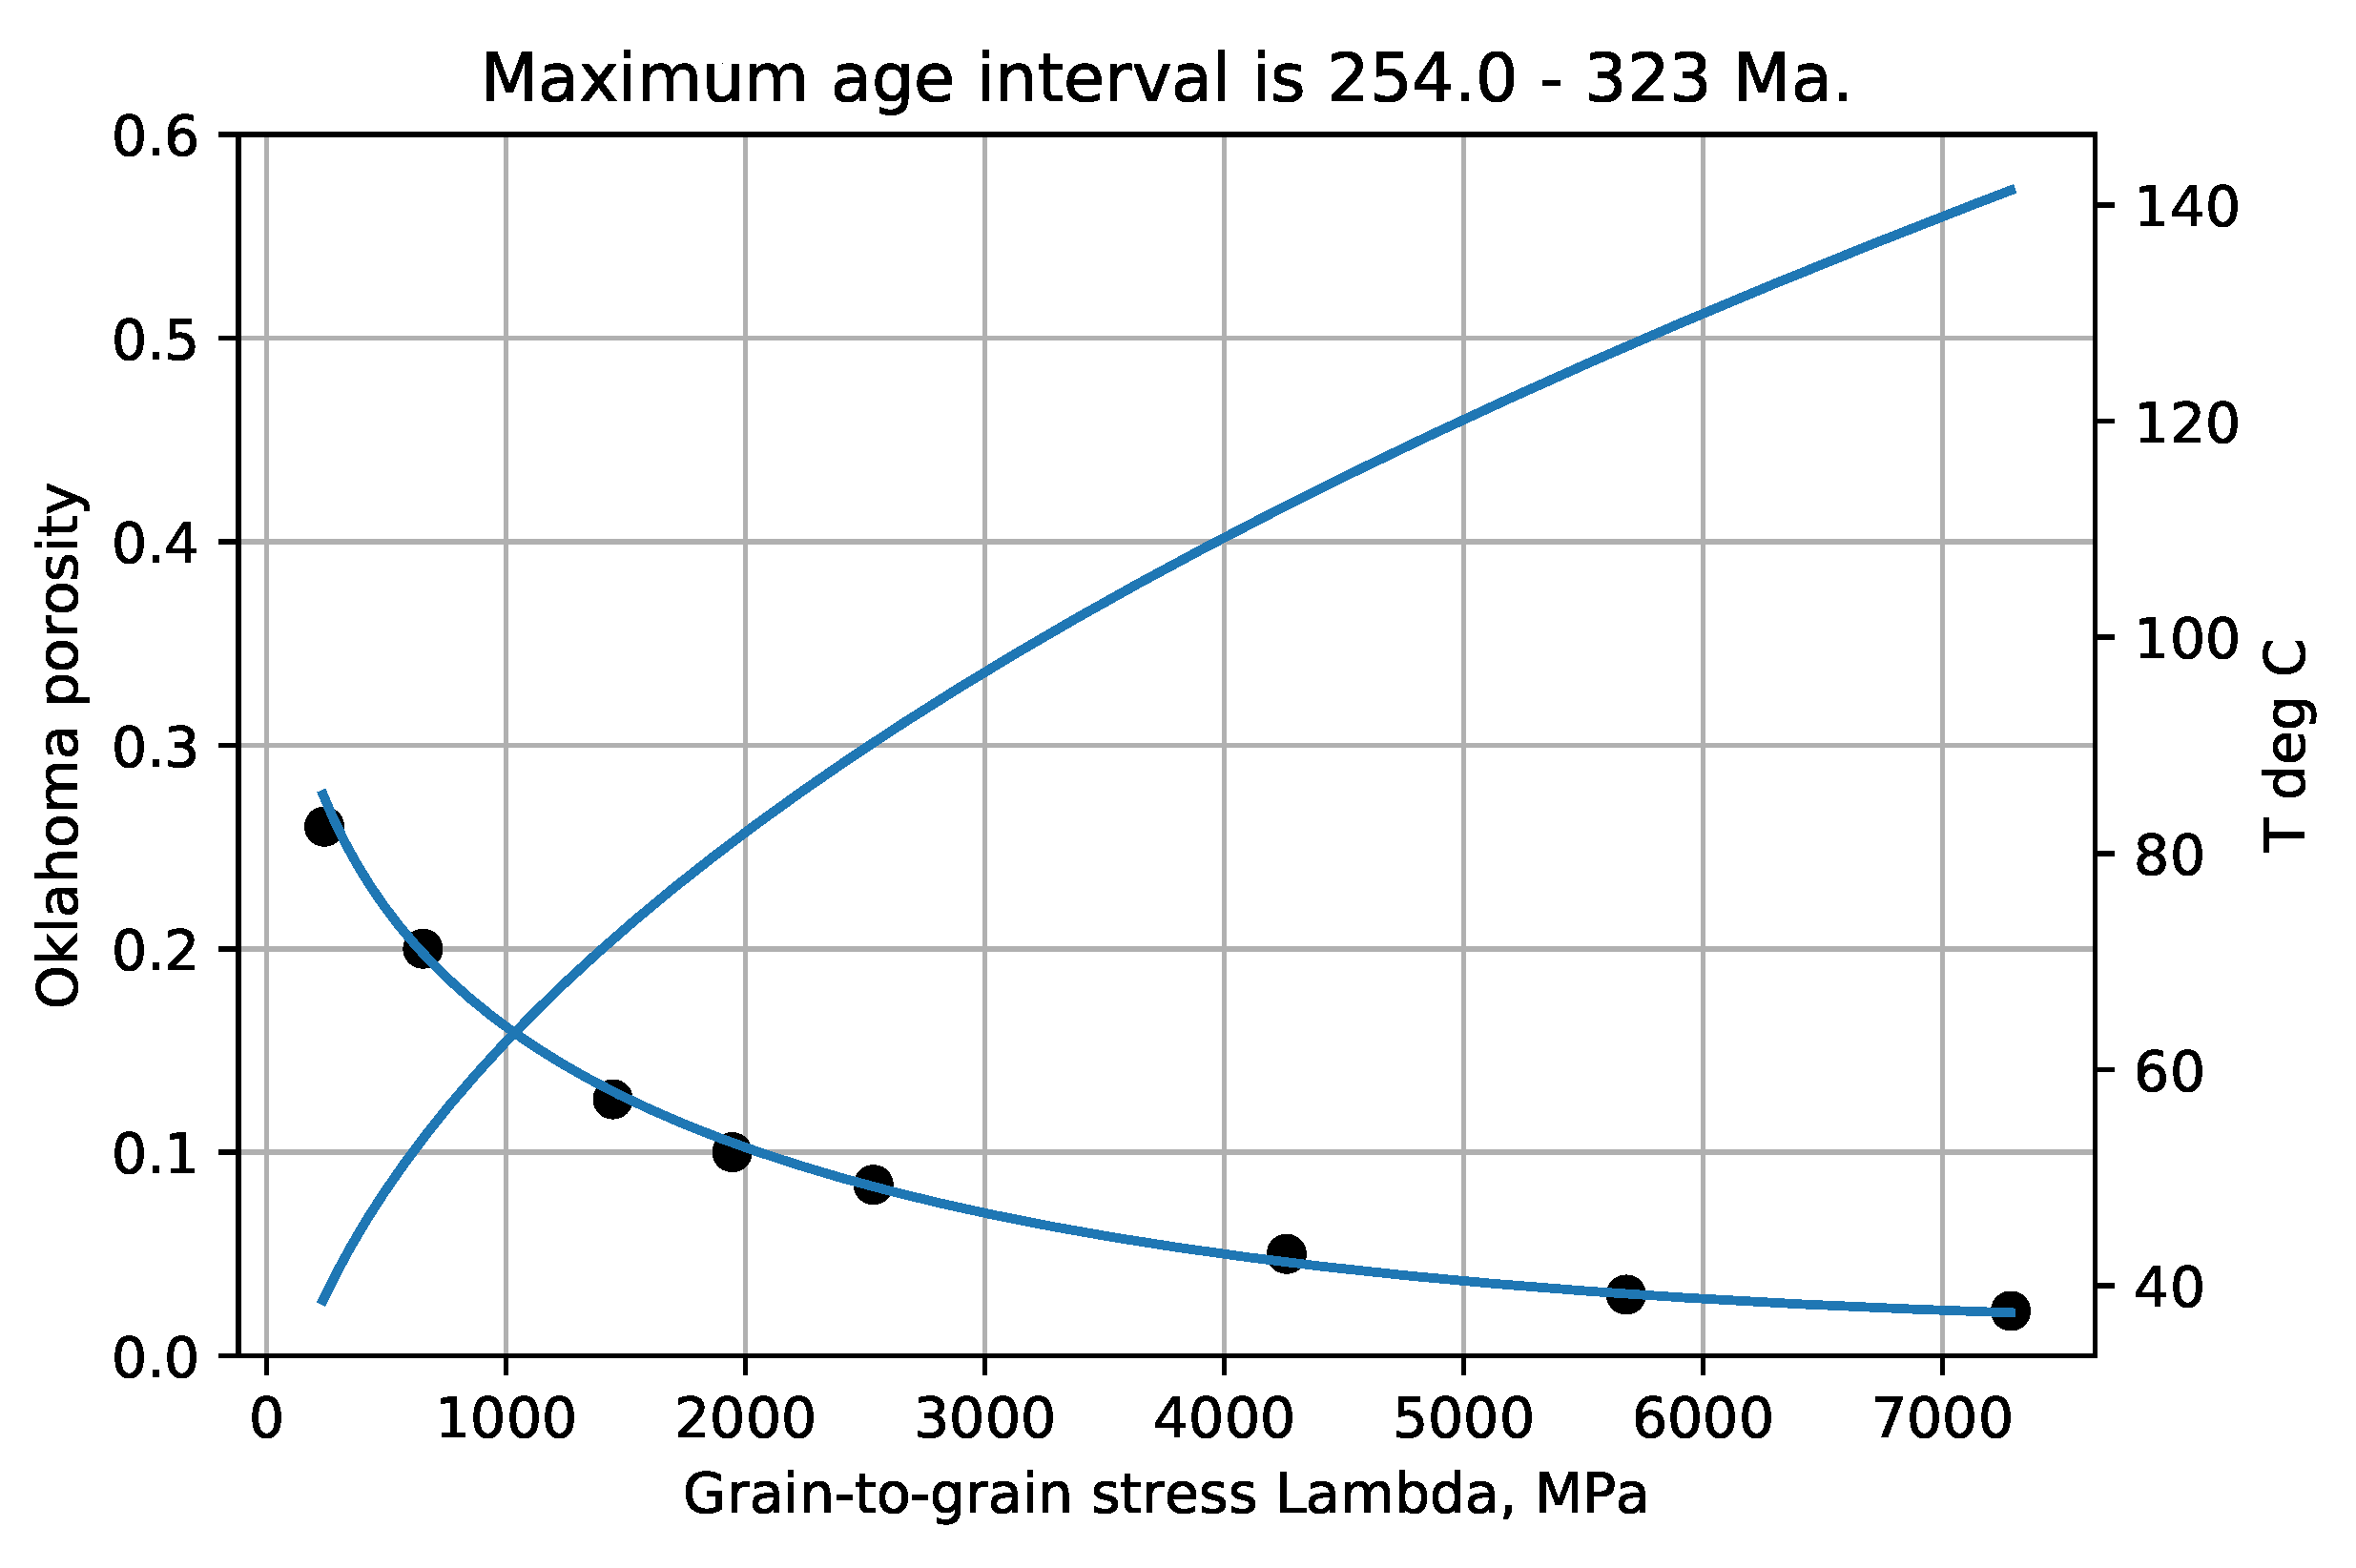
Figure 1,
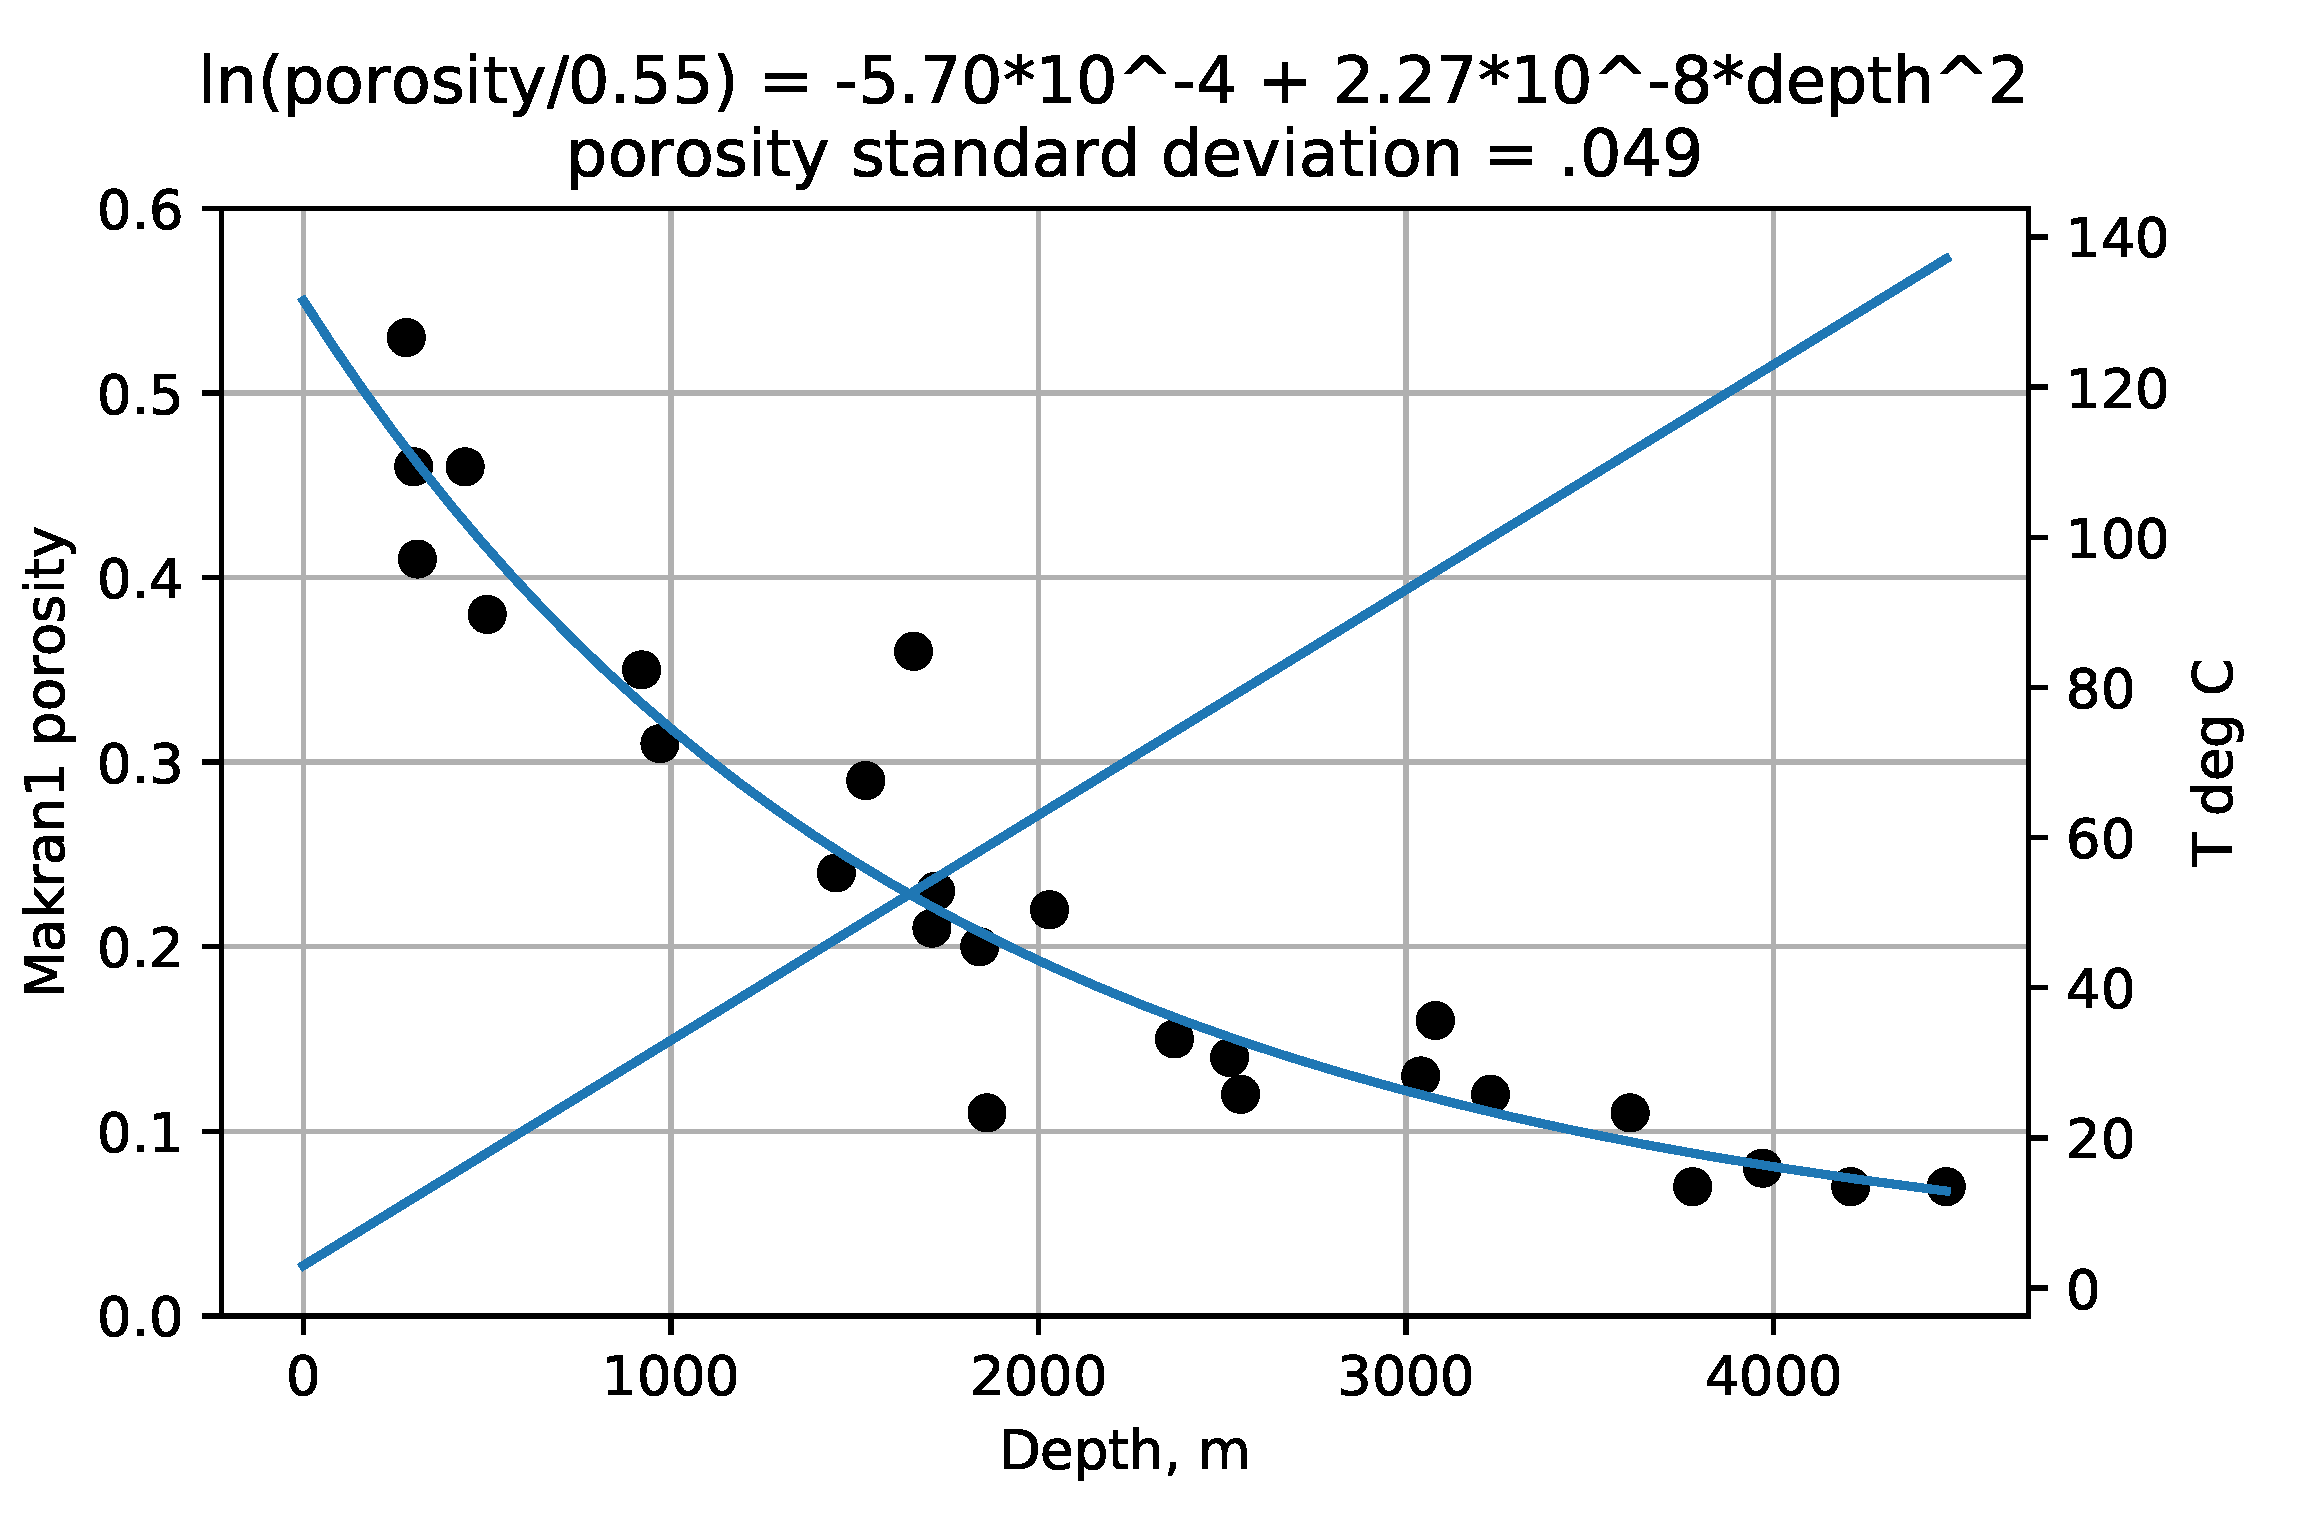
Figure 2,
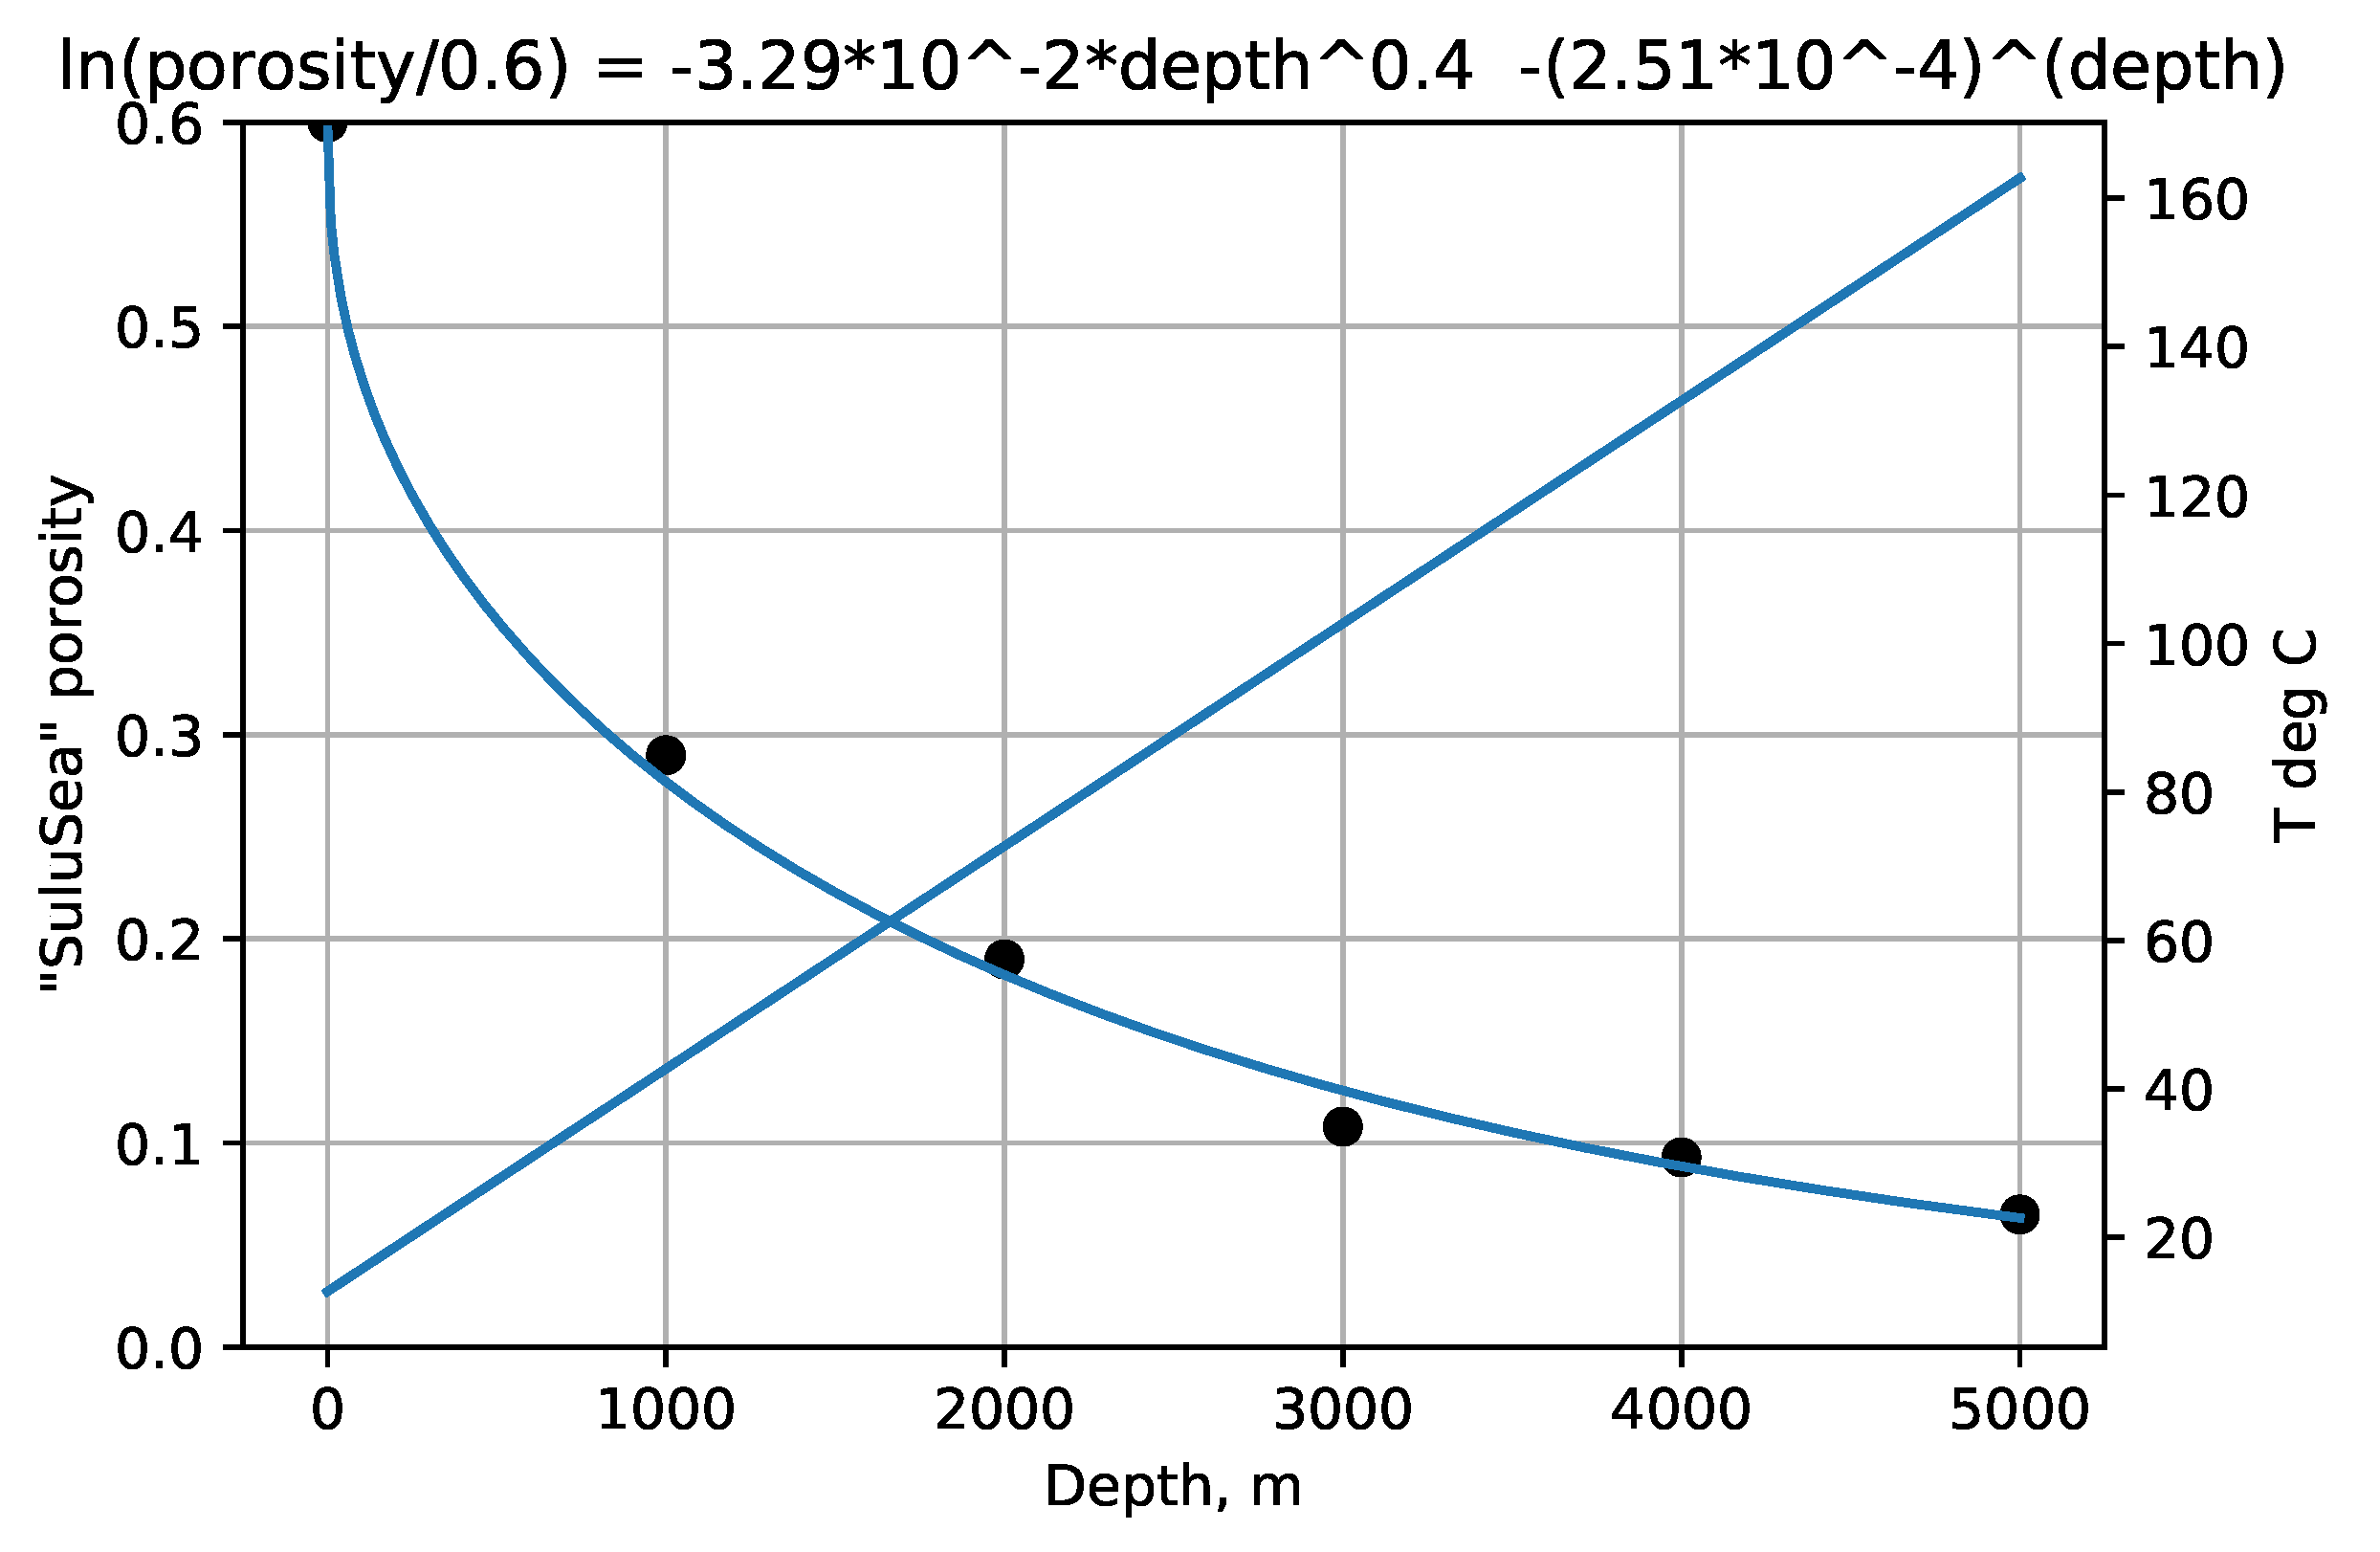
Figure 3,
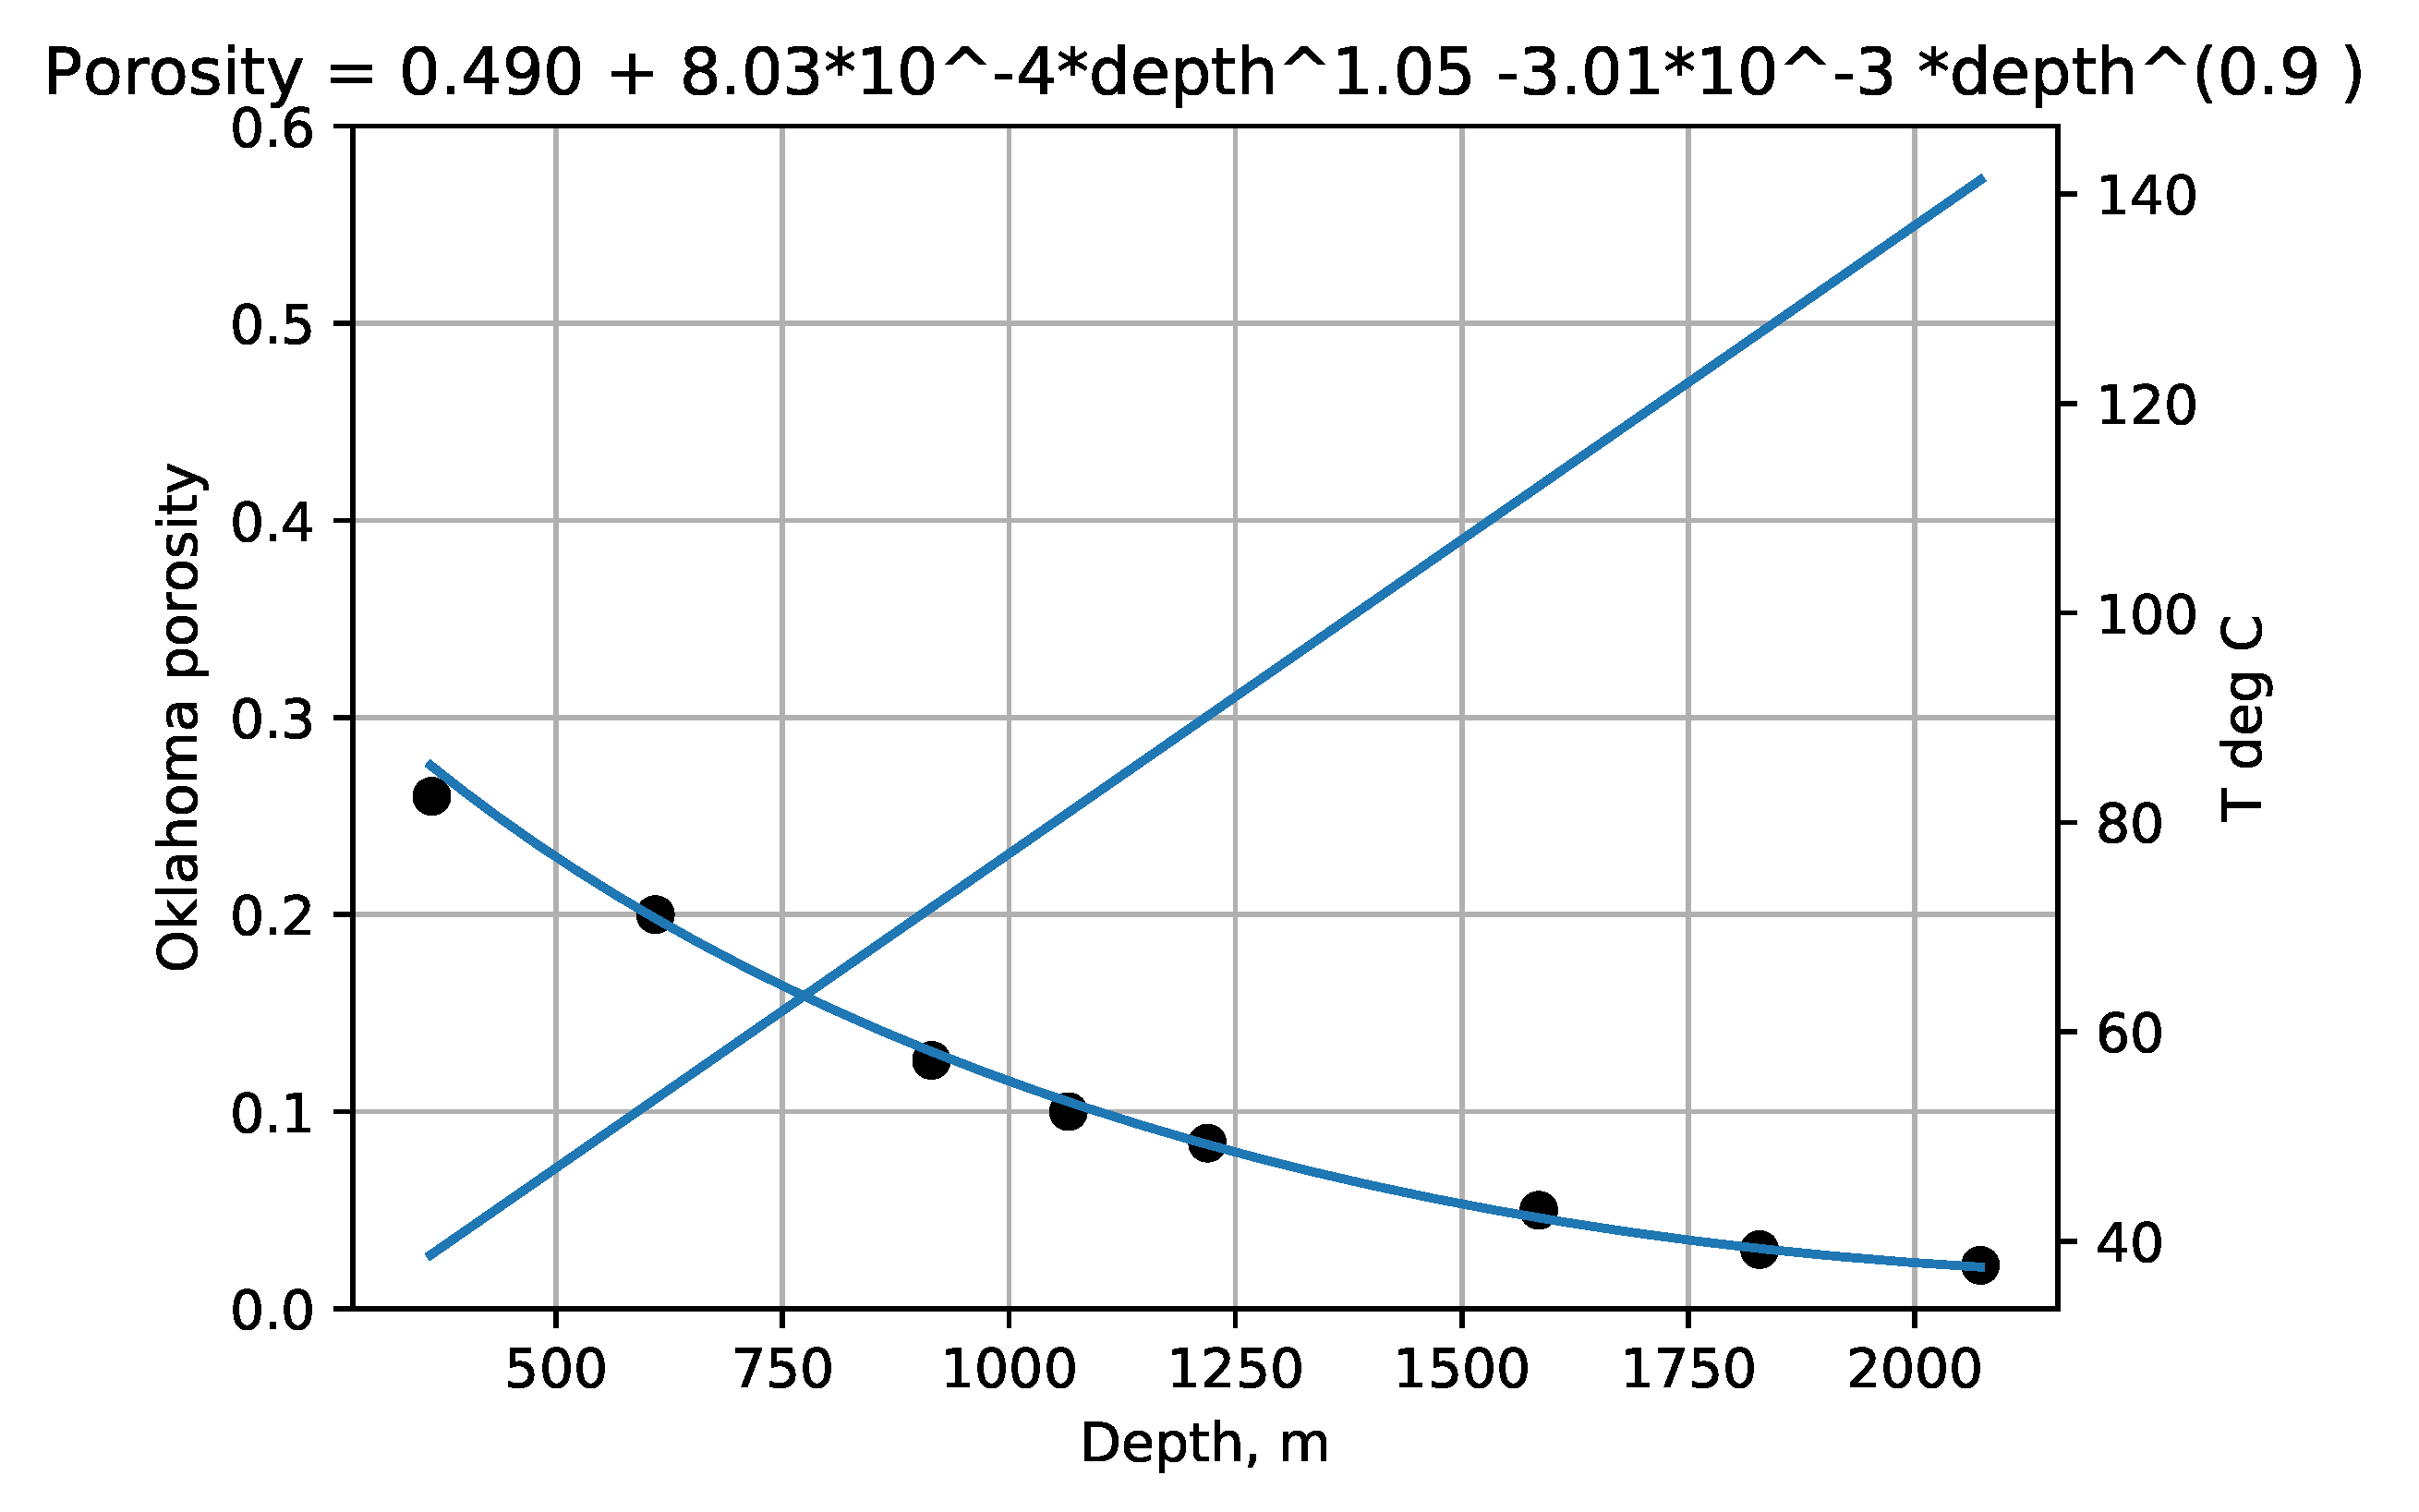
Figure 4,
Figure 5 and
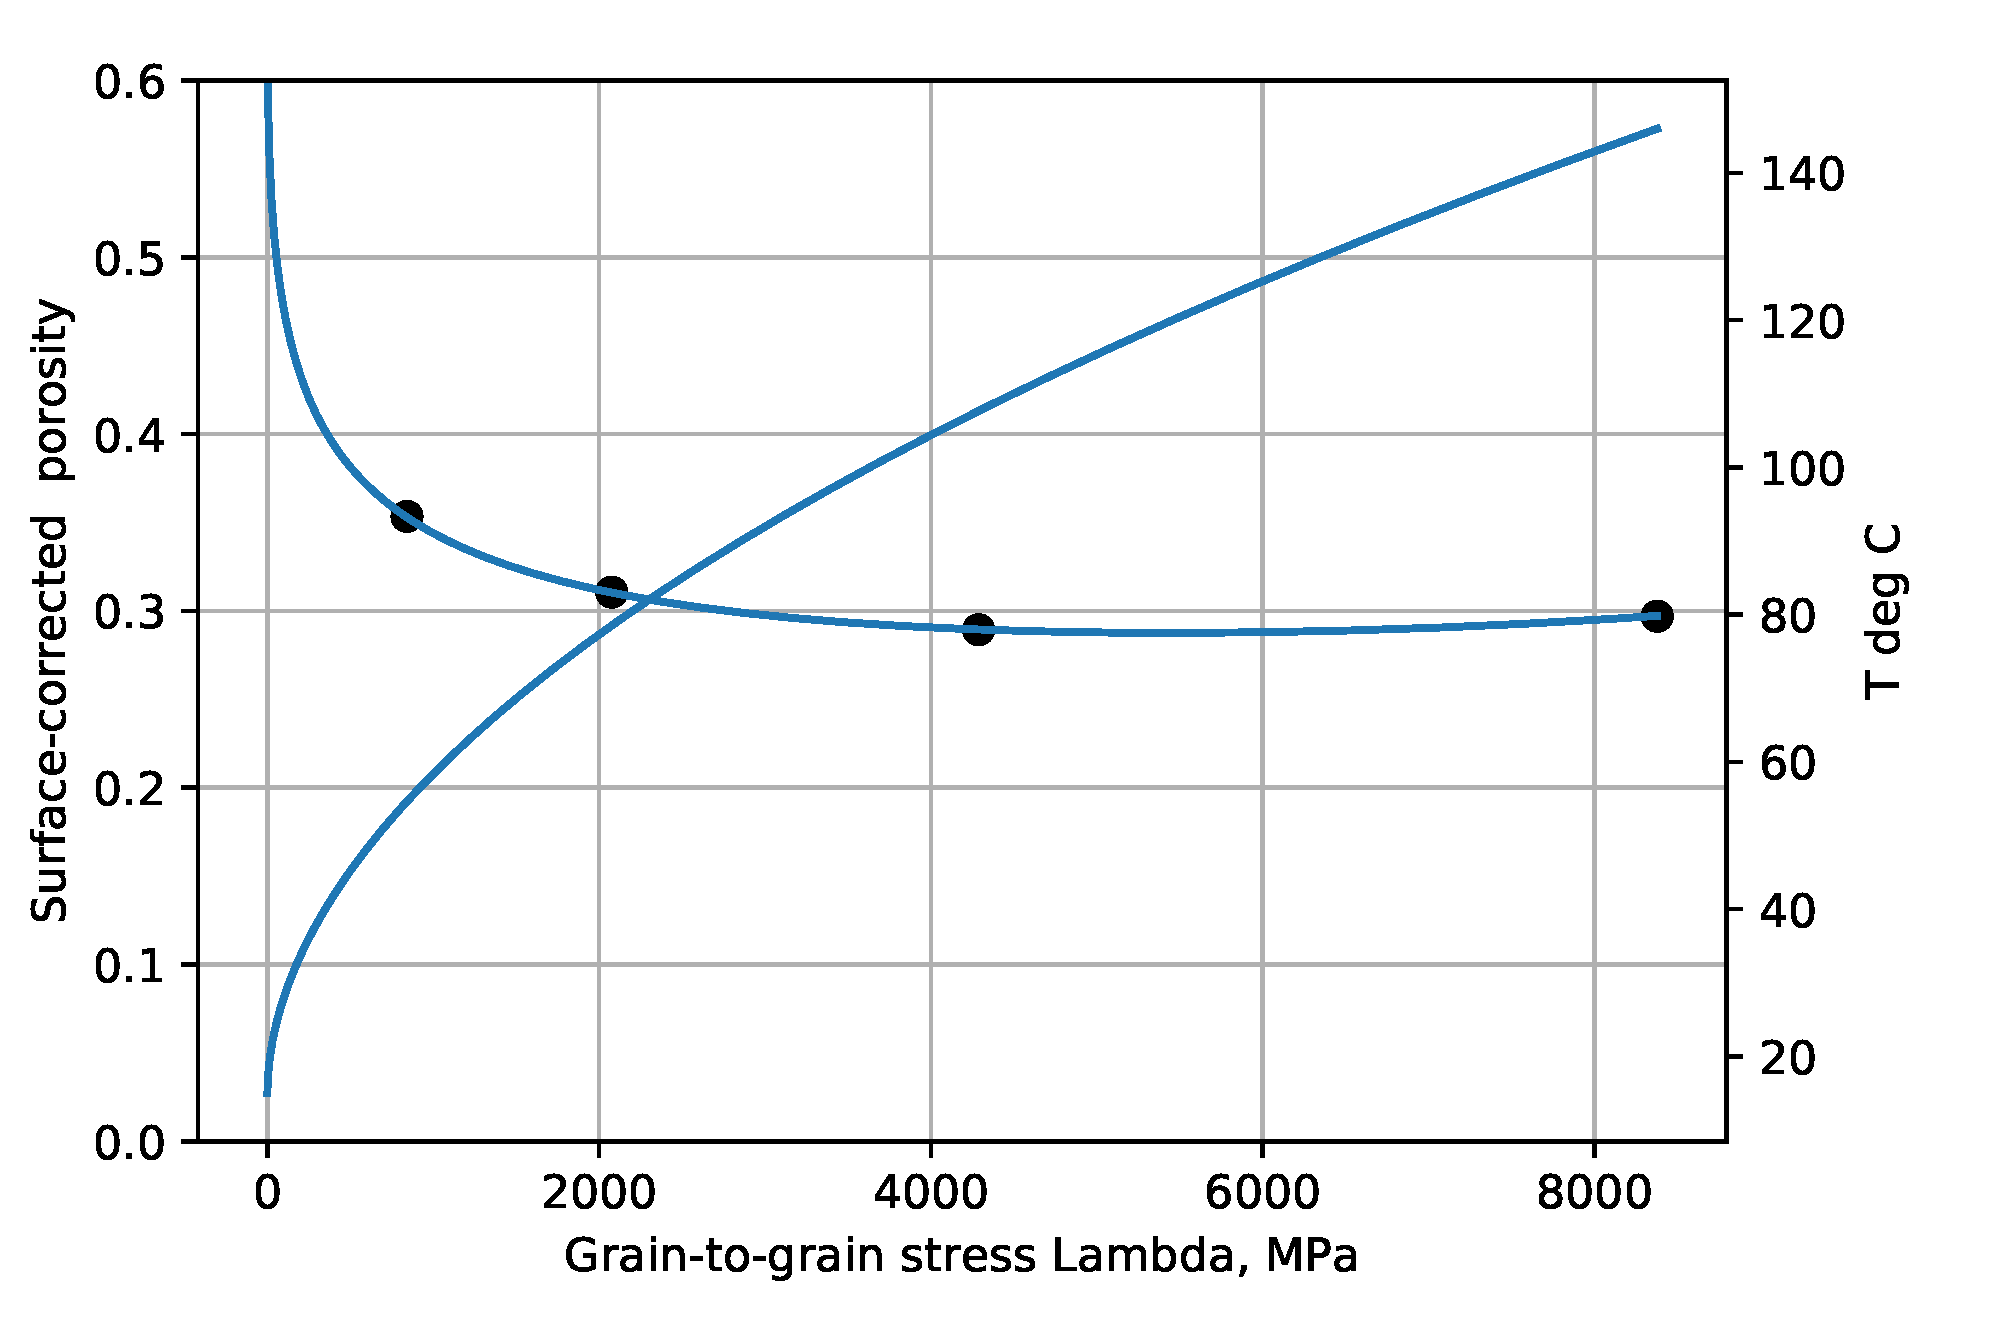
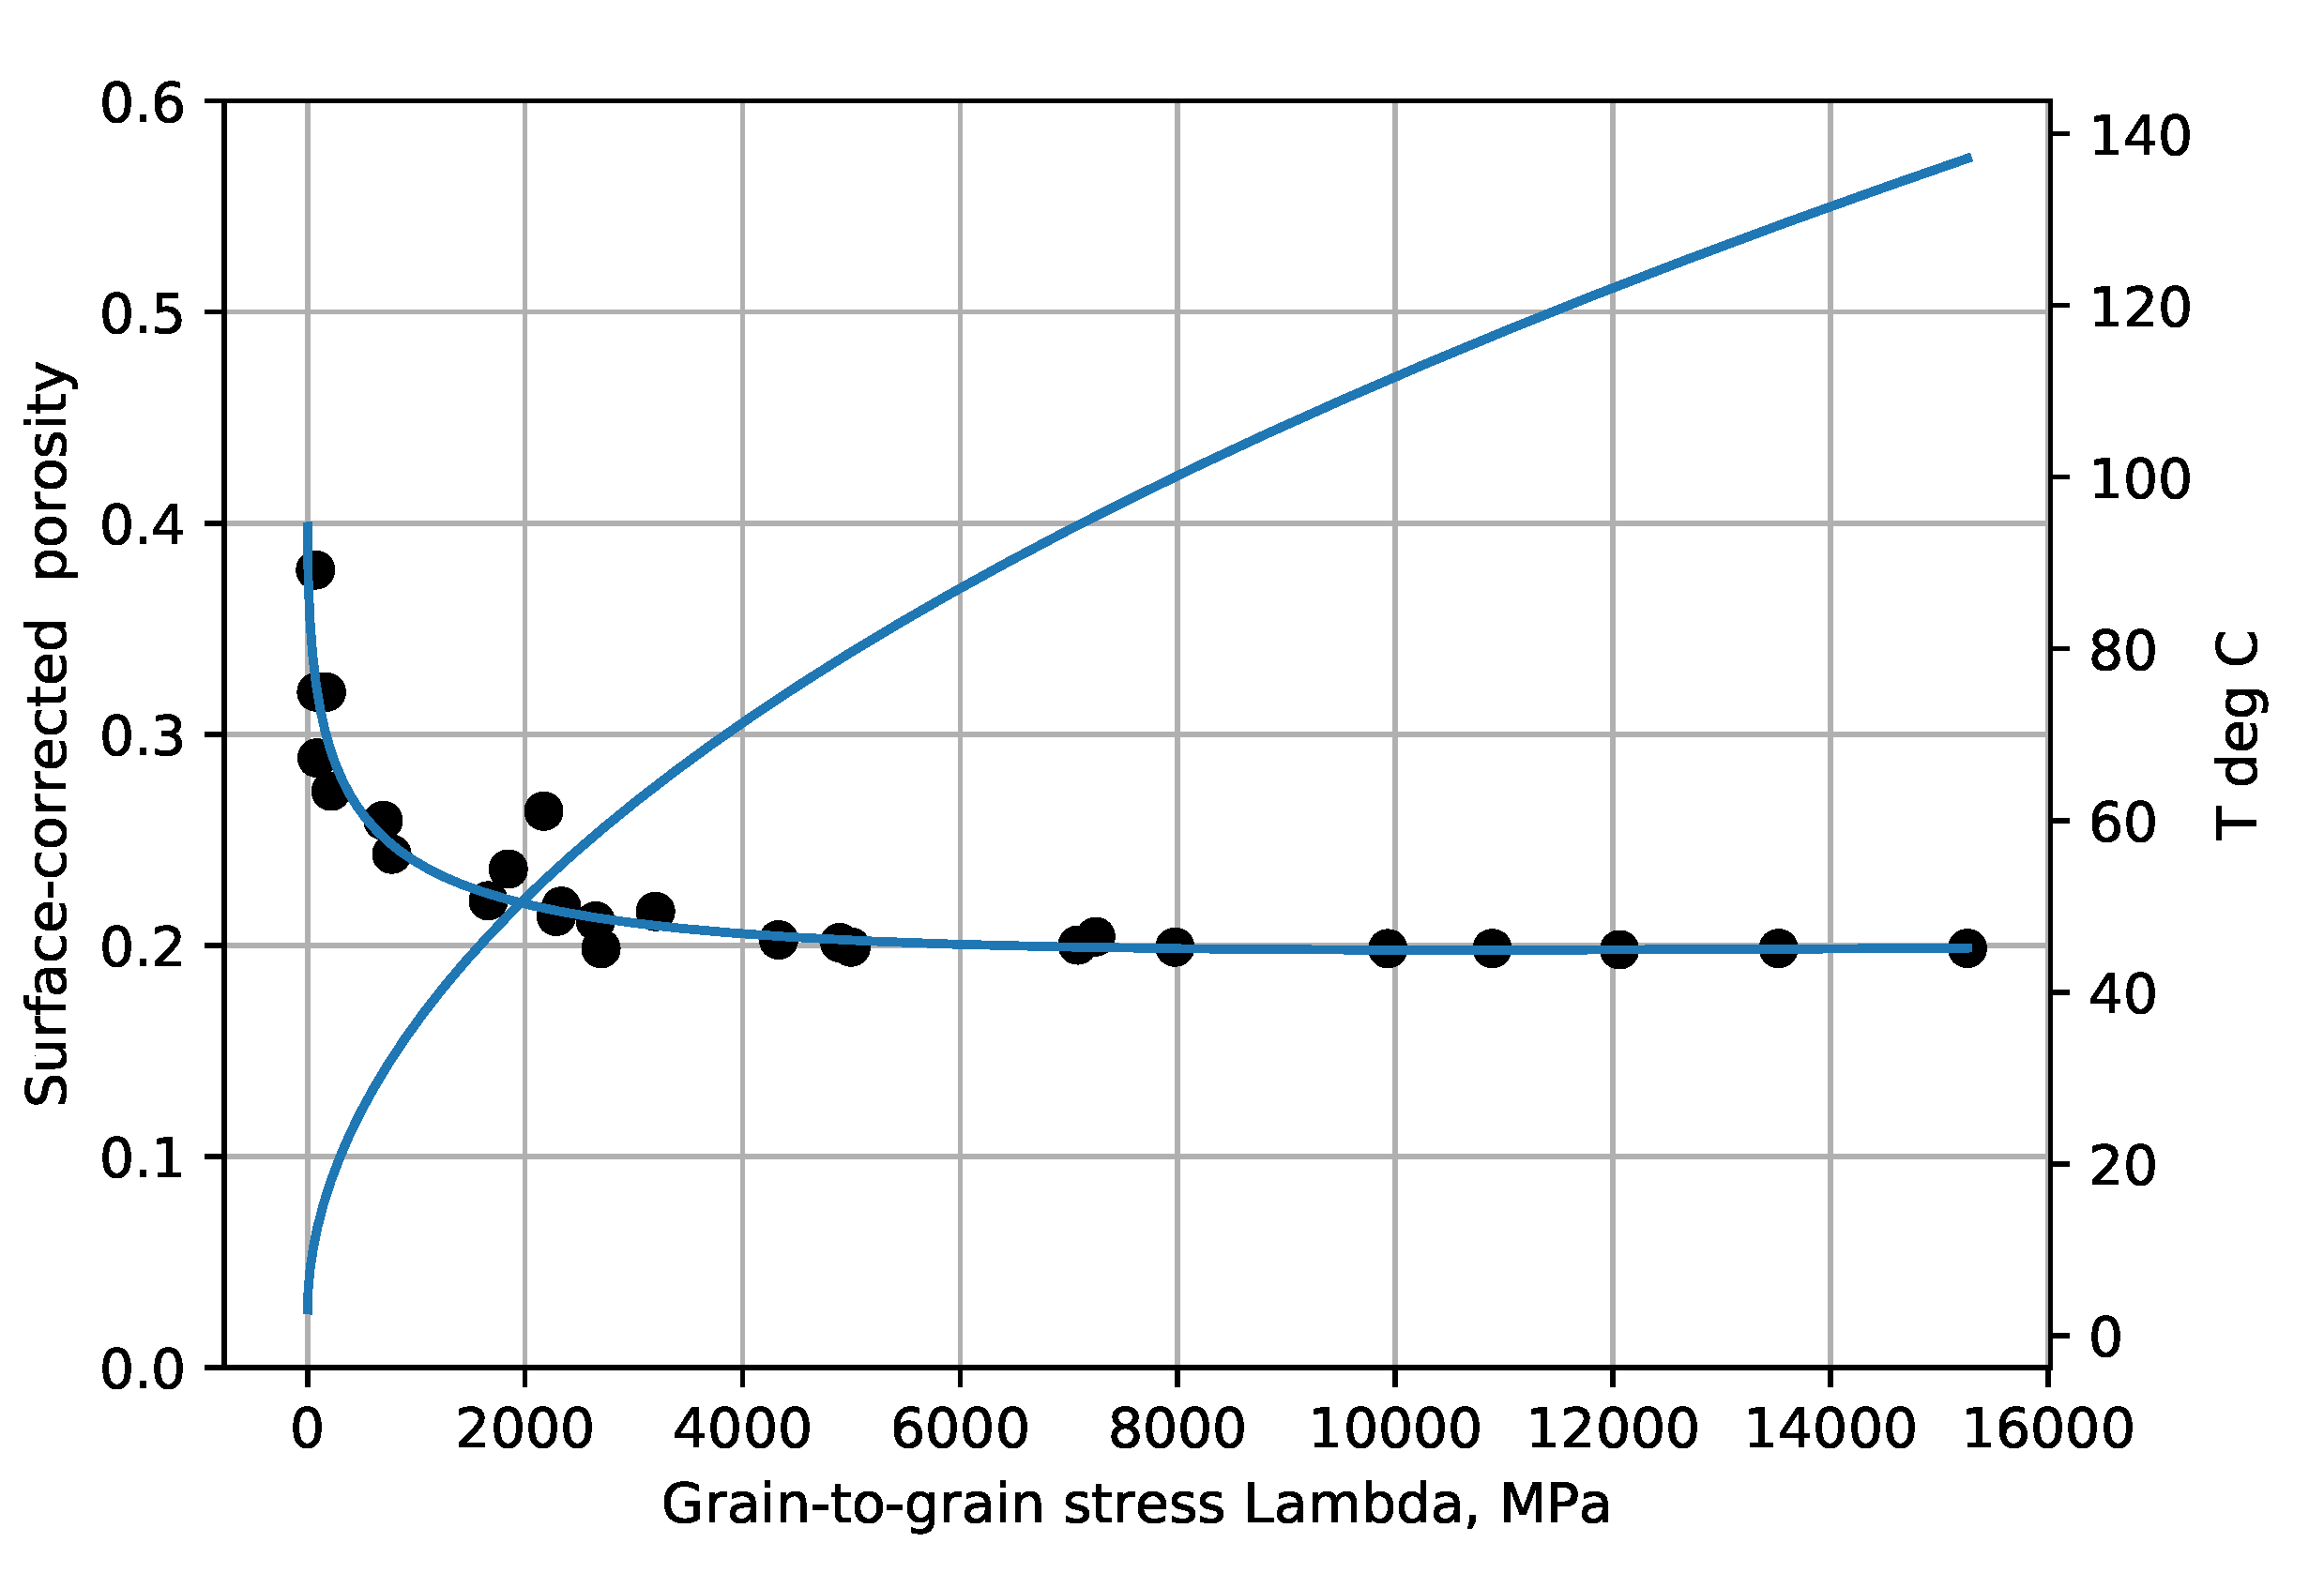
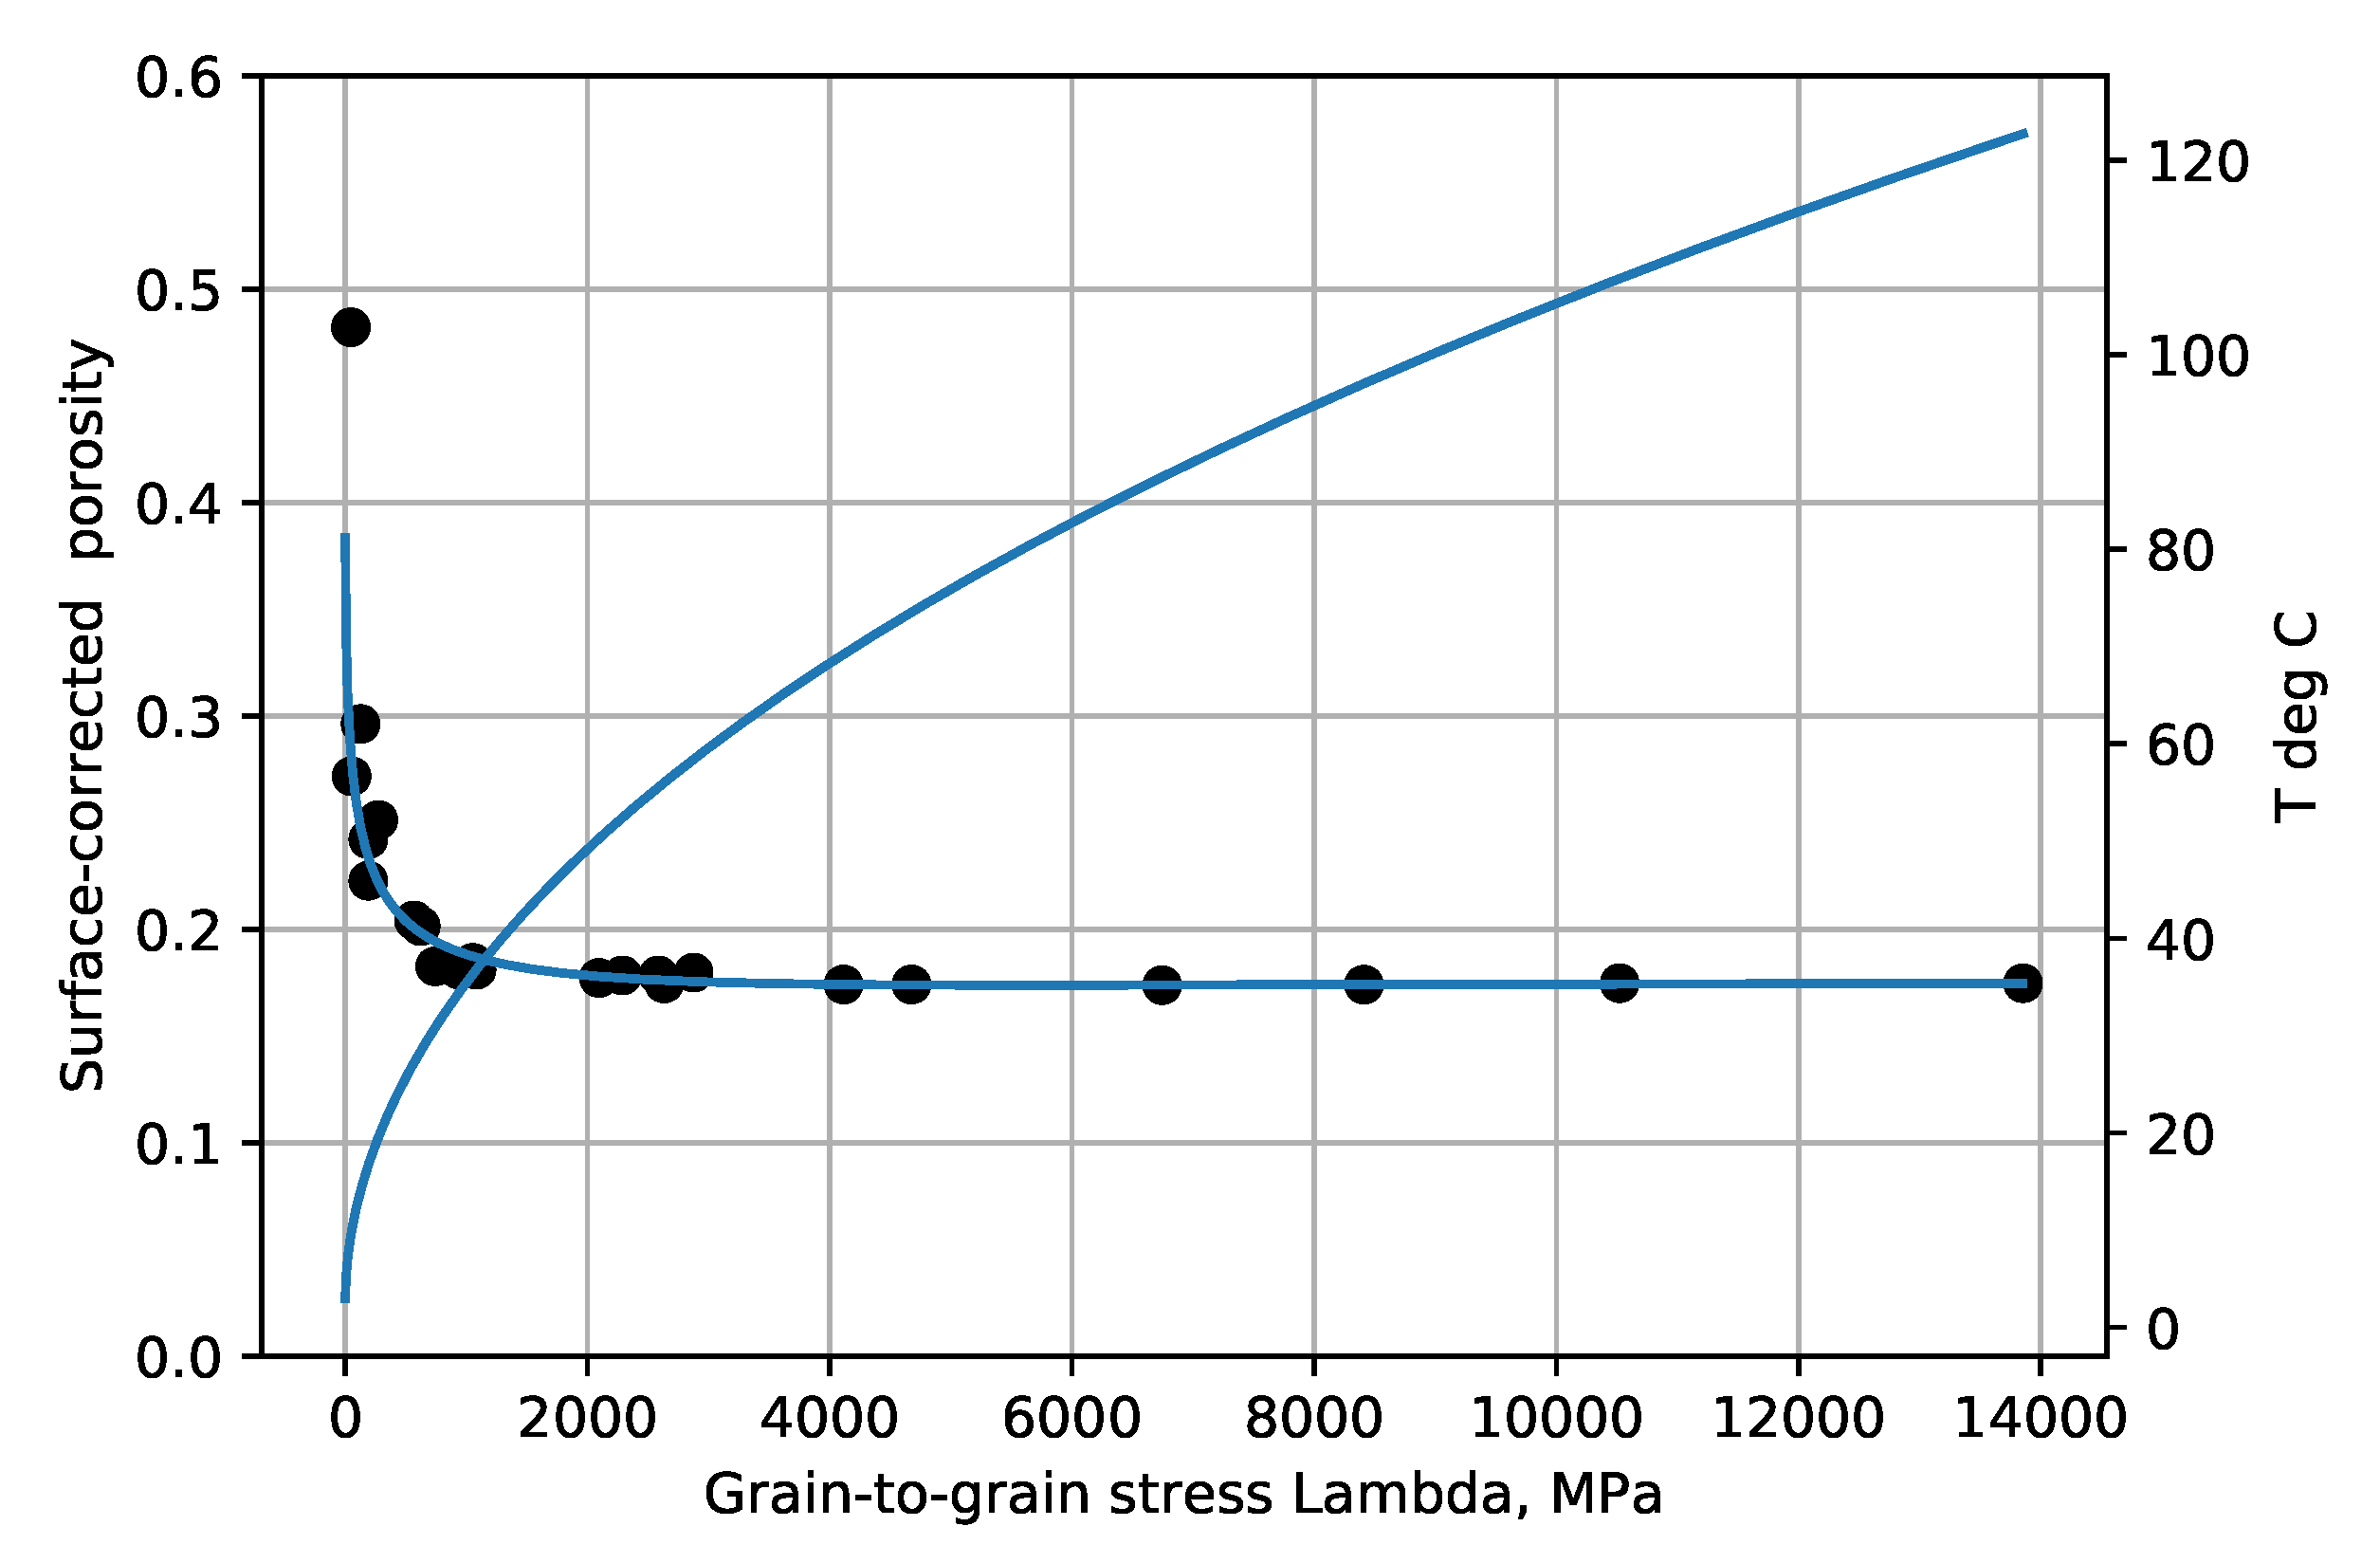
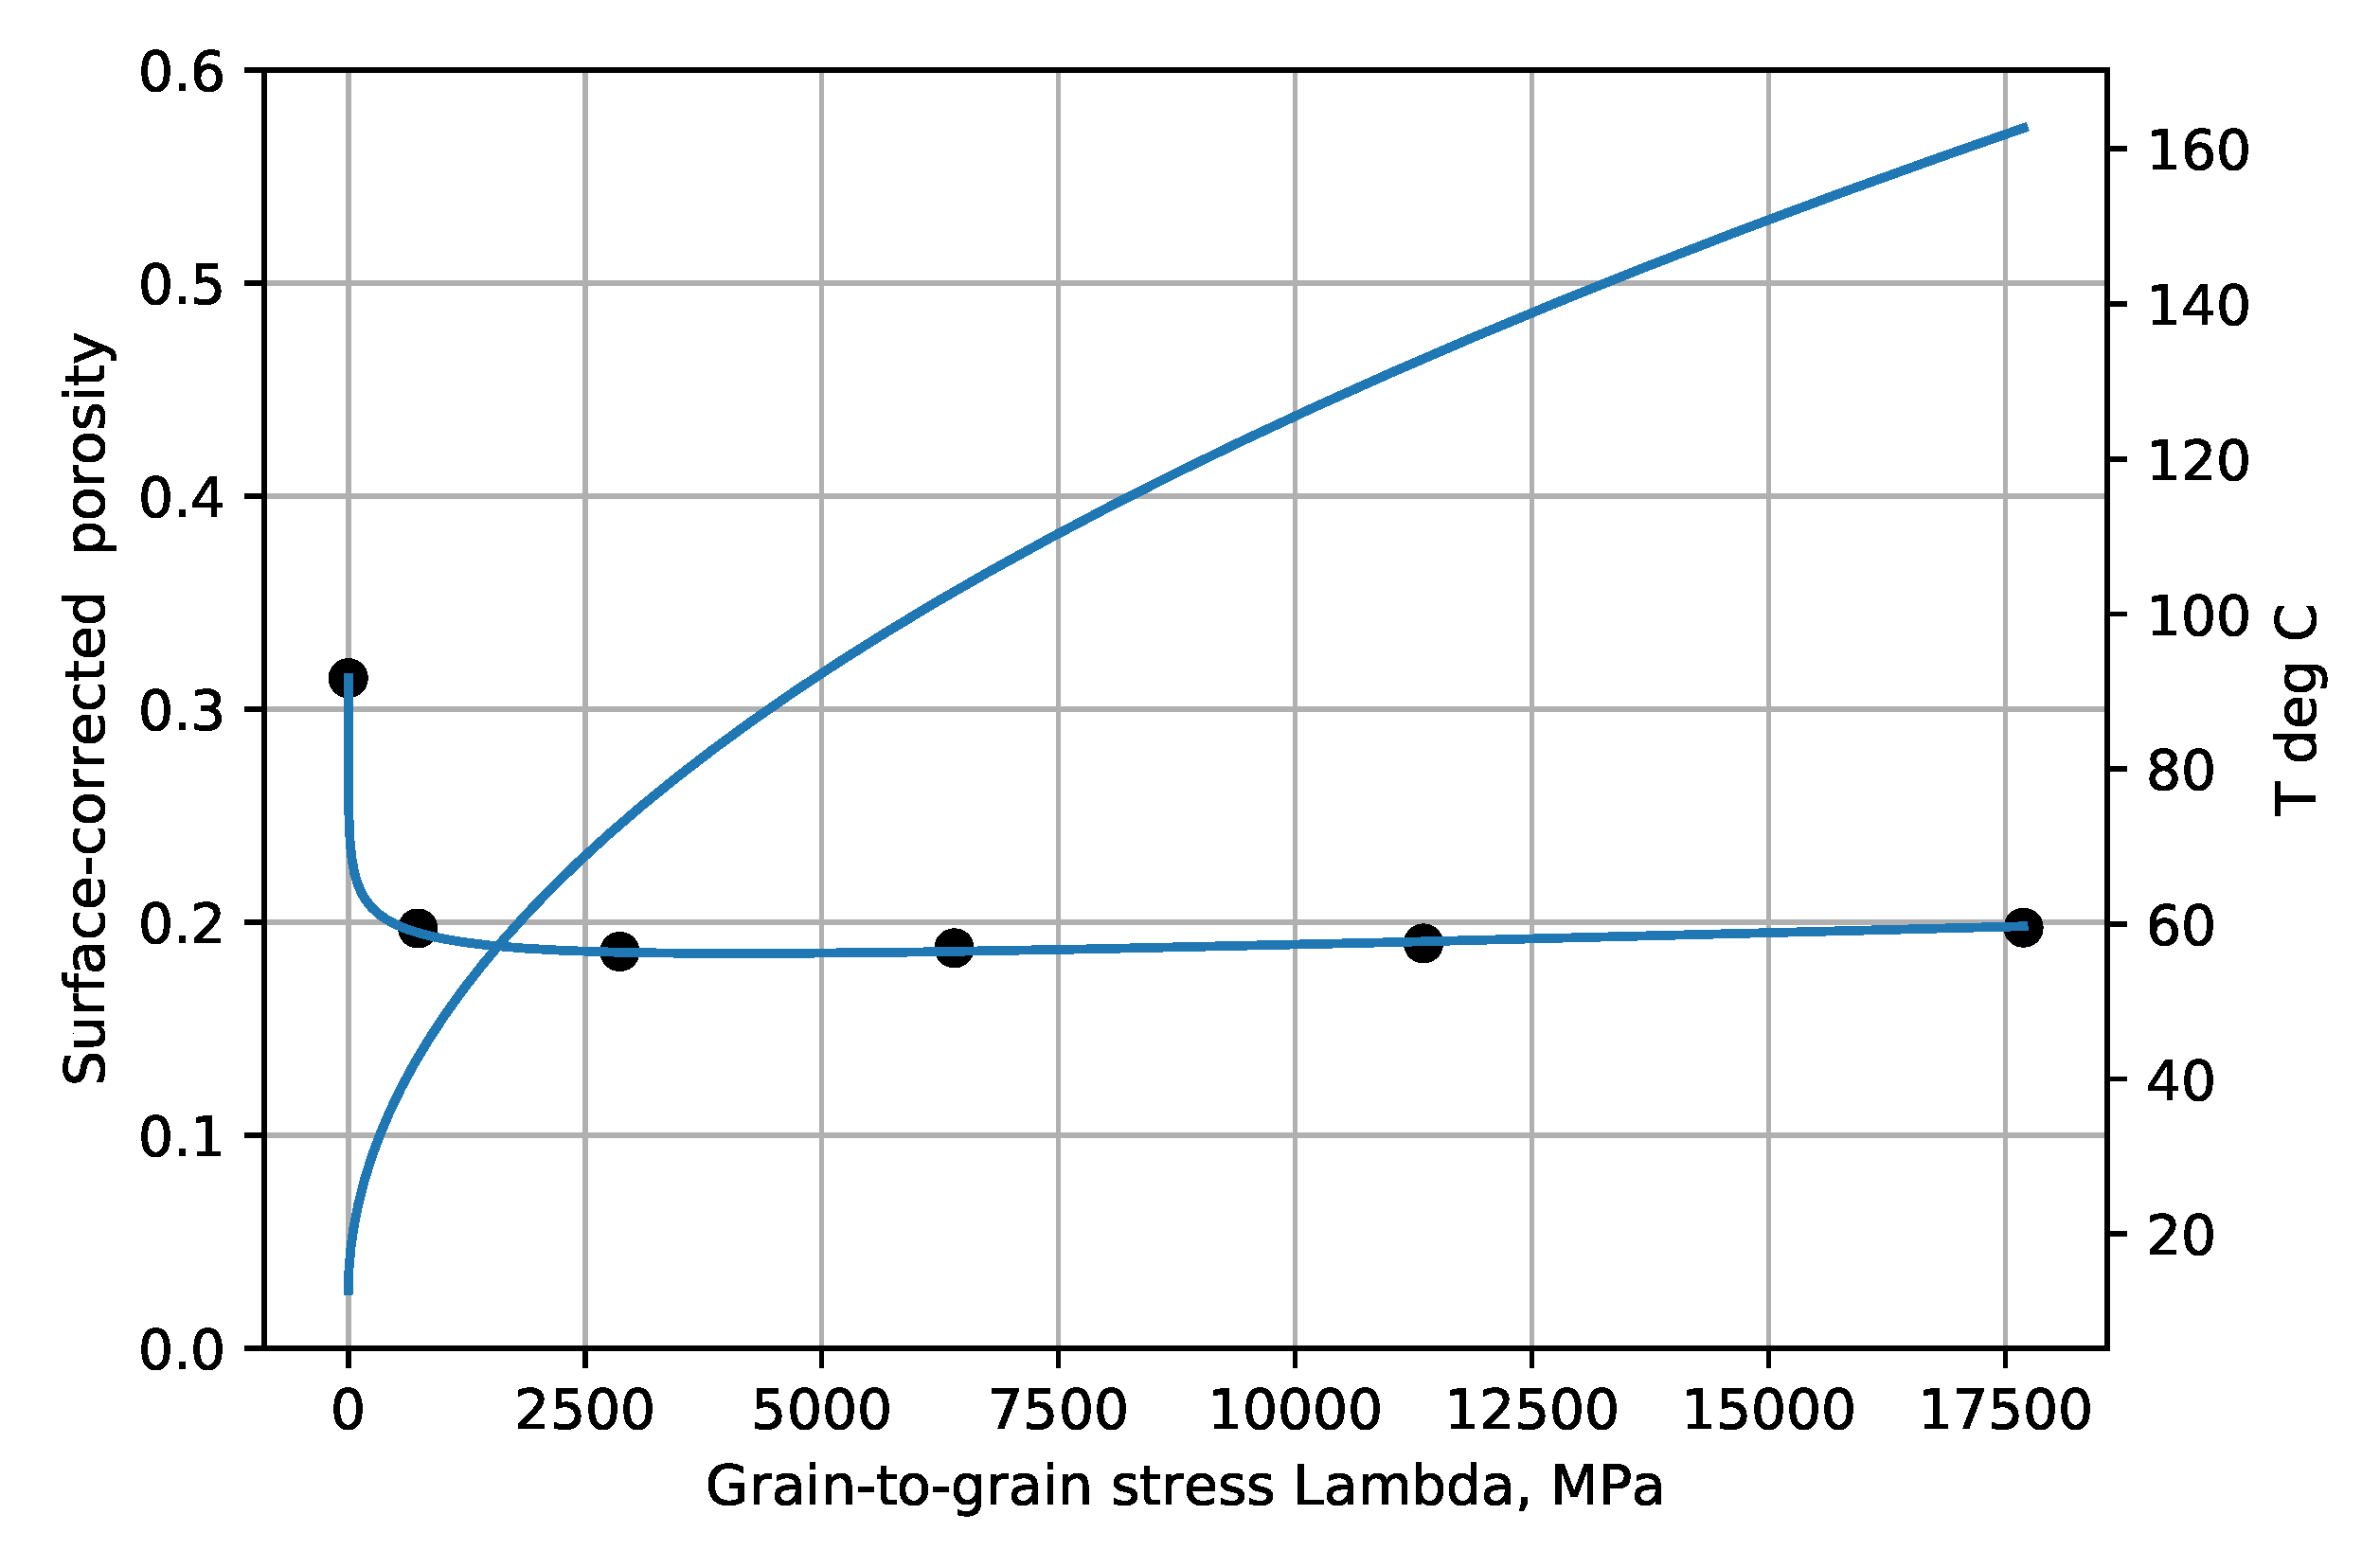
Figure 6 show the experimental example porosity-depth relations. Curve fit equations are shown at the top of each plot. ‘Dots’ on the graphs are data points for the Makran and Maracaibo wells, published trend points for Akita wells, and trend points read from graphs for the Oklahoma and Sulu Sea wells. As seen in the figures the provisional maximum paleotemperature is plotted as a linear function of depth, separately for each ‘well’.
The
axis is approximate. (The approximation
for normal water pressure is used to approximate the
axis as
Here
z is sample depth and depth 0 is the sediment
upper surface. The grain density and water density are
and
with
. The water pressures in these wells were not given.) Any mismatch of experimental porosity with approximate
is not important for illustrative purposes as porosity data points in non-normally-pressured zones are only shifted horizontally, e.g., overpresssured zones appear shifted to the right, and transformed porosity points are shown here next to be nearly constant.
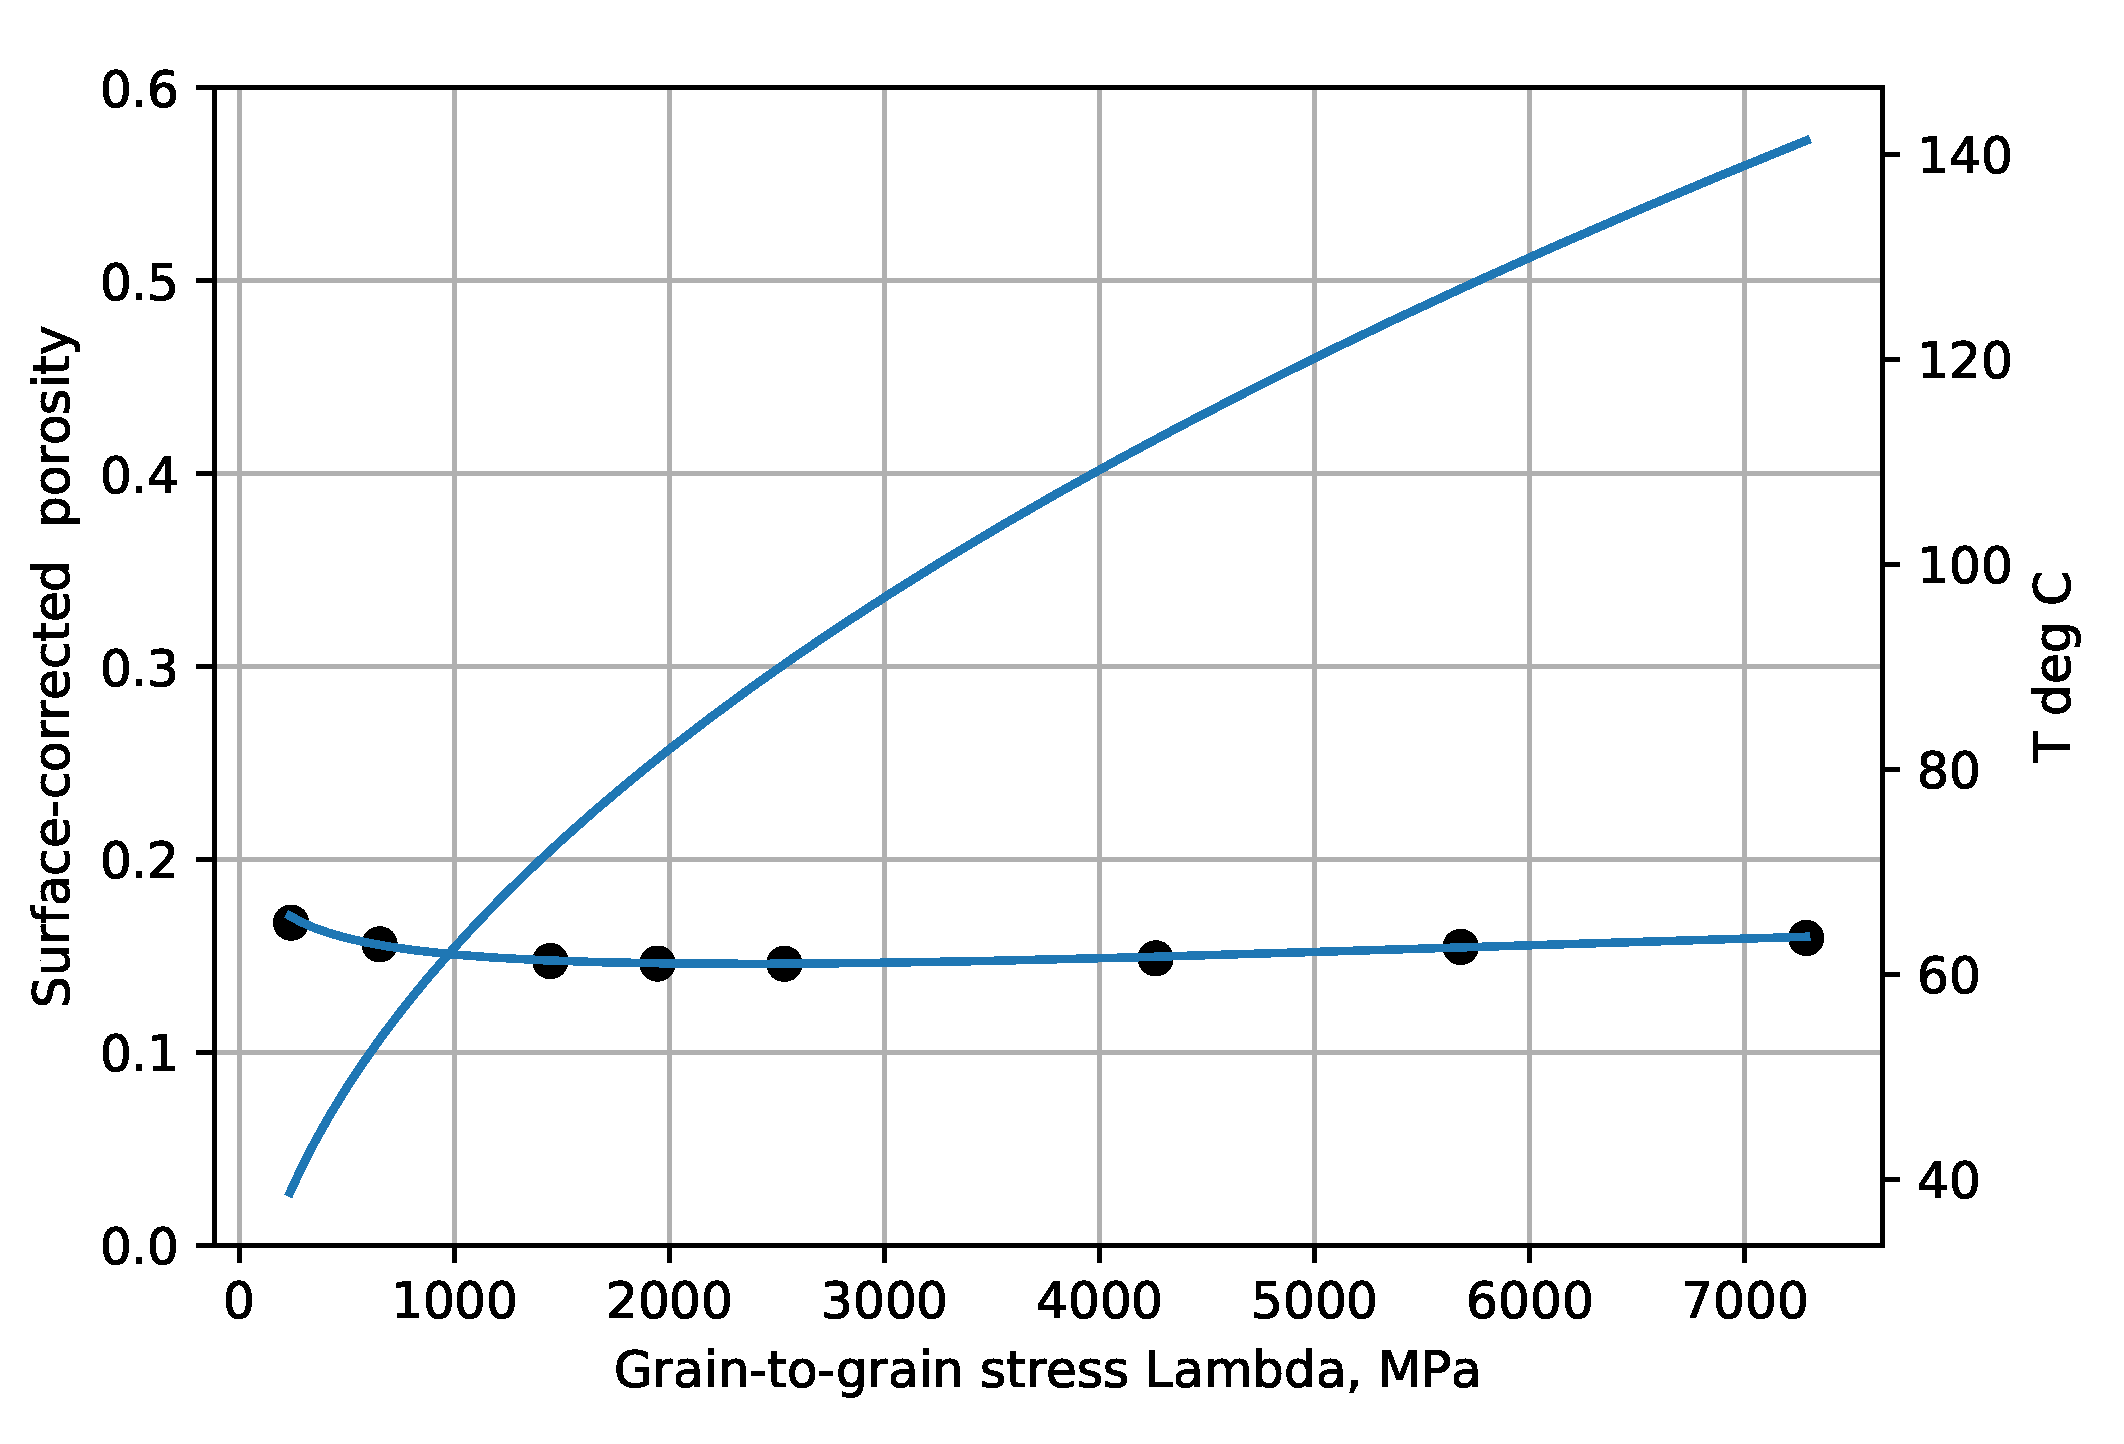
Parameters m and n are fixed so that the well porosity profile in the deeper portion of a well matches the surface reactant terms on the right of Equation (5),
where
c is a constant. In chemical terms, this means that the ratio of the reacting surfaces terms to pore volume is constant, and indicates that water is a necessary reactant.
Figure 13,
Figure 14,
Figure 15,
Figure 16,
Figure 17 and
Figure 18 show porosity ’corrected’ in this way and additionally multiplied by a constant factor
which minimizes vertical movement of porosity points for ready comparison to the previous
Figure 7,
Figure 8,
Figure 9,
Figure 10,
Figure 11 and
Figure 12. Here
means the average porosity over the entire profile.
The corrected deeper porosities have largely moved toward a common value.
These figures indicate that the
proposed reaction, Equation (4), is not rate-limiting at temperatures below 30–40 °C, and that longer geologic times (
Table 1) or lateral compression can produce greater compaction effects.
Table 2 gives m and n, and shows that the scatter of the porosities is reduced using the ratio of the entropy of the porosities after the ‘porosity correction’ to the entropy before the ‘correction’. The convergence of the transformed porosities is good above 30–40 °C and at porosities below 0.5. At porosities greater than 0.5 Equation (4) can have multiple porosity values give the same number, as it has the logistic form. This agrees with deep sea studies which show porosities are chaotic [
6] at porosities greater then 0.5. Porosities greater than 0.5 are excluded here in estimating activation energies.
The example wells are scattered around the World. The main task remaining is to find whether Equation (
5) predicts the existance of rate-limiting reaction(s) charactorized by one or more activation energies, E, for these wells. Moving the porosity terms to the left hand side (LHS) of Equation (
5) gives
The left side needs to be evaluated for the well porosity profile in order to obtain
E and
A. The time derivative- or of equal practical use the derivative of porosity with respect to time—can potentially be obtained from laboratory experiments. Alternatively the time derivative can be obtained if the sediment geologic ages are known at close depth intervals along with the known porosity profile. However only very broad bounding geologic ages are known for these six wells, e.g., the Oklahoma sediments were deposited from early Pennsylvanian to late Permian times which start 323 Myr ago and end 252 Myr ago,
Table 1. As these approaches are not currently available, an approximation to the time derivative is used.
Breaking geologic time
into many,
N, small time increments
it is seen that each term in the sum below is the instantaneous time derivative
for that time. The sum is the average over time of these instantaneous time derivatives and, like the pages of a book, add up to give the (large) finite-difference approximation on the right below, equivalent to only the starting and ending pages of the book as it were.
Here we have put , the current porosity. would be the seabed porosity to prevent negative values of the logarithm, but is 0.5 to analyze deeper shales and avoid chaotic behavior close to the seabed.
Porosity changes due to lateral forces and vertical forces are obviously included in the summation of the average, Equation (12), which is used in place of the partial derivative,
This partial derivative on the left of Equation (
11) would have come up in the same way if
, Equation (
3), represented horizontal forces rather than vertical forces. This approximation, or replacement, thus represents overall porosity reduction due to the combined forces and temperatures acting, in natural order, and including changes in overburden and pore fluid pressure, to reduce the potential energy
. This replacement is more appropriate than the partial derivative for computing activation energy, and further cannot be avoided since the actual porosity data result from all these factors. Putting this approximation into Equation (
9) gives
The subscript ‘0’ indicates near the top of the well but at temperatures above ≈40 °C and porosities less than 0.5. (A 60 °C cut-off produces similar results.) Because only a maximum range is known for
, the average
for the entire section is used in the initial estimates of E in
Table 1. Thus the section is supposed to be deposited in a time interval short compared to
with
zero in this approximation although it is positive for sediments as normally deposited. Plotting the log of the left hand side versus
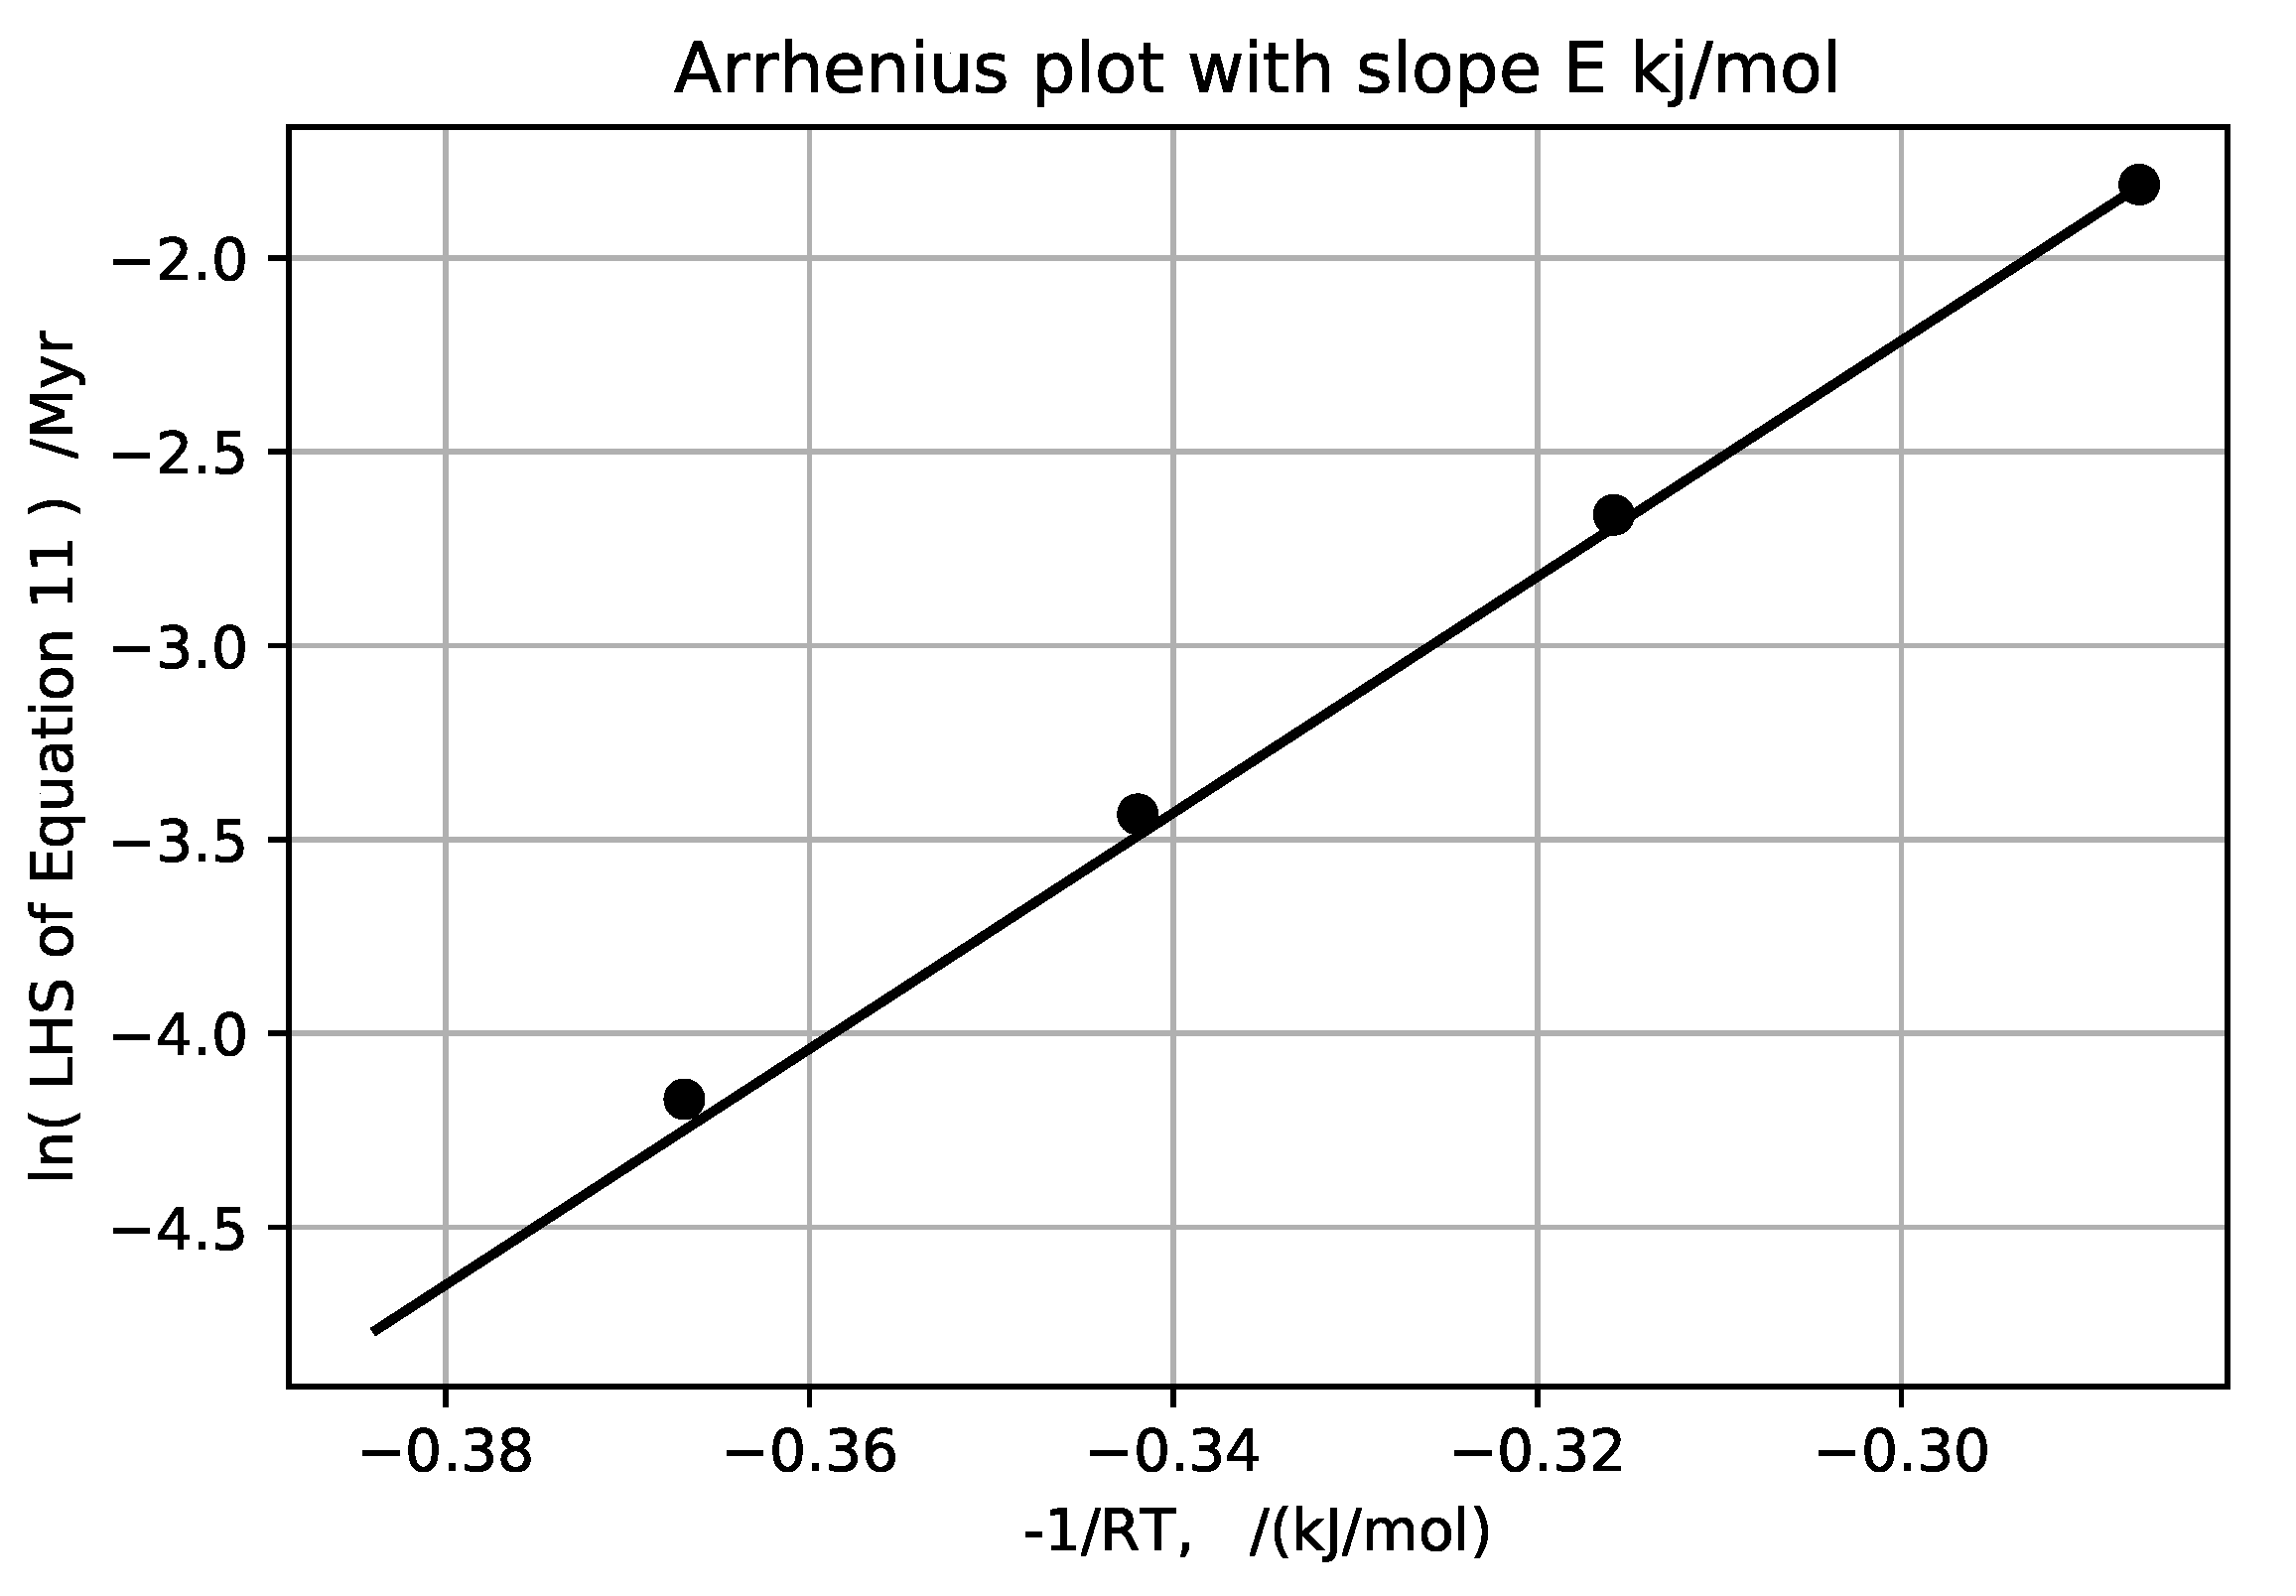
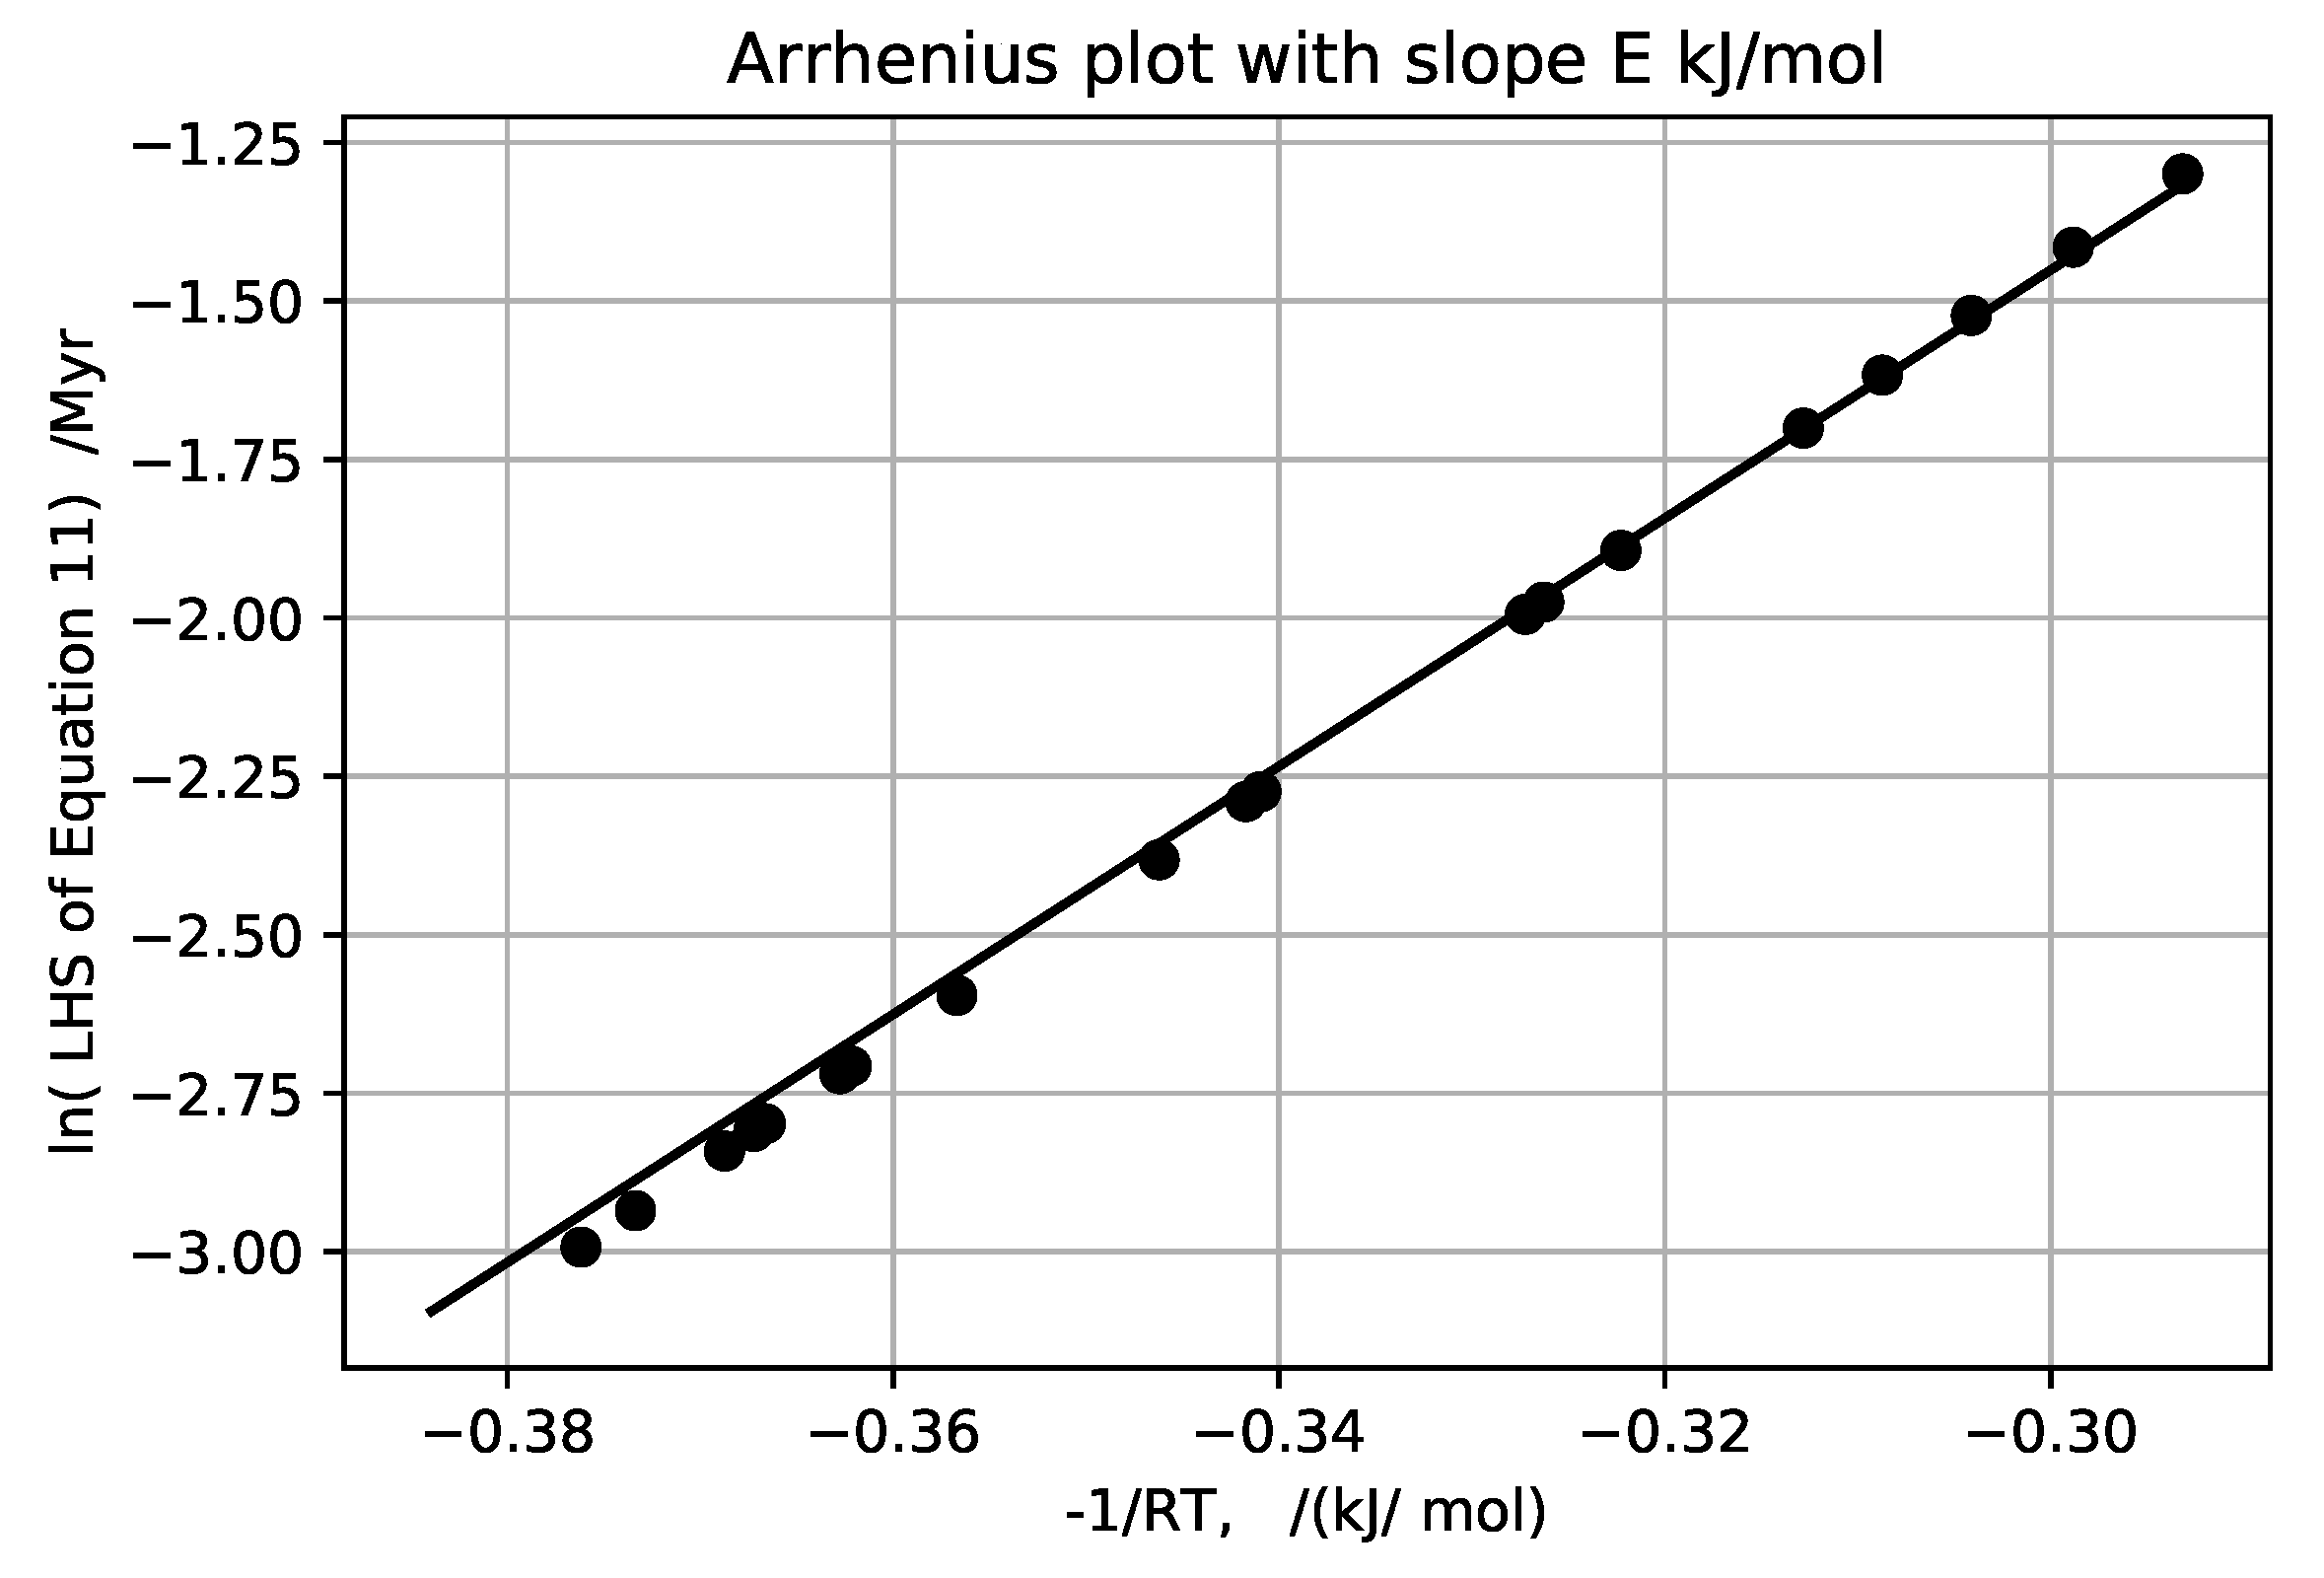
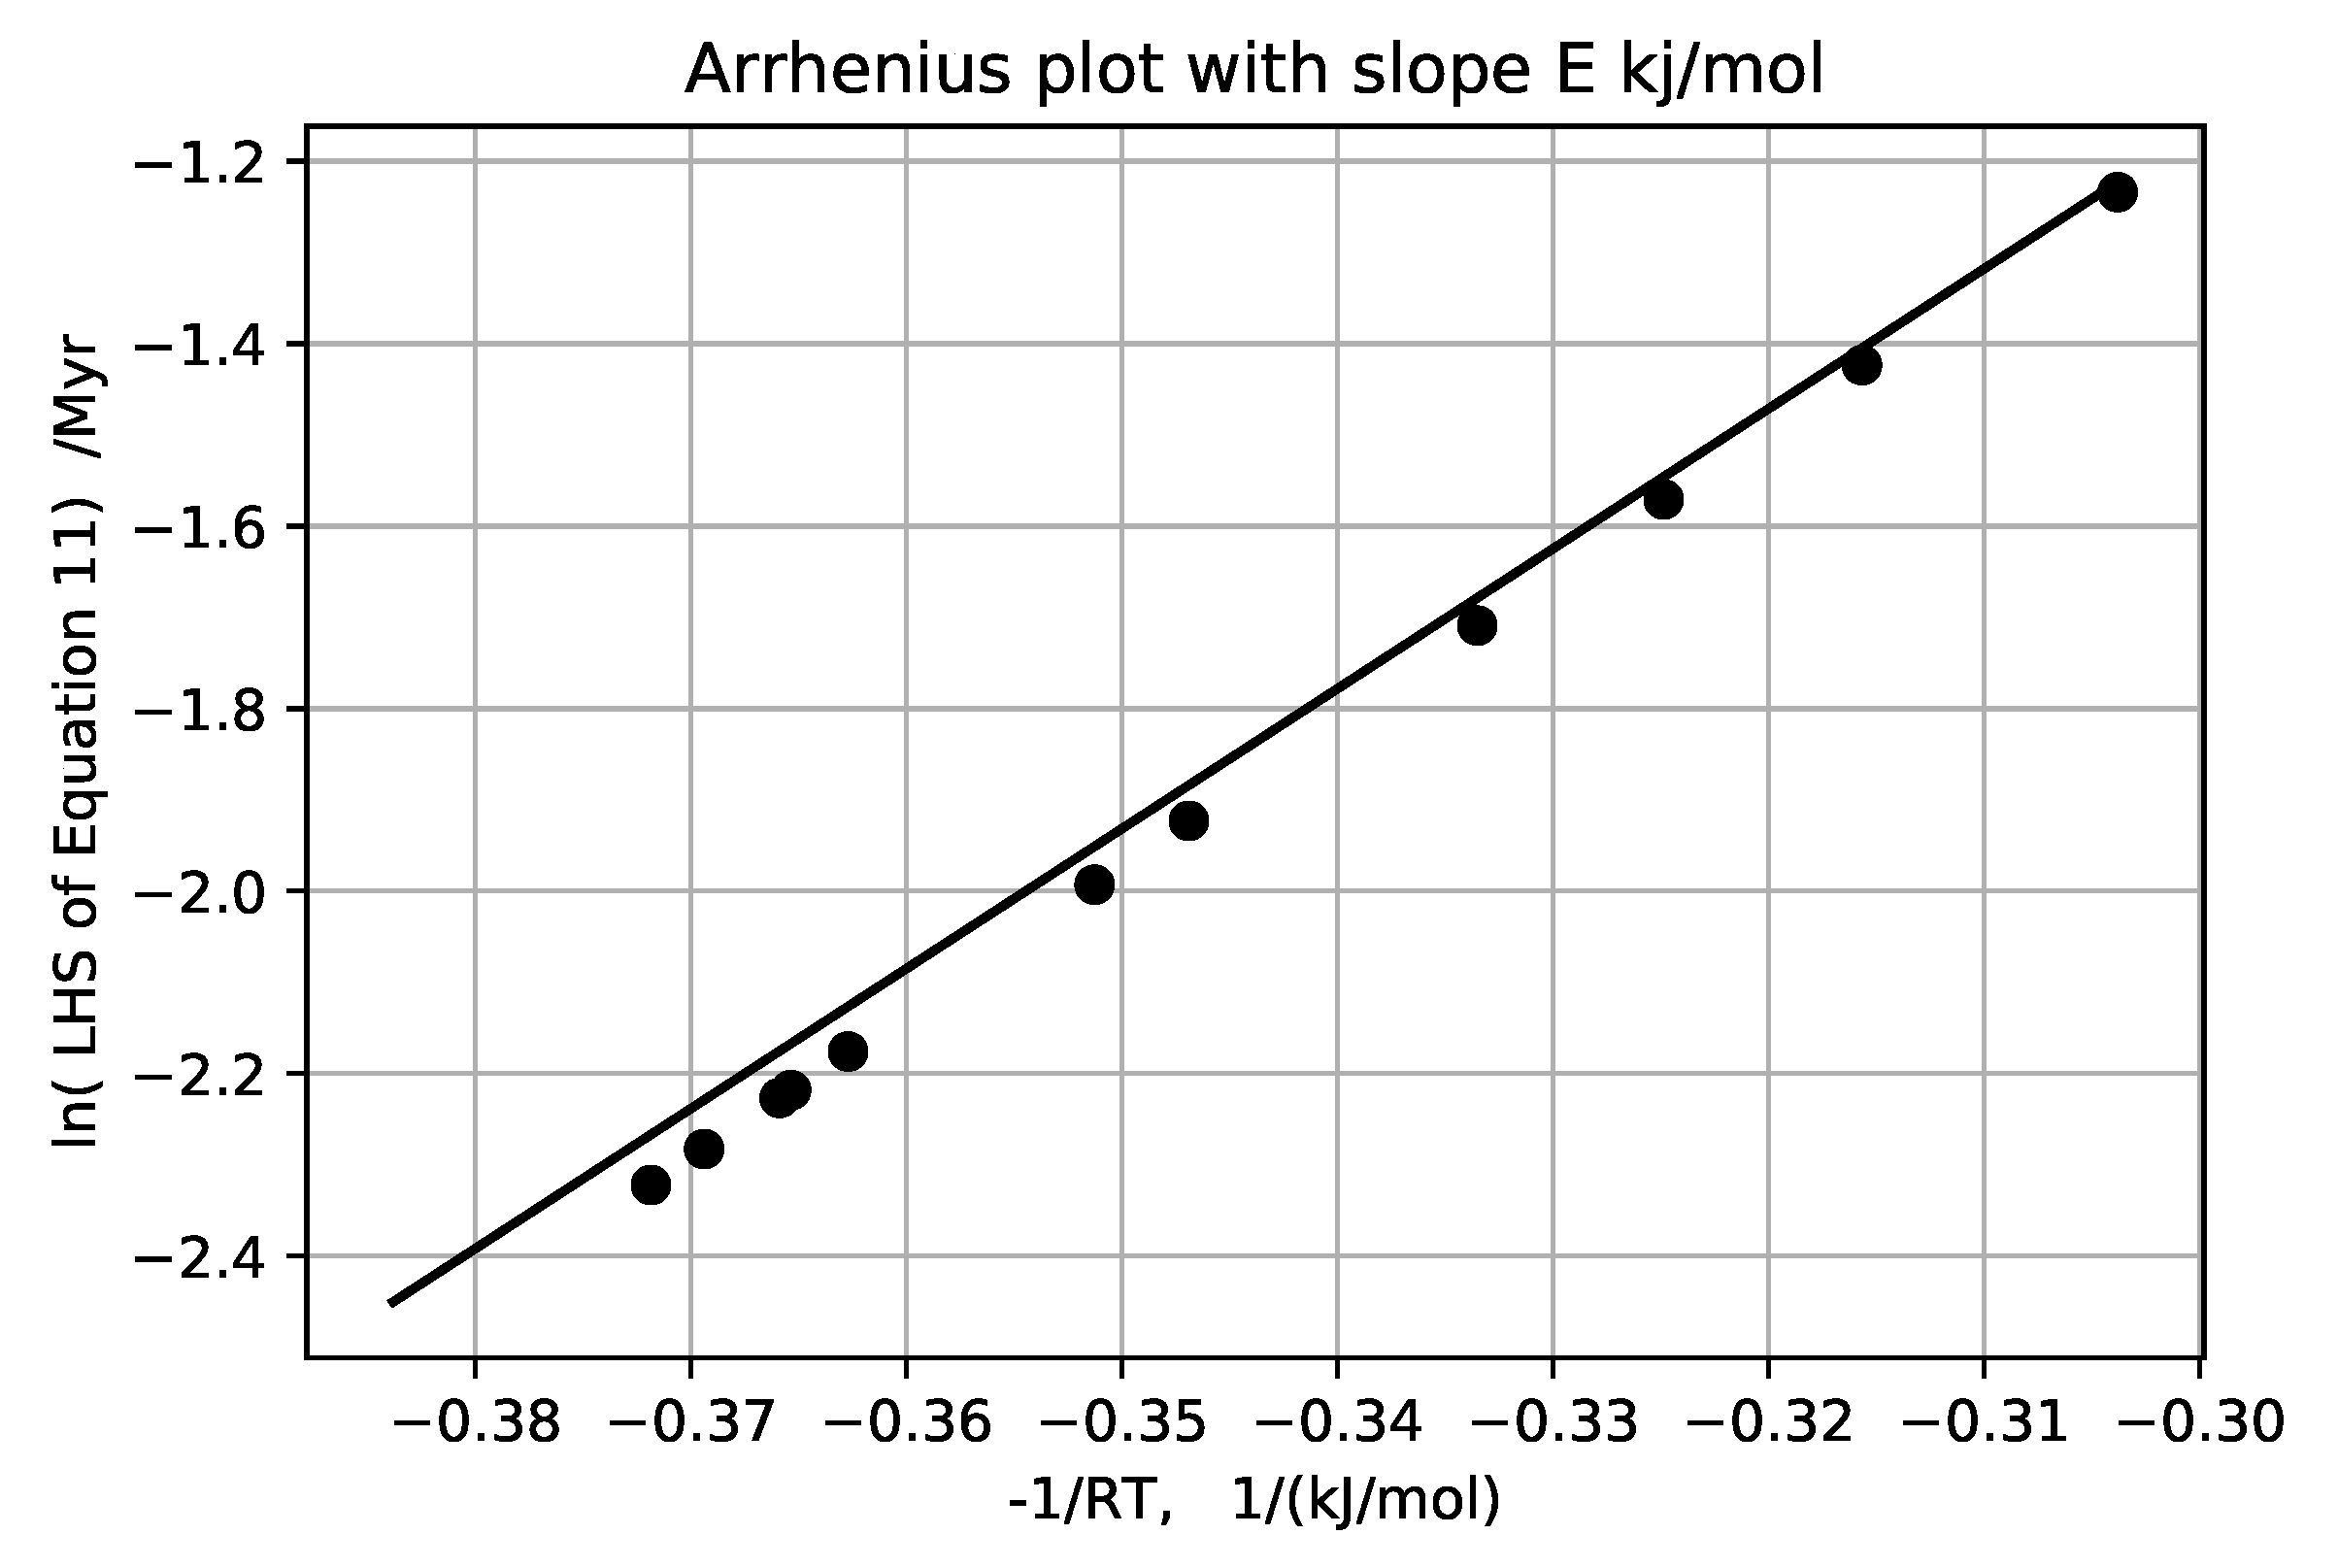
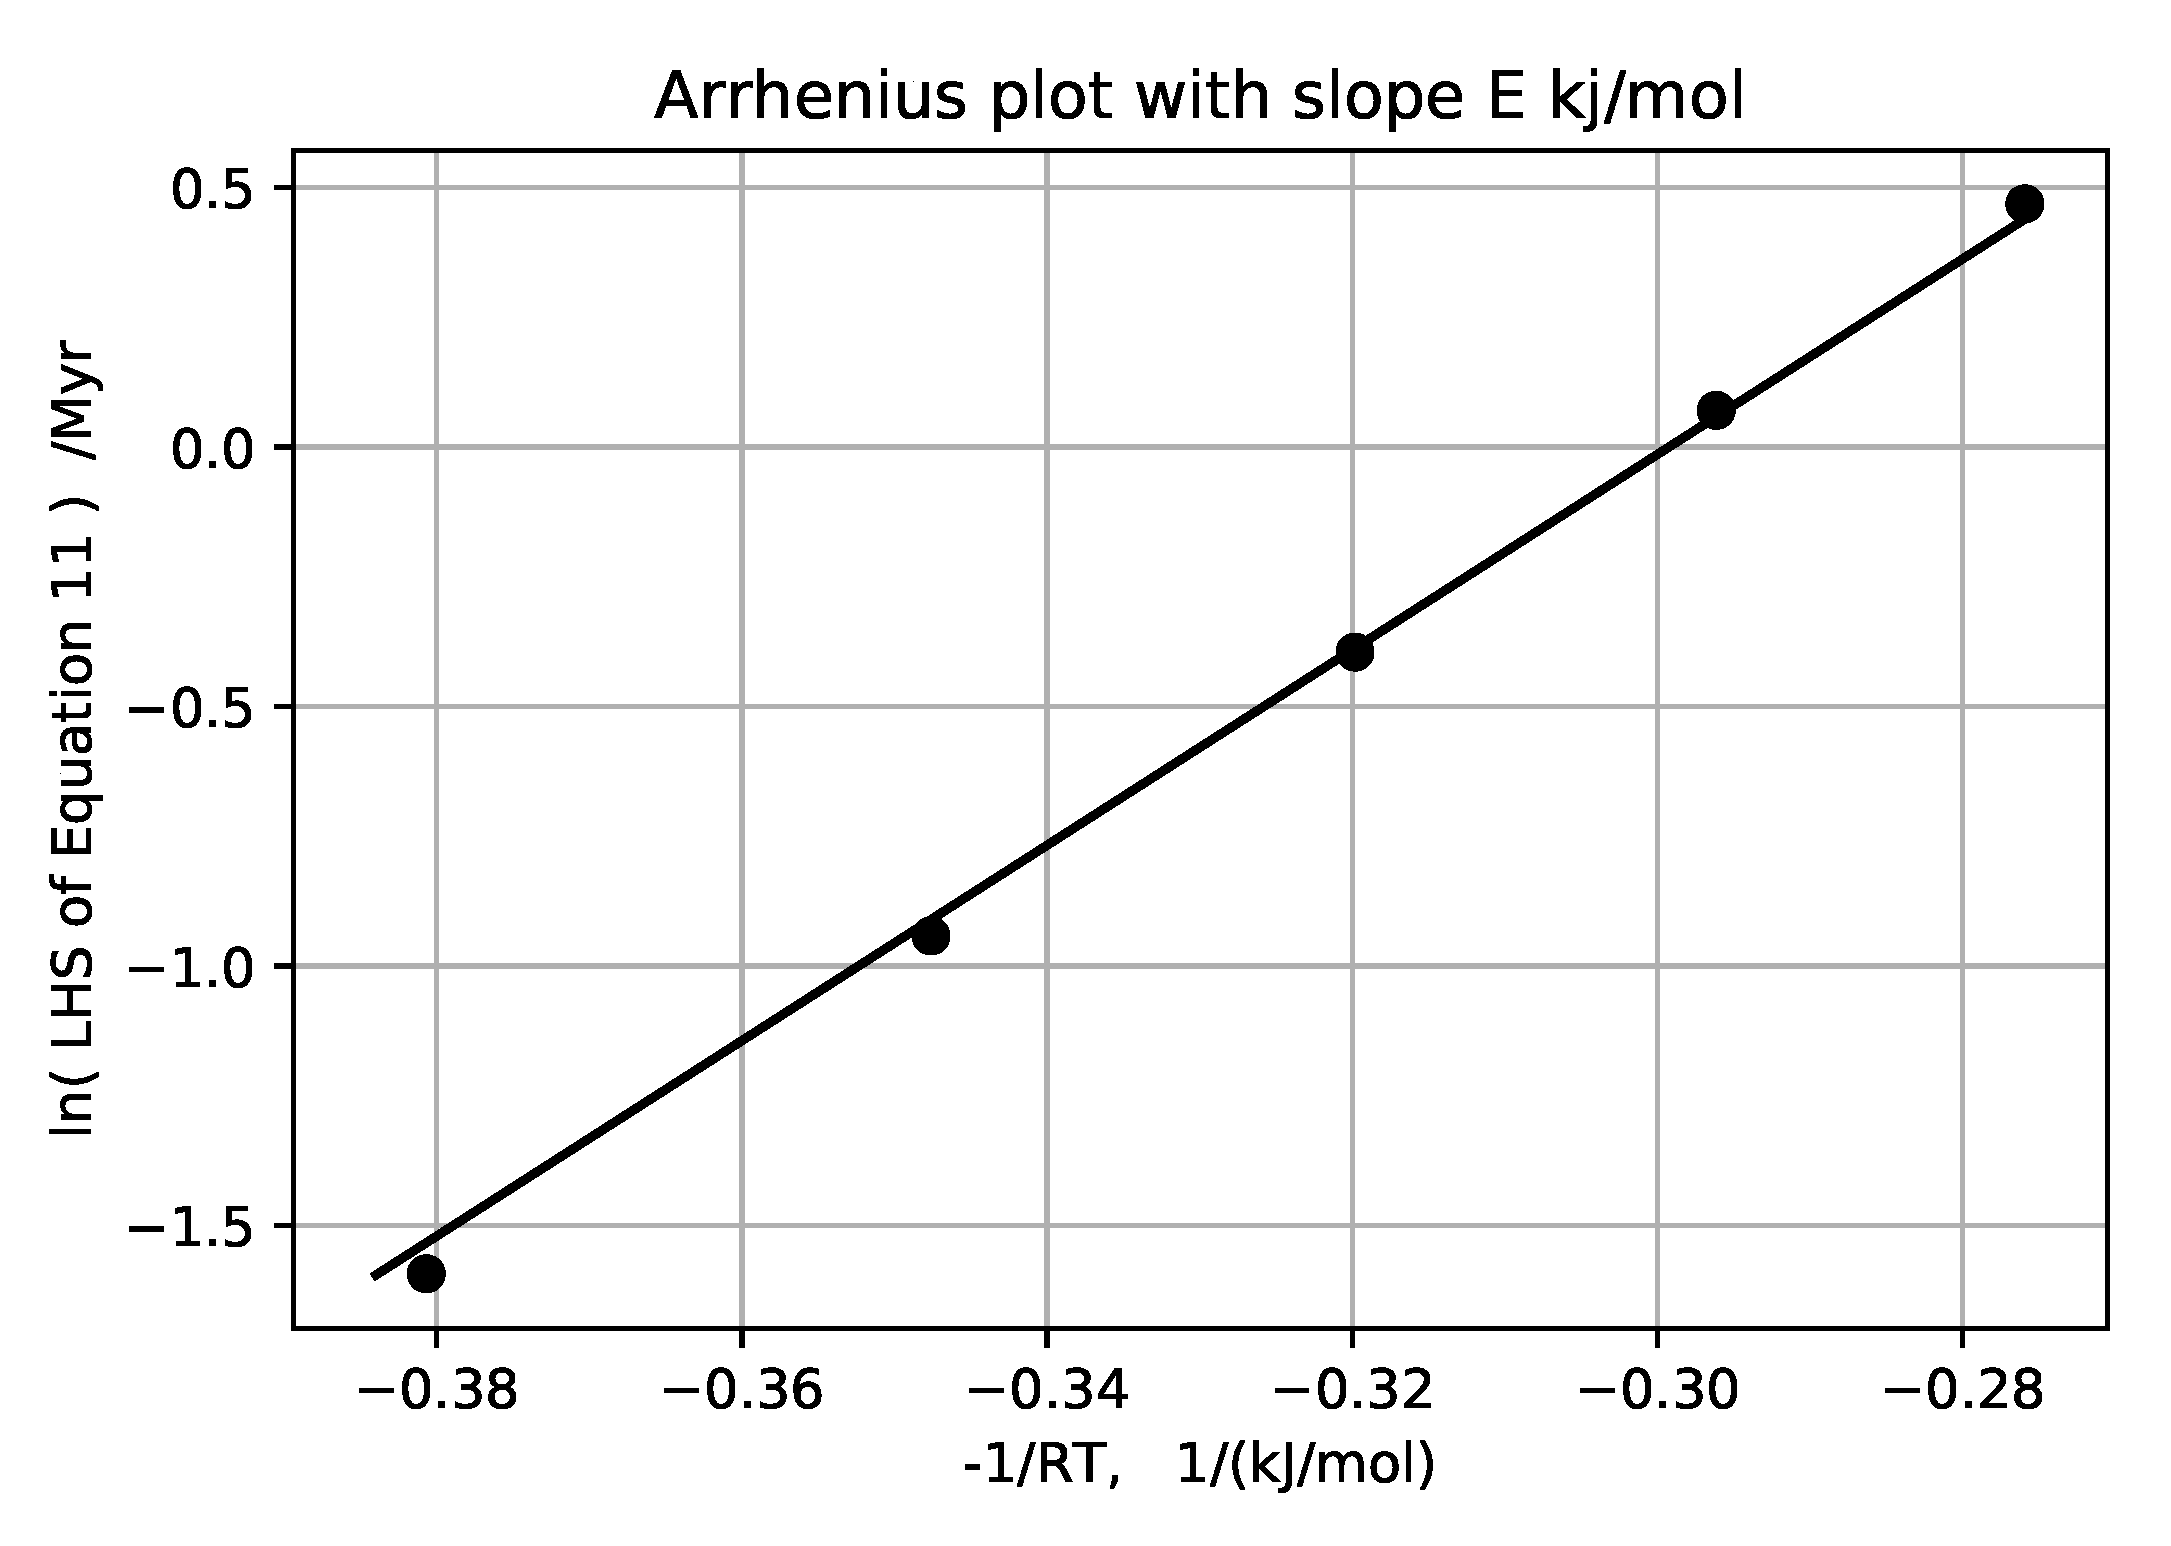
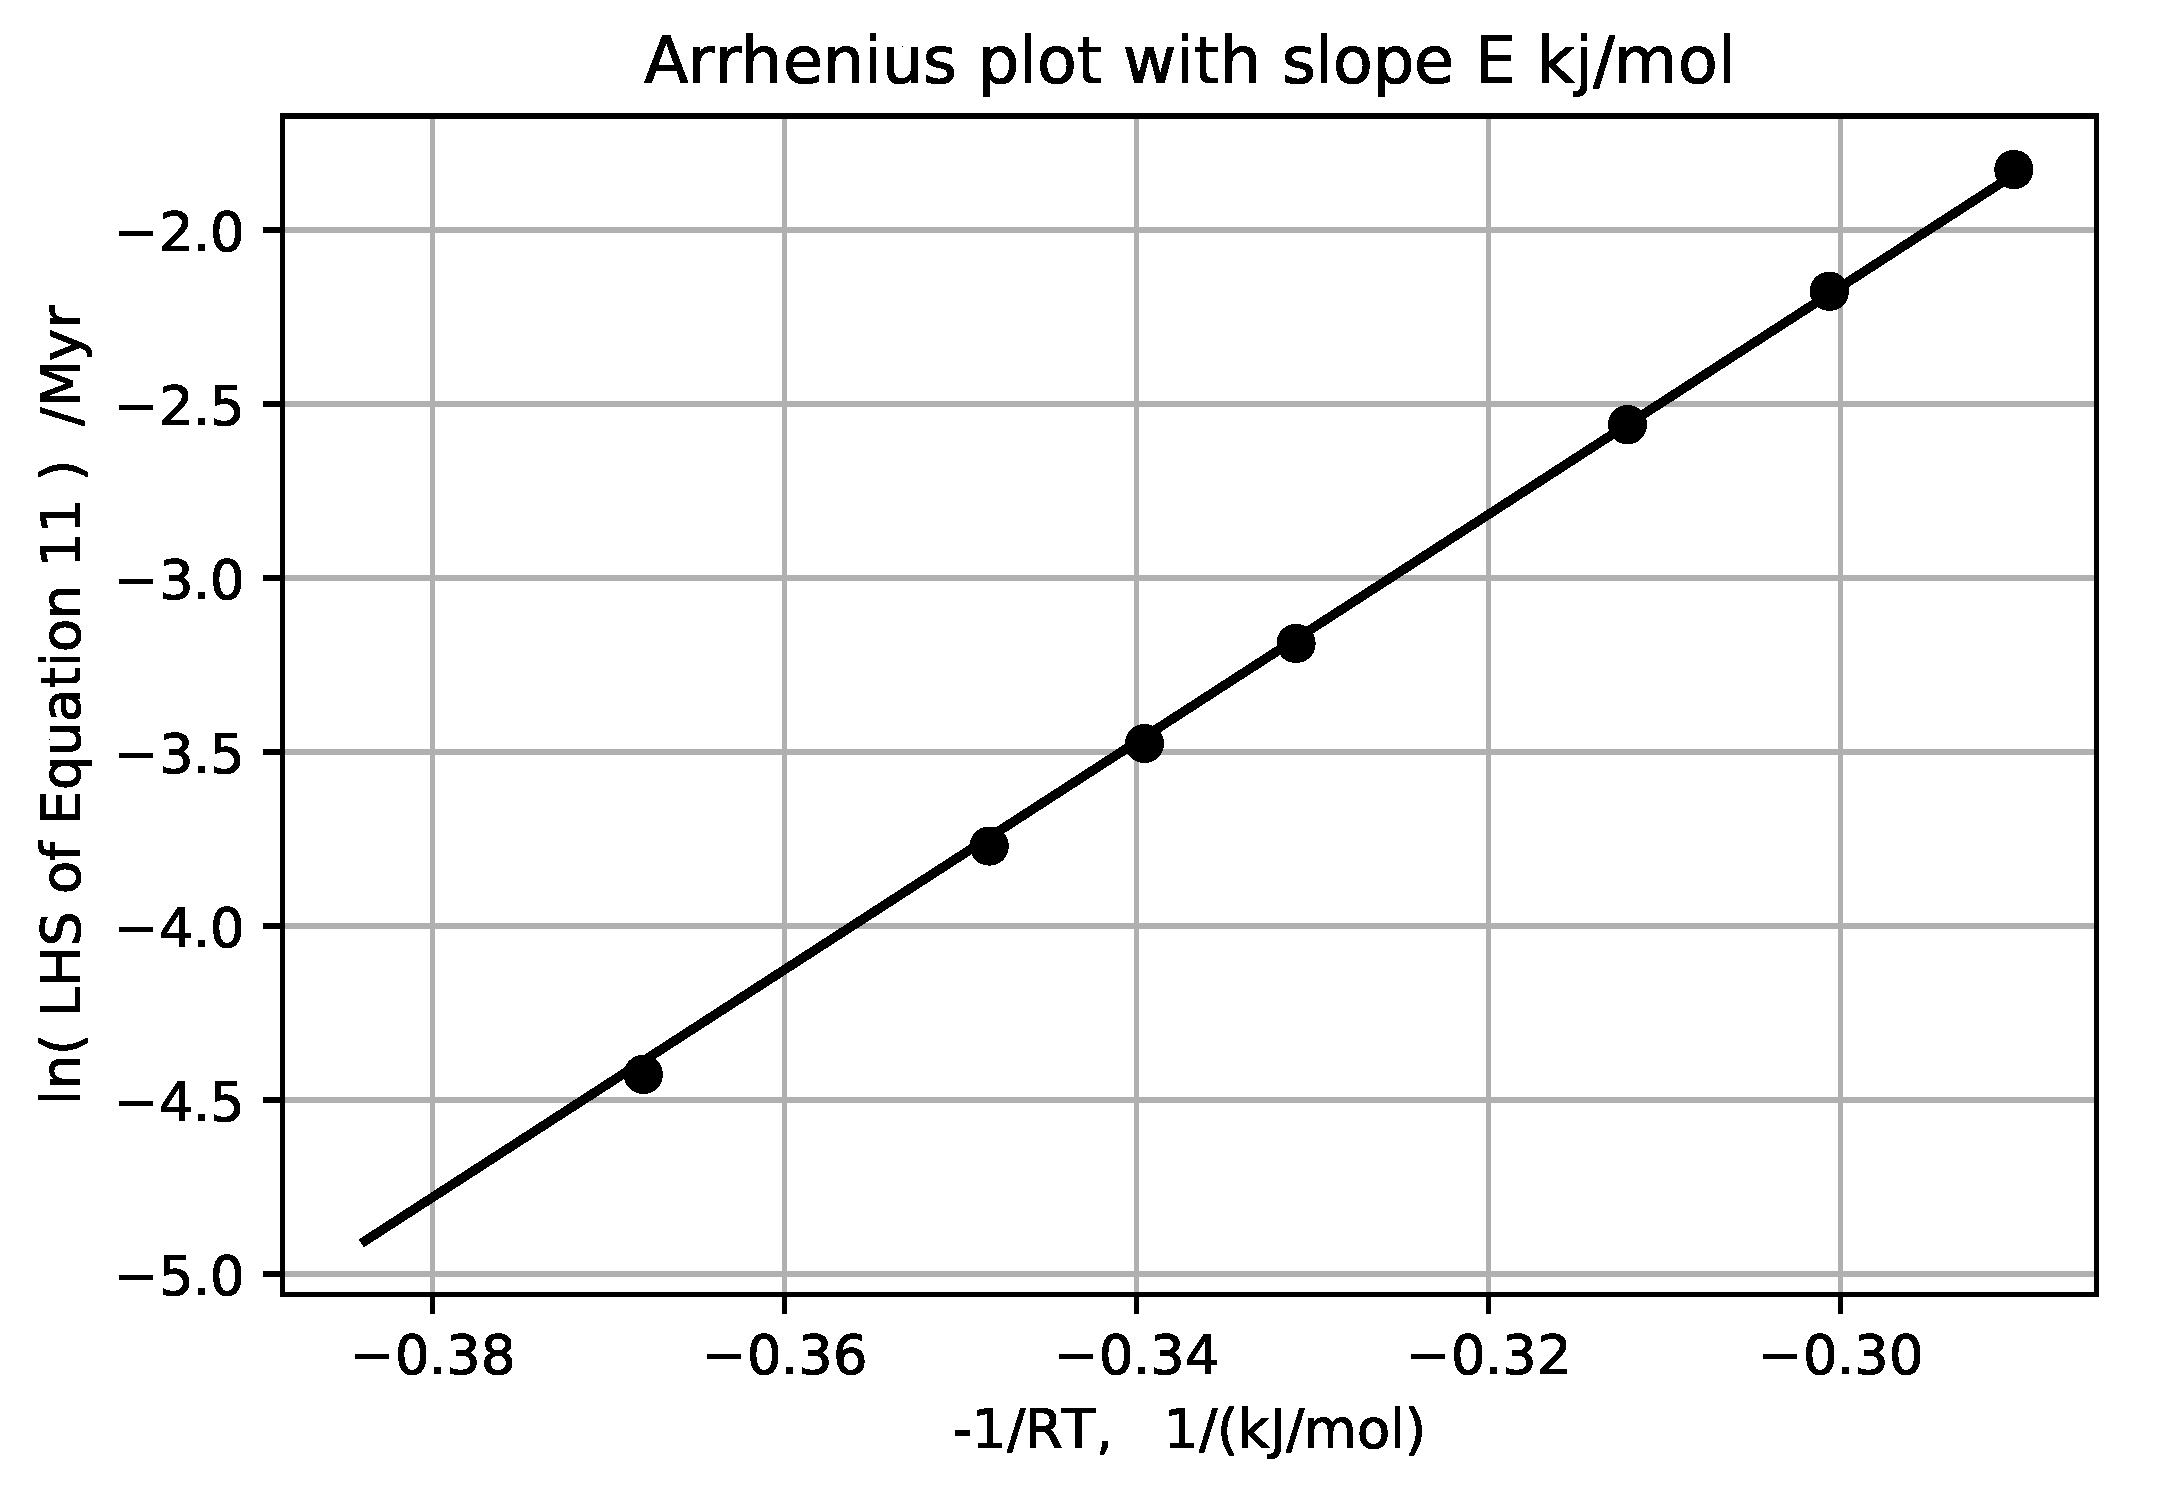
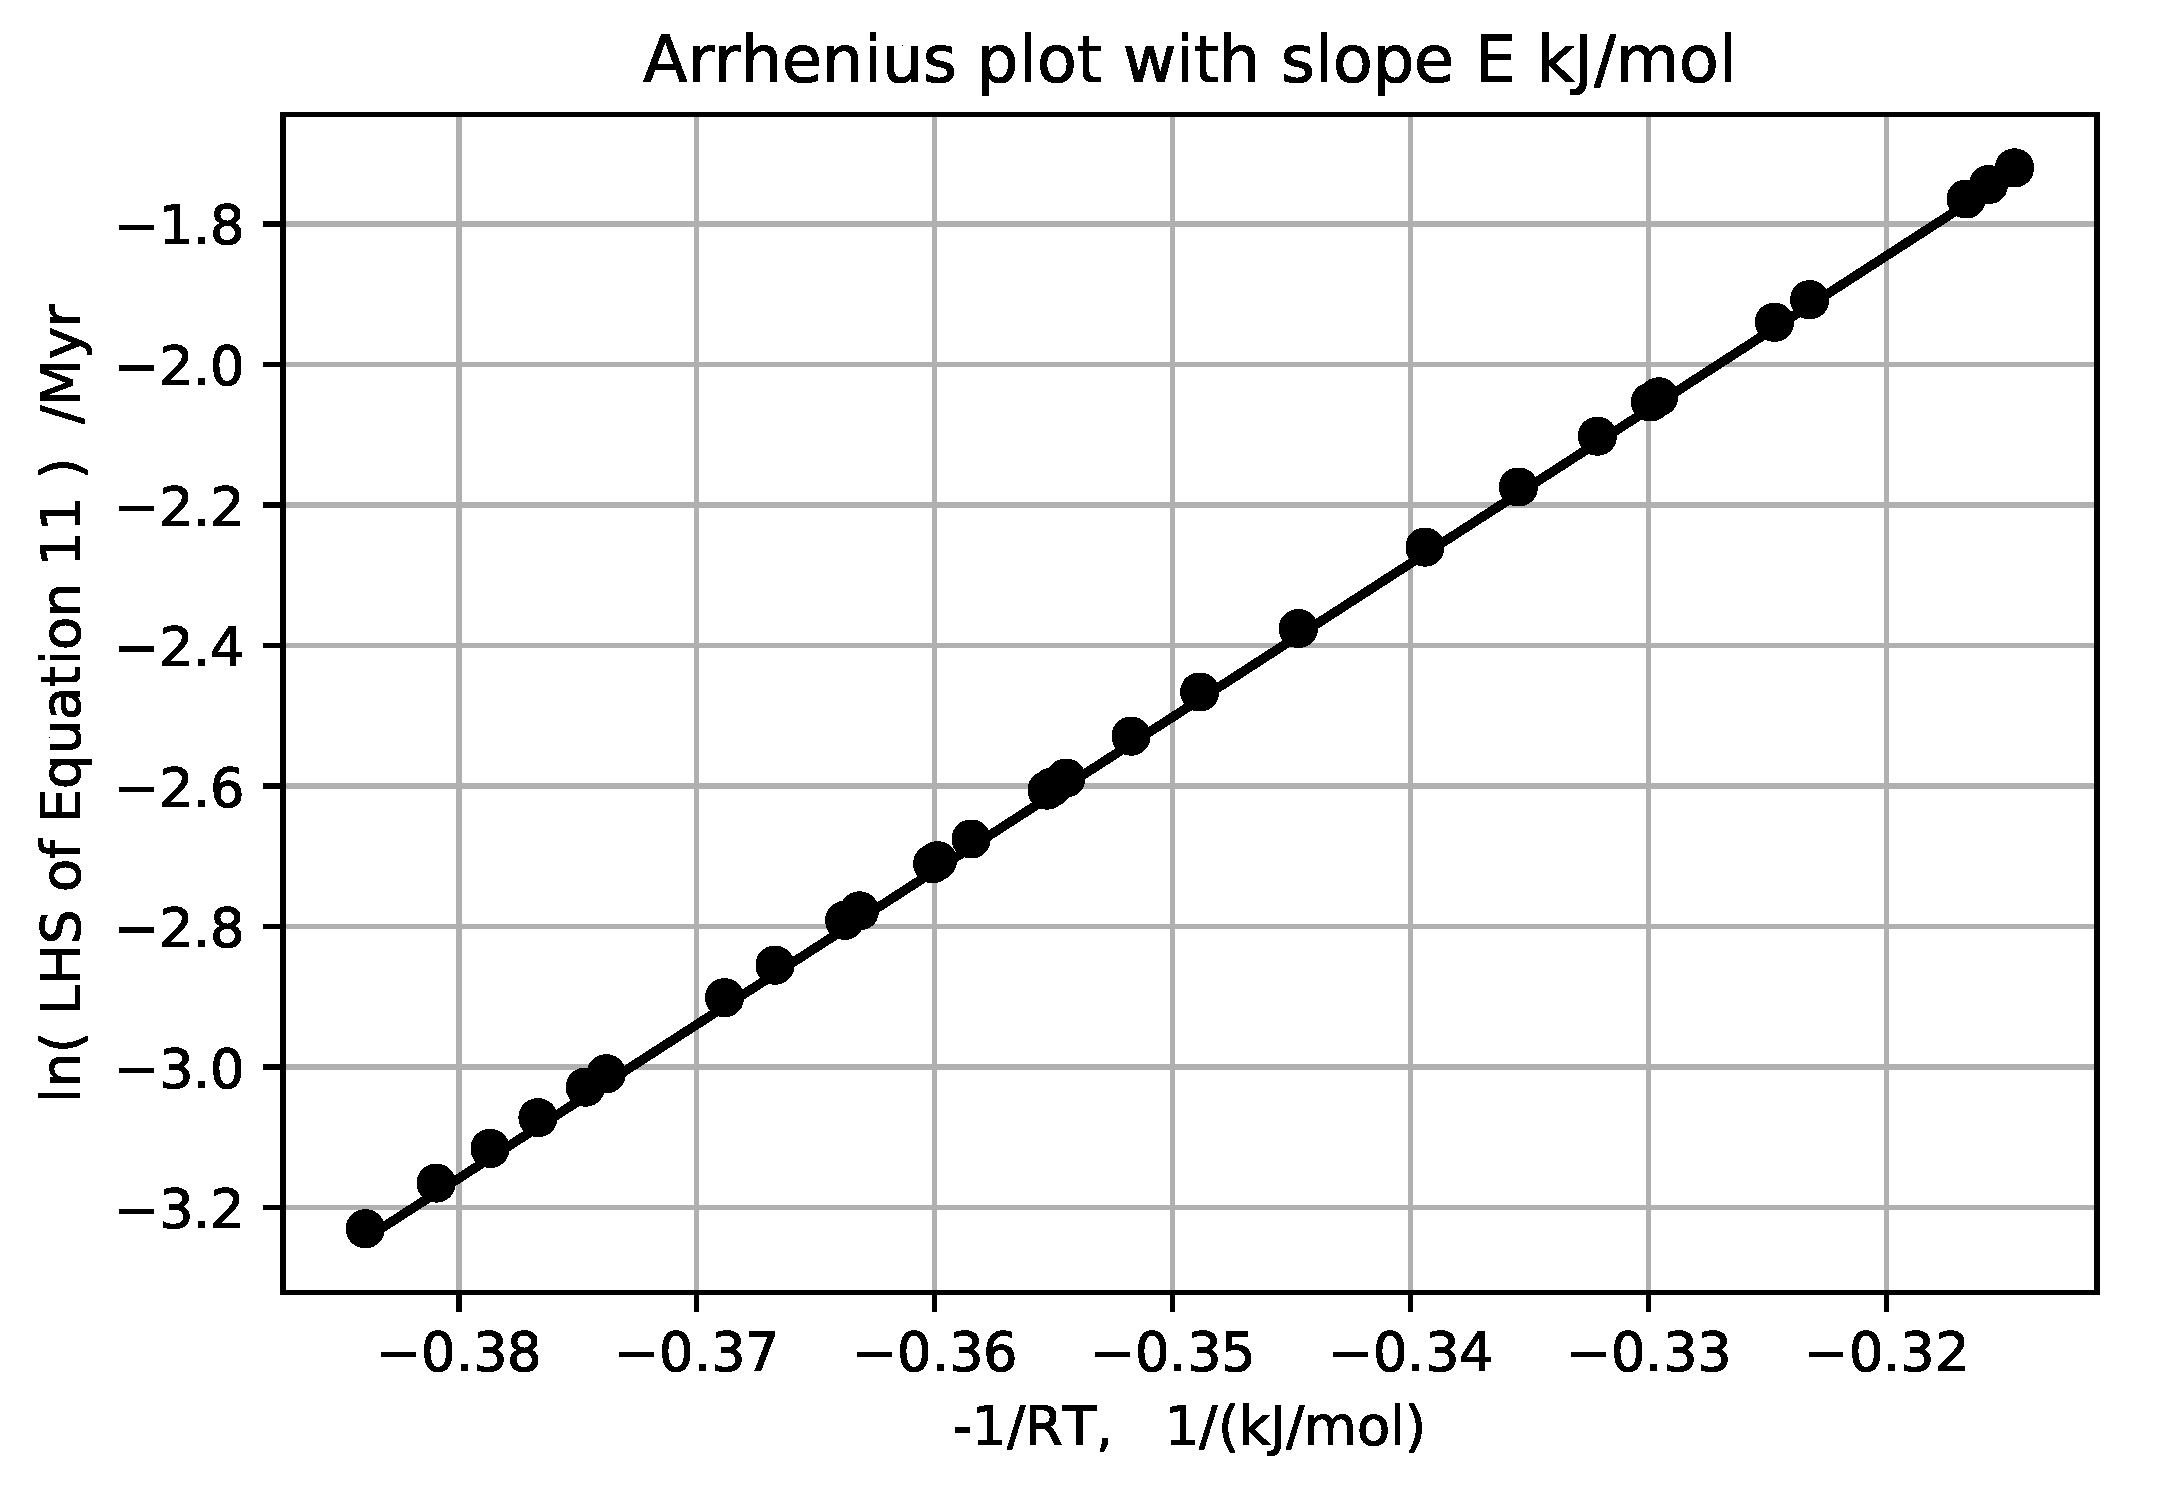
, gives E and the log of A for the six ‘wells’,
Figure 19,
Figure 20,
Figure 21,
Figure 22,
Figure 23 and
Figure 24 and
Table 2.
5. Discussion
Averaging the E’s computed from all these provisional temperature gradient assignments, along with the one laboratory measurement, gives an average activation energy of 23 ± 6 kJ/mol. The higher activation energies obtained for Akita and Oklahoma wells are well within the 44 ± 4 kJ/mol activation energy upper bound for solubility of quartz with no load [
6], and the Oklahoma well is known to have lost at least 360 m of overburden [
8].
With this an Oklahoma paleo-geothermal-gradient of 0.12 °C/m was inferred although this is too high if unloading by erosion has been the reason for the higher E. More example wells are needed to sort out this problem. Using an average E assumes the same mechanism occurs in all wells.
With this
, paleo-geothermal-gradients for the other wells were also obtained. These ‘improved’ estimates with other recalculated parameters are shown in
Table 3 as far as data convergence allowed. Differences in porosity determination method might have impacted activation energy determinations, e.g., Oklahoma and Maracaibo porosities were measured on hand samples, while as mentioned the Macran porosities are inferred from seismic data.
Current temperature profiles are known privately for thousands of wells. This information would help gain an accurate , especially for deep-water wells where the paleo-mudline temperature is probably ∼3 °C.
The Makran data,
Figure 2 and
Figure 3, show that lateral forces in the accretionary wedge (Makran2) produced porosities reduced from nearby abyssal plain (Makran1) porosities. There the major lithology need not be clay throughout, as good reflectors were needed to produce data. The low Oklahoma porosities were also thought to have been reduced by lateral forces [
8,
9]. Directionally variant lateral forces are often observed in horizontal drilling [
16]. The compaction response mechanism to both vertical and horizontal forces is probably the also given by Equation (
4).
