


Abstract
Carbon dioxide (CO2) geological storage traditionally involves capturing a CO2 stream from a point source such as a power station or from cement, steel, or natural gas processing plant, transporting it and compressing it, prior to injection as a supercritical phase into a suitable geological reservoir overlain by a cap-rock or seal. One of the main perceived risks in CO2 geological storage is migration or leakage of the buoyant CO2 stream through the seal, via faults or fractures, or other migration out of the storage complex. Injection of CO2 dissolved in water may be one solution to mitigate the leakage risk. This approach could take advantage of large volumes of wastewater already being reinjected into saline aquifers worldwide but particularly in North America, thus reducing costs. This study examines the potential to “piggyback” off the existing wastewater injection industry as a novel carbon storage option.
1. Introduction
Permanent subsurface sequestration of CO2 captured from power stations and industrial sources is one of the major options for reducing greenhouse gas emissions [1]. In addition to hydrocarbon reservoirs, saline aquifers are widely viewed as candidates for CO2 sequestration. Saline aquifers provide very large storage capacity, are broadly distributed and underlie most CO2 emission sources [2]. Numerous studies have examined the feasibility of CO2 injection and storage in saline aquifers and references therein [3,4]. The injected CO2, which is usually taken to be nearly pure, is trapped through different mechanisms, namely structural, residual, solubility and mineral trapping [1].
These processes may be tracked through various numerical modelling methodologies that have been developed to predict the extent of each trapping mechanism under different conditions of interest [5]. From a technical perspective, the injection, dispersion and trapping model forecasting capability is often affected by inadequate knowledge of relative permeability, which critically affects the quantity and distribution of the CO2 plume, the impacted subsurface volume, and the degree and extent of the different trapping mechanisms in a multiphase system. Current measuring methods for relative permeability fail to cope satisfactorily with the heterogeneity, very high mobility ratios and varied capillarity forces in this system [6,7,8]. Economically, the high cost associated with CO2 capture, separation, compression, transportation and injection is another key hurdle for more rapid deployment of CO2 geological sequestration globally [9].
In most large-scale global carbon storage schemes, the CO2 is injected as a supercritical fluid, which is less dense than the native formation water and rises up in the storage formation due to its buoyancy, until a geological top seal layer is reached. The CO2 pools and is retained under the seal layer, which provides either a structural trap [10] or a regional seal under which the CO2 plume slowly migrates up-dip. In either case, a significant concern and risk is then the integrity of this seal.
An alternative is to saturate water or brine with CO2 at the surface prior to injection [11,12,13]. This changes the dominant trapping mechanism from “structural” and “residual” to more stable “solution trapping”. Importantly, the saturated brine is often slightly denser than the virgin reservoir fluid [14]. The tendency is, therefore, for the plume to sink. Thereby, this approach significantly reduces leakage risk compared with storage of supercritical CO2 in reservoir formation water resulting in a multiphase system driven by buoyancy. Compared with direct injection of a CO2 fluid, the method has been assessed as having higher capital and operating costs, but has the advantage of lower leakage risk and consequently much reduced long-term monitoring costs.
In this paper we examine the feasibility of using existing water reinjection (e.g., disposal of coproduced oil and gas reservoir waters or from enhanced oil recovery or other mining activities) as a potentially niche opportunity to provide low-cost carbon storage by presaturating the water with CO2 prior to its injection.
Considerable amounts of water are reinjected in Canada and the United States each year, shown in Table 1 and Table 2. For the United States, the total rate is ~599,000,000 m3/day and for Canada ~215,500,000 m3/day. The quantity of CO2 that might be dissolved in the various locations depends on local conditions of temperature, injection pressure and water salinity. At a high level, this indicates the scale of the opportunity for carbon storage by this method. Obviously, the next stage of source sink matching would high-grade those locations best geologically suited with the shortest distance between source and sink, and this would greatly reduce the immediate carbon storage opportunity.
Table 1.
Produced Water Volumes and Number of Injection Wells for Regions in the United States in 2012, Modified From [16].
Table 2.
Top 10 Largest Injection Fields, Injection Volumes and Number of Injection Wells in Alberta, Canada, in 2006 (modified from [17]).
Clark and Veil [15] and Veil [16] reported that the TDS concentration of produced water in the western United States varies between 1000 mg/L and 400,000 mg/L, with median TDS concentration from most formations well under 100,000 mg/L.
In Alberta, produced water from conventional oil and gas production has very variable TDS with an average of ~30,000 mg/l and maximum of 329,000 mg/l [17].
Indicatively, the potential CO2 reinjection using all this water equates to ~34,903,000 tCO2/y for the United States and ~12,556,000 tCO2/y for Canada. These indicative amounts are based on an average salinity of 30,000 mg/L, injection pressure of 16,560 kPa (depth 800 m and 90% of 23 kPa/m) and temperature of 24 °C. Clearly, there exists a considerable opportunity to codispose of CO2 dissolved in water that is already being injected into subsurface saline aquifers. Since many of the costs of water injection are consequently already sunk, piggy-backing CO2 disposal may provide a cost-effective sequestration option.
2. Economic Analysis
Power plants, oil sands operations and many other production facilities are under pressure to reduce CO2 emissions. CO2 capture and storage (CCS) provides the single largest potential for CO2 emissions reduction, and saline aquifers and hydrocarbon reservoirs for enhanced recovery are obvious first choices as potential repositories. However, based on the CCS Development Council [18], it is desirable that CO2 storage operations be at least 800–1000 m deep. In addition, the great majority of oil and gas reservoirs, still in production, are underlain by deep saline aquifers such that storage of CO2 in these aquifers may materially impact oil and gas production; consequently, these aquifers or portions thereof may be excluded for CO2 storage in the near term. In Northern America, Ghaderi and Leonenko [19] reported that the typical benchmark of one megaton of CO2 storage a year (1 Mt/y) over 50 years is used in academic research and commercial projects that are currently in place or under review.
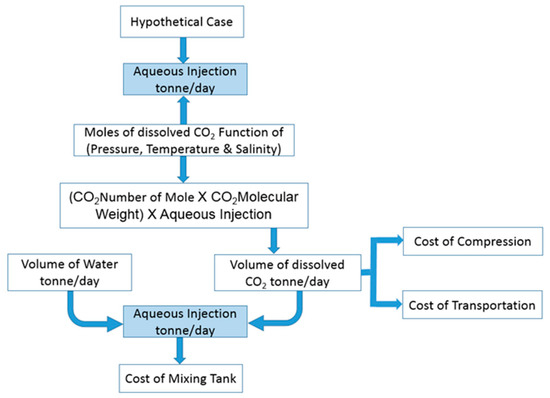
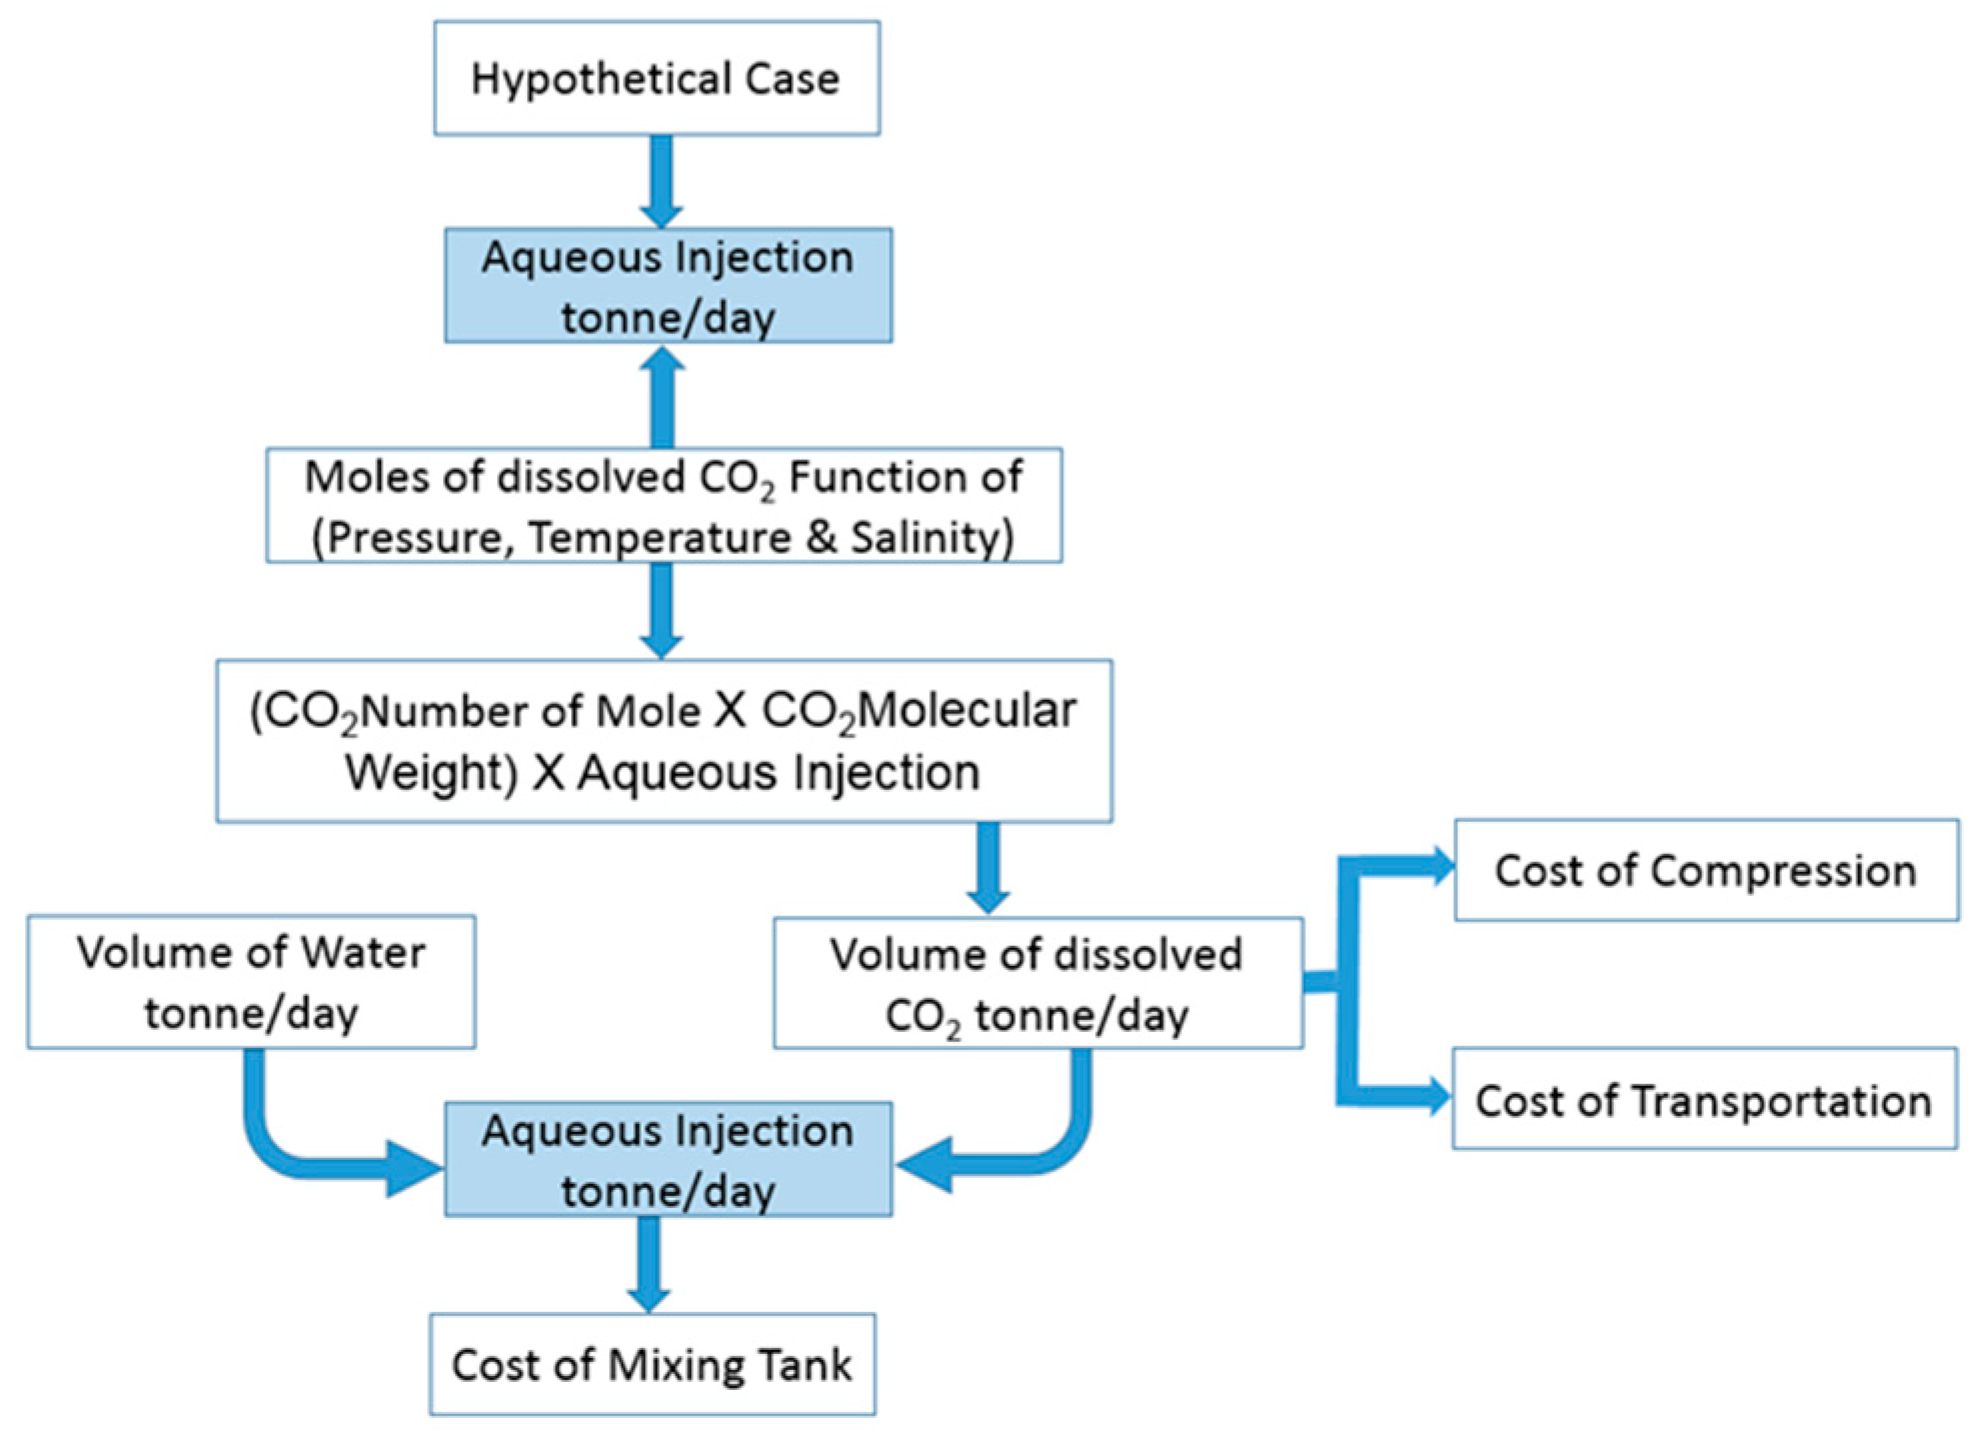
Here, we examine the added compression and transportation cost of bringing CO2 to different locations from a point source emitter and installing CO2–water surface mixing operations (Figure 1). In keeping with the potential opportunity where water recharge into the aquifers is already in operation for other reasons, we assume that the injection setup already exists.
Figure 1.
Illustrative scheme of cost calculation elements of CO2, brine and aqueous injection.
2.1. Surface Dissolution
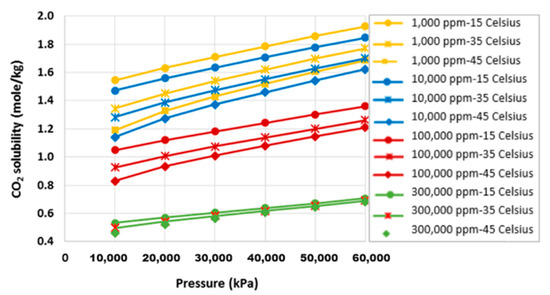
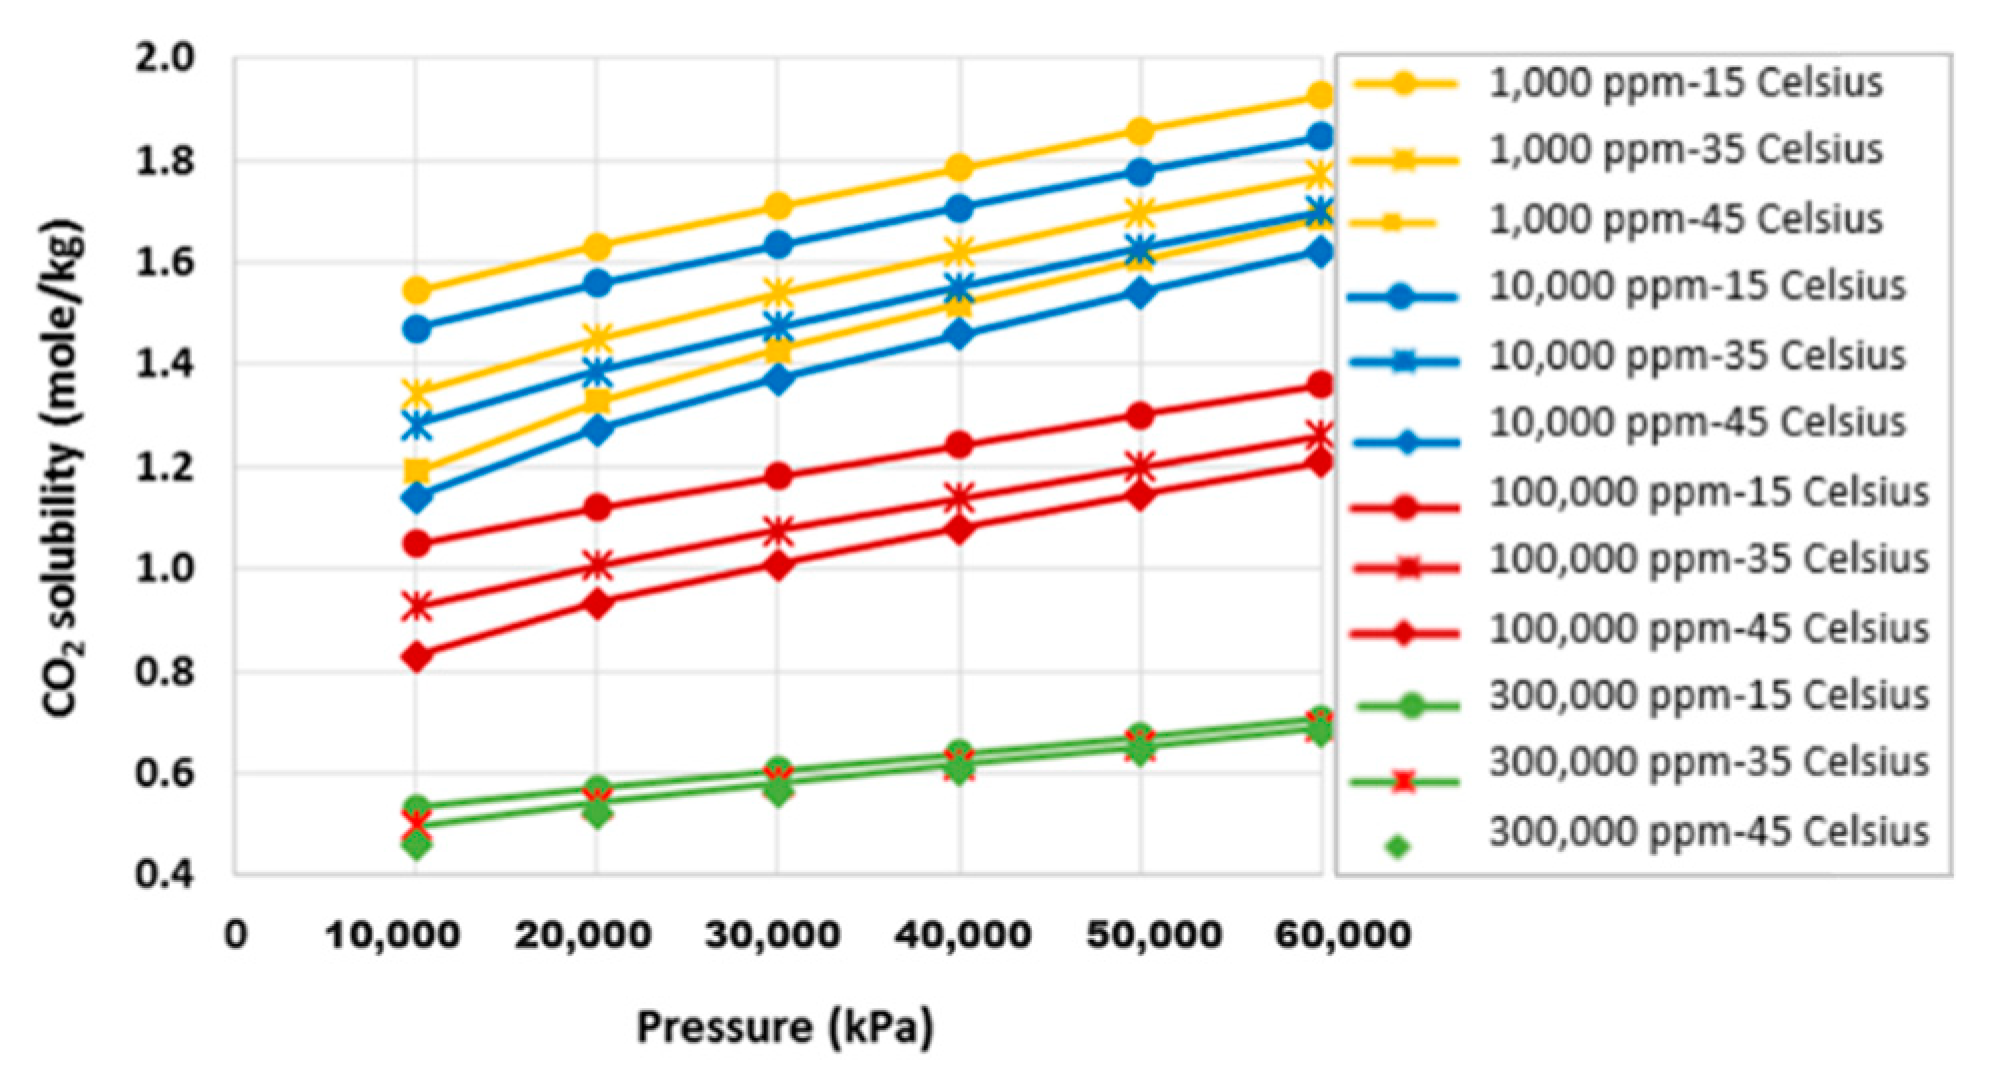
CO2 solubility in brine is a function of pressure, temperature and salinity. The CO2 solubility decreases with increasing salinity and temperature, and increases with increasing pressure. Figure 2 shows the solubility of CO2 at different conditions that can reasonably be considered for the surface dissolution facility. The solubility is calculated using a CO2–Brine phase equilibria model of Zhao et al. [20], matching the other studies [21,22,23].
Figure 2.
CO2 solubility as a function of pressure, temperature and salinity, generated using Zhao et al. [20].
Figure 2 illustrates CO2 solubility at different conditions covering pressure values for aquifer injection at depths of 500–3000 m, assuming 90% of fracture pressure gradient of 23 kPa/m; salinities of 1000, 100,000 and 300,000 ppm covering the wide range of values reported in American and Canadian situations; and surface temperatures of 15, 30 and 45 °C. Solubilities at other conditions are easily obtained applying the model of Zhao et al. [20].
The CO2 to be injected is dissolved in the injection water at the surface, so for given surface conditions the number of moles CO2 dissolved in 1 kg of water (e.g., from Figure 2) and maximum well water injection rate (from Table 1 and Table 2) are by:
At the surface conditions, mass of dissolved CO2 at the injection stream is given by;
where V is volume, is density, is number of mole, mw is molecular weight, H2O and brine are taken for simplicity to be 1000 kg/m3.
The rate at which CO2 dissolves into the brine determines the size of the surface mixing vessel. This depends on how the CO2 is dispersed in the water, for example, through a distributor arrangement that injects the CO2 as small bubbles or droplets into the brine, or using an agitator within the tank, or even an inline mixer. Burton and Bryant [11] and Eke et al. [12] suggested that 90% of CO2 dissolution can occur within a residence time of 9–12 min even without agitation.
The dissolved CO2 in water generates carbonic acid, a fluid with corrosion potential, creating possible issues for common carbon steel materials [11,12]. Carbonic acid can be corrosive to piping, valves, seals, and O-rings, so design precautions for surface equipment and injection wells are necessary. Although it is costly, Eke et al. [12] suggested that stainless steel materials should be employed for corrosion resistance in the injection station construction. Alternatively, and perhaps more cheaply, the issue may be managed by corrosion inhibitors, chemical neutralisation or buffering, depending on the water chemistry. However, there is some advantage to retaining a low pH insofar as dissolution may be enhanced in the near wellbore region of the injection formation, improve injectivity and benefit the injection strategy.
The mixing tank costs are related to the mixing pressure of the tank, the flow rate of the injection and the residence of time. The following parameters (tr = 4 min, FS = 3 and R = 0.6 m) and equations are used to estimate the mixing tank costs [11];
σ: Yield stress of steel, 30,000 psi, Pmixing: mixing tank pressure psi, r: radius of mixing tank ft, FS: Factor of Safety, T: mixing tank wall thickness ft.
R: radius of mixing tank “ft”, L: length of mixing tank “ft”, : injection rate “ft3/day”, tr: residence time “minutes”.
where T, r, L are in inch units.
2.2. Compression Cost
The allocation of CO2 separation (capture) and compression costs depends on where the system boundaries are taken. Separation costs depend on the source, purity, technology and other factors for which there is an extensive literature. Since this cost is necessary and essentially the same whatever method of CO2 sequestration/storage is applied, we disregard it from the current analysis. Regarding supply to the reinjection site, if the CO2 is already available at pipeline pressure then only the added costs of transporting the CO2 to the “new” site need to be incorporated (i.e., additional pipeline plus a booster pump to overcome the additional line pressure losses). We consequently separate CO2 compression (which uses a large amount of energy and relatively expensive capital equipment) and pumping (which uses comparatively much less energy and simpler equipment). This recognizes that in some situations compression may be necessary but not in others. We disregard the water pumping costs, which we take to be already sunk, since the CO2 sequestration is simply an add-on to an existing waste-water injection.
Cost of compression is calculated following the procedure of McCollum and Ogden [24], with some updated equations and calculation procedures, explained in Dawson et al. [25].
where “” is CO2 flow rate (t/day), “Zs” is average CO2 compressibility for each individual stage, “R” is the gas constant (8.314 kJ/kmol-K), “Tin” is CO2 temperature at the compressor stage inlet (K), “M” is the molecular weight of CO2 (44 kg/kmol), “ηis” is isentropic efficiency of the compressor, “Ks” is the average ratio of specific heat of CO2 for each individual stage, “CR” is compression ratio of each stage.
where “Wp” is pumping power requirement (kW), “” is the average density of CO2 during pumping (630 kg/m3), “η” is efficiency of the pump, Pcut-off is the CO2 critical pressure, Pfinal is the desired injection pressure.
where “Ccomp” is capital cost of compression, “Cpump” is capital cost of the pump, and “mtrain” is the CO2 mass flow rate through each compressor train (kg/s).
2.3. Transportation Cost
Compressed CO2 is transported through pipelines. There are a variety of capital costing models for CO2 pipelines in the literature; a convenient one for scoping purposes is provided by McCollum and Ogden [24] based on that it is a function only of CO2 mass flow rate (m) and pipeline length (L), avoiding the complexities of more advance pipeline diameter calculations.
where “L” is pipeline length (km), “FL” is location factor; “FT” is terrain factor.
3. Economic Analysis
Here, three examples are presented to provide a sense of the CO2 sequestration costs associated with water reinjection. The depth of the reservoirs for carbon storage is taken as 1000 m, maximum bottom hole injection pressure 20,700 kPa (using 90% of fracture pressure gradient of 23 kPa/m), constant surface temperature of 240C and average salinity of 100,000 ppm. Under this condition, 1.052 moles/KgH2O of CO2 is expected to dissolve in the surface mixing tank (e.g., 4.6% of the injection stream (Aqueous) is dissolved CO2).
A typical water reinjection well operates at ~1500 t/day and we use this as a basis. The actual rate depends on site conditions, depth of the injection target and permeability amongst others. Most reinjection sites have multiple injectors and, once the optimal rate has been established, it is typically cheaper to drill additional wells rather than increasing the injection rate per well.
For annualising the costs, a capital recovery factor of 15% of the cost components, 4% operation and maintenance (O&M) factor for compression and 2.5% O&M factor of capital cost for transportation.
The cases are: 1500 t/day injection rate, typical for a single well and corresponding to ~25,000 tonnes/year of CO2; 69,000 tonnes/day injection rate, a moderately sized field corresponding to ~1,150,000 tonnes/year CO2 and about 46 injection wells; and 350,000 tonnes/day injection rate, a very large operation corresponding to ~6,000,000 tonnes/year CO2 and using 240 injectors.
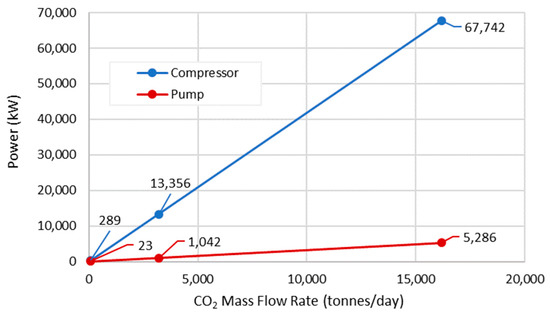
The following Figure 3 shows the total power requirement for the compression and pump over a range of flow rates (typically, CO2 rates of 69 tonnes/d, 3194 tonnes/d and 16,200 tonnes/d, for aqueous injection rates of 1500 tonnes/d, 69,000 tonnes/d and 6,000,000 tonnes/d, respectively). The power requirement for the compressor and pump is a linear function of the given CO2 injection rates.
Figure 3.
Power requirement of compression and pump as a function of CO2 mass flow rate.
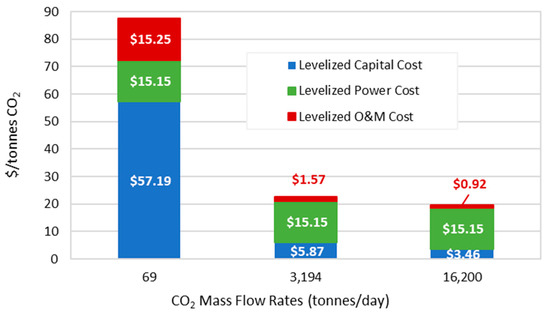
The electric power cost of both the compression and pump is 15.15 $/tonne (considering electricity price of $0.14/kWh). It would make up an increasingly larger percentage of total costs as electricity becomes more expensive. Figure 4 shows the total capital costs and operation and maintenance (O&M) costs of both compression and pump.
Figure 4.
Contribution of capital, O&M, and power to total levelized cost of CO2 compression/pumping as a function of CO2 mass flow rate.
As expected, the capital and O&M costs become a smaller percentage of total cost as the CO2 flow rate increases. The total cost is dominated by compression compared to the pump, though it may be noted that this is necessary for any CSS operation and does not represent an “added cost” for using the water reinjection sites.
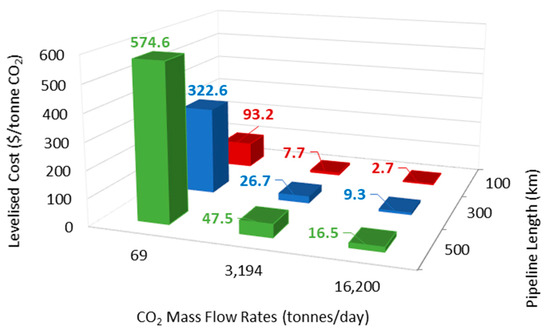
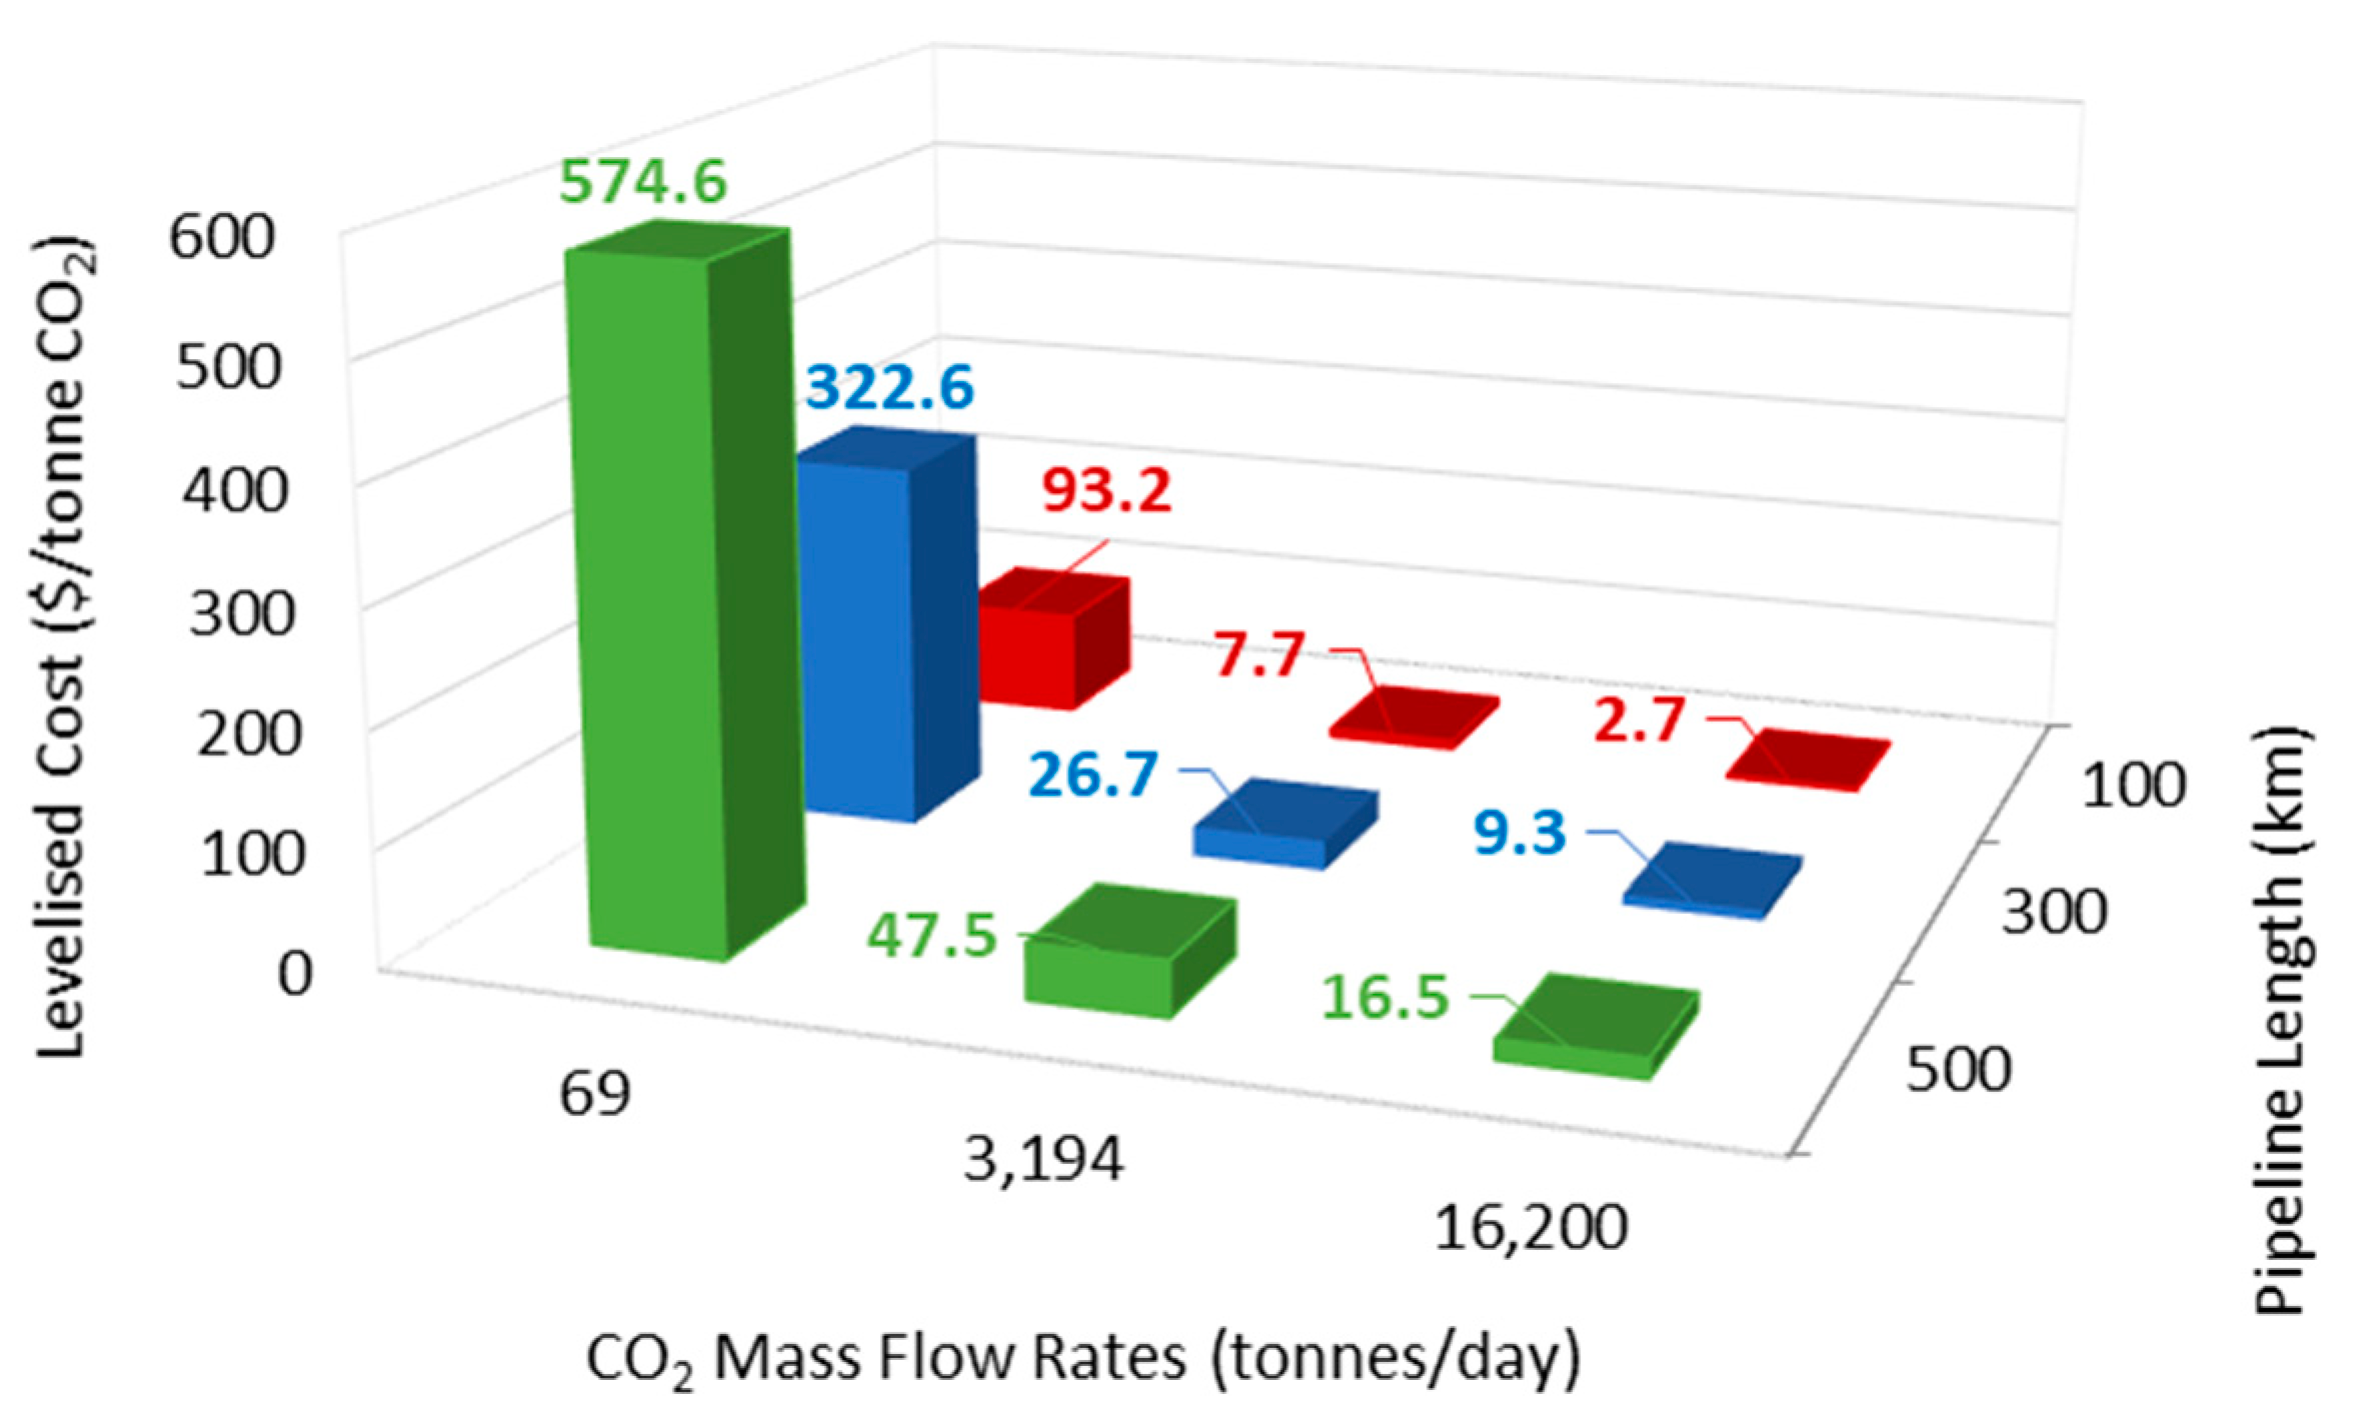
There is obviously a large advantage in minimising the distance for pipelines to transport the CO2 to the injection site. To account for required CO2 transportation from source to site, three different distances, 100 km, 300 km and 500 km, are considered. Figure 5 shows the total levelized costs (e.g., Capital and O&M) over a range of CO2 mass flow rates and pipeline length. In the transportation cost calculations, location factor (LF) and terrain factor (TF) of 1 were considered, respectively.
Figure 5.
Levelized cost of CO2 transport as a function of CO2 mass flow rate and pipeline length.
The cost of a mixing tank represents the only extra cost for using aquifer recharge for CCS. In this study, we considered a typical water reinjection well operates at ~1500 t/day. Based on the Burton and Bryant (2009) cost model, the cost of mixing tank solution for a fluid (Aqueous) injection rate of 1500 tonnes/day and mixing pressure of 20,700 kPa is ~$26,000 (see Equations (3)–(5)). This is insignificant compared to the costs associated with separating, compressing and transporting the CO2 to the injection location. These extra costs are offset against very much reduced requirements for long-term site monitoring and risk insurance.
4. Conclusions
Based on the data compiled here, there seems to be significant opportunity for CO2 sequestration using co-injection of dissolved CO2 where large volumes of wastewater are already being reinjected into aquifers. There seems to be ample scope, no significant technical barriers and the economics may prove attractive in many circumstances (mainly depending on the distance to CO2 point source emissions). Although the proposed strategy may be more expensive in terms of specific CO2 injection in $/tonne, this can be offset by reducing the risk of CO2 leakage from the formation and the associated long-term monitoring, risk and compliance costs. Importantly, produced water management practices often rely on injection into aquifers for water disposal and these activities already exist across the United States, Canada and other countries, so long distance additional transport lines should not be necessary.
Author Contributions
Conceptualization, J.R.U.; methodology, C.K., V.R. and J.K.P.; validation, all authors; investigation, C.K. and J.K.P.; writing—original draft preparation, C.K. and J.K.P.; writing—review and editing, V.R., J.R.U. and S.D.G.; visualization, C.K.; supervision, V.R., J.R.U. and S.D.G.; project administration, S.D.G.; funding acquisition, J.R.U., V.R. and S.D.G. All authors have read and agreed to the published version of the manuscript.
Funding
This work was funded by the Australian National Low Emissions Coal Research and Development (ANLEC R&D). ANLEC R&D is supported by Low Emissions Technology Australia (LETA) and the Australian Government through the Clean Energy Initiative.
Data Availability Statement
Data is provided in this article. Additional data is available on request.
Acknowledgments
The authors wish to acknowledge financial assistance provided through the Australian National Low Emissions Coal Research and Development (ANLEC R&D). ANLEC R&D is supported by Low Emissions Technology Australia (LETA) and the Australian Government through the Clean Energy Initiative. This work is related to ANLEC R&D project 7−250 1115−0268. Two reviewers are thanked for their comments that improved this manuscript.
Conflicts of Interest
The authors declare no conflict of interest.
References
- IPCC. IPCC Special Report on Carbon Dioxide Capture and Storage. Prepared by Working Group III of the Intergovernmental Panel on Climate Change; Cambridge University Press: Cambridge, UK; New York, NY, USA, 2005; 442p. [Google Scholar]
- Hitchon, B.; Gunter, W.; Gentzis, T. The Serendipitous Association of Sedimentary Basins and Greenhouse Gases; American Chemical Society, Division of Fuel Chemistry: Washington, DC, USA, 1996; Volume 41, pp. 1428–1432. [Google Scholar]
- Khan, C.; Ge, L.; Rudolph, V. Reservoir Simulation Study for CO2 Sequestration in Saline Aquifers. Int. J. Appl. Sci. Technol. 2015, 5, 30–45. [Google Scholar]
- U.S. Geological Survey Geologic Carbon Dioxide Storage Resources Assessment Team. 2013a, National Assessment of Geologic Carbon Dioxide Storage Resources—Data: U.S. Geological Survey Data Series 774, 13 p., Plus 2 Appendixes and 2 Large Tables in Separate Files. Available online: http://pubs.usgs.gov/ds/774/ (accessed on 15 March 2018).
- Prevost, H.; Fuller, R.; Altevogt, A.; Bruant, R.; Scherer, G. Numerical modelling of carbon dioxide injection and transport in deep saline aquifers. Greenh. Gas Control Technol. 2005, 11, 2189–2193. [Google Scholar]
- Bennion, B.; Bachu, S. Supercritical CO2 and H2S—Brine drainage and imbibition relative permeability relationships for intercrystallite sandstone and carbonate formations. In Proceedings of the SPE Europec/EAGE Annual Conference and Exhibition, Vienna, Austria, 12–15 June 2006. SPE 99326. [Google Scholar]
- Benson, S.; Pini, R.; Calvo, R.; Niemi, A. Relative Permeability for Multi-Phase Flow in CO2 Storage Reservoirs. Part II: Resolving Fundamental Issues and Filling Data Gaps; Global CCS Institute: Melbourne, Australia; Stanford University: Stanford, CA, USA, 2015. [Google Scholar]
- Benson, S.; Pini, R.; Reynolds, C.; Krevor, M. Relative Permeability Analysis to Describe Multiphase Flow in CO2 Storage Reservoirs; Report No.2; Global CCS Institute: Melbourne, Australia; Stanford University: Stanford, CA, USA, 2013. [Google Scholar]
- Gaspar, A.; Lima, G.; Suslick, S. CO2 capture and storage in mature oil reservoir: Physical description, EOR and economic evaluation of a case of a Brazilian mature field. In Proceedings of the SPE Europe/EAGE Annual Conference, Madrid, Spain, 13–16 June 2005. SPE 94181. [Google Scholar]
- Bachu, S. CO2 storage in geological media: Role, means, status and barriers to deployment. Prog. Energy Combust. Sci. 2008, 34, 254–273. [Google Scholar] [CrossRef] [Scilit]
- Burton, M.; Bryant, S. Eliminating buoyant migration of sequestered CO2 through surface dissolution: Implementation costs and technical challenges. SPE Reserv. Eval. Eng. 2009, 12, 399–407. [Google Scholar] [CrossRef] [Scilit]
- Eke, P.; Naylor, M.; Haszeldine, S.; Curtis, A. CO2-Brine surface dissolution and injection: CO2 storage enhancement. In Proceedings of the SPE Offshore Europe Oil and Gas Conference and Exhibition, Aberdeen, UK, 8–11 September 2009. SPE 124700. [Google Scholar]
- Tao, Q.; Bryant, S. Optimal control of injection/extraction wells for the surface dissolution CO2 storage strategy. In Proceedings of the Carbon Management Technology Conference, Orlando, FL, USA, 7–9 February 2012. SPE 151370. [Google Scholar]
- Nghiem, L.; Shrivastava, V.; Kohse, B. Modelling aqueous phase behavior and chemical reactions in compositional simulation. In Proceedings of the SPE Reservoir Simulation Symposium, Woodlands, TX, USA, 21–23 February 2011. SPE Paper 141417. [Google Scholar]
- Clark, C.; Veil, J. Produced Water Volumes and Management Practices in the United State; Report for U.S. Department of Energy, Office of Fossil Energy, National Energy Technology Laboratory: Washington, DC, USA, 2009. [Google Scholar]
- Veil, J. Produced Water Volumes and Management Practices in 2012; Report for the Groundwater Protection Council; Veil Environmental, LLC.: Annapolis, MD, USA, 2015. [Google Scholar]
- Fossil Water. Scoping Study: Produced Water Beneficial Re-Use–High TDS Waters; Report for PTAC; Government of Alberta: Edmonton, AB, Canada, 2007. [Google Scholar]
- Bachu, S.; Melnikb, A.; Bistrana, R. Approach to evaluating the CO2 storage capacity in Devonian deep saline aquifers for emissions from oil sands operations in the Athabasca area, Canada. Energy Procedia 2014, 63, 5093–5102. [Google Scholar] [CrossRef] [Scilit]
- Ghaderi, S.; Leonenko, Y. Reservoir modeling for Wabamun lake sequestration project. Collect. Energy Sci. Eng. 2017, 3, 98–114. [Google Scholar] [CrossRef] [Scilit]
- Zhao, H.; Fedkin, M.V.; Dilmore, R.M.; Lvov, S.N. Carbon dioxide solubility in aqueous solutions of sodium chloride at geological conditions: Experimental results at 323.15, 373.15, and 423.15 K and 150 bar and modeling up to 573.15 K and 2000 bar. Geochim. Cosmochim. Acta. 2015, 149, 165–189. [Google Scholar] [CrossRef] [Scilit]
- Mao, S.; Zhang, D.; Li, Y.; Liu, N. An improved model for calculating CO2 solubility in aqueous NaCl solutions and the application to CO2–H2O–NaCl fluid inclusions. Chem. Geol. 2013, 347, 43–58. [Google Scholar] [CrossRef] [Scilit]
- Duan, Z.; Sun, R. An improved model calculating CO2 solubility in pure water and aqueous NaCl solutions from 273 to 533 K and from 0 to 2000 bar. Chem. Geol. 2003, 193, 257–271. [Google Scholar] [CrossRef] [Scilit]
- Hangx, S. Behaviour of the CO2-H2O System and Preliminary Mineralisation Model and Experiments; HPT Laboratory, Department of Earth Sciences Utrecht University: Utrecht, The Netherlands, 2005. [Google Scholar]
- McCollum, D.; Ogden, J.M. Techno-Economic Models for Carbon Dioxide Compression, Transport, and Storage and Correlations for Estimating Carbon Dioxide Density and Viscosity; Institute of Transportation Studies, University of California: Davis, CA, USA, 2006. [Google Scholar]
- Dawson, G.; Biddle, D.; Farquhar, S.; Golding, S.; Jiang, X.; Keck, R.; Khan, C.; Law, A.; Li, Q.; Pearce, J.; et al. Geochemical and Geomechanical Testing of Near Wellbore CO2 Injectivity Improvement; ANLEC. Project 7-1110-0101; The University of Queensland: Brisbane, Australia, 2014. [Google Scholar]

Publisher’s Note: MDPI stays neutral with regard to jurisdictional claims in published maps and institutional affiliations. |
© 2021 by the authors. Licensee MDPI, Basel, Switzerland. This article is an open access article distributed under the terms and conditions of the Creative Commons Attribution (CC BY) license (http://creativecommons.org/licenses/by/4.0/).