1. Introduction
Coastal erosion is a complex mechanism driven by multiple factors, combining each other at different time scales. All sites are not equally exposed to waves, currents, weathering or human activities, and the response of impacted coasts depends on their own nature and history. Thus, managing coastal erosion is not limited to prevent wave action. Indeed, establishing efficient nature-based protection solutions and relevant “red lines” against risks requires a site per site analysis, discriminating factors, identifying their temporal and spatial distribution, and estimating their relative impact.
Too simplistic visions of erosion and engendered risks, from both leaders, builders and local population, often lead to expensive and ineffective management choices. In the current context of climate change associated with increased coastal frequentation and limited financial resources, such errors can no longer persist. An appropriate way to improve coastal management is to promote a better mix and sharing of scientific and local knowledge, associating local actors to observation and monitoring of sites identified as risky. This requires appropriate tools to facilitate data and results dissemination, but it appears to be very effective since more sites can be monitored and more actors will finally share a common improved knowledge of risks, matters and potential nature-based solutions.
In France, a first participatory application (RIVAGES) was created in 2017, to monitor coastal movements basing on smartphone GPS data [
1]. This application and its workflow are dedicated to long-distance monitoring along continuous shores. They allow tracking large regional-scale erosion processes. Where sites are small, disconnected and submitted to meter-scale erosion events, the sensitivity of smartphones GPS becomes insufficient, and 2D data are too limited to describe processes precisely. Thus, in such cases, 3D reconstructions appear to be much more powerful, but until this last decade, they required expensive professional technics, hindering possibilities of frequent and participatory surveys. The development of structure from motion (SfM, see
Table 1 for all acronyms) and programs able to semiautomatically reconstruct 3D models, basing on simple photographs, were a first major step on this pathway [
2,
3]. Recently, some studies have demonstrated that medium and high quality smartphones, and tablets or digital cameras, provide photographs (or images extracted from videos) usable to reconstruct relevant topography models [
4,
5,
6] and to monitor volumetric changes [
3,
7].
However, community-based environmental monitoring and information systems, based on citizens’ own devices (e.g., smartphones, laptops and tablets) remained “perspectives” until now [
6], for those main reasons:
Three-dimensional models obtained by SfM-S (“Structure from Motion” by Smart devices photography) have no native absolute dimensions and over/underestimate distances heterogeneously, generating deformation and bad scaling. This phenomenon is amplified when the dataset is insufficient [
3];
Geotagged photographs produced using GPS chipsets data of smart devices do not provide a sufficient accuracy to correct such deformation and reconstruct relevant 3D models. Thus, most of developed protocols finally use additional RTK DGPS measurements and require additional professional tools during the fieldwork acquisition [
6];
The number of pictures required to obtain a relevant 3D model by SfM is high and transmission of field data from the smart device of the operator to a computer server can be difficult, especially for inexperienced operators [
8];
Routine data processing requires being optimized and automatized to be cost-effective and extended to numerous sites;
Integrated tools, facilitating interactions between participant citizens, people able to interpret data and coastal managers were still lacking.
ODySeYeu is a research program initiated in 2018 and aiming to develop collaborative protocols and tools to monitor and understand environmental dynamics around the isle of Yeu, located westward middle French Atlantic coast (
Figure 1). A consortium of partners, involving a multidisciplinary academic scientific team, the municipality of Yeu, four local associations, two schools and two local companies, manages the program. In a coelaborative approach, the consortium was invited to design collectively a collaborative solution to monitor, in 3D, the development of erosion along 9 sites, where major coastal risks had been identified by the municipality and the scientific team.
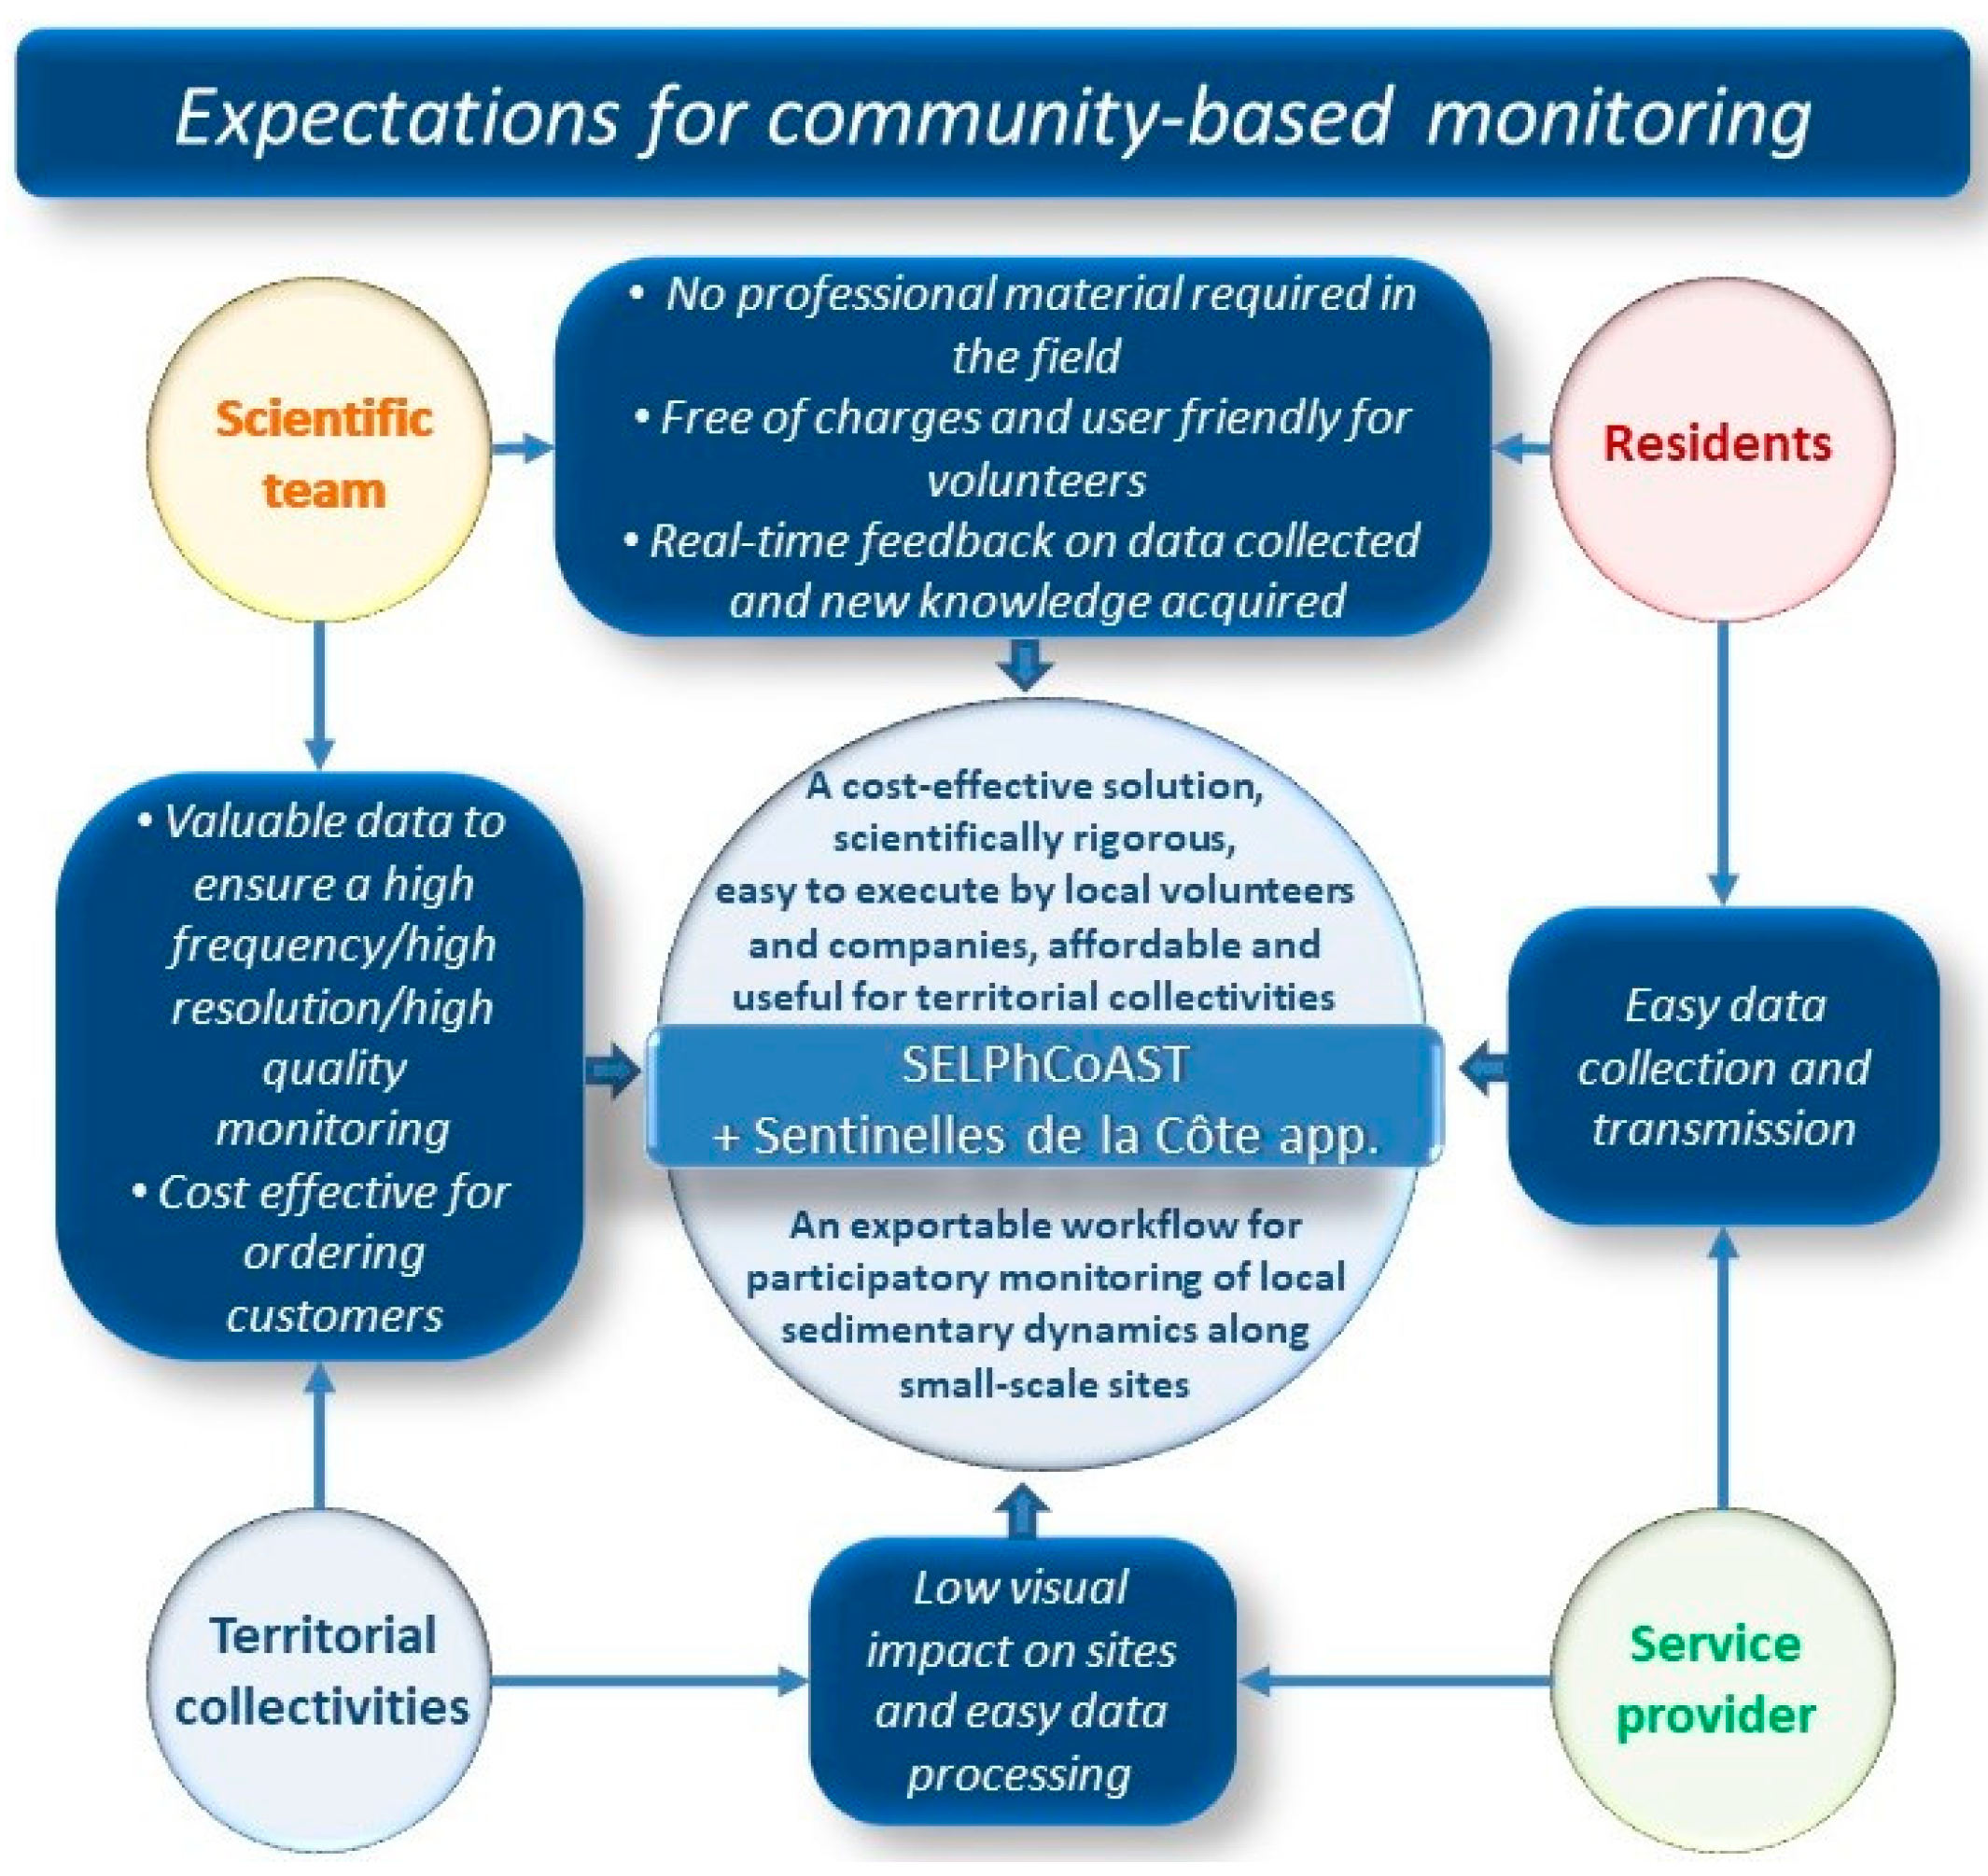
Expectations of the different actors were listed (
Figure 2) and the two partner companies DIGISCAN3D (specialist in 3D measurement for industry and cultural heritage, 4 rue des Tuiliers, ZA de Viais, 44860 Pont-Saint-Martin, France) and Studio MATAVAI (specialist in web application development, 24 rue Georges Clémenceau, 85350 île d’Yeu, France) were challenged to develop and set up respectively:
For DIGISCAN3D: a workflow called SELPhCoAST (Suivi d’Environnements par Lasergrammétrie et Photogrammétrie Collaborative Assistée pour Smartphones et Tablettes), based on SfM-S data treatment. To respect the established specifications, the solution had to enable the 3D monitoring of sites up to 100 m wide, with a stable and high accuracy of results (the tolerance range was set to ±50 mm by comparison with professional tools). The workflow also had to include a rapid and simple photo acquisition protocol for inexperienced operators in the field (including an optimized number of photographs per site). Furthermore, the visual impact of the solution in the field had to be extremely reduced because four of the monitored sites are situated in a protected and classified site (no targets and no marks if possible). Finally, treatment also had to be cost-effective for the territorial collectivity partner (less than €5000, per year and per site, for a monthly monitoring).
For STUDIO MATAVAI: Specifications for an application designed for smartphone and tablets. This multiplatforms application, named SENTINELLES de la Côte, should (i) enable the ODySeYeu team to guide citizens in operating the SELPhCoAST acquisition protocol in the field, through a free of charges and user friendly application, (ii) operate data transmission to DIGISCAN3D and the scientific team and (iii) be interactive and facilitate dialogue between users and the ODySéYeu team (observation, information, remarks or interrogations sharing in both ways).
At the same time, the ODySéYeu team is committed to upload regularly public new 3D models (interpreted and annotated), based on photographs datasets provided by participant citizens, on Sketchfab® (public free-access online 3D visualization platform,
sketchfab.com, accessed on 30 December 2020).
SELPhCoAST is a protected workflow, property of DIGISCAN3D Company. This paper describes how the ODySéYeu academic scientific team tested the workflow to validate metrology, reproducibility and robustness of results and the operability of the protocol, when used in the field by inexperienced operators with different devices. This article also presents and discusses the results of the first 20 months of semiparticipatory monitoring (test phase) for the site of Ker Châlon.
2. Study Area
Yeu is an inhabited island located at 23 km from the French west coast. Geologically, the isle is formed by an asymmetric anticlinal structure of the Armorican gneiss bedrock. This large NW–SE fold, and the subsequent foliation of gneiss, impact the morphology of the island and divide it into two characteristic types of coasts: the SE coast, exposed to Atlantic swells and displaying meter to decameter-scale gneiss cliffs, and the NE coast, turned landward and much protected from swells. This coast is characterized by a succession of adjacent systems of beaches, dunes and coastal marshes (from 10 m to 2 km wide), following major geological structures and separated by rocky points. Differential erosion of the two types of coasts was estimated from the 50s to 2011, highlighting chronic erosion along some sectors of the NE coast, with speeds around 1 m/year [
9]. Discriminating anthropogenic responsibilities in this erosional process is difficult but the extensive extraction of sand, peat and gravel, on beaches and dunes, and the successive extensions of the harbor across the 19–20th centuries are obviously involved. Daily human activities also have a clear impact because five thousand people live permanently on the isle and about three hundred thousand visitors come each year for durations from a few hours to a few months. Thus, sandy coasts are extremely solicited and exposed to different permanent or seasonal human activities (upkeep of public networks and facilities, fishing, building, tourism, etc.).
In 2014, successive storm events increased erosion in many sectors all around the island. The sand of some western pocket beaches entirely migrated to the foreshore, which had never been seen before according to old memories. Sand cliffs appeared in many sites along eastern and northern coasts. Since 2014, relatively favorable weather conditions allowed to get sand back on western pocket beaches, highlighting their high resilience ability. A few dunes also seem to grow again, but erosion always seems predominant in most of the eastern and northern sectors. Along the eastern coast, erosion is becoming more and more preoccupying because of exposed buildings. Some major public infrastructures, facilities and networks are being exposed too. In particular, water and electricity supply pipes and cables land at different places along this coast, and are buried along large portions of this coast, before joining distribution infrastructures (
Figure 1).
To experiment the participatory monitoring, nine sites related to major issues (heritage, public networks, buildings, etc.) were chosen along the eastern coast by the ODySéYeu consortium. Four sites lay within a classified area, justifying the major constrain of a minimal visual impact of required infrastructures if needed. All sites display at least a few “inert areas”, such as outcropping bedrock or sealed reinforced concrete. Site extent never exceeds 100 m for 5 m high. The site of Ker Châlon was chosen here to illustrate tests performed to challenge the SELPhCoAST workflow. This site shows the most complex morphology (two eroded lobs and large screes, generating reverse angles (
Figure 1). Its size (30 m wide, 4 m high and 5–11 m deep) enables to challenge the produced morphological reconstructions in the three space dimensions. This site is also a very good example of mixed issues and problematics because it is situated in the middle of a crowded beach. During spring tides, waves reach the cliff base. The outcrop is composed of sand and bedrock at the base, successively overlapped by a palaeosoil of unknown prehistoric age, a sand dune and an old building of the 17th century (probably a building belonging to the first coastal defense system built on the island, according to the municipality heritage service). Finally, the positive relief of the site directly protects from the sea a recent building, parking and the main water supply pipe, all situated less than 50 m backwards. A dozen of habitations are also concerned within a radius of 100 m.
3. Materials and Methods
3.1. Modus Operandi
This section describes the four tests proceeded in order to challenge the robustness (accuracy and reproducibility) of the SELPhCoAST workflow when processed by inexperienced operators, using their own smart devices.
3.1.1. Tests 1 and 2: Variability of Results Depending on Smart Devices and Operators
The first test was conducted on 20th August 2018 on the site of Ker Châlon. This day, a first terrestrial laser scanner survey was performed on the same site, to produce a “reference 3D model” (see
Section 3.2). A few days before this date, volunteers had been recruited on the ODySéYeu Facebook page, proposing followers to participate to a new participatory protocol, designed to enable citizen to participate to coastal erosion monitoring. On the 20 August 2018, five inexperienced volunteers joined the ODySéYeu team in the field, with their own smartphone (see the list and technical characteristics in
Table 2 and
Section 3.3), to test the SELPhCoAST protocol. A few instructions were given to guide them during the acquisition of 54 photographs, simulating the guidelines given by a hypothetic future participatory smartphone application (i.e., Sentinelle de la Côte). For each participant, the operation lasted between 15 and 30 min, including the presentation speech and the acquisition. Photographs taken by volunteers were collected and processed by DIGISCAN3D, to reconstruct one SfM-S model per smartphone. Then all SfM-S models were compared to the reference model (test 1, see
Section 3.4 for details about comparisons).
In order to increase the range of tested smartphone qualities and configurations, an additional test (test 2) was performed during the Science Festival of 2019, on 5th October 2019. Eight new smartphone models (see
Table 2 for technical characteristics), manipulated by new inexperienced operators were tested this day, on the eight other sites monitored in Yeu. Obtained models were compared to TLS models of these sites, following exactly the same modus operandi as in the test site of Ker Châlon.
3.1.2. Test 3: Reproducibility of Results and Long-Term Survey
Since the 20 August 2018, six SfM-S surveys were performed on the site by two volunteers following the SELPhCoAST protocol, over 20 months. Datasets were processed by DIGISCAN3D following the workflow too.
During the 20 months survey, an additional TLS model was also produced on May 2019, in order to ensure a classic low temporal resolution monitoring of the site and prevent any kind of drift or dysfunction of the SELPhCoAST workflow.
3.1.3. Test 4: Final Revision of the Protocol
The experience of the 20 months-long survey and the first creation phases of the SENTINELLES application, lead the consortium to conduct a final phase of revision and optimization of the SELPhCoAST workflow in March–April 2020. The new version of the workflow includes treatment improvements, which allowed decreasing drastically the number of required photos (from 54 to 33 for the site of Ker Châlon). In order to test the efficiency of those last improvements, a final TLS acquisition was performed on the site of Ker Châlon, and doubled by a simultaneous SfM-S acquisition, using the revised field acquisition protocol. Obtained models were compared (Test 4).
3.2. Terrestrial Laser Scanning (TLS)
In order to compare all SfM-S models produced with the SELPhCoAST workflow, and to test their accuracy, we provided a “reference model” to each site monitored in the ODySéYeu project, using a TLS device FARO® Focus S70 (Lake Mary, FL, USA). This device scans within a sphere of 70 m radius, and each scan covers 360° horizontally and 270° vertically. The FARO® Focus S70 creates a dense point cloud by analyzing the phase shift of the emitted laser beam beating a hard surface. According to FARO specifications, the estimated error in measuring the distance from a point to the source is lower than a millimeter within the 10 first meters from the source and estimated to 3.5 mm at 25 m. Points scanned beyond 25 m from the source were not taken into account during reconstruction processing of the model, to keep an accuracy of data lower than 3.5 mm for each point of the reference model. The scanner also captures color by taking high definition pictures and applying an exposure correction (high dynamic range).
In order to capture the entire relief of the site of Ker Châlon, ten distinct stations of scan are necessary, each separated by 10–20 m. The ten distinct point clouds obtained per field acquisition are realigned together using the FARO SCENE software (version 2018), to produce a global dense point cloud of 88.4 million points describing the topography of the entire site. Then the final cloud is imported in the 3DReshaper software (version 2017) to produce a textured mesh of several million polygons. All TLS data were processed the same way. Final polygon meshes were used for shape comparisons.
3.3. Cameras
Although previous studies already predicted the independence of SfM-S models accuracy with respect to the smartphone model [
6], it was necessary to multiply tests with a maximum of models with different qualities and photo treatment processes, to identify and prevent possible vulnerabilities of the SELPhCoAST workflow. On the 20 August 20, five different smartphones were used simultaneously to the TLS (
Table 2). Samsung Galaxy ® A3 (8 Mpx), Samsung ® Galaxy S7 (12 Mpx) and Sony ® Xperia XA1 (12 Mpx), are considered as mid-range smartphones. Huawei ® P20 Pro and Apple® iPhone X are upmarket devices. On the 05/10/19, 8 additional smartphone models, from mid-range to low-range devices, were also tested (
Table 2). Finally, a Samsung ® Galaxy S7 and a Huawei ® P20 Pro were used to perform the regular monitoring of the test site up to 2020.
3.4. Comparison of Models
All SfM-S models, obtained on 20th August 2018, were separately compared to the reference TLS model obtained the same day, using the GOM Inspect Pro software (version 2019). Each one was firstly scaled, using few remarkable points of the bedrock, present in both TLS and SfM-S 3D models, to create reference distances. Then eight distinct rocky zones, from dm2 to m2, distributed all over the model, and considered as inert, were used to proceed a best fit alignment between each SfM-S model and the TLS reference model. Then, in order to quantify possible deformations introduced by the SfM-S reconstruction and scaling, a shape comparison was performed using a “point-to-point distance” tool, and computing nearest-neighbor distances between homologous triangle vertices of the reference TLS and compared SfM-S 3D model. For each model, values of standard deviation (SD) and the histogram of differences between models were calculated and plotted by the software along five distinct large zones, including rocks and sand, but avoiding vegetated areas, in perpetual motion. Finally, obtained results were compared for all models and confronted to smartphone technical characteristics.
The same comparison workflow was processed to compare anachronous models to the reference TLS 3D model (20/08/18), which was considered as the original state for monitoring and used as validation data to assess accuracy of SfM-S models during the 20 months survey. Models were scaled using each time different remarkable points of the bedrock, to ensure non-dependence to scaling. Produced SfM-S 3D models were aligned by best fit, using each time different bedrock surfaces, distributed homogeneously across the site, in order to test a possible variability induced by the choice of surfaces for aligning models. Other inert parts of the bedrock were used to validate good positioning of SfM-S models on the reference model and confirm reliability of results.
5. Discussion
5.1. Validation of the Workflow
During the two participatory experiments of 20 August 2018 and 5 October 2019, and during the 20 months of semiparticipatory monitoring, our team observed and tested the operability of the entire workflow, from the first participatory acquisition step to the last step of using produced data to inform population and decision makers. Results presented here confirm that the workflow proposed by DIGISCAN3D allows inexperienced citizens producing reliable data to monitor local erosion. In the field, volunteers were surprised by the simplicity and entertainment of the acquisition (around 5 min for inexperienced volunteers, less than 3 min for experienced ones). We also observed that children from 6–8 years old, accompanied by an adult, could perform acquisitions and quickly became independent in proceeding.
Independent of the operator or the smartphone model considered, more than 70% of the TLS reference model is always reconstructed in SfM-S models. More than 95% (2SD) of points of each SfM-S model were also closer than 50 mm to the TLS reference model, and mean distances observed (on inert parts) were within the error range of point positioning indicated by the TLS producer (around 3.5 mm at 25 m). Finally, comparison of SfM-S models over 20 months also shows an excellent reproducibility of measurements on inert parts of the site, highlighting the stability and reliability of the process in time. Recent improvements made in the photoacquisition protocol further improved the accuracy and operability (
Figure 4). Mean distances to the reference and standard deviations appeared equivalent or more accurate than most recent published examples using classical GCPs and DGPS devices, or not [
2,
3,
4,
5,
6]. For all these reasons, the ODySéYeu consortium validated the SELPhCoAST workflow, and considered that it fulfills all its initial requirements in both guiding inexperienced operators in the field and producing accurate 3D models for a reliable erosion monitoring. Furthermore, the results obtained during the different tests revealed interesting issues, developed in the two paragraphs below.
5.2. Smartphone Dependence
As already mentioned by Jaud et al. (2019) [
6], the quality of reconstructed surfaces seems poorly dependent of the smartphone model. All produced datasets allowed reconstructing acceptable SfM-S models, except for the Orange® Rise 30 and the Samsung J3 (
Table 2). For this last model, the owner had deliberately lowered the resolution of images produced by his phone. This experiment may indicate that smartphones with poorly sensitive cameras (less than 5 MPx), and any other smartphones configured to produce downsized photos, were not appropriate to realize this kind of monitoring. More surprisingly, the “worst” mean distances and standard deviations obtained during tests on 20 August 2018 were obtained with the mid-range Sony® Xperia XA1, equipped with a 23 MPx camera and the high-end smartphone Huawei ® P20 Pro.
The meticulous observation of the model in
Figure 3f showed that the highest differences between the TLS model and the SfM-S model obtained with the Sony® Xperia XA1 were concentrated in parts of the site situated in the shadows. Then, comparing the resolution of photographs provided by the device at the end of the test (3840 × 2160 = 8 MPx) and the native resolution of its camera (23 Mpx), revealed the action of an “aggressive” preprocess, that reworked pixels to lower the size of native pictures before recording them on the phone. This autodegradation of data seems to affect particularly dark areas. The situation is rather similar for the Huawei ® P20 Pro, which is equipped with a complex system of three camera sensors combined to an artificial intelligence (AI), which preprocesses photographic data to “embellish” produced photos. The AI automatically rearranges pixels (pixel binning) and this intervention seems to disturb SfM-S surface reconstruction. For those two smartphone models, disturbances generated by IAs are finally minor but they increase mean distances to the reference and standard deviation and make the 3 × SD value higher than the symbolic preset “±50 mm” value (
Figure 3). When the Huawei ® P20 Pro was used to monitor the morphological evolution of the site (on 29 November 2019 and 3 February 2020), the IA was manually inactivated before photo acquisition (for the case of 07/03/20, see discussion below). Thus, SD calculated on inert parts significantly decreased (respectively 12.89 mm and 13.75 mm), making the models perfectly acceptable and demonstrating the responsibility of the IA in degrading native datasets. This point is very important for a participatory perspective, because if these kinds of photo preprocessing tend to generalize to all smartphones in the future, it could hinder the use of SfM-S. At least, smartphones using such IAs should be identified/listed. Hence, to be user-friendly, applications guiding participatory photo acquisition for SELPhCOAST should include the automatic inactivation of any IAs and resizing preprocessing, because modifying photo acquisition parameters of its own smartphone is not trivial to all users.
5.3. Inert Parts Dependence
The use of natural inert parts of the site to align chronological models is a clear advantage of the SELPhCoAST workflow, especially in the context of a protected classified site, because targets or ground mark have a significant visual impact and can arouse the attention and curiosity of some people, leading to an undesirable increase of frequentation nearby fragile areas. However, the absence of targets or marks requires in turn the permanent presence of visible, and strictly inert areas (at the scale of decades of years) within monitored sites. In Yeu, the frequent presence of bedrock outcrops along the coast is very convenient. However, on the model produced on 7 March 2020 (
Figure 5g), the downgrading of mean distance to the reference and SD clearly highlight a high dependency to inert parts clearness. Indeed, that day, sand and algae partly covered the base of the site. This punctual cover impacted several zones usually considered as inert and chosen to control alignment of models. We tried to isolate and ignore these covered zones for the control but despite our efforts the mean distance and the standard deviation measured were clearly affected, suggesting that some “dirty parts” remained unnoticed. Here, consequences are minors but this phenomenon highlights the importance of having enough large and permanently clean inert areas in monitored sites to ensure the quality of alignments and controls, whether they are natural or not.
5.4. High Frequency, High Space Resolution Monitoring
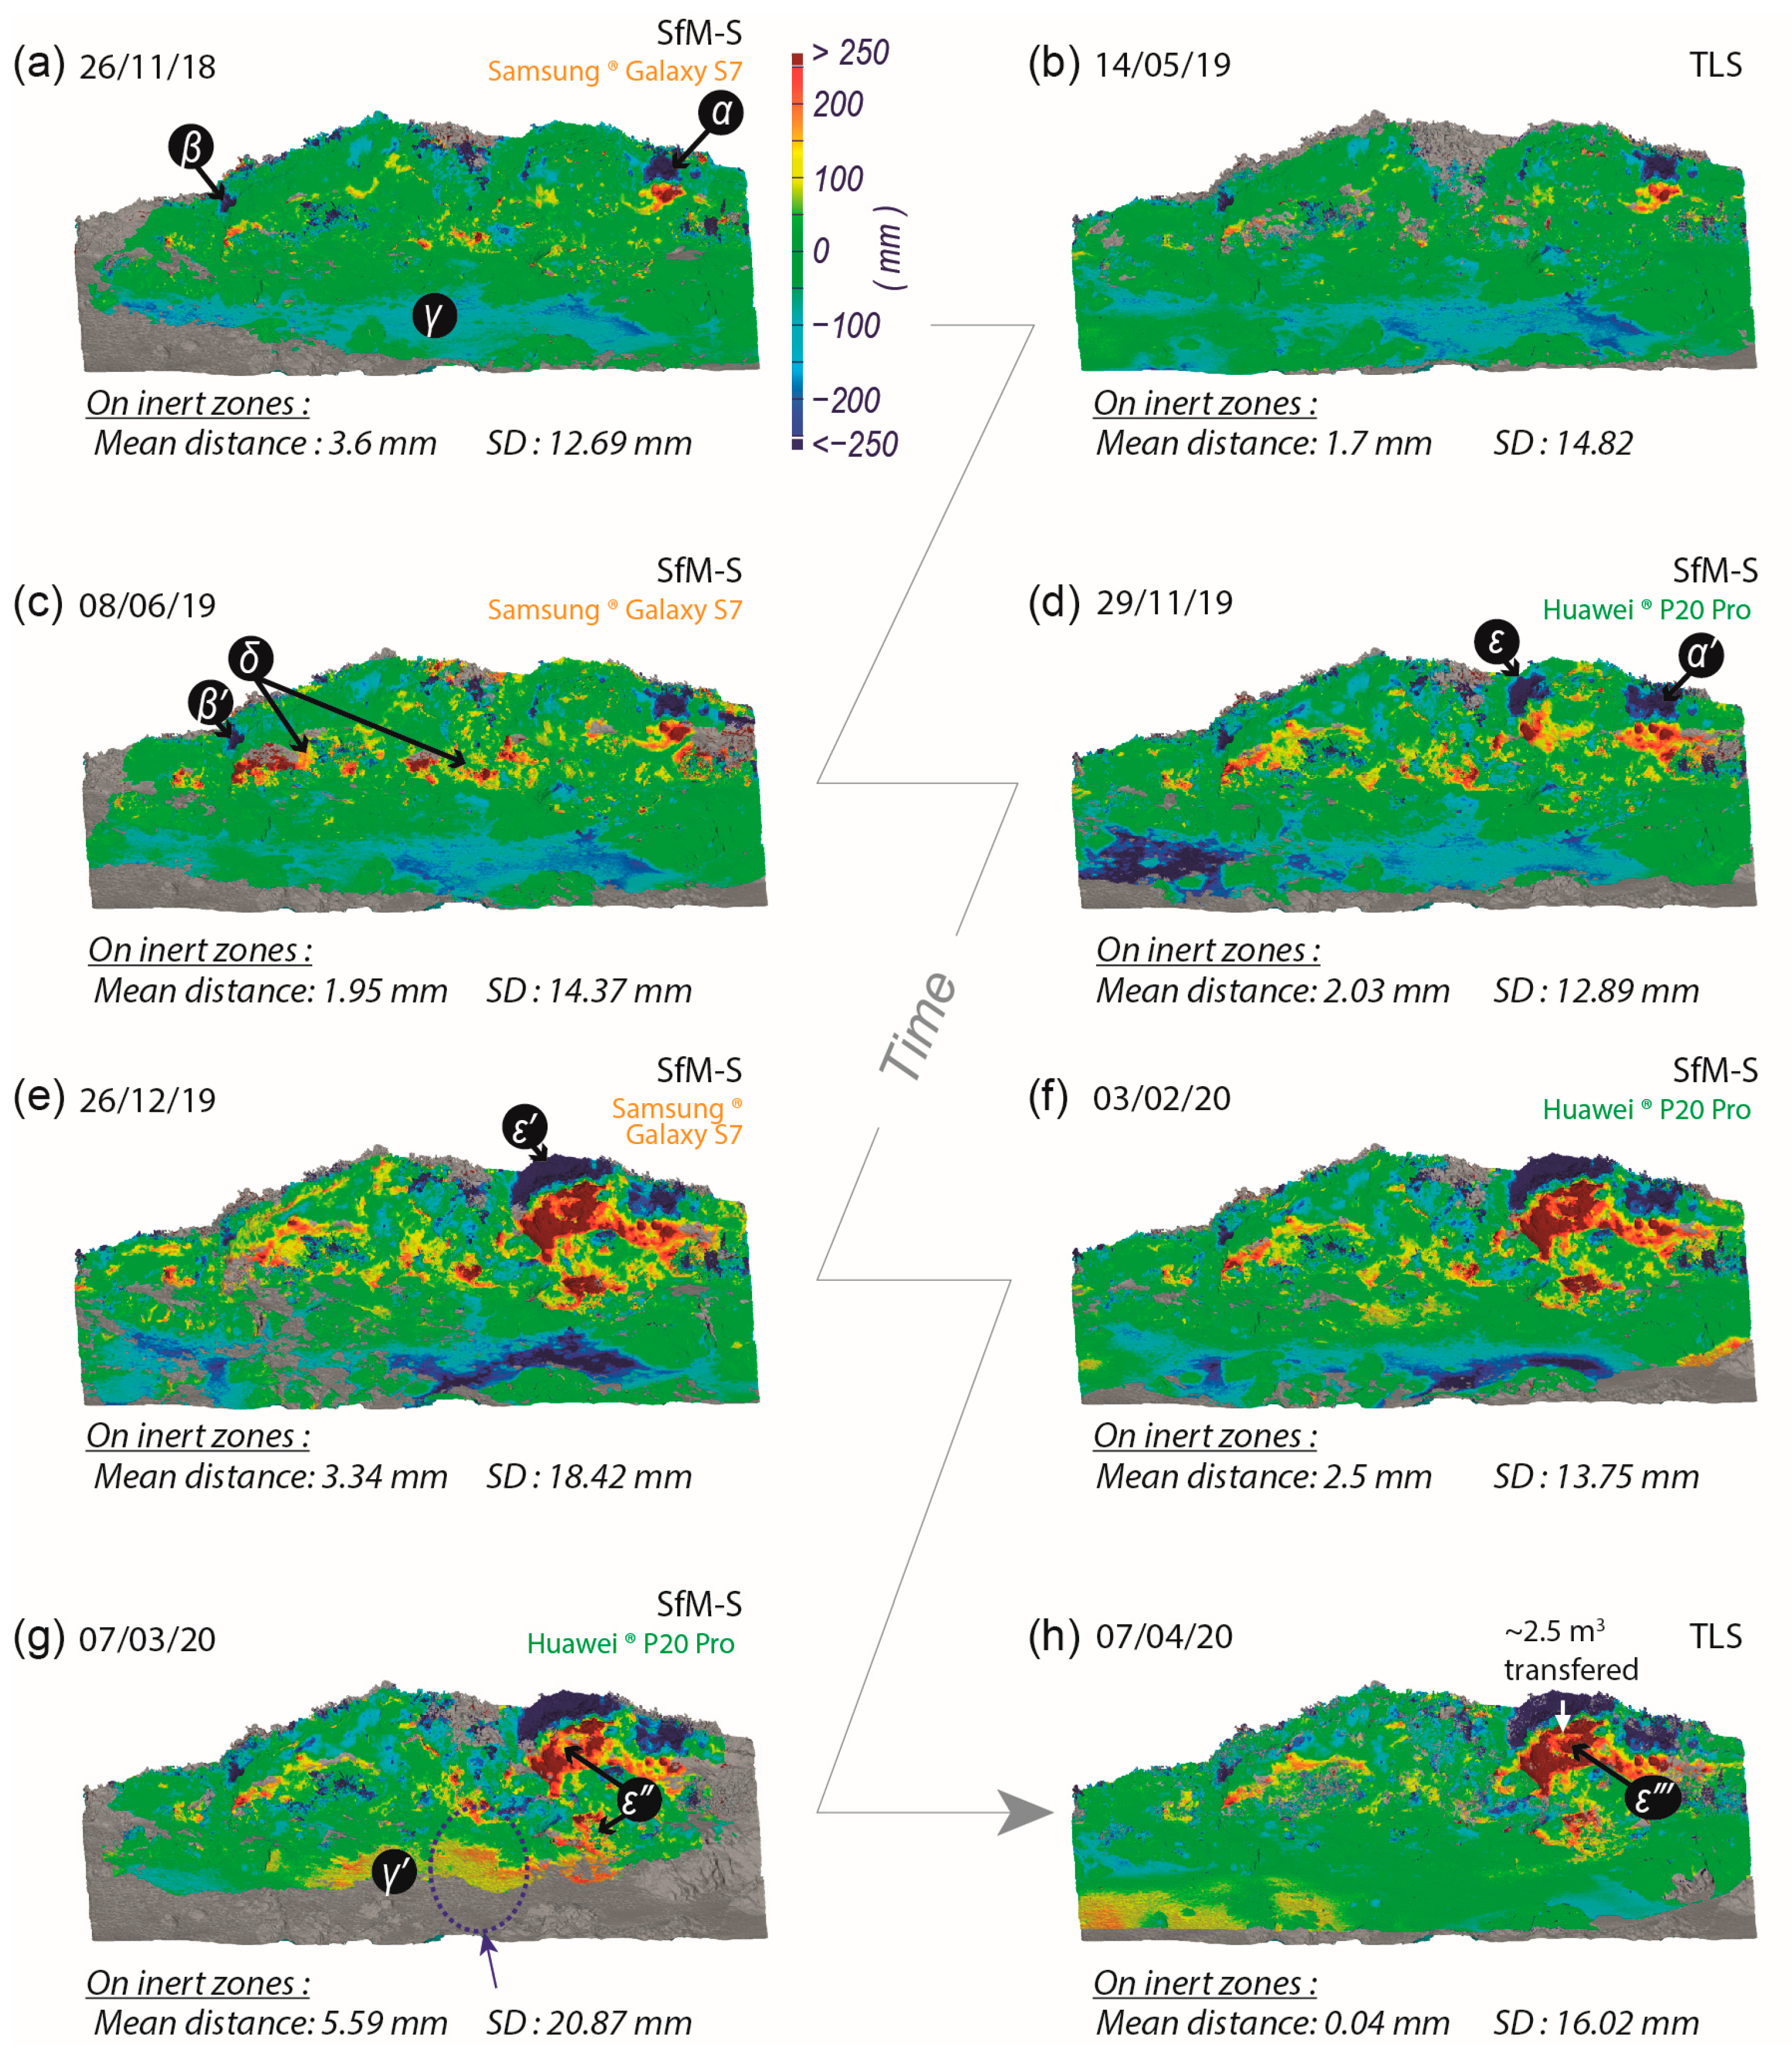
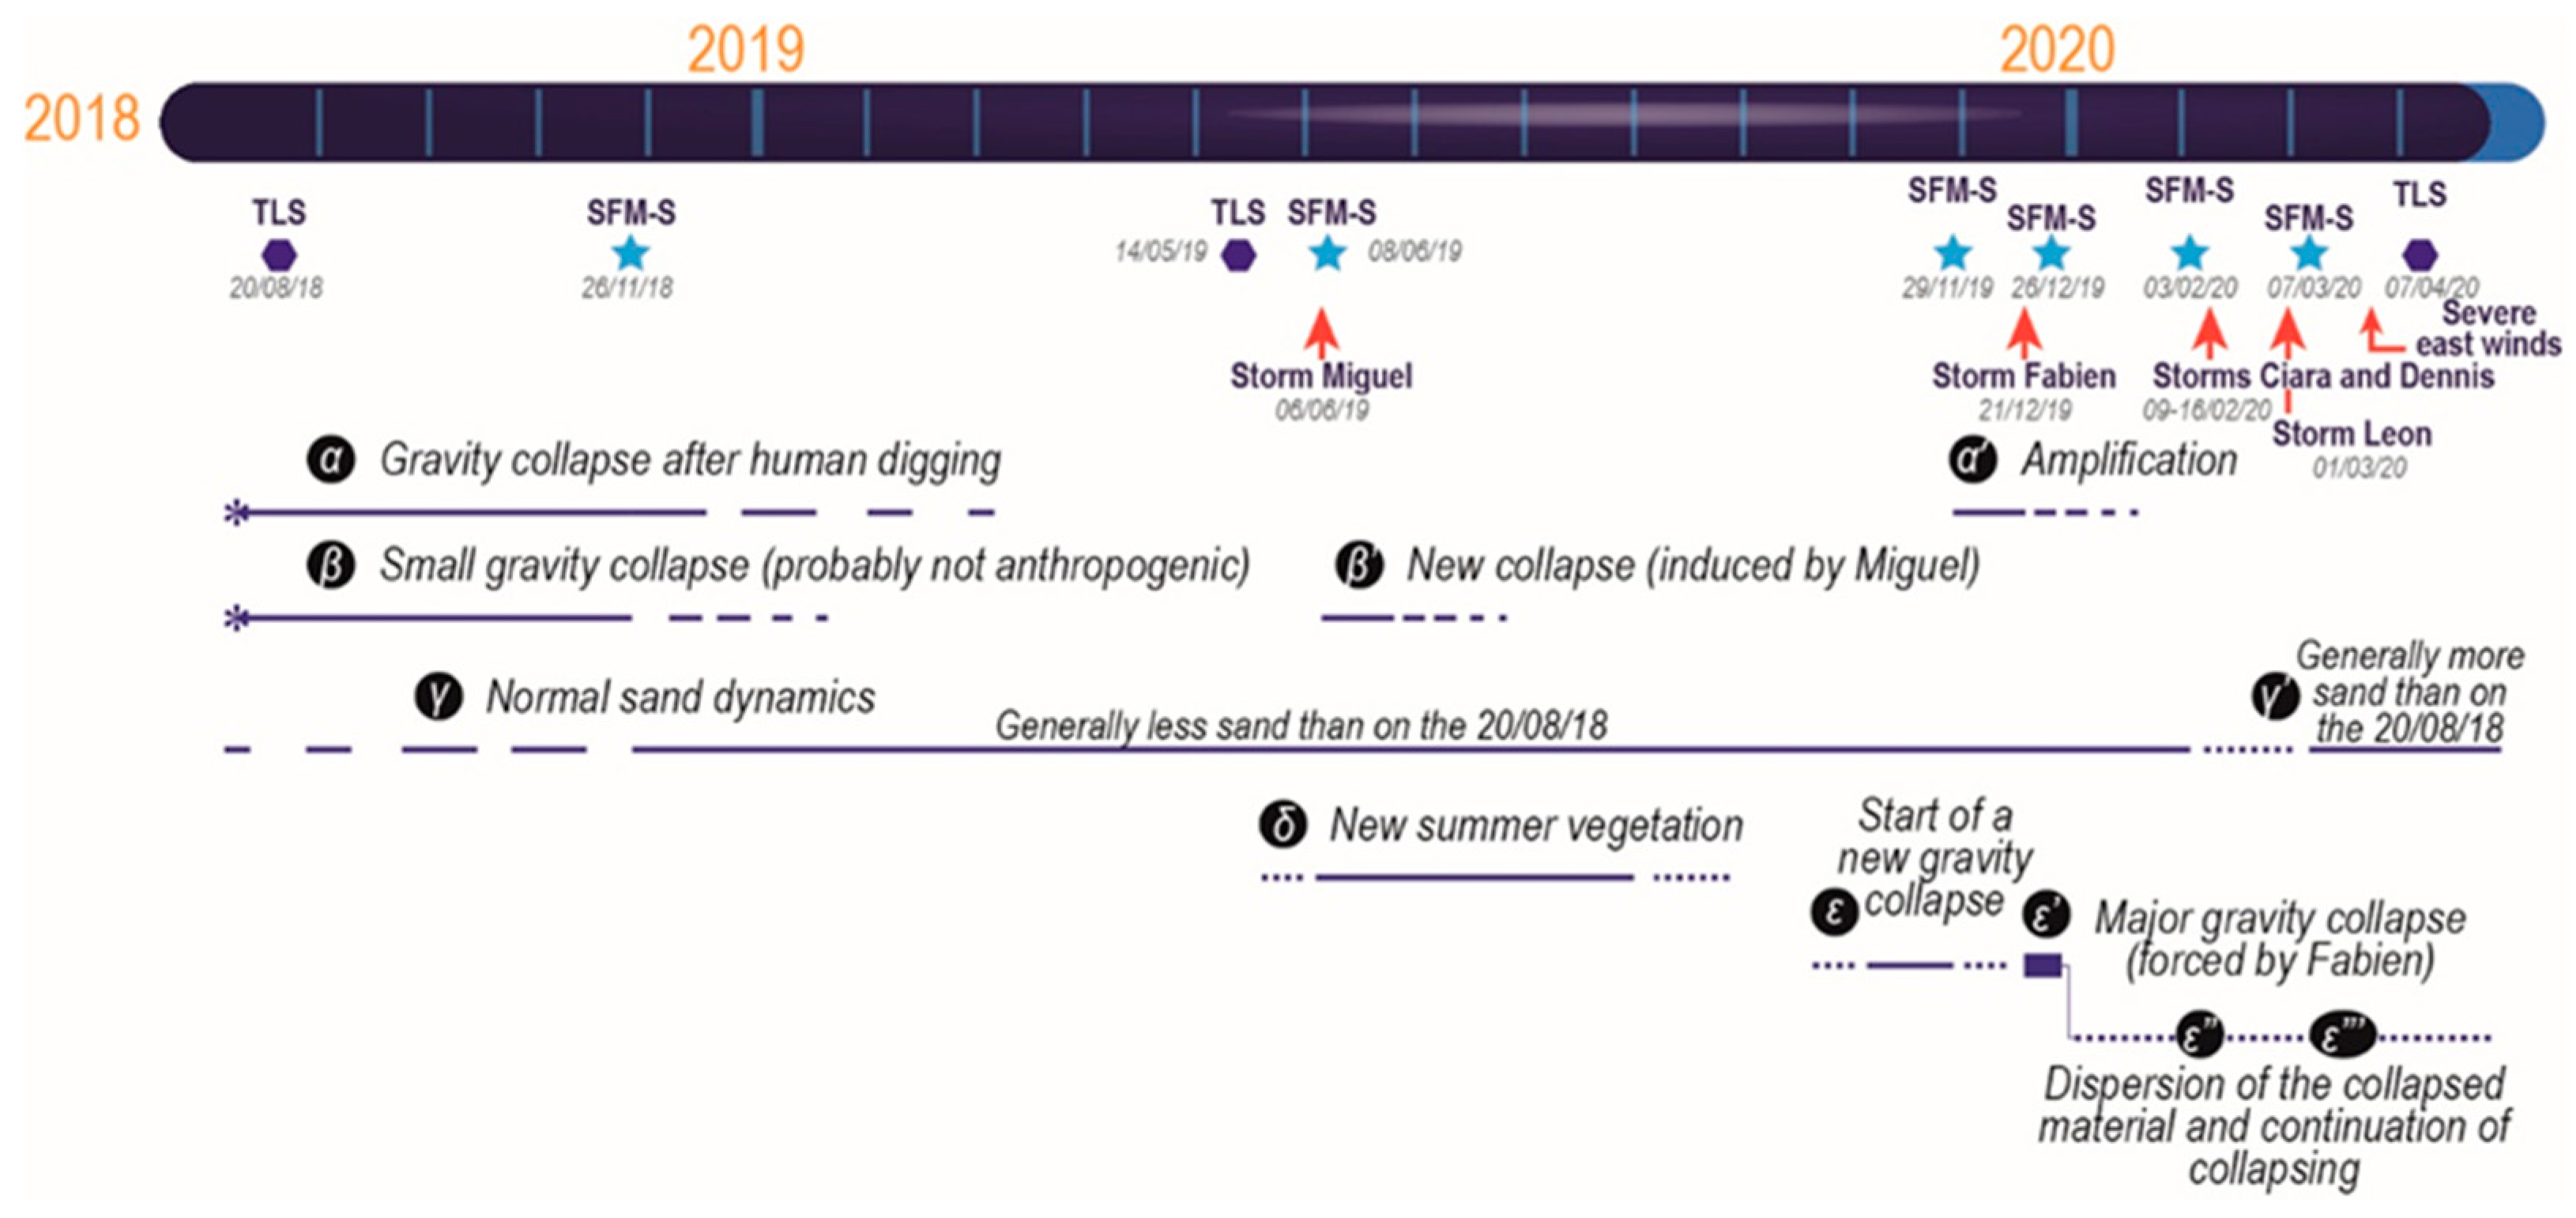
On the contrary of a classic annual survey, the frequent participatory surveys offer a better dataset to monitor the progressive actions of different erosion processes. Establishing chronologies of 3D models and schedules of events helps identifying sources of erosion. Concerned volumes can be estimated more precisely too. Furthermore, the participatory survey also favors frequent field observations (photos and comments), which can be very useful to analyze data. For example, on 20th August 2018, local volunteers reported that six days before, a group of three persons dug three sits in the sand cliff to watch a firework. Those sits were still visible in the field on 20th August 2018 (
Figure 3a). In November of the same year, those excavations had already provoked the collapse of the overlying sand and vegetation (dark blue in the upper right corner of the model, repaired by an “a” on
Figure 5a and
Figure 6), which refilled the anthropogenic holes (dark red area just below). On the same model, another typical “top blue/down red” couple is observed (b, on the left side of the model), illustrating a second gravity collapse. However, confrontation of the textured reference model and unprocessed photographs produced in August (
Figure 3a) shows that screes and collapsed sand were already present in this area, suggesting that this part of the site had already started collapsing. The other successive models attest that this isolated collapse did not amplify over time, on the contrary of the first one, which tend to extend again between June and November 2019. This last month, a new collapse appears a few meters leftward from the first one (ε in
Figure 5d and
Figure 6). The model of 26 December 2019records an acceleration of collapsing, involving several linear meters (ε’ in
Figure 5e). On the model of 7 March 2020, a first phase of dispersion of the tumbled down material is observed, while on 7 April 2020 some new material dropped down again, suggesting the simultaneous continuation of the collapse phenomenon. Here, the comparison of the reference model and the last produced model indicates that about 2.5 m
3 have dropped down over the 20 months survey. The high-resolution participatory survey adds crucial details like (1) human activities are involved in the destabilization of the right part of the major collapse, (2) the destabilization of the left part started in November 2019, drastically increased in December and was still active in April 2020, (3) the material collapsing is essentially composed of stones from the upper building and (4) the material collapsed is sometimes removed, probably by the sea.
The additional confrontation of the schedule of local storms and the evolution of the morphology of the site revealed that storms are clearly involved in the massive collapse mechanism, but waves are not the major erosion source. Indeed, major storms are generally associated to major erosion pulses but erosion is generally recorded in the upper part of the site, never reached by waves, suggesting that on this site, wind, precipitations and soil water content were more involved than wave action in the erosion over this survey of 20 months. The fact that only minor gravity collapses occurred during the late spring storm Miguel supports this assumption because the climax of the storm occurred at low tide, with a tide coefficient of 85. Thus minor collapses were probably only reactivated by associated precipitations. On 22 December 2019, the storm Fabien was responsible of major collapses but the storm is associated to a small tide coefficient of 61, and precipitations are most probably responsible of the collapse since waves did not reach the site. Storms Ciara and Denis occurred during February spring tide but they seem more associated to dispersion of the material previously collapsed than to a major new collapsing event.
This test-monitoring is a very demonstrative example to illustrate the effectiveness of the participatory 3D SfM-S monitoring to discriminate different sources of erosion on a site (human, animals, wind, precipitations, waves, etc.) and thus to be able to establish appropriate protection strategies. Hence, during those 20 months, settling hard wave protections (rocks or concrete blocks) in front of the eroding area (as recommended by many residents) would probably have created additional wave dynamics at the base of the cliff (wave reflection, vortices, etc.) and provoked more damages than not to protect. On the contrary, preventing human accessibility to both feet and edge of the dune cliff seems urgent for the safety of all, including the site itself. The future of the building remains at the top of the site also requires a special attention to establish a management policy (make archaeological excavations and let it slowly fall down and disappear or find a way to protect it, but for how long?). The temporal irregularity of the survey shown in this example will be improved with the imminent implement of the SENTINELLES de la côte application. The involvement of dozens of local actors, and the possibility for them to report any observation in the field through the application, will allow the regular processing of a new SfM-S model per month. Unused datasets transmitted will be stored, allowing one to reconstruct other intercalated models if required, for instance to document erosion more precisely around a storm, a major gravity collapse or any other major event.
6. Conclusions
In 2018, the team of the participatory science project ODySéYeu codesigned a list of requirements in order to implement a high resolution/high frequency “participatory monitoring” of the erosion, in 3D, for nine sites along the coast of Yeu (Vendée, France).
Tests presented here highlight the ability of the SELPhCoAST workflow—an integrated solution proposed by the partner company DIGISCAN3D—to produce complete and reliable 3D surface models of the test site, based on photo datasets. Produced models are accurate enough (more than 95% of points closer than 5 cm to a professional TLS model) to allow detecting any decametric change of the monitored coastline portion. Minimizing the required number of photos, and offering very simple guidelines in the field, the workflow also optimizes field acquisitions and data transmission, enabling inexperienced operators (including children) to participate, with their own smart devices, which is congruent with initial requirements.
Using this solution for a high frequency/high resolution participatory monitoring allows decrypting erosion/accretion dynamics and sources on numerous sites, better than a low temporal resolution professional scanning.
Associated with the application SENTINELLES de la Côte, this integrated solution will soon provide citizens the possibility to become true sentinels of their own coasts and to report in-situ observations. Moreover, like scientists or decision-makers, participating citizens will get a direct access to monitoring data and field information, monthly updated site-per-site. This should facilitate the dialog between all actors and strengthen the local protection policy by increasing its credibility. Although this solution was specifically designed for the island of Yeu, it could be adapted to many other sites, contexts (mountain, heritage, etc.) and purposes (monitoring, valorization, dialog between actors, etc.).


