Abstract
This paper aims to describe the seismic-driven multi-hazard scenario of the Lake Campotosto artificial basin (Abruzzo Region, Central Italy), and it can represent a preparatory study for a quantitative multi-hazard analysis. A comprehensive multi-hazard scenario considers all the effects that can occur following the base ground shaking, providing a holistic approach to assessing the real hazard potential and helping to improve management of disaster mitigation. The study area might be affected by a complex earthquake-induced chain of geologic hazards, such as the seismic shaking, the surface faulting of the Gorzano Mt. Fault, which is very close to one of the three dams that form the Lake Campotosto, and by the earthquake-triggered landslides of different sizes and typologies. These hazards were individually and qualitatively analyzed, using data from an engineering-geological survey and a geomechanical classification of the rock mass. With regard to the seismic shaking, a quantitative evaluation of the seismic response of the Poggio Cancelli valley, in the northern part of Lake Campotosto, was performed, highlighting different seismic amplification phenomena due to morphologic and stratigraphic features. Some insights about the possible multi-hazard approaches are also discussed.
1. Introduction
Strong earthquakes in mountainous regions trigger chains of surface processes that modify the landscape, bringing differing degrees of hazard, which pose a risk when interacting with infrastructures, settlements, and, in general, human life. A comprehensive seismically-induced multi-hazard scenario should consider all the effects that can occur, in addition to the base ground shaking, that can be distinguished in two main groups: (i) amplification of the seismic motion and (ii) occurrence of permanent deformations. Effects of seismic motion amplification were recognized due to specific features of the site, such as steep topography [1,2], morphology of buried valley [3], presence of soft soils infilling the valley [4,5], or intense jointing of rock masses [6]. Commonly, permanent deformations related to earthquakes are surface faulting [7,8], soil liquefaction [9,10], and earthquake-triggered landslides (EQTLs) [11,12]. The latter can interact with the surrounding environment [13] and infrastructures [14] and start other threats (cascade effect). In the case of an artificial basin, for example, EQTLs interfering with the lake can trigger a flood wave and the overflow of the dam. This seismic-driven multi-hazard scenario can be further aggravated by the simultaneous or subsequent occurrence of heavy rainfall that can remobilize slope deposits [15,16].
The simultaneous occurrence and interaction between different hazards can strongly influence the estimation of the real hazard affecting a region. Multi-hazard methodologies [17,18], should ideally evaluate all identified individual hazards possibly affecting an area and characterize the interactions between them, providing a holistic approach to assessing the real hazard potential and helping to improve management of disaster risk mitigation [19].
Usually, the evaluation of geological hazards is carried out through independent analyses, adopting non-uniform procedures and different space–time resolutions. This makes it difficult to compare different types of hazards and leads to neglecting possible interactions between threats. The relationships between the various types of hazard may range from a contemporary occurrence or interactions to cascade or domino effects [15,19,20,21]. The total hazard of the area under examination can be underestimated considering only one hazard at a time, because it could result in higher than the simple addition of different hazards, described as independent from the others [22].
The identification of areas of spatial overlap by superimposing hazard layers can be called a “multiple-hazards analysis” (e.g., [17,23,24]), and can be described as a multi-layer single-hazard approach [25]. The identification of areas likely to be most affected by several hazards is based on spatial analyses carried out by geographic information systems (GIS) [26,27,28]. The literature includes several methodologies to compare natural hazards (e.g., [17,20,26,29,30], and some methods to investigate the potential hazards interactions are also available (e.g., [18,19,25,31]). Qualitative or semi-quantitative approaches that use thresholds, interaction matrices, and hazard/process flow diagrams are used. A quantitative estimation of the frequency of the natural hazard can be included in these methods, while some works go towards a quantitative analysis of the hazard [22,32].
A multi-hazard study represents a valuable tool for risk mitigation land planning. For this purpose, it is possible to create maps showing the spatial distribution of all the geological hazards that can occur in a determined time interval. This approach is based on a fixed probability of occurrence for all the involved processes (i.e., using a given return time). Then, the effects of different processes can be combined in both “multiple-hazard” method and multi-hazard method (i.e., considering chain effects). Moreover, the scenario studies can be also effective for managing emergency plans. This analysis concerns a given calamitous event (with its probability of occurrence and its intensity), and the related induced effects, allowing to manage the cause–effect relationships between different hazards and to produce maps of multi-hazard and/or multiple-hazard effects.
This paper aims to develop a general cognitive framework to a multi-hazard analysis, starting from the study of the geological hazards that could involve the Lake Campotosto basin (Abruzzo Region, Central Italy) and surrounding slopes (Figure 1). The Campotosto artificial basin represents the second largest artificial lake in Europe, with 0.3 km3 of reservoir volume and an area of 14 km2. This important reservoir is located in a mountainous region characterized by high seismic hazard (expected peak ground acceleration at the seismic bedrock equal to 0.250–0.275 g for a return period of 475 years, according to the Italian seismic hazard map [33]), and it is crossed by the active Gorzano Mt. fault system [34,35] (Figure 2a), which was activated during 2009 and 2016–2017 seismic sequences. Therefore, this basin might be affected by a complex earthquake-induced chain of geologic hazards, such as the seismic shaking, the surface faulting hazards of the Gorzano Mt. fault, which is very close to one of the three dams that form the reservoir (Rio Fucino dam) [36], and by the EQTLs of different sizes and typologies (e.g., deep-seated gravitational slope deformations (DsGSD)). A further cascade effect triggered by the landslides may consist of a flood wave that interferes with the lake, and that can induce a collapse of the dam or overtop it and cause downstream flooding.
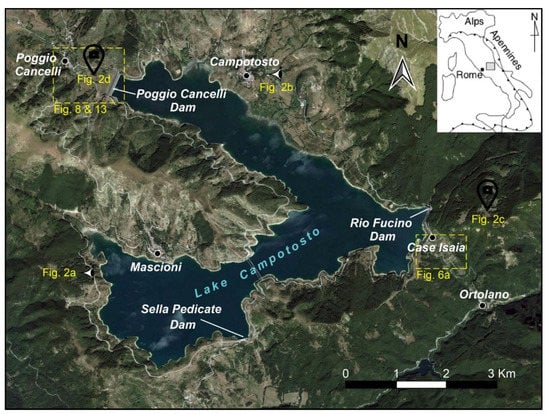
Figure 1.
Satellite view of the Lake Campotosto area; the location of the following maps and photographs is also shown.
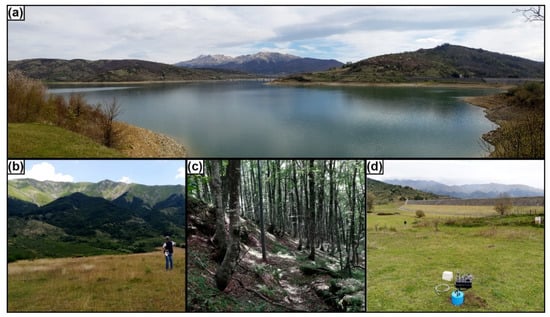
Figure 2.
Panel of photographs of the study area: (a) Panoramic view of Lake Campotosto with, on the right, the Sella Pedicate dam and, in background, the Gorzano Mt. fault system; (b) view of the Gorzano Mt., where the triangular facets roughly indicate the Gorzano Mt. fault trend; (c) lowered ground surface indicating a main trench in the upper part the deep-seated gravitational slope deformations DsGSD (ID.9) of Figures 4 and 5; (d) seismic ambient noise measurement carried out in the Poggio Cancelli valley with, in background, the Poggio Cancelli dam.
2. Geological Setting
The Lake Campotosto basin is located in the Central Apennines, between the Gran Sasso d’Italia Massif (in the south) and the Laga Mts. (in the north). The Campotosto basin hosts an artificial reservoir, which covers 14 km2 with a depth of 30–35 m, at an altitude of 1313 m a.s.l. Lake Campotosto represents a hydroelectric plant’s head reservoir into which converge the natural inflows of the catchment basin directly subtended by the lake, by the slopes of the surrounding mountain systems, and by the presence of the middle sector of the Vomano river; it is bordered by three artificial dams: (i) Rio Fucino dam on the eastern corner; (ii) Poggio Cancelli dam on the northern corner; (iii) Sella Pedicate dam on the southern side.
In the slopes surrounding the Lake Campotosto basin, a siliciclastic synorogenic sedimentary succession known as Laga Fm. [37,38] widely crops out and characterizes the whole complex of Laga Mts. north of the basin. The Laga Fm. was deposited since the Messinian age and represents the filling of the foredeep basin, with a thickness up to 3000m, of the east verging Apennine fold and thrust belt. In the study area, the Laga Fm. is characterized by a peculiar member known as Lake Campotosto with a thickness up to 1700 m [37,39,40]. It is composed of several turbiditic sequences: at the base, there is the arenaceous sequence with a sand–clay ratio much greater than 1, resulting in a very thick tabular stratification. Above, a turbidite stratigraphic marker (key bed with a thickness of 10–15 m) follows, highlighting the transition between the lower arenaceous facies and the upper arenaceous-clayey and clayey-arenaceous facies. The turbidite key bed is composed of coarse sand with laminations at the base and a thick clayey part at the top. The arenaceous-clayey sequence (I) is present below the stratigraphic marker, characterized by a sand–clay ratio between 3 and 10, with a thick tabular arenaceous strata. The arenaceous-clayey sequence (II) lays above the sequence I and is characterized by a sand–clay ratio between 1 and 3, with medium to thick tabular arenaceous strata, which contains a complete Bouma sequence. Finally, the clayey-arenaceous sequence occurs at the top of the Lake Campotosto member, characterized by a sand–clay ratio less than 1 with thinner tabular layers.
Starting from the Quaternary age, intense normal faulting phenomena generated the intermontane Campotosto basin [41]. This depression was first filled by fluvial deposits, consisting of coarse gravel layers alternated with silty-sandy ones, and then by silt-clayey lake deposits. Subsequently, a peat bog was formed and lasted long enough to produce a layer of peat of about 10 m, covered by recent deposits of very small thickness [42].
The geological-structural setting results from Quaternary post-orogenic extensional tectonics [41,43,44,45] which involved the northeast-verging thrust and fold chain [46,47]. The extensional tectonism is still active as evidenced by the intense seismicity of the area, landslides phenomena and mass rock creep processes that are set on fresh scarps; anomalies in the hydrographic system. The Laga Fm. is involved in regional folds with N–S trend: the main anticline has vergence to the east and has the axial culminations of the Montagna dei Fiori and Montagnone mounts, where the Marne a Orbulina Fm. and the Marne con Cerrogna Fm. outcrop below the Laga Fm. The Marne con Cerrogna Fm. is affected by the detachment structures of the Laga unit [48], represented by shear zone in the marl-clayey lithofacies.
The Campotosto basin is bordered by Laga Fm. reliefs, which are often covered by debris at the foot of the slope. In general, the morphology of the area is controlled by different morphogenetic agents. The action of gravity is not particularly noticeable, but some gravitational deformations, often linked with tectonic extensional activity, and shallow landslides occur. The structural control of the normal fault system shapes and characterizes the western slope of the Laga Mts. (in the eastern sector of the study area) with evident morphological scarps (Figure 2b). Moreover, several landforms are linked to the action of the Rio Fucino river, as, for example, some river scarp edges on the left bank of the river and erosion due to surficial runoff of waters in the hydrographic right. In addition, alluvial fans cover the alluvial deposits at the transition between the ridge slopes and valley edges, where fan deposits overlay the alluvial deposits. These latter give rise to a continental succession that sedimented from the lower–middle Pleistocene and represent soft soils in view of the local seismic response, when instead the Laga Fm. represents a seismic bedrock.
Seismotectonic Setting
The Gorzano Mt. fault (Figure 3a) is the main tectonic element of the study area: it originated in the intermountain basins of Amatrice and Campotosto [35] and extends from Amatrice basin in the north to the Gran Sasso Range in the south. The literature also refers to this fault system as Laga Mts. fault system, or Campotosto fault for its southernmost part. It is striking NNW–SSE and dipping 60°–70° SW [38,49] with a total length of about 30 km [41,50], and it caused a maximum downdip displacement of about 2.3 km [50]. This fault system can be considered as formed by two sectors: the 8-km-long Amatrice Fault and the about 20-km-long Gorzano Mt. (or Campotosto) fault [51,52,53]. The first one is believed to be inactive, and no longer able to produce surface faulting earthquakes after the Pleistocene [54], but the Gorzano Mt. fault has proved to be a seismogenic source active during the Quaternary [35,51]. The relocated aftershocks of the 2009 seismic sequence [55] show that the Gorzano Mt. fault dip varies from 55–60° in the shallow depths to about 20–25° at greater depth, and the aftershock distribution of the 2016–2017 seismic sequence depicted a SW-dipping (average 45°) seismogenic source, which becomes listric at depth. The width (downdip fault length) is ~14 km, which is a conservative estimation, as the listric geometry would result in a slightly larger width [53]. According to the Wells and Coppersmith [56] regressions, the maximum expected magnitude of the 20-km-long Gorzano Mt. fault is 6.5–6.6 [53]. Recently, Tondi et al. [57] suggested a lower seismogenic potential, of the order of maximum M 6.0. These authors interpret the Gorzano Mt. fault as a system of seismogenic structures that act as a linkage fault zone between the Paganica fault and Vettore Mt. fault. Moreover, this fault would be active since the Miocene, representing, therefore, a syn-thrusting extensional fault formed by gravitational collapse of the backlimb of a thrust-related anticline. The Gorzano Mt. fault would be, therefore, confined within thrust sheets, at limited depth, and it cannot play a prominent role in seismic hazard [57]. However, some historical earthquakes are ascribed to Laga Mts. fault system, such as the 7 October 1639 event (M 6.2 [50,53,58]), which was the most destructive with Mercalli–Cancani–Sieberg (IMCS) scale = X, the moderate 1646 earthquake (M 5.9) which struck the northern part of the basin (Amatrice area), and the 1950 earthquake (M 5.7) which affected several localities (among which, Mascioni and Poggio Cancelli) with intensity IMCS = VIII.
The 2016–2017 seismic sequence activated the Vettore Mt. fault system and the Laga Mts. fault system, filling the seismic gap between the 1997–1998 Colfiorito seismic sequence and the 2009 L’Aquila earthquake, with mainshocks of Mw 5.9 and 6.3, respectively [59,60]. The first mainshock (24 August 2016, Mw 6.0, Figure 3a,b) nucleated at a depth of ∼8 km in the Amatrice and Accumoli area [61,62], along the SW-dipping (50°) Vettore Mt. –Gorzano Mt. normal faults [63,64]. The second mainshock (Mw 5.9) took place on 26 October 2016, activating the northern segment of the Vettore Mt. fault system. On 30 October 2016, another mainshock of Mw 6.5 struck the central area, between the two previous earthquakes, near the town Norcia. The hypocenter was located at ∼7 km depth and activated a SW-dipping (55°) segment of the Vettore Mt. fault system [61]. Several antithetic (NE-dipping) normal faults were activated during the sequence, as shown by the aftershock distribution, and none of the hypocenters exceed 8 km in depth.
On 18 January 2017, a seismic sequence struck the Lake Campotosto basin, including four events with magnitudes higher than 5 (i.e., Mw 5.1, 5.5, 5.4, and 5.0; Figure 3a) and anticipated by some foreshocks; the earthquake reactivated the Gorzano Mt. fault, hitting the area of Lake Campotosto. The hypocentral depths of the mainshocks were 8.5 km for the Mw 5.5 event and 11 km for the Mw 5.4 event, and the kinematic models [65] indicate an updip rupture directivity with a maximum displacement at depth of 40 cm and 60 cm, respectively. No surface rupture was observed along the Gorzano Mt. fault [53].
In the study area, the fault system consists of three parallel splays which connect near Lake Campotosto and continue south towards Ortolano town, as a single main fault. With regard to the splays, the westernmost one can be considered be the most active, with evidence of displacements from the late Pleistocene–Holocene, such as fault scarps that involved the arenaceous substrate, as well as terraces formed along incisions perpendicular to the maximum slope [35]. The westernmost splay was investigated by means of WSW–ENE oriented paleoseismic trenches, 32 m long and 2.5 m deep, dug into sandy soils: five fault planes were found along the trench walls, testifying to several activations during the Holocene [35,41]. Nevertheless, during the recent seismic sequences, the Gorzano Mt. fault did not cause superficial faulting (e.g., [66]), while along the Vettore Mt. fault scarp, the mean superficial downdip slip was of ∼13 cm (in places up to ∼30 cm [67]) for the 24 August 2016 Mw 6.0 event and up to ∼50 cm (in places up to ∼200 cm [65]) for the 30 October 2016 Mw 6.5 earthquake. This different behavior is explained by Carminati et al. [68] through a lithological control on the surface faulting: in the Vettore Mt. area, competent lithologies (limestones) are more prone to faulting, while in the Lake Campotosto area, the ductile lithologies (marls, clays, and sandstones of the Laga Fm. flysch) accommodated upward the coseismic slip by a normal fault-propagation fold, and faulting remained blind.

Figure 3.
(a) Main tectonic lineaments of the Laga Mts. and Lake Campotosto basin; active extensional faults in red epicenters and focal mechanisms of events with Mw > 5.0 are also shown (modified after [68], reproduced with the permission of Elsevier, Journal of Geodynamics 2020); (b) geological cross-sections across the Gorzano Mt. area (from [69], reproduced with the permission of Elsevier, Tectonophysics 2017); section trace A–A’ is shown in Figure 3a.
3. Engineering-Geological Analysis of the Lake Campotosto Basin
The aim of the engineering-geological analysis of the Campotosto basin is to define the geological risks affecting the slopes surrounding the basin, with particular attention to the landslide hazard. Therefore, a landslide inventory and a geomechanical characterization of the rock mass were developed along the whole perimeter of the lake.
The landslide survey along the banks was carried out in two main phases: (i) analysis of the historical aerial imagery and (ii) in situ geomorphological survey. The analysis of the aerial photographs allowed for investigation of the landslides evolution over the timespan covered by the available data: the oldest images belong to the “Istituto Geografico Militare Italiano-Gruppo Aeronautico Italiano (IGMI-G.A.I.) 1954–1955” flight and the most recent to the “Regione Abruzzo 2004/2005” flight” (besides Google Earth imagery that was also used). The stereoscopic analysis of the aerial photographs allowed for the identification of the landslide bodies and activity indicators, such as scarps and cracks. These observations were confirmed during the field survey, when other indicators of activity (fallen and disturbed trees, presence of water, intact and disturbed bedding) were identified.
The geomechanical characterization of the Lake Campotosto basin was based on 47 field measurements of jointing conditions, according to the International Society for Rock Mechanics (ISRM) [70] recommendations. The joint roughness coefficient (JRC) and the joint compressive strength (JCS) of the main joint sets, surveyed in each geomechanical station, were also estimated using a standard Barton comb and a Schmidt hammer, respectively [70].
In each geomechanical station, the parameter Jv (volumetric joint count) was measured, starting from the averaged spacing values. Jv represents the average number of joints occurring in 1 m3 of rock and can be obtained through the Palmstrom [71] equation (Equation (1)):
where S1, S2, …, Sn are the joint set spacing and Nr is the number of random joints.
Jv = 1/S1 + 1/S2 + … + 1/Sn + Nr/5
The rock mass was divided into classes on the basis of (i) the geological strength index (GSI) value (from 0 to 100 [72]), (ii) the sandstone vs. clay content, and (iii) according to the state of weathering of the discontinuities surface.
The rock mass zonation was performed taking into consideration the lithology: within the Laga Fm. flysch (and, in particular, within the Lake Campotosto member), two classes were distinguished: the first one with a prevalent arenaceous component, and the second one with the occurrence of clays with the arenaceous component <70%. Moreover, the alluvial deposits outcropping exclusively downstream of the Poggio Cancelli dam were considered as a further specific class.
The second step of the classification takes into account the degree of the rock mass jointing, using the values of Jv and GSI. For this purpose, 113 GSI values were collected in the study area. The geomechanical classes were marked with a letter that goes from A to H as the fracture increases: class F represents indeed heavily-fractured rocks. The coarse arenaceous flysch (arenaceous component >70%) was further detailed by separating it into two sub-classes, based on the level of jointing. The fine-grained member of the flysch (arenaceous component <70%), on the other hand, presented always similar geomechanical characteristics (medium degree of fracturing), and no further subdivision was necessary. The abovementioned classification criterion allowed to distinguish five different classes, as shown in Table 1.

Table 1.
Geomechanical classification of the rock mass outcropping in the slopes surrounding the Lake Campotosto basin.
Class V (Table 1) represents the intensely-fractured rock mass, where the expected deformation is mainly driven by the fracturing rather than by lithology. For this reason, class V is based exclusively on the GSI values and the degree of fracturing of rock masses, without taking lithology into account.
3.1. Results of Engineering-Geological Analysis
3.1.1. Geological Mapping and Landslide Inventory
Basing on the information achieved by the field survey and on the geological map of literature [73], a geological and geomorphological map of the Lake Campotosto basin and surrounding slopes (Figure 4) was outlined. Furthermore, a geological cross-section astride the Campotosto active fault system was drawn (Figure 4).
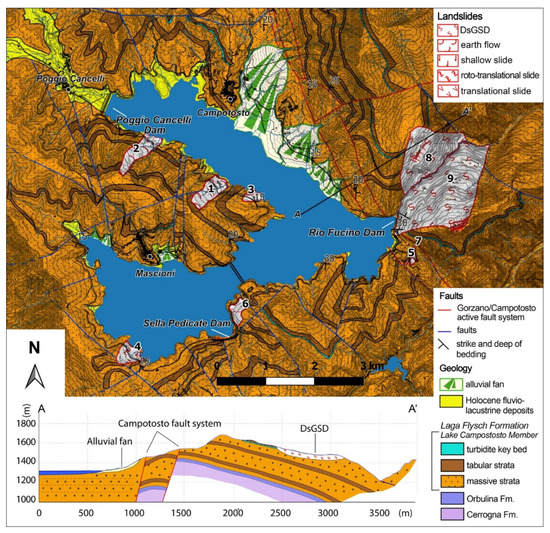
Figure 4.
Geological and geomorphological map of the Lake Campotosto basin; section A–A’ across the active Campotosto fault system in the bottom panel.
The geomorphological survey led to the identification of nine landslides (Figure 4) that are also cited in literature [38,73], and were recognized by both in situ investigations and aerial photos interpretation.
The earthflows ID.1 and ID.2 (Figure 4) are located in an area devoid of vegetation and are characterized by a lobed shape in their central part. They involve the pelitic-arenaceous facies of the Laga Fm. flysch that consist of a predominant silty-clayey matrix and arenaceous pebbles ranging from some cm to few m. Although their velocity is very low, both the earthflows can be considered as active, since they are damaging the containment walls on the roadside. Only some moderate changes in shape and in the drainage pattern indeed are shown in the aerial photos of the “IGMI-G.A.I. 1954–1955” and “Abruzzo Region 2004–2005” flights: in particular, the earthflows seem to have moved with retrogressive direction (uphill) and formed some drainage lines caused by the washout waters’ action (Figure 5a,b).

Figure 5.
(a,b) Earthflow ID.1 represented in the aerial photographs “IGMI-G.A.I. 1954–1955” and “Abruzzo Region 2004–2005” respectively; (c) DsGSD ID.9 represented in the aerial photograph “Volo Base 1954”, with perimeter provided by Saroli and Moro [74]; (d) satellite view and (e) 3D view of the DsGSD ID.8 and ID.9 (from Google Earth).
Landslides ID.3 and ID.4 (Figure 4) were classified, respectively, as translational and roto-translational slides. The first one developed in the arenaceous facies of the Laga Fm., while the second one involves the arenaceous-pelitic facies.
An area affected by surface instability (landslide ID.6 in Figure 4) was identified east of the Sella Pedicate dam, where the pelitic component of the flysch outcrops.
Landslides ID.5 and ID.7 (Figure 6a), classified respectively as a roto-translational landslide and earthflow, were identified in the eastern part of the study area. Such slides do not directly interfere with Lake Campotosto, but they show some evidence of recent reactivation. In particular, these landslides were activated after 2010, as they are not present in the aerial photos of the “Abruzzo 2010” flight, and probably date back to the winter of 2016, following heavy snowfalls. The roto-translational landslide ID.5 involves the road that links Lake Campotosto to Ortolano town, displacing the road surface by several meters and completely interrupting the road system (Figure 6b,c). According to the report of EMERGEO Group of National Institute of Geophysics and Volcanology (INGV) on the coseismic effects of the seismic sequence of Central Italy of 2016–2017 [75], this slide was reactivated by the seismic events that occurred in August 2016.
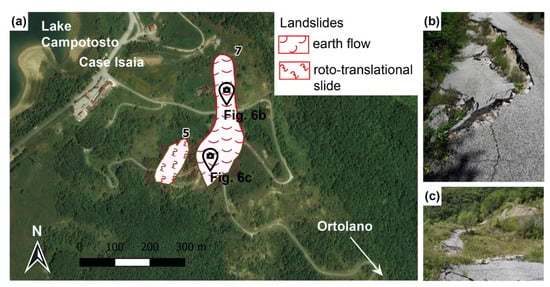
Figure 6.
Landslides ID.5 and ID.7: (a) satellite view; (b,c) photographs of the landslide ID.7 (from [75]).
The largest landslides affecting the slopes of the Lake Campotosto basin are located on both sides of the narrow valley of the Rio Fucino river (landslides ID.8 and ID.9, Figure 4). Both landslides were classified as deep-seated gravitational slope deformation (DsGSD) driven by creep phenomena and characterized by very slow movement, involving large volumes of rock mass, even affecting entire slopes [76].
The landslide ID.8, on the slope north of the river (hydrographic left), was not recognized through photo-interpretation of historical images, as it occurs in a highly vegetated area, but it was identified during field survey, through the presence of some evidence of instability: isolated blocks (even of several cubic meters in size), presence of two landslide terraces, trenches and morphological counter-slopes, and a very steep and concave shaped surface in the uppermost part of the hill, with the presence of uprooted trees.
The DsGSD ID.9 (Figure 5c–e) occurs on the slope south of the river (hydrographic right) and could directly interfere with the Rio Fucino dam. The DsGSD ID.9 involves the whole hill, and inside its perimeter, it is possible to note three superficial landslides (Figure 5c,d) with movement direction towards NW and WNW that form landslide terraces. In the uppermost part of the hill, several pieces of geomorphological evidence were found: parallel large trenches (Figure 2c), morphological counter-slopes up to several m long, 2 m wide, and about 1 m deep. This DsGSD was mapped in the geological maps of literature [73] and was also recognized by Saroli and Moro [74]. Through the analysis of geomorphological forms, it was possible to extend the perimeter of the landslide with respect to Saroli and Moro’s [74] mapping. The different mapping solutions proposed for the DsGSD are represented in Figure 5c–e. In both interpretations, the Rio Fucino dam would be located within the perimeter of the landslide. With regard to the activity of this massive landslide, no evidence of movement was observed from the analysis of aerial photos covering the last 60 years. However, due to the occurrence of active geomorphological forms and of various damages of recent anthropic works, the authors consider the DsGSD ID.9 as active.
3.1.2. Geomechanical Features
The main result of the geomechanical characterization of the rock mass consists in the geomechanical map (Figure 7), which proposes a zonation of the study area based on peculiar geomechanical characteristics. This map was drawn using the classification assigned to the points where the geomechanical parameters were measured. A buffer of maximum 300 m from the measurement station was chosen in order to outline the parts with the same geomechanical features of the rock mass.
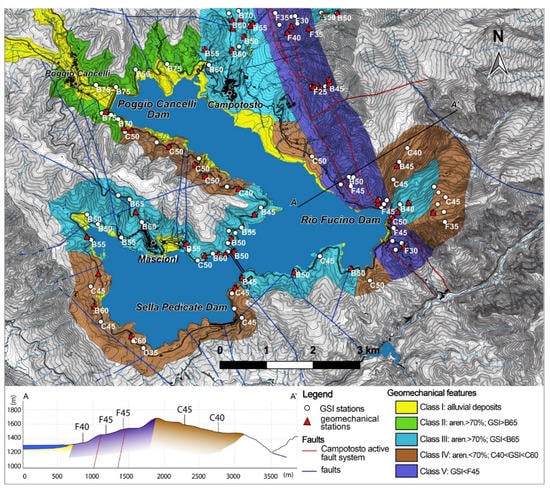
Figure 7.
Map of the geomechanical features of the Lake Campotosto basin; section A–A’ across the active fault system in the bottom panel.
The geomechanical classes includes the following outcropping lithologies, and concern the following range of geomechanical parameters:
- Class I: recent alluvial deposits, from fine to coarse, with the presence of peat lenses, that outcrop mainly in the Sella Pedicate Valley and in the northern part of the basin.
- Class II: rock mass with an arenaceous component much greater than the pelitic one (arenaceous content > 70%); GSI values are typical of poorly-fractured rock masses, i.e., GSI > B65; Jv < 10. It outcrops in the northern part of the study area.
- Class III: rock mass with arenaceous content > 70%, but with lower GSI values, typical of a fractured rock mass, i.e., GSI < B65 and Jv > 10.
- Class IV: arenaceous rock mass with a relatively abundant pelitic component, slightly to moderately fractured. In particular, the arenaceous component is between 50% and 70%; C45 < GSI < C60; 5 < Jv < 20.
- Class V: intensely fractured rock mass, with F25 < GSI < F40 and Jv > 20; the rock mass of class V represents a strip about 1 km wide that cross-maps the study area (in purple in Figure 7) along the Campotosto active fault system.
Figure 7 shows a geomechanical profile, which also reports the most significant GSI values. The geomechanical cross-section was drawn orthogonal to the direction of the Campotosto faults in order to highlight the variation of the rock mass characteristics as a function of the distance from the main tectonic element.
The lateral transition from geomechanical classes is mainly gradual in the central part of the study area. It is worth noting in the map and section of Figure 7 that the rock mass belongs to class V near the fault zone and passes into the IV class and then into the III moving away from the fault. The fracturing affects the quality of the rock mass up to about 500 m distance from the fault, and it is therefore related to the action of the fault. In the areas away from the active fault system, the high fracturing is strongly controlled by lithology.
4. Local Seismic Response Study of the Poggio Cancelli Valley
During the 2009 L’Aquila and 2016–2017 Central Italy seismic sequences, especially after the 18 January 2017 mainshock, different grades of structural damages were observed in the Lake Campotosto area, with a non-regular damage distribution suggesting that site effects influenced the seismic response of the buildings located in the area [77]. In this regard, a quantitative evaluation of the expected seismic motion amplification was carried out by a local seismic response study focused on the Poggio Cancelli valley, where a major embankment dam and the Poggio Cancelli settlement are located.
In recent decades, a large body of literature (e.g., [78,79,80,81]) and national guidelines for seismic microzonation studies (e.g., [82,83,84]) evidenced the reliability of evaluating the expected seismic response of a site in the case of seismic shaking using engineering-geological modeling, near-surface geophysical investigations, and numerical modeling.
With this aim, three main analysis steps were followed. First, seven cross-sections for the Poggio Cancelli valley were reconstructed detailing the engineering-geological model previously provided to define a seismostratigraphic model of the local subsoil. Simultaneously, geophysical investigations, including 35 single-station seismic ambient noise measurements and one multichannel analysis of surface waves (MASW) survey, were carried out to confirm and calibrate the reconstructed subsoil model. Finally, numerical modeling of the seismic waves (input) propagation to define the seismic local response within the Poggio Cancelli valley was performed.
4.1. Engineering-Geological Modeling
Between October 2018 and July 2019, starting from the engineering-geological map obtained for the whole Lake Campotosto basin, a specific engineering-geological map was implemented for the Poggio Cancelli valley area by analyzing data of previous and new surveys. For the first item, a stratigraphic log of a borehole recently carried out in the Poggio Cancelli settlement was collected; this borehole was performed in the framework of the Seismic Microzonation study at level 3 for the Campotosto Municipality, which is available at the Abruzzo Region website (www.regione.abruzzo.it/content/microzonazione-sismica-di-terzo-livello accessed on 22 February 2021). Regarding the second item, several surveys were carried out onsite to recognize the outcropping lithologies and reconstruct their contacts; at the same time, several samples of the outcropping soils were collected for performing laboratory tests with the aim of assessing their grain-size distribution as well as liquid limit, plastic limit, and plasticity index according to the American Society for Testing and Materials (ASTM) International norms D422-63e2 [85] and D4318-10e1 [86], respectively.
The interpretation of the past and new collected data allowed for reconstruction of the engineering-geological map at a scale of 1:5000 for the Poggio Cancelli valley area (Figure 8); seven sub-parallel engineering-geological cross-sections with direction roughly NE–SW were obtained by this model (Figure 9).
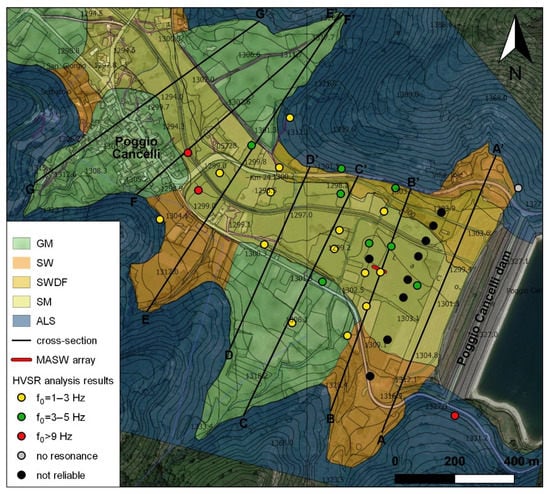
Figure 8.
Engineering-geological map with geophysical investigations of the Poggio Cancelli valley. Legend: GM: alluvial fans; SW: eluvial-colluvial deposits; SWDF: debris deposits; SM: tilled soil and anthropic material; ALS: Laga Fm. flysch.
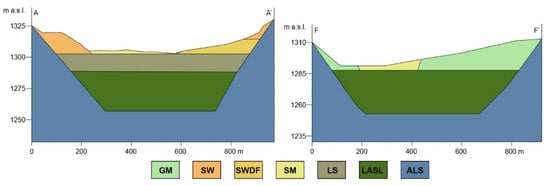
Figure 9.
Engineering-geological cross-sections A–A’ and F–F’ produced for the Poggio Cancelli valley; vertical axis with 5x exaggeration with respect to horizontal axis.
The valley is bordered by reliefs of the Laga Fm. flysch (ALS) and is filled by a succession of fluviolacustrine deposits of Holocene age that directly overlie the Laga Fm. From the bottom, this valley filling is composed of two main layers of clayey silt (LASL) and sandy silt (LS) and a thin layer of tilled soil and anthropic material (SM); in addition, several lateral bodies represented by alluvial fans (GM), eluvial-colluvial deposits (SW), and debris deposits (SWDF) were recognized at the transition between the ridge slopes and valley edges on both sides of the valley. The valley filling thickness decreases moving toward the Poggio Cancelli settlement, while the valley width is rather variable.
4.2. Geophysical Investigations
Simultaneous to the engineering-geological modeling, 35 single-station seismic ambient noise measurements and one multichannel analysis of surface waves (MASW) were carried out in the Poggio Cancelli alluvial valley.
The single-station seismic ambient noise measurements were performed along several NE–SW-oriented sections across the Poggio Cancelli valley, to cover all the different outcropping litotechnical units. Two seismic instrumental pieces of equipment were employed: (i) three-component LE-3D/5s seismometers (0.2 Hz eigenfrequency) by Lennartz Electronic GmbH (Tübingen, Germany) coupled to Reftek 130-01 (San Diego, CA, USA) dataloggers (Figure 2d); (ii) SL06 24-bit digitizers with built-in SS20 three-component velocimeter (2.0 Hz eigenfrequency) by SARA Electronic Instruments (Perugia, Italy). The measurements with 1 hour duration and a sampling frequency of 200 Hz and 250 Hz, respectively, were carried out.
The single-station seismic ambient noise measurements were analyzed according to the horizontal-to-vertical spectral ratio (HVSR) method, proposed by Nogoshi and Igarashi [87,88] and analytically implemented by Nakamura [89] to evaluate the site fundamental resonance frequency (f0). The HVSR technique analyzes the ratio between horizontal and vertical Fourier spectra at each frequency and can be applied to evaluate the 1D stratigraphic resonance of a low S-wave velocity layer on a seismic bedrock [90,91], evidenced by a clear peak in HVSR function [92] without polarization effects and formed by an increase of the horizontal Fourier spectra and a decrease of the vertical Fourier spectrum, a feature known as “eye-shape” according to Castellaro and Mulargia [93].
The HVSR analysis was carried out using Geopsy software [94] version 2.9.1 for each single-station seismic ambient noise measurement as follows: (i) computation of the fast Fourier transform (FFT) for the three motion components on non-overlapping time windows of 40 s with 5% cosine taper; ii) application of the smoothing function by Konno and Ohmachi [95] on the single-window FFT spectra; (iii) computation of the single-window HVSR as FFT spectra ratio between the quadratic mean of the two horizontal components (H) and the vertical component (V); (iv) computation of the mean HVSR function by averaging the single-window HVSR. In addition, Geopsy was applied also to analyze the possible polarization of the HVSR peaks: using the specific tool, the average HVSR was computed from 0° to 180° every 10°, and the HVSR distribution was reconstructed in the horizontal plane as function of azimuth.
Figure 8 also shows the main results obtained by the HVSR analysis on the single-station seismic ambient noise measurements performed in the Poggio Cancelli area; the HVSR functions satisfied the reliability criteria provided by SESAME [92] for 26 measurements, whose results were examined considering the different outcropping lithologies on which they were performed.
The measurements carried out on the valley filling show a clear HVSR main peak in the range 1.6–4.5 Hz (Figure 10, left). The absence of polarization and the typical “eye-shape” of the FFT spectra allowed to associate this HVSR peak with the main resonance frequencies (f0) of the valley, likely produced by a significant seismic impedance contrast between the soft soil deposits filling the valley and the seismic bedrock, which may be represented by the Laga Fm. Higher f0 values were found near the valley edge as well as toward the Poggio Cancelli settlement, testifying to a reduction of the valley filling thickness as reconstructed by the engineering-geological modeling.
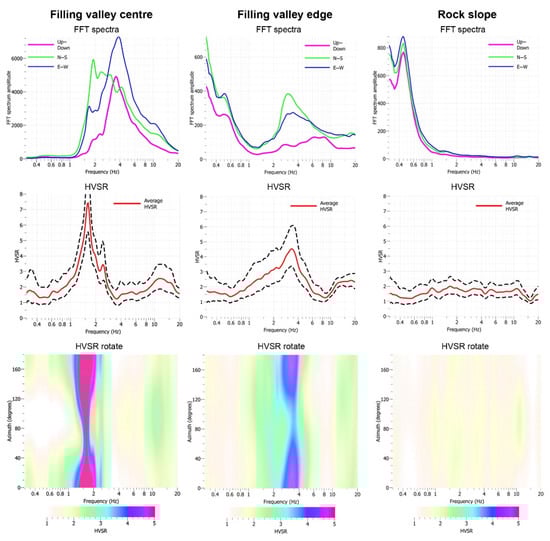
Figure 10.
Examples of fast Fourier transform (FFT) spectra, horizontal-to-vertical spectral ratio (HVSR) function (the dashed black lines show the standard deviation of the curve), and HVSR rotate plot at the Poggio Cancelli valley obtained on fluviolacustrine deposits (left panel), alluvial fan (middle panel), and Laga Fm. flysch (right panel).
The HVSR analysis on the measurements carried out on the lateral deposits, i.e., GM, SW, and SWDF, outputted a f0 value from 3.5 to 5.0 Hz (Figure 10, middle), probably related to the seismic impedance contrast between the valley deposits and the underlying Laga Fm., confirming a reduction of the filling thickness in the lateral parts of the valley according to the proposed engineering-geological model. The seismic ambient noise measurements performed on the outcropping Laga Fm. do not show any resonance frequency (Figure 10, right), confirming the hypothesis that this formation acts as a seismic bedrock. Some measurements evidenced HVSR peaks at frequencies higher than 9.0 Hz that show polarization and no FFT with “eye-shape”; these HVSR peaks are probably related to local site effects due to topographic, morphologic, and/or fracturation conditions of the relief, as evidenced by other studies carried out on jointed rock masses (e.g., [96,97,98,99]).
The active multichannel analysis of surface waves (MASW) survey was carried to infer the shear-wave velocity (Vs) structure at the site based on the dispersive nature of Rayleigh waves [100,101,102]. The survey consists of (i) observing the seismic wavefield generated by an artificial source by a linear array of equally-spaced geophones, (ii) measuring the dispersion properties of Rayleigh waves by transformation of the wavefield from the time-offset domain to different domains where such measurements are more easily performed [103], and (iii) inversion of the obtained dispersion curve (estimating the frequency-dependent effective phase velocity of Rayleigh waves) to obtain the Vs structure, assuming an horizontally-layered Earth model.
The test was carried out using a linear array of 32.5 m composed of 36 vertical geophones (4.5 Hz eigenfrequency) with spacing of 1.5 m connected to 16-bit DoReMi seismic acquisition system by SARA Electronic Instruments (Perugia, Italy). The array was deployed on the filling deposits in the middle of the Poggio Cancelli valley (Figure 8); 23 symmetric shot gathers (forward and reverse) generated by a sledgehammer source with different offsets (5, 10, and 15 m) were carried out to evaluate the similarity between the dispersion images obtained by symmetric shots and therefore verify the 1D subsurface structure assumption on which the method is based. Three repeated shots were recorded and stacked for each source position (Figure 11a).
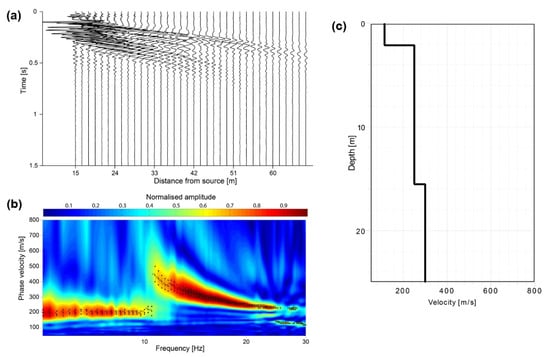
Figure 11.
Multichannel analysis of surface waves (MASW) survey results: (a) shot-gather with source 15 offset; (b) dispersion image in the f–c domain with identification of both fundamental and first higher mode of Rayleigh wave; (c) best model Vs profile resulting from Rayleigh wave dispersion curve inversion.
The 4-s-length seismic signals were acquired with sampling frequency of 3000 Hz and using a trigger geophone close to the source to ensure correct timing.
Signals were analyzed by MASWaves Dispersion code [104] which implements slant-stacking [105,106] to retrieve the maxima of the normalized slant-stack amplitudes in the frequency–phase velocity (f–c) domain corresponding to the Rayleigh wave dispersion (Figure 11b). Dispersion curves, related to the fundamental mode and first higher mode, were automatically picked in the f–c domain and inverted by the Dinver software tool version 0.5.6 of Geopsy, which implements an improved neighborhood algorithm [107]. Model parameters were allowed to vary in a wide range, and the inversion result is presented in Figure 11c in terms of minimum misfit shear-wave velocity profile. The investigation depth is around 25 m, in which Vs varies in a narrow range between 120 and 300 m/s.
4.3. Numerical Modeling
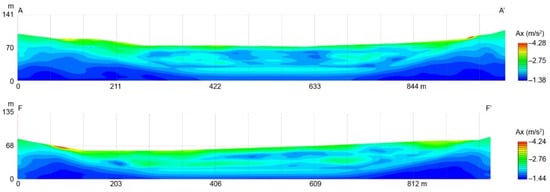
In order to quantify the seismic local response in the Poggio Cancelli valley area, two-dimensional numerical modeling along the seven defined engineering-geological cross-sections was performed by LSR 2D software version 4.4.0; this computation code, produced by STACEC Srl and licensed at the Department of Earth Sciences of Sapienza University of Rome, was recently used for several local seismic response studies to simulate two-dimensional seismic effects [108,109]. In fact, LSR 2D allows to perform two-dimensional modeling of seismic motion propagation, through an equivalent linear analysis, to finite elements in the time domain, in total stresses, applying a viscoelastic rheological behavior of Kelvin–Voigt. Specifically, the following procedure was adopted: assignation of weight for unit volume (γn), shear-wave velocity (Vs), and dynamic parameters (i.e., shear stiffness and damping degradation curves) for each layers in all engineering-geological sections; discretization of the model (cross-section) in quadrilateral meshes with 2-m resolution grid; application of free-field conditions (i.e., damping conditions in the X and Z) on the lateral borders and a kinematic constraint on the vertical motion at the base of the domain (placed at a minimum depth about 50 m from the ground level) inside the infinite half-space representative of the seismic bedrock from which the propagation of the input occurs up to contact with the filling soils of the valley (soft soil with viscoplastic behavior).
Table 2 reports the physical and geotechnical parameters associated with each litotechnical unit for the numerical modeling. These parameters were obtained by the geophysical investigations, laboratory tests, and SM study at level 3 for the Campotosto Municipality, except for the shear stiffness and damping degradation curves that were provided by the cited authors and associated with the outcropping lithologies based on their similarity in terms of grain-size distribution and plasticity index; no dynamic parameters were assigned to the Laga Fm. that acts as seismic bedrock.
Table 2.
Physical and geotechnical parameters assigned to the litotechnical units defined in the Poggio Cancelli area.
Table 2.
Physical and geotechnical parameters assigned to the litotechnical units defined in the Poggio Cancelli area.
| Lithological Unit | γn (kN/m3) | Vs (m/s) | Jv |
|---|---|---|---|
| Alluvial fan (GM) | 18 | 300 | Seed & Idriss [110] |
| Eluvial-colluvial deposit (SW) | 18 | 250 | Seed & Idriss [110] |
| Debris deposit (SWDF) | 18 | 250 | Seed & Idriss [110] |
| Tilled soil and anthropic material (SM) | 18 | 120 | Rollins et al. [111] |
| Sandy silt (LM) | 19 | 250 | Rollins et al. [111] |
| Clayey silt (LASL) | 19 | 300 | Rollins et al. [111] |
| Laga Fm. flysch (ALS) | 22 | 1100 | - |
The input seismic applied to the models was given by seven accelerograms (horizontal components) for a probability of exceedance of 5% in 50 years (equal to a return period Tr of 475 years) deriving from the SM study at level 3 of the Campotosto Municipality. Finally, for each modeled cross-section, different control points along the topography were chosen to obtain the output in terms of amplification factors (AF), as defined by ICMS Working Group [82].
4.4. Results of the Local Seismic Response Analysis
Analyzing the numerical modeling outcomes in terms of maximum values of expected acceleration (Figure 12), clear amplification effects can be observed at the free surface of the whole valley filling deposit; the highest acceleration values (until about twice than those expected for the seismic bedrock according to the Italian seismic hazard map [33]) were found in the valley edge zones, probably due to: i) high seismic impedance contrast between alluvial fans, eluvial-colluvial, and debris deposits, with weak thicknesses and low Vs velocity values, and the underlying seismic bedrock; ii) focalization phenomena of seismic waves; iii) generation of surface waves with horizontal propagation.
Subsequently, according to ICMS Working Group [82], the AF value was calculated in 0.1–0.5 s, 0.4–0.7 s, and 0.8–1.1 s period ranges for each control point on the seven modeled cross-sections to better describe and quantify seismic response of the valley.
The AF distribution was similar for all the period intervals, with higher values for the period interval 0.7–1.1 s. To visualize the zones with different amplification in the study area as useful tool for planning purposes, the AF values obtained along the seven cross-sections in the valley for the period 0.7–1.1 s, which contains the higher amplification values, were interpolated using an inverse distance weighting (IDW) interpolator that allowed to obtain a seismic microzonation map (Figure 13).
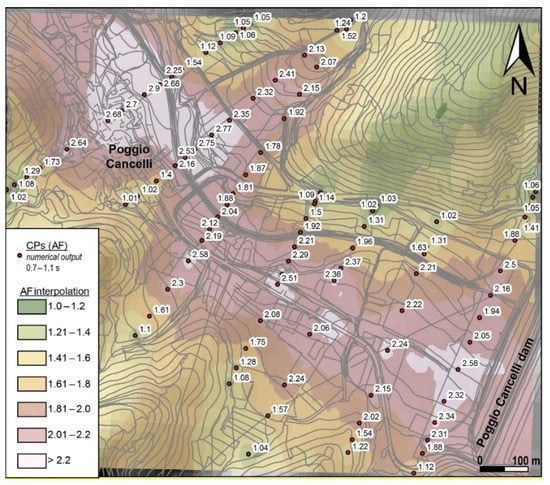
Figure 13.
Map showing the amplification factors (AF) value distribution for the period 0.7–1.1 s in the Poggio Cancelli area.
In general, considering the AF value distribution for the period 0.7–1.1 s, two main different zones can be recognized in the Poggio Cancelli valley: a central area of the plain with AF values higher than 2.0 (locally up to 2.9) attributable to stratigraphic amplification phenomena, highlighted precisely in this period range for the proximity to the valley resonant period (about 0.7 s), and to the possible surface waves propagation inside the basin; valley edges areas, both on the right and on the left hydrographic, that show AF values generally lower (1.0–2.0) than the valley central area, probably indicating a reduced contribution of amplification expected for focalization of seismic waves on the buried valley edges.
5. Discussion
Using the literature data and the results of the engineering-geological analysis, i.e., geological–geomorphological map, landslide inventory, and geomechanical classification map of the rock mass, it is possible to describe the different seismically-induced geohazards that can affect the Lake Campotosto artificial basin and surrounding slopes. These hazards, represented by (i) seismic shaking, (ii) surface faulting hazards of the Gorzano Mt. fault, (iii) EQTLs, and (iv) liquefaction phenomena, are here identified at the scale of the whole Lake Campotosto basin (Figure 14), and could be integrated hereafter in a multi-hazard analysis.
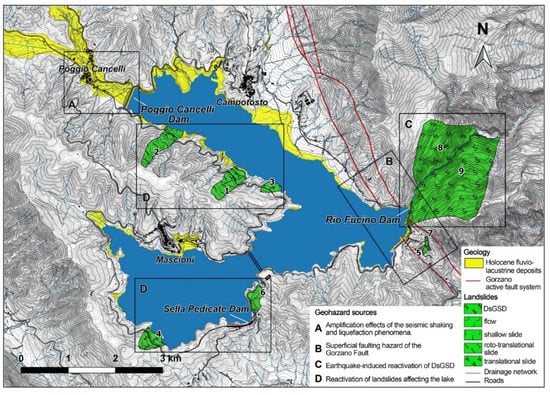
Figure 14.
Map of the main seismically-induced hazards identified in the Lake Campotosto area.
With regard to the (i) seismic shaking, in addition to the base ground shaking, that can be only observed where the Laga Fm. outcrops with flat topography, several amplification effects of the ground motion are expected according to the engineering-geological analysis of the whole Campotosto basin: amplification in the presence of Laga Fm. outcrops forming steep slopes and/or intensely jointed rock masses and amplification in the case of valleys due to their buried morphology and/or to the presence of filling with soft soil layers having poor geotechnical features.
The exemplificative local seismic response study carried out for the Poggio Cancelli valley, located in the northern part of Lake Campotosto, allowed to analyze the expected amplification conditions due to topographic, morphologic, and stratigraphic features by 2D numerical modeling. This quantitative analysis allowed to assess amplification phenomena in the valley, probably related to its fluviolacustrine stratigraphic succession as well as to the focus of seismic waves in its border areas.
The evaluation of the (ii) superficial faulting hazard of the Gorzano Mt. fault is particularly important near the Rio Fucino dam, in the southern part of the artificial lake, where the superficial expression of the fault plane should be near the dam. Therefore, it is crucial to precisely localize the fault plane, but the presence of the lake and the outcrop of the marly and clayey members of the Laga Fm. make this task difficult. In fact, although there is clear geomorphological evidence of the presence of the Gorzano Mt. fault (Figure 2b), also described in the literature [35,112], this structure does not crop out near the dam, as highlighted during the field survey. Numerical modeling of the dam behavior in case the fault intersects the dam foundations, and the worst possible scenario of earthquake occurs, was carried out by Lai et al. [36]. Under this scenario, the dam would suffer severe damage or an instant rupture, with water leakage downstream. However, as described by Carminati et al. [68], the Gorzano Mt. fault did not cause surface rupture during the recent seismic sequences, probably also due to the occurrence of weak lithologies which prevent the propagation of the fracture to the surface, and the faulting remains blind. In the case that the Gorzano Mt. fault generates an earthquake of greater magnitude (maximum expected magnitude: M 6.4–6.6 [53]), the hazard of surface faulting would increase. As stated by several authors, such as Falcucci et al. [53] and Vičič et al. [113], the total slip estimated for the Mw >5 events of 2009 and 2016–2017 sequences indicates that the Gorzano Mt. fault was partially reactivated along its deeper portion, and a superficial rupture would require a larger-magnitude event, as reported also by paleoseismic observations (e.g., [35]). Some authors (e.g., [114,115]) questioned whether the seismogenic source of 2009 and 2017 events match the superficial expression of the Gorzano Mt. fault, due to the lack of hypocenters located at shallow depths (<5 km), and suggested that the superficial fault plane is confined above the Gorzano–Acquasanta thrust sheet at 4 km depth. Nevertheless, Cheloni et al. [116] show that shallow slip (up to <2 km depth) is required to explain the coseismic displacements observed by geodetic measurements, revealing a vertical continuity of the Gorzano Mt. source fault from hypocentral depths to the shallow sector.
The geomechanical characterization carried out in this work highlights that the more intensely fractured rock mass (with the lowest GSI values, between F25 and F40) is localized along a strip with a NW–SE direction and parallel to the Gorzano Mt. fault system strike (mapped as geomechanical class V in Figure 7). This zone of intense fracturing is up to 1.2 km wide and fully overlaps with the fault strike, showing that the fracturing is due to the fault action. Therefore, the Gorzano Mt. fault affects the quality of the rock mass up to a few hundred meters of distance from itself. The Rio Fucino dam is located within the geomechanical class V strip, on its eastern edge (Figure 7), but it should be entirely on the footwall of the Gorzano Mt. fault, which should run under the lake, parallel to the dam, a few hundred meters to the west.
The (iii) landslide hazard was qualitatively assessed integrating the available data with the results from the geomorphological survey, which substantially confirms the inventory of the hydrogeological setting plan (PAI) by the Basin Authority. The geomorphological survey mapped seven landslides along the shores of the lake, characterized by a very low velocity and small volumes. The risk of lake overflowing due to the remobilization of a landslide is therefore considered low, also considering that photo-interpretation analysis of aerial images showed that no reactivations occurred in the past 50 years. However, the landslides near the Campotosto basin could be potentially reactivated by the seismic shaking, although they did not reactivate during the last seismic sequences of 2009 and 2016–2017, as verified by the CEDIT [14,117], EMERGEO [75] and GEER [118] working groups. Only one of the landslides (ID.5 in Figure 4), which is along the road from Lake Campotosto to Ortolano town, southwest of the basin, was remobilized by the seismic events of 2016–2017 [75].
The EQTLs of the Lake Campotosto basin would involve a relatively low risk, due to their small sizes, nevertheless, more detailed studies should be carried out to identify possible source areas and runout zones. The largest and most critical landslides are the two DsGSDs (ID.8 and ID.9), and, in particular, the ID.9 (Figure 4, Figure 5c,d) located at hydrographic right adjacent to the Rio Fucino dam, described by Saroli and Moro [74]. In general, a DsGSD occurs in areas characterized by a recent tectonic uplift [119,120], as the evolution of this process, generally slow, can be accelerated for various causes, first of all the seismic shaking (e.g., [120,121,122,123]). As described in this paper, the DsGSD ID.9 can be considered as active due to the occurrence of active geomorphological forms and of damages of recent anthropic works. This DsGSD poses a greater potential risk for the study area, as the vulnerability and the exposed elements increase significantly since it involves the Rio Fucino dam and the narrow valley downstream.
The engineering-geological analysis of the Campotosto basin allowed to identify areas where (iv) earthquake-induced liquefaction phenomena could occur due to the presence of recent soil deposits such as the fluviolacustrine deposits filling the Poggio Cancelli valley. Detailed engineering-geological modeling aimed at obtaining specific parameters (e.g., groundwater flow depth, soil dynamic parameters, etc.) and analyses following simplified [124,125] or numerical [126] approaches could be performed to evaluate quantitatively their proneness to be involved in liquefaction phenomena.
This overview of the geohazards that occur at Campotosto basin can be channeled into a multi-hazard or multiple-hazard analysis to obtain products useful for risk mitigation purposes. In this regard, two approaches could be used for a comprehensive analysis of the different hazards and possible chain effects:
(a) To fix a time interval or a return period (Tr), i.e., use a fixed probability of occurrence for all the processes. This approach allows to obtain maps of the effects caused by the processes that could happen during the analyzed time period following a proper multiple-hazard approach.
(b) To fix the intensity of the effects for the hazards (e.g., peak ground acceleration value or cumulative coseismic displacement for earthquakes) and combine the probabilities of the single processes (different Tr) to obtain maps of multi-hazard effects.
Among the abovementioned approaches, the first one (a) implies a concatenated occurrence of events and a conditioned probability of each one with respect to the other; on the contrary, the second one (b) assumes that events occur with an independent probability, i.e., they are not conditioned by each other.
Another approach can be represented by the “scenario analysis”, in which a specific calamitous event (with its peculiar probability of occurrence) is considered, and the following cascade effects are analyzed either by back analysis studies or by forecasting studies, which can be effective for the management of emergency plans.
In the present study, the possible multi- or multiple-hazard events were identified as a basis for future quantitative evaluation of combined probability of occurrence by assuming conditioned or independent hazard scheme. On the other hand, for the Campotosto basin, an analysis of scenario could be also performed for studying the several identified seismically-induced hazards (i.e., seismic shaking, surface faulting, EQTLs, and liquefaction) and considering the expected earthquake in a fixed Tr, following and extending to the whole basin the approach used for the local seismic response analysis of the Poggio Cancelli valley.
The abovementioned approaches will provide different products in the frame of a risk mitigation management: (i) the multiple-hazard map will provide a spatial rating of possible occurrent or concurrent effects, i.e., a zonation of predisposing hazard conditions; (ii) the multi-hazard map will provide a proper hazard map where a fixed Tr can be selected in relation to the operating time of the considered infrastructures and/or the time perspective of environmental management plans; (iii) the analysis of scenario will allow to manage emergency plans, i.e., by National Civil Protection, depicting spatial distribution of effects induced by a concurrence of events whose magnitude can be also deduced via deterministic approaches which provide seismic input from local seismogenic sources by modeling fault rupture and seismic wave propagation toward the near-surface subsoil.
6. Conclusions
In this paper, a comprehensive analysis of the seismically-induced hazards at Lake Campotosto formed by three artificial dams (Abruzzo Region, Central Italy) was performed in order to provide a preparatory framework for a multi-hazard study. An engineering-geological analysis, based on literature data and results of field surveys, allowed to produce geological–geomorphological and geomechanical maps and identify the expected seismically-induced geohazards that can affect the Campotosto artificial basin and surrounding slopes: seismic shaking, surface faulting, EQTLs, and liquefaction.
Amplification effects of the seismic shaking are expected in specific geological contexts: steep slopes and/or intensely jointed rock masses of Laga Fm. and filled valleys due to their stratigraphic successions and/or buried morphologies. A local seismic response study was carried out for the Poggio Cancelli valley, located in the northern part of the Campotosto Lake, using 2D numerical modeling, that allowed to assess the expected amplification phenomena in several sectors of the valley due to its stratigraphic and morphologic features.
The superficial faulting hazard could occur at the Gorzano Mt. fault, which does not crop clearly out in the zone of the Rio Fucino dam, at the southeastern sector of the lake. The EQTLs of the Lake Campotosto basin would involve a relatively low risk, but despite the seven landslides mapped did not reactivate in the past 50 years. More detailed studies should be carried out at two DsGSDs that are located immediately downstream with respect to the Rio Fucino dam. Finally, the presence of soft soil deposits could be potentially affected by earthquake-induced liquefaction phenomena, even if more advanced analyses have to be carried out to assess quantitatively their liquefaction proneness.
All the identified geohazards existing in the Lake Campotosto basin can be jointly analyzed using multi-hazard or multiple-hazard approaches, aimed at obtaining different products useful for risk management.
Author Contributions
In the present study: F.B., S.M., and G.S.M. coordinated the research team; B.A., M.F., R.I., and S.R. managed the engineering-geological data; B.A. provided the geological–geomorphological map, landslide inventory, and geomechanical map; M.F., S.H., R.I., S.M., and S.R. performed and analyzed the seismic ambient noise measurements; S.H., R.I., and S.R. performed and analyzed the MASW survey; S.M. and S.R. designed and performed the numerical modeling of the local seismic response study; all the authors contributed to the data discussions, manuscript writing, and figures drawing. All authors have read and agreed to the published version of the manuscript.
Funding
This research received no external funding.
Informed Consent Statement
Informed consent was obtained from all subjects involved in the study.
Acknowledgments
The authors wish to thank A. Cardillo and A. Gallo for their contribution to the engineering-geological surveying and modeling, geophysical investigations, and local seismic response analysis within the framework of their Master’s theses. The authors also thank A. Pagliaroli (Università degli Studi "G. d’Annunzio" Chieti-Pescara) for providing the technical data from the MS of the Campotosto Municipality, M. Saroli (Università degli Studi di Cassino e del Lazio Meridionale) for the fruitful discussions on the DsGSDs at Rio Fucino, and A. Paciello (Agenzia Nazionale per le Nuove Tecnologie, l’Energia e lo Sviluppo Economico Sostenibile ENEA) for the support in the MASW survey.
Conflicts of Interest
The authors declare no conflict of interest.
References
- Geli, L.; Bard, P.Y.; Jullien, B. The effect of topography on earthquake ground motion: A review and new results. Bull. Seism. Soc. Am. 1988, 78, 42–63. [Google Scholar]
- Bouchon, M.; Schultz, C.A.; Toksöz, M.N. Effect of three-dimensional topography on seismic motion. J. Geophys. Res. Solid Earth 1996, 101, 5835–5846. [Google Scholar] [CrossRef]
- Bard, P.Y.; Bouchon, M. The two-dimensional resonance of sediment-filled valleys. Bull. Seism. Soc. Am. 1985, 75, 519–541. [Google Scholar]
- Borcherdt, R.D. Effects of local geology on ground motion near San Francisco Bay. Bull. Seism. Soc. Am. 1970, 60, 29–61. [Google Scholar]
- Lenti, L.; Martino, S.; Paciello, A.; Mugnozza, G.S. Evidence of two-dimensional amplification effects in an alluvial valley (Valnerina, Italy) from velocimetric records and numerical models. Bull. Seism. Soc. Am. 2009, 99, 1612–1635. [Google Scholar] [CrossRef]
- Martino, S.; Minutolo, A.; Paciello, A.; Rovelli, A.; Mugnozza, G.S.; Verrubbi, V. Evidence of amplification effects in fault zone related to rock mass jointing. Nat. Hazards 2006, 39, 419–449. [Google Scholar] [CrossRef]
- Brune, J.N.; Allen, C.R. A low-stress-drop, low-magnitude earthquake with surface faulting: The Imperial, California, earthquake of March 4, 1966. Bull. Seism. Soc. Am. 1967, 57, 501–514. [Google Scholar]
- Westaway, R.; Jackson, J. Surface faulting in the southern Italian Campania-Basilicata earthquake of 23 November 1980. Nature 1984, 312, 436–438. [Google Scholar] [CrossRef]
- Seed, H.B.; Idriss, I.M. Analysis of soil liquefaction: Niigata earthquake. J. Soil Mech. Found. Div. 1967, 93, 83–108. [Google Scholar] [CrossRef]
- Huang, Y.; Yu, M. Review of soil liquefaction characteristics during major earthquakes of the twenty-first century. Nat. Hazards 2013, 65, 2375–2384. [Google Scholar] [CrossRef]
- Keefer, D.K. Statistical analysis of an earthquake-induced landslide distribution—the 1989 Loma Prieta, California event. Eng. Geol. 2000, 58, 231–249. [Google Scholar] [CrossRef]
- Yin, Y.; Wang, F.; Sun, P. Landslide hazards triggered by the 2008 Wenchuan earthquake, Sichuan, China. Landslides 2009, 6, 139–152. [Google Scholar] [CrossRef]
- Xu, Q.; Fan, X.M.; Huang, R.Q.; Van Westen, C. Landslide dams triggered by the Wenchuan Earthquake, Sichuan Province, south west China. Bull. Eng. Geol. Environ. 2009, 68, 373–386. [Google Scholar] [CrossRef]
- Martino, S.; Bozzano, F.; Caporossi, P.; D’Angiò, D.; Della Seta, M.; Esposito, C.; Fantini, A.; Fiorucci, M.; Giannini, L.M.; Iannucci, R.; et al. Impact of landslides on transportation routes during the 2016–2017 Central Italy seismic sequence. Landslides 2019, 16, 1221–1241. [Google Scholar] [CrossRef]
- Fan, X.; Scaringi, G.; Korup, O.; West, A.J.; van Westen, C.J.; Tanyas, H.; Hovius, N.; Hales, T.; Jibson, R.W.; Allstadt, K.E.; et al. Earthquake-induced chains of geologic hazards: Patterns, mechanisms, and impacts. Rev. Geophys. 2019, 57, 421–503. [Google Scholar] [CrossRef]
- Martino, S.; Antonielli, B.; Bozzano, F.; Caprari, P.; Discenza, M.E.; Esposito, C.; Fiorucci, M.; Iannucci, R.; Marmoni, G.M.; Schilirò, L. Landslides triggered after the 16 August 2018 Mw 5.1 Molise earthquake (Italy) by a combination of intense rainfalls and seismic shaking. Landslides 2020, 17, 1177–1190. [Google Scholar] [CrossRef]
- Granger, K.; Jones, T.; Leiba, M.; Scott, G. Community risk in Cairns: A multi-hazard risk assessment. Aust. J. Emerg. Manag. 1999, 14, 29–30. [Google Scholar]
- Kappes, M.; Keiler, M.; Glade, T. From Single- to Multi-Hazard Risk Analyses: A Concept Addressing Emerging Challenges. In Mountain Risks: Bringing Science to Society, Proceedings of the Mountain Risk International Conference, Florence, Italy, 24–26 November 2010; CERG: Strasbourg, France; pp. 351–356.
- Gill, J.C.; Malamud, B.D. Hazard interactions and interaction networks (cascades) within multi-hazard methodologies. Earth Syst. Dynam. 2016, 7, 659–679. [Google Scholar] [CrossRef]
- Marzocchi, W.; Mastellone, M.L.; Di Ruocco, A.; Novelli, P.; Romeo, E.; Gasparini, P. Principles of Multirisk Assessment: Interaction amongst Natural and Man-Induced Risks (Project Report); Office for Official Publications of the European Communities: Luxembourg, 2009. [Google Scholar] [CrossRef]
- Kappes, M.S.; Keiler, M.; von Elverfeld, K.; Glade, T. Challenges of Analyzing Multi-hazard Risk: A Review. Nat. Hazards 2012, 64, 1925–1958. [Google Scholar] [CrossRef]
- Marzocchi, W.; Garcia-Aristizabal, A.; Gasparini, P.; Mastellone, M.L.; Di Ruocco, A. Basic principles of multi-risk assessment: A case study in Italy. Nat. Hazards 2012, 62, 551–573. [Google Scholar] [CrossRef]
- Perry, R.W.; Lindell, M.K. Volcanic risk perception and adjustment in a multi-hazard environment. J. Volcanol. Geoth. Res. 2008, 172, 170–178. [Google Scholar] [CrossRef]
- Shi, P.; Yang, X.; Liu, F.; Li, M.; Pan, H.; Yang, W.; Fang, J.; Sun, S.; Tan, C.; Tang, H.; et al. Mapping Multi-Hazard Risk of the World. In World Atlas of Natural Disaster Risk; Shi, P., Kasperson, R., Eds.; Springer: Berlin/Heidelberg, Germany, 2015; pp. 287–306. [Google Scholar]
- Gill, J.C.; Malamud, B.D. Reviewing and visualizing the interactions of natural hazards. Rev. Geophys. 2014, 52, 680–722. [Google Scholar] [CrossRef]
- van Westen, C.J.; Montoya, L.; Boerboom, L. Multi-Hazard Risk Assessment using GIS in urban areas: A case study for the city of Turrialba, Costa-Rica. In Proceedings of the Regional Workshop on Best Practise in Disaster Mitigation, Bali, Indonesia, 14–26 September 2002; pp. 120–136. [Google Scholar]
- Lari, S.; Frattini, P.; Crosta, G.B. Local scale multiple quantitative risk assessment and uncertainty evaluation in a densely urbanised area (Brescia, Italy). Nat. Hazards Earth Syst. Sci. 2012, 12, 3387–3406. [Google Scholar] [CrossRef][Green Version]
- Forte, G.; De Falco, M.; Santangelo, N.; Santo, A. Slope Stability in a Multi-Hazard Eruption Scenario (Santorini, Greece). Geosciences 2019, 9, 412. [Google Scholar] [CrossRef]
- Greiving, S.; Fleischhauer, M.; Lückenkötter, J. A methodology for an integrated risk assessment of spatially relevant hazards. J. Environ. Plan. Man. 2006, 49, 1–19. [Google Scholar] [CrossRef]
- Grünthal, G.; Thieken, A.; Schwarz, J.; Radtke, K.; Smolka, A.; Merz, B. Comparative risk assessment for the city of cologne—storms, floods, earthquakes. Nat. Hazards 2006, 38, 21–44. [Google Scholar] [CrossRef]
- van Westen, C.J.; Kappes, M.S.; Luna, B.Q.; Frigerio, S.; Glade, T.; Malet, J.-P. Medium-Scale Multi-Hazard Risk Assessment of Gravitational Processes. In Mountain Risks: From Prediction to Management and Governance; van Asch, T., Corominas, J., Greiving, S., Malet, J.-P., Sterlacchini, S., Eds.; Springer: Dordrecht, The Netherland, 2014; pp. 201–231. [Google Scholar]
- Neri, M.; Le Cozannet, G.; Thierry, P.; Bignami, C.; Ruch, J. A method for multi-hazard mapping in poorly known volcanic areas: An example from Kanlaon (Philippines). Nat. Hazards Earth Syst. Sci. 2013, 13, 1929–1943. [Google Scholar] [CrossRef]
- Meletti, C.; Montaldo, V. Stime di Pericolosità Sismica per Diverse Probabilità di Superamento in 50 Anni: Valori di ag. Progetto DPC-INGV S1, Deliverable D2. 2007. Available online: http://esse1.mi.ingv.it/d2.html (accessed on 22 February 2021).
- Blumetti, A.M.; Dramis, F.; Michetti, A.M. Fault-generated mountain fronts in the Central Apennines (Central Italy): Geomorphological features and seismotectonic implications. Earth Surf. Proc. Land. 1993, 18, 203–223. [Google Scholar] [CrossRef]
- Galadini, F.; Galli, P. Paleoseismology of silent faults in the Central Apennines (Italy): The Mt. Vettore and Laga Mts. faults. Ann. Geophys. 2003, 46, 5. [Google Scholar]
- Lai, C.G.; Corigliano, M.; Agosti, M. Dighe e Terremoti: Il Caso del Sisma Aquilano; Progettazione Sismica: Pavia, Italy, 2009; pp. 183–205. [Google Scholar]
- Centamore, E.; Cantalamessa, G.; Micarelli, A.; Potetti, M.; Berti, D.; Bigi, S.; Morelli, C.; Ridolfi, M. Stratigrafia e analisi di facies dei depositi del Miocene e del Pliocene inferiore dell’avanfossa marchigiano-abruzzese e delle zone limitrofe. Studi Geologici Camerti 1991, 2, 125–131. [Google Scholar]
- Adamoli, L.; Calamita, F.; Pizzi, A. Note Illustrative Della Carta Geologica d’Italia Alla Scala 1:50.000. Foglio 349 Gran Sasso d’Italia; ISPRA Servizio Geologico d’Italia: Roma, Italy, 2010. [Google Scholar]
- Artoni, A. Messinian events within the tectono-stratigraphic evolution of the Southern Laga Basin (Central Apennines, Italy). Boll. Soc. Geol. Ital. 2003, 122, 447–466. [Google Scholar]
- Milli, S.; Moscatelli, M.; Stanzione, O.; Falcione, F. Sedimentology and physical stratigraphy of the Messinian turbidite deposits of the Laga Basin (central Apennines, Italy). Ital. J. Geosci. 2007, 126, 255–281. [Google Scholar]
- Galadini, F.; Galli, P. Active tectonics in the central Apennines (Italy)–Input data for seismic hazard assessment. Nat. Hazards 2000, 22, 225–268. [Google Scholar] [CrossRef]
- Calabresi, G.; Manfredini, G. Terreni Coesivi Poco Consistenti in Italia. Riv. Ital. Geotec. 1976, 10, 49–64. [Google Scholar]
- Calamita, F.; Pizzi, A. Recent and active extensional tectonics in the southern Umbro-Marchean Apennines (central Italy). Mem. Soc. Geol. It. 1994, 48, 541–548. [Google Scholar]
- Lavecchia, G.; Brozzetti, F.; Barchi, M.; Menichetti, M.; Keller, J.V. Seismotectonic zoning in east-central Italy deduced from an analysis of the Neogene to present deformations and related stress fields. Geol. Soc. Am. Bull. 1994, 106, 1107–1120. [Google Scholar] [CrossRef]
- Ghisetti, F.; Vezzani, L. Stili strutturali nei sistemi di sovrascorrimento della Catena del Gran Sasso (Appennino Centrale). Studi Geologici Camerti 1990, special issue, 37–50. [Google Scholar]
- Patacca, E.; Scandone, P. Post-Tortonian Mountain Building in the Apennines. The Role of the Passive Sinking of a Relic Lithospheric Slab. In Advances in Earth Science Research; Boriani, A., Bonafede, M., Piccardo, G.B., Vai, G.B., Eds.; Accademia Nazionale dei Lincei: Roma, Italy, 1989; Volume 80, pp. 157–176. [Google Scholar]
- Boccaletti, M.; Ciaranfi, N.; Cosentino, D.; Deiana, G.; Gelati, R.; Lentini, F.; Massari, F.; Moratti, G.; Pescatore, T.; Ricci Lucchi, F.; et al. Palinspastic restoration and paleogeographic reconstruction of the peri-Tyrrhenian area during the Neogene. Palaeogeogr. Palaeoclimatol. Palaeoecol. 1990, 77, 41-IN13. [Google Scholar] [CrossRef]
- Funiciello, R.; Tozzi, M.; Trigari, A.; Scipioni, L. Tettonica compressiva ed evoluzione cinematica dell’area di Cima Alta (Appennino centrale, Teramo). Boll. Soc. Geol. Ital. 1993, 112, 615–633. [Google Scholar]
- Cacciuni, A.; Centamore, E.; Di Stefano, R.; Dramis, F. Evoluzione morfotettonica della conca di Amatrice. Studi Geologici Camerti 1995, 95–100. [Google Scholar]
- Boncio, P.; Lavecchia, G.; Milana, G.; Rozzi, B. Seismogenesis in Central Apennines, Italy: An integrated analysis of minor earthquake sequences and structural data in the Amatrice-Campotosto area. Ann. Geophys. 2004, 47, 1723–1742. [Google Scholar]
- Galadini, F.; Messina, P. Plio-Quaternary changes of the normal fault architecture in the central Apennines (Italy). Geodin. Acta 2001, 14, 321–344. [Google Scholar] [CrossRef][Green Version]
- Galadini, F.; Falcucci, E.; Gori, S.; Zimmaro, P.; Cheloni, D.; Stewart, J.P. Active faulting in source region of 2016–2017 Central Italy event sequence. Earthq. Spectra 2018, 34, 1557–1583. [Google Scholar] [CrossRef]
- Falcucci, E.; Gori, S.; Bignami, C.; Pietrantonio, G.; Melini, D.; Moro, M.; Saroli, M.; Galadini, F. The Campotosto seismic gap in between the 2009 and 2016-2017 seismic sequences of central Italy and the role of inherited lithospheric faults in regional seismotectonic settings. Tectonics 2018, 37, 2425–2445. [Google Scholar] [CrossRef]
- Falcucci, E.; Gori, S.; Galadini, F.; Fubelli, G.; Moro, M.; Saroli, M. Active faults in the epicentral and mesoseismal Ml 6.0 24, 2016 Amatrice earthquake region, central Italy. Methodological and seismotectonic issues. Ann. Geophys. 2016, 59. [Google Scholar] [CrossRef]
- Valoroso, L.; Chiaraluce, L.; Piccinini, D.; Di Stefano, R.; Schaff, D.; Waldhauser, F. Radiography of a normal fault system by 64,000 high-precision earthquake locations: The 2009 L’Aquila (central Italy) case study. J. Geophys. Res. 2013, 118, 1–21. [Google Scholar] [CrossRef]
- Wells, D.L.; Coppersmith, K.J. New empirical relationships among Magnitude, rupture length, rupture width, rupture area, and surface displacement. Bull. Seismol. Soc. Am. 1994, 84, 974–1002. [Google Scholar]
- Tondi, E.; Jablonská, D.; Volatili, T.; Michele, M.; Mazzoli, S.; Pierantoni, P.P. The Campotosto linkage fault zone between the 2009 and 2016 seismic sequences of central Italy: Implications for seismic hazard analysis. Geol. Soc. Am. Bull. 2020. [Google Scholar] [CrossRef]
- Castelli, V.; Camassi, R.; Caracciolo, C.H.; Locati, M.; Meletti, C.; Rovida, A. New insights in the seismic history of Monti della Laga area. Ann. Geophys. 2016, 59. [Google Scholar] [CrossRef]
- Chiaraluce, L.; Ellsworth, W.L.; Chiarabba, C.; Cocco, M. Imaging the complexity of an active normal fault system: The 1997 Colfiorito (central Italy) case study. J. Geophys. Res. Solid Earth 2003, 108, 2294. [Google Scholar] [CrossRef]
- Chiaraluce, L.; Valoroso, L.; Piccinini, D.; Di Stefano, R.; De Gori, P. The anatomy of the 2009 L’Aquila normal fault system (central Italy) imaged by high resolution foreshock and aftershock locations. J. Geophys. Res. 2011, 116, B12311. [Google Scholar] [CrossRef]
- Chiaraluce, L.; Di Stefano, R.; Tinti, E.; Scognamiglio, L.; Michele, M.; Casarotti, E.; Cattaneo, M.; De Gori, P.; Chiarabba, C.; Monachesi, G.; et al. The 2016 Central Italy seismic sequence: A first look at the mainshocks, aftershocks and source models. Seismol. Res. Lett. 2017, 88, 757–771. [Google Scholar] [CrossRef]
- Chiaraluce, L.; Barchi, M.R.; Carannante, S.; Collettini, C.; Mirabella, F.; Pauselli, C.; Valoroso, L. The role of rheology, crustal structures and lithology in the seismicity distribution of the northern Apennines. Tectonophysics 2017, 694, 280–291. [Google Scholar] [CrossRef]
- Bignami, C.; Tolomei, C.; Pezzo, G.; Guglielmino, F.; Atzori, S.; Trasatti, E.; Antonioli, A.; Stramondo, S.; Salvi, S. Source identification for situational awareness of the August 24th 2016 Central Italy event. Ann. Geophys. Discuss. 2016, 59. [Google Scholar] [CrossRef]
- Tinti, E.; Scognamiglio, L.; Michelini, A.; Cocco, M. Slip heterogeneity and directivity of the ML 6.0, 2016, Amatrice earthquake estimated with rapid finite-fault inversion. Geophys. Res. Lett. 2016, 43, 10745–10752. [Google Scholar] [CrossRef]
- Gruppo di Lavoro INGV sul Terremoto in Centro Italia. Relazione Sullo Stato Delle Conoscenze Sulla Sequenza Sismica in Centro Italia 2016–2017 (aggiornamento al 2 febbraio 2017); INGV: Roma, Italy, 2017. [Google Scholar] [CrossRef]
- Livio, F.; Michetti, A.M.; Vittori, E.L.; Piccardi, L.; Tondi, E.; Roberts, G. Surface faulting during the August 24, 2016, Central Italy earthquake (Mw 6.0): Preliminary results. Ann. Geophys. 2016, 59. [Google Scholar] [CrossRef]
- Pucci, S.; De Martini, P.M.; Civico, R.; Villani, F.; Nappi, R.; Ricci, T.; Azzaro, R.; Brunori, C.A.; Caciagli, M.; Cinti, F.R.; et al. Coseismic ruptures of the 24 August 2016, Mw 6.0 Amatrice earthquake (central Italy). Geophys. Res. Lett. 2017, 44, 2138–2147. [Google Scholar] [CrossRef]
- Carminati, E.; Bignami, C.; Doglioni, C.; Smeraglia, L. Lithological control on multiple surface ruptures during the 2016–2017Amatrice-Norcia seismic sequence. J. Geodyn. 2020, 134, 101676. [Google Scholar] [CrossRef]
- Smeraglia, L.; Billi, A.; Carminati, E.; Cavallo, A.; Doglioni, C. Field-to nano-scale evidence for weakening mechanisms along the fault of the 2016 Amatrice and Norcia earthquakes, Italy. Tectonophysics 2017, 712, 156–169. [Google Scholar] [CrossRef]
- ISRM. The Complete ISRM Suggested Methods for Rock Characterization, Testing and Monitoring: 1974–2006. In ISRM & ISRM Turkish National Group; Ulusay, R., Hudson, J.A., Eds.; ISRM Commissions on Testing Methods: Ankara, Turkey, 2007; p. 628. ISBN 978-975-93675-4-1. [Google Scholar]
- Palmström, A.; Sharma, V.I.; Saxena, K. In-Situ Characterization of Rocks; Balkema Publication: Rotterdam, The Netherland, 2001; pp. 1–40. [Google Scholar]
- Marinos, P.; Hoek, E. Estimating the geotechnical properties of heterogeneous rock masses such as flysch. Bull. Eng. Geol. Environ. 2001, 60, 85–92. [Google Scholar] [CrossRef]
- Calamita, F.; Adamoli, L.; Pizzi, A.; Chiocchini, M.; Rusciadelli, G.; Di Simone, S.; Centamore, E.; Pieruccini, P.; Scisciani, V. Carta Geologica d’Italia alla Scala 1:50.000. Foglio 349 Gran Sasso d’Italia; ISPRA Servizio Geologico d’Italia: Roma, Italy, 2010. [Google Scholar]
- Saroli, M.; (Università degli Studi di Cassino e del Lazio Meridionale, Cassino, Italy); Moro, M.; (Istituto Nazionale di Geofisica e Vulcanologia, Roma, Italy). Personal communication, 2017.
- EMERGEO Working Group. Terremoto di Amatrice del 24 Agosto 2016: Effetti Cosismici; INGV: Roma, Italy, 2016. [Google Scholar] [CrossRef]
- Chigira, M. Long-term gravitational deformation of rocks by mass rock creep. Eng. Geol. 1992, 32, 157–184. [Google Scholar] [CrossRef]
- Brando, G.; Pagliaroli, A.; Cocco, G.; Di Buccio, F. Site effects and damage scenarios: The case study of two historic centers following the 2016 Central Italy earthquake. Eng. Geol. 2020, 272, 105647. [Google Scholar] [CrossRef]
- Delgado, J.; López Casado, C.; Giner, J.; Estévez, A.; Cuenca, A.; Molina, S. Microtremors as a geophysical exploration tool: Applications and limitations. Pure Appl. Geophys. 2000, 157, 1445–1462. [Google Scholar] [CrossRef]
- LeBrun, B.; Duval, A.M.; Bard, P.-Y.; Monge, O.; Bour, M.; Vidal, S.; Fabriol, H. Seismic Microzonation: A Comparison between Geotechnical and Seismological Approaches in Pointe-à-Pitre (French West Indies). Bull. Earthq. Eng. 2004, 2, 27–50. [Google Scholar] [CrossRef]
- Martino, S.; Lenti, L.; Gélis, C.; Giacomi, A.C.; Santisi d’Avila, M.P.; Bonilla, L.F.; Bozzano, F.; Semblat, J.F. Influence of Lateral Heterogeneities on Strong-Motion Shear Strains: Simulations in the Historical Center of Rome (Italy). Bull. Seism. Soc. Am. 2015, 105, 2604–2624. [Google Scholar]
- Pergalani, F.; Pagliaroli, A.; Bourdeau, C.; Compagnoni, M.; Lenti, L.; Lualdi, M.; Madiai, C.; Martino, S.; Razzano, R.; Varone, C.; et al. Seismic microzoning map: Approaches, results and applications after the 2016–2017 Central Italy seismic sequence. Bull. Earthq. Eng. 2020, 18, 5595–5629. [Google Scholar] [CrossRef]
- ICMS Working Group. Indirizzi e criteri per la microzonazione sismica—Guidelines for seismic microzonation. Conferenza delle Regioni e delle Province autonome. Dipartimento della Protezione Civile 2008, 3. Available online: http://www.protezionecivile.gov.it/httpdocs/cms/attach_extra/GuidelinesForSeismicMicrozonation.pdf (accessed on 22 February 2021).
- SMH Seismic Microzonation Handbook. Geoscience Division, Ministry of Earth Sciences, Government of India, New Delhi 2011. Available online: https://moes.gov.in/writereaddata/files/seismic_mcrozonation_manual.pdf (accessed on 22 February 2021).
- Poggi, V.; Fah, D. Guidelines and Strategies for Seismic Microzonation in Switzerland; Swiss Seismological Service; ETH Zurich: Zurich, Switzerland, 2016. [Google Scholar] [CrossRef]
- ASTM. D422-63e2, Standard Test Method for Particle-Size Analysis of Soils. In Annual Book of ASTM Standards; ASTM International: West Conshohocken, PA, USA, 2007. [Google Scholar]
- ASTM. D4318-10e1, Standard Test Methods for Liquid Limit, Plastic Limit, and Plasticity Index of Soils. In Annual Book of ASTM Standards; ASTM International: West Conshohocken, PA, USA, 2010. [Google Scholar]
- Nogoshi, M.; Igarashi, T. On the propagation characteristics of microtremors. J. Seism. Soc. Jpn. 1970, 23, 264–280, (In Japanese with English abstract). [Google Scholar]
- Nogoshi, M.; Igarashi, T. On the amplitude characteristics of microtremors. J. Seism. Soc. Jpn. 1971, 24, 24–40, (In Japanese with English abstract). [Google Scholar]
- Nakamura, Y. A method for dynamic characteristics estimation of subsurface using microtremor on the ground surface. Q. Rep. Railw. Techn. Res. Inst. (RTRI) 1989, 30, 25–33. [Google Scholar]
- Bour, M.; Fouissac, D.; Dominique, P.; Martin, C. On the use of microtremor recordings in seismic microzonation. Soil Dyn. Earthq. Eng. 1998, 17, 465–474. [Google Scholar] [CrossRef]
- Haghshenas, E.; Bard, P.-Y.; Theodulidis, N. SESAME WP04 Team Empirical evaluation of microtremor H/V spectral ratio. Bull. Earthq. Eng. 2008, 6, 75–108. [Google Scholar] [CrossRef]
- SESAME Guidelines for the implementation of the H/V spectral ratio technique on ambient vibrations: Measurements, processing and interpretation. In Deliverable D23.12 European Commission—Research General Directorate Project No. EVG1-CT-2000-00026 SESAME; European Commission: Grenoble, France, 2004.
- Castellaro, S.; Mulargia, F. The effect of velocity inversions on H/V. Pure Appl. Geophys. 2009, 166, 567–592. [Google Scholar] [CrossRef]
- Wathelet, M.; Chatelain, J.-L.; Cornou, C.; Di Giulio, G.; Guillier, B.; Ohrnberger, M.; Savvaidis, A. Geopsy: A User-Friendly Open-Source Tool Set for Ambient Vibration Processing. Seismol. Res. Lett. 2020, 91, 1878–1889. [Google Scholar] [CrossRef]
- Konno, K.; Ohmachi, T. Ground-motion characteristics estimated from spectral ratio between horizontal and vertical components of microtremor. Bull. Seism. Soc. Am. 1998, 88, 228–241. [Google Scholar]
- Galea, P.; D’Amico, S.; Farrugia, D. Dynamic characteristics of an active coastal spreading area using ambient noise measurements-Anchor Bay, Malta. Geophys. J. Int. 2014, 199, 1166–1175. [Google Scholar] [CrossRef][Green Version]
- Iannucci, R.; Martino, S.; Paciello, A.; D’Amico, S.; Galea, P. Engineering geological zonation of a complex landslide system through seismic ambient noise measurements at the Selmun promontory (Malta). Geophys. J. Int. 2018, 213, 1146–1161. [Google Scholar] [CrossRef]
- Iannucci, R.; Martino, S.; Paciello, A.; D’Amico, S.; Galea, P. Investigation of cliff instability at Għajn Ħadid Tower (Selmun Promontory, Malta) by integrated passive seismic techniques. J. Seismol. 2020, 24, 897–916. [Google Scholar] [CrossRef]
- Martino, S.; Caprari, P.; Della Seta, M.; Esposito, C.; Fiorucci, M.; Hailemikael, S.; Iannucci, R.; Marmoni, G.M.; Martini, G.; Paciello, A.; et al. Influence of geological complexities on local seismic response in the Municipality of Forio (Ischia Island, Italy). Ital. J. Eng. Geol. Environ. 2020. [Google Scholar] [CrossRef]
- Xia, J.; Miller, R.D.; Park, C.B. Estimation of near-surface shear-wave velocity by inversion of Rayleigh waves. Geophysics 1999, 64, 691–700. [Google Scholar] [CrossRef]
- Socco, L.V.; Strobbia, C. Surface-wave method for near-surface characterization: A tutorial. Near Surf. Geophys. 2004, 2, 165–185. [Google Scholar] [CrossRef]
- Park, C.B.; Miller, R.D.; Xia, J.; Ivanov, J. Multichannel analysis of surface waves (MASW)—Active and passive methods. Lead. Edge 2007, 26, 60–64. [Google Scholar] [CrossRef]
- Xia, J.; Xu, Y.; Miller, R.D. Generating an image of dispersive energy by frequency decomposition and slant stacking. Pure Appl. Geophys. 2007, 164, 941–956. [Google Scholar] [CrossRef]
- Olafsdottir, E.A.; Erlingsson, S.; Bessason, B. Tool for analysis of multichannel analysis of surface waves (MASW) field data and evaluation of shear wave velocity profiles of soils. Can. Geotech. J. 2018, 55, 217–233. [Google Scholar] [CrossRef]
- Yilmaz, Ö. Seismic Data Processing; Society of Exploration Geophysicists: Tulsa, OK, USA, 1987. [Google Scholar]
- Park, C.B. Imaging dispersion of MASW data—Full vs. selective offset scheme. J. Environ. Eng. Geophys. 2011, 16, 13–23. [Google Scholar] [CrossRef]
- Wathelet, M. An improved neighborhood algorithm: Parameter conditions and dynamic scaling. Geophys. Res. Lett. 2008, 35, L09301. [Google Scholar] [CrossRef]
- Peruzzi, G.; Albarello, D. The possible effect of vertical ground motion on the horizontal seismic response at the surface of a sedimentary structure. Boll. Geof. Teor. Appl. 2017, 58, 343–352. [Google Scholar]
- Macerola, L.; Tallini, M.; Di Giulio, G.; Nocentini, M.; Milana, G. The 1-D and 2-D seismic modeling of deep quaternary basin (Downtown L’Aquila, Central Italy). Earthq. Spectra 2019, 35, 1689–1710. [Google Scholar] [CrossRef]
- Seed, H.B.; Idriss, I.M. Soil Moduli and Damping Factors for Dynamic Response Analyses; Report EERC; Earthquake Engineering Research Center, University of California: Berkeley, CA, USA, 1970; Volume 70–100, pp. 1–15. [Google Scholar]
- Rollins, K.M.; Evans, M.; Diehl, N.; Daily, W. Shear modulus and damping relationships for gravels. J. Geotech. Geoenviron. 1998, 124, 396–405. [Google Scholar] [CrossRef]
- Blumetti, A.M.; Guerrieri, L. Fault-generated mountain fronts and the identification of fault segments: Implications for seismic hazard assessment. Bol. Soc. Geol. Ital. 2007, 126, 307–322. [Google Scholar]
- Vičič, B.; Aoudia, A.; Borghi, A.; Momeni, S.; Vuan, A. Seismicity rate changes and geodetic transients in Central Apennines. Geophys. Res. Lett. 2020, 47, e2020GL090668. [Google Scholar] [CrossRef]
- Bigi, S.; Casero, P.; Chiarabba, C.; Di Bucci, D. Contrasting surface active faults and deep seismogenic sources unveiled by the 2009 L’Aquila earthquake sequence (Italy). Terra Nova 2012, 25, 21–29. [Google Scholar] [CrossRef]
- Buttinelli, M.; Pezzo, G.; Valoroso, L.; De Gori, P.; Chiarabba, C. Tectonics Inversions, Fault Segmentations, and Triggering Mechanisms in the Central Apennines Normal Fault System: Insights from High-Resolution Velocity Models. Tectonics 2018, 37, 4135–4149. [Google Scholar] [CrossRef]
- Cheloni, D.; D’Agostino, N.; Scognamiglio, L.; Tinti, E.; Bignami, C.; Avallone, A.; Giuliani, R.; Calcaterra, S.; Gambino, P.; Mattone, M. Heterogeneous behavior of the Campotosto normal fault (central Italy) imaged by InSAR GPS and strong-motion data: Insights from the 18 January 2017 events. Remote Sens. 2019, 11, 1482. [Google Scholar] [CrossRef]
- Martino, S.; Bozzano, F.; Caporossi, P.; D’Angiò, D.; Della Seta, M.; Esposito, C.; Fantini, A.; Fiorucci, M.; Giannini, L.M.; Iannucci, R.; et al. Ground effects triggered by the 24th August 2016, Mw 6.0 Amatrice (Italy) earthquake: Surveys and inventorying to update the CEDIT catalogue. Geogr. Fis. Din. Quat. 2017, 40, 77–95. [Google Scholar]
- Zimmaro, P.; Stewart, J.P. Engineering Reconnaissance of the 24 August 2016 Central Italy Earthquake; A report of the NSF-Sponsored GEER Association Team, GEER-050B, Ver, 2; Geotechnical Extreme Events Reconnaissance Association: Los Angeles, CA, USA, 2016. [Google Scholar] [CrossRef]
- Radbruch-Hall, D.H. Gravitational Creep of Rock Masses on Slopes. In Development of Geotechnical Engineering; Voight, B., Ed.; Elsevier: Amsterdam, The Netherland, 1978; Volume 14, pp. 607–658. [Google Scholar]
- Evans, S.; Scarascia Mugnozza, G.; Strom, A.; Hermanns, R.; Ischuk, A.; Vinnichenko, S. Landslides from massive rock slope failure and associated phenomena. In Landslides from Massive Rock Slope Failure; Springer: Dordrecht, The Netherland, 2006; pp. 3–52. [Google Scholar]
- Dramis, F.; Sorriso-Valvo, M. Deep-seated gravitational slope deformations, related landslide and tectonics. Eng. Geol. 1994, 38, 231–243. [Google Scholar] [CrossRef]
- Di Luzio, E.; Saroli, M.; Esposito, C.; Bianchi Fasani, G.; Cavinato, G.P.; Scarascia Mugnozza, G. Influence of structural framework on mountain slope deformation in the Maiella anticline (Central Apennines, Italy). Geomorphology 2004, 60, 417–432. [Google Scholar] [CrossRef]
- Crosta, G.B.; Frattini, P.; Agliardi, F. Deep seated gravitational slope deformations in the European Alps. Tectonophysics 2013, 605, 13–33. [Google Scholar] [CrossRef]
- Seed, H.B.; Idriss, I.M. Simplified procedure for evaluating soil liquefaction potential. J. Soil Mech. Found. Div. 1971, 97, 1249–1273. [Google Scholar] [CrossRef]
- Idriss, I.M.; Boulanger, R.W. Semi-empirical procedures for evaluating liquefaction potential during earthquakes. Soil Dyn. Earthq. Eng. 2006, 26, 115–130. [Google Scholar] [CrossRef]
- Samui, P.; Sitharam, T.G. Machine learning modelling for predicting soil liquefaction susceptibility. Nat. Hazard Earth Sys. 2011, 11, 1–9. [Google Scholar] [CrossRef]
Publisher’s Note: MDPI stays neutral with regard to jurisdictional claims in published maps and institutional affiliations. |
© 2021 by the authors. Licensee MDPI, Basel, Switzerland. This article is an open access article distributed under the terms and conditions of the Creative Commons Attribution (CC BY) license (http://creativecommons.org/licenses/by/4.0/).