Review

The Use of Submerged Speleothems for Sea Level Studies in the Mediterranean Sea: A New Perspective Using Glacial Isostatic Adjustment (GIA)

1
Istituto Nazionale di Geofisica e Vulcanologia, via di Vigna Murata, 00144 Roma, Italy
2
Department of Mathematics and Geosciences, University of Trieste, via Weiss 2, 34127 Trieste, Italy
3
Institute of Polar Sciences (ISP), National Research Council (CNR), 40129 Bologna, Italy
4
NIOZ Royal Netherlands Institute for Sea Research, and Utrecht University, Landsdiep 4, 16797 SZ ‘t Horntje (Texel), The Netherlands
*
Author to whom correspondence should be addressed.
Geosciences 2021, 11(2), 77; https://doi.org/10.3390/geosciences11020077
Submission received: 31 December 2020 / Revised: 26 January 2021 / Accepted: 30 January 2021 / Published: 9 February 2021
(This article belongs to the Special Issue Changing Quaternary Environment in the Mediterranean)

Abstract

:
The investigation of submerged speleothems for sea level studies has made significant contributions to the understanding of the global and regional sea level variations during the Middle and Late Quaternary. This has especially been the case for the Mediterranean Sea, where more than 300 submerged speleothems sampled in 32 caves have been analysed so far. Here, we present a comprehensive review of the results obtained from the study of submerged speleothems since 1978. The studied speleothems cover the last 1.4 Myr and are mainly focused on Marine Isotope Stages (MIS) 1, 2, 3, 5.1, 5.3, 5.5, 7.1, 7.2, 7.3, and 7.5. The results reveal that submerged speleothems represent extraordinary archives providing accurate information on former sea level changes. New results from a stalagmite collected at Palinuro (Campania, Italy) and characterized by marine overgrowth are also reported. The measured elevations of speleothems are affected by the local response to glacial and hydro-isostatic adjustment (GIA), and thus might significantly deviate from the global eustatic signal. A comparison of the ages and altitude values of the Mediterranean speleothems and flowstone from the Bahamas with local GIA provides a new scenario for MIS 5 and 7 sea level reconstructions.

1. Introduction

The study of submerged speleothems in coastal caves has significantly contributed to constraining past sea level variations for the last 1.4 Myr. In particular, it has provided relevant information on the sea level for several climatically-important Marine Isotope Stages (MIS), including MIS 1, 2, 3, 5.1, 5.3, 5.5, 6.5, 7.1, 7.2, 7.3, and 7.5, especially in the Mediterranean Sea [1,2,3,4,5,6].
The importance of the sea level in controlling groundwater elevation in both inland and coastal karst was first proposed by [7], but it was only in the early 1970s that the potential of using speleothems to reconstruct former sea levels was fully recognized. For example, [8] discusses Late Pleistocene sea level fluctuations based on radiocarbon (14C) and U-Th ages from a submerged stalagmite retrieved from Ben’s Hole cave on Grand Bahama Island, and [9] interprets the origin of the encrustations from Cova de Sa Bassa Blanca cave (Mallorca) as carbonate formations related to the Pleistocene sea level variations.
Later on, other studies used submerged speleothems to constrain relative sea level changes, taking advantage of the improvement of the U-series disequilibrium dating method by mass spectrometry for precise and accurate age determination, e.g., [1,10,11].
These carbonate deposits are usually found in caves that are below the sea level and presently flooded and they often contain marine layers/encrustations or growth hiatuses that identify periods of highstands, when the sea level reached the speleothem.
Coastal caves can be divided into two major types: Sea caves and flooded caves [12]. The first type includes caves formed by marine processes, such as wave abrasion, while the second type comprises caves that developed under subaerial processes acting in dry conditions and were then submerged by the Holocene marine transgression. They can be actively forming along present-day coastlines or occur as relict sea caves on former coastlines. The formation of sea caves is mainly controlled by geological weakness, such as bedding planes, joints, and faults along sea cliffs [13]. Ref. [14] recognized a third group, called flank margin caves. These are solutional landforms whose genesis is due to water mixing in sealed chambers. Sea caves can develop in different salinity environments. The most common coastal caves are anchialine caves that are defined as having a fresh to slightly brackish water lens overlying seawater [15].
The investigation of submerged speleothems from coastal caves has provided considerable scientific data that have contributed to precisely constraining the relative sea level variation curves. In addition to speleothems, the main markers used to reconstruct past sea level variations are shallow-water corals, ice, lagoonal and marine cores, and archaeological remains. The Mediterranean Sea is devoid of any reef-building tropical corals from after the Miocene. However, few studies have used the endemic coral species Cladocora caespitosa as a sea level marker, e.g., [16]. This coral species forms 3D structures comparable to tropical reefs [17] and shows a fossil record dating back to the Late Pliocene [18]. Despite the great potential of this temperate coral to reconstruct sea level variations in the Mediterranean Sea, the major drawback is the large depth range where this species lives, ranging from a few meters to around 40 m, which increases the uncertainty in sea level reconstructions.
In the Mediterranean Sea, three types of submerged speleothems have been studied so far: (1) Speleothems without a visible secondary concretion (rarely containing hiatuses); (2) spleothems with overgrowth(s) of marine organisms (e.g., the marine polychaete worm Serpula massiliensis, bryozoans, and sponges); and (3) speleothems with phreatic overgrowth(s).
When a rising sea level inundates a coastal cave, speleothems stop growing once submerged and several events can happen:
  • Marine biogenic overgrowth, often formed by gregarious serpulid worms mixed with bryozoans and sponges [2,19,20,21,22,23,24,25], can cover the speleothem surface, with a thickness varying from a few millimeters to over 12 cm;
  • Specimens of the boring mussel Lithophaga lithophaga can colonize the speleothem surface, creating large burrows on the submerged cave deposits [6,26];
  • Mineral deposits, including halite, hematite, goethite, lepidocrite, and gypsum, can precipitate on the speleothem surface or corroded layers can form by dissolution from seawater–groundwater mixing, e.g., [1,3,11,26];
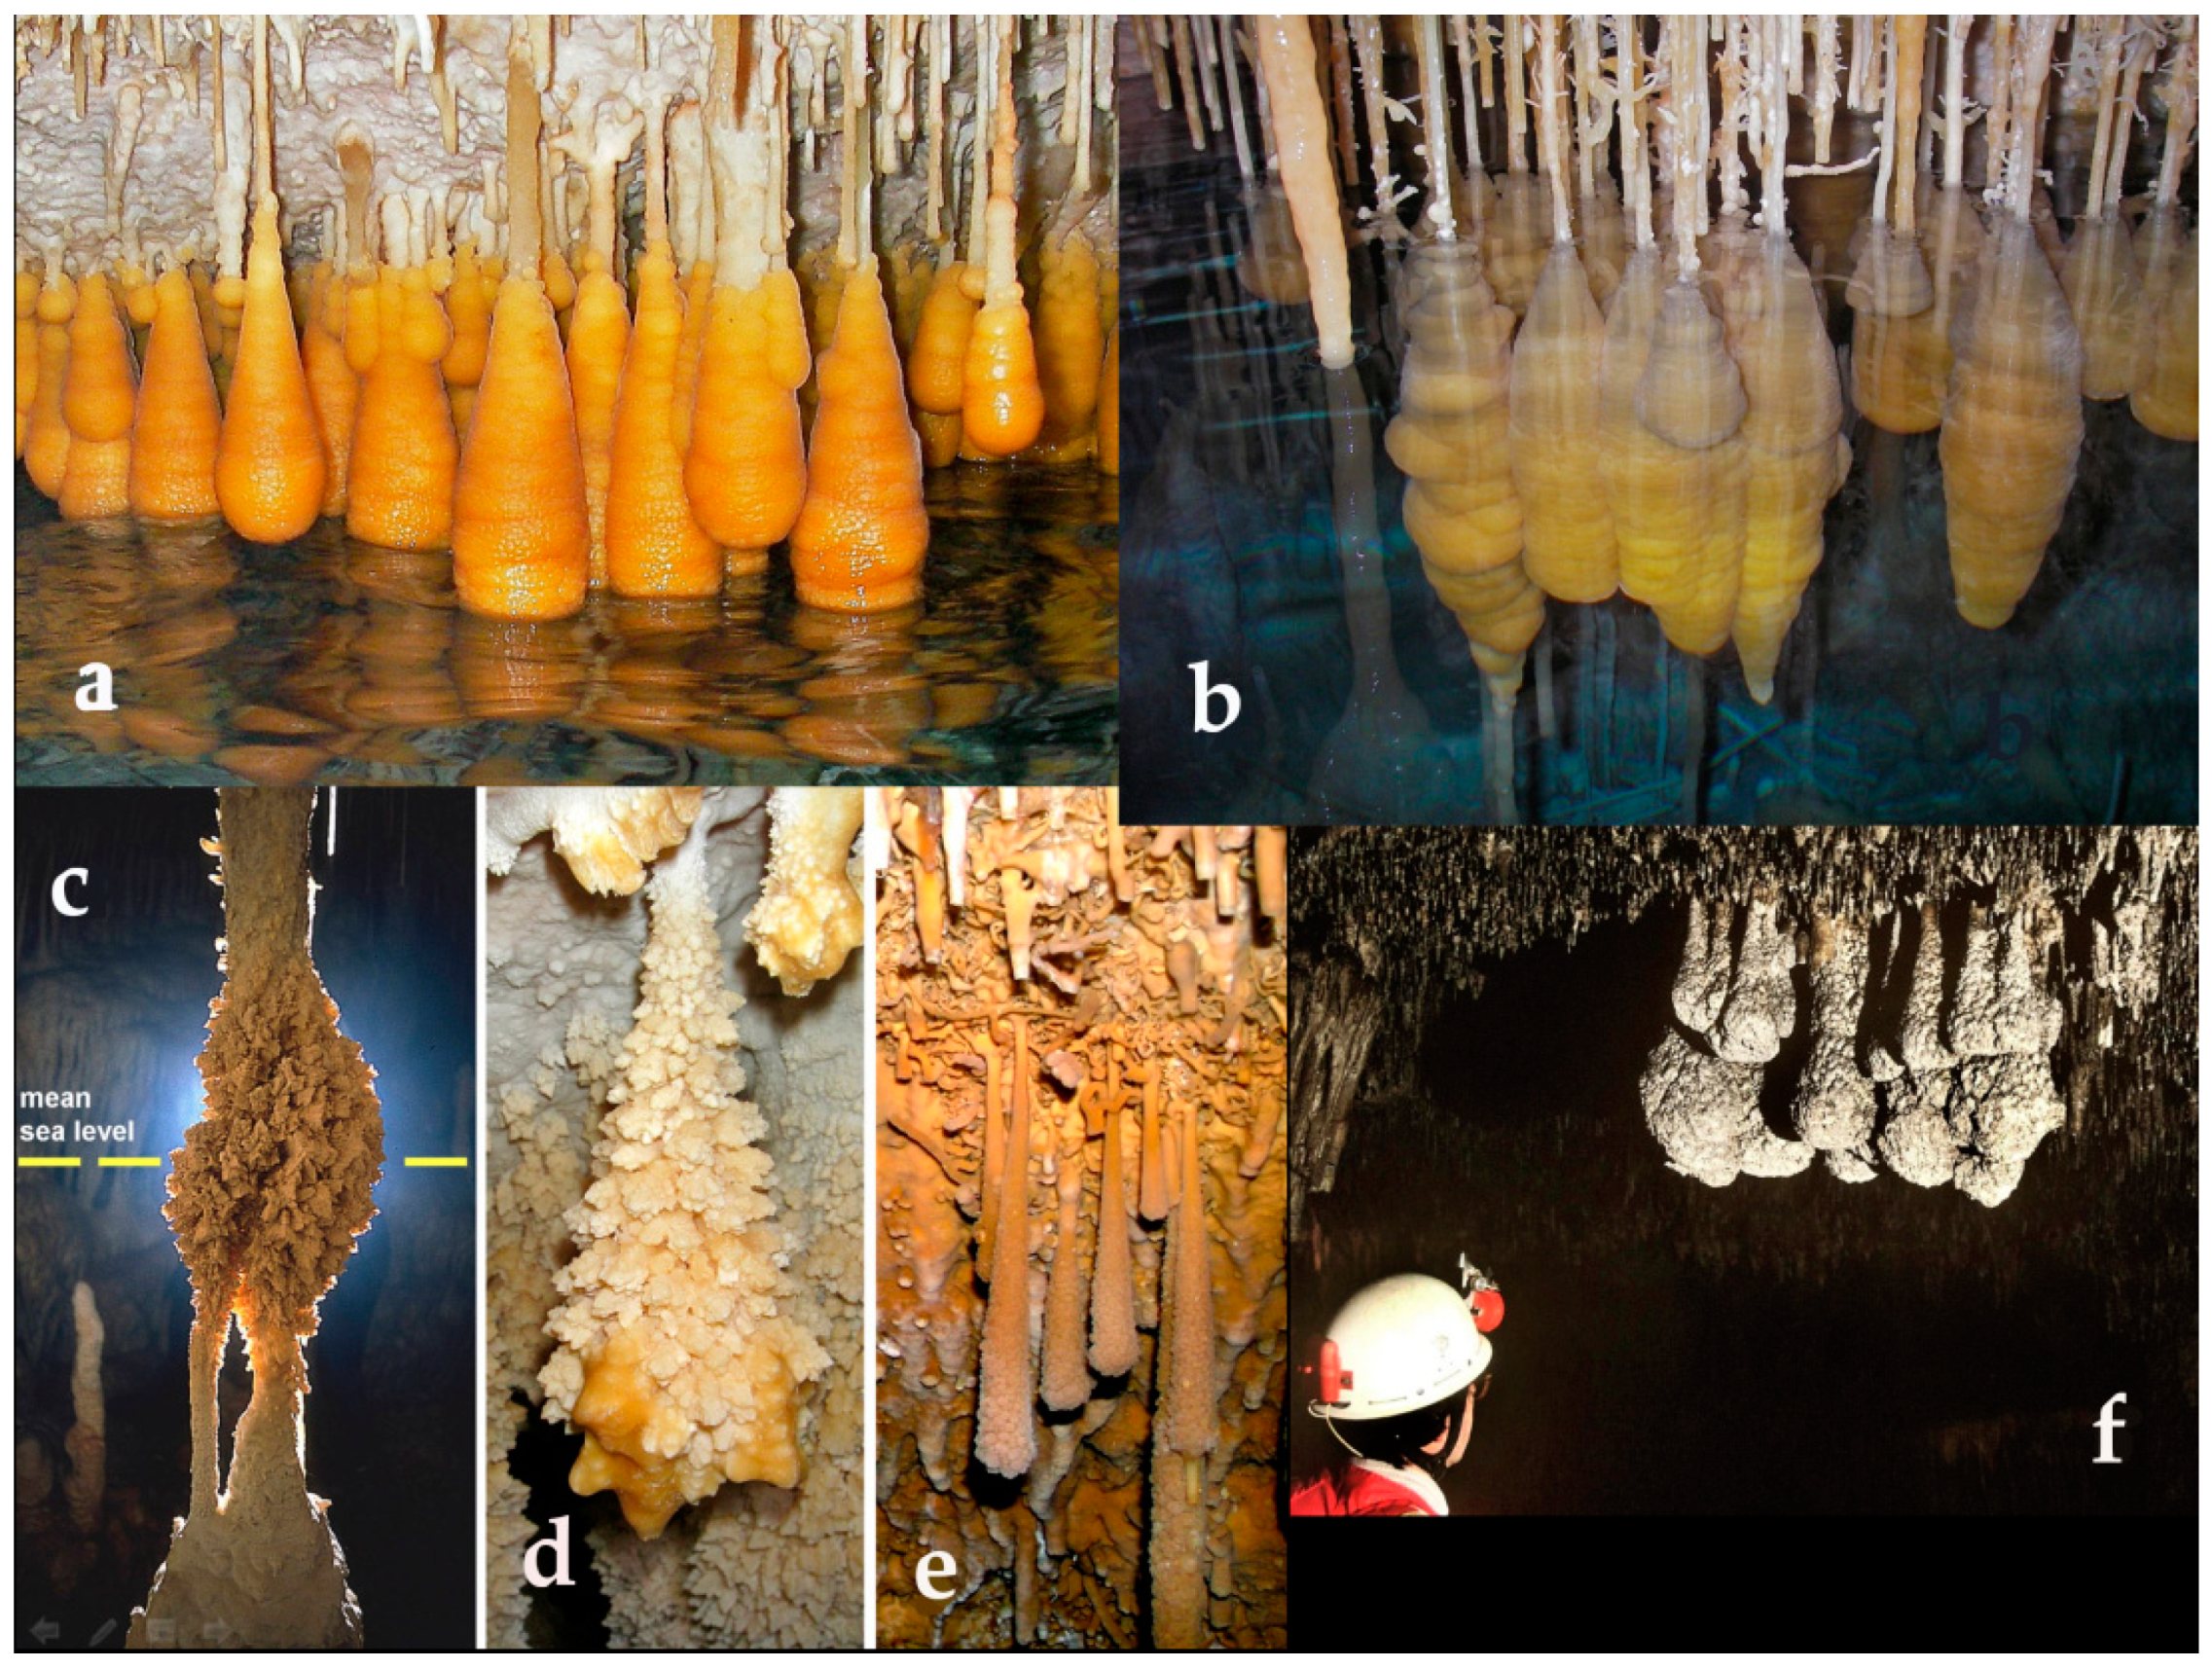
  • A carbonate encrustation, called phreatic overgrowth on a speleothem (POS), can precipitate inorganically around stalagmites or stalactites upon contact with the water table, in a brackish environment. These secondary deposition structures usually exhibit a morphology similar to an oval ball, with the size varying in response to the local tide range [4,9,27,28,29], Figure A1.
Among the most important findings of speleothems retrieved from flooded marine caves worldwide and often showing hiatuses or marine overgrowth, special attention deserves to be paid to the submerged cave deposits from the Bahamas [1,10,30], Bermuda [31], the Yucatan Peninsula [32,33], and Cuba [34]. Ref. [35] provides an exhaustive review on the use of sea level indicators preserved in coastal caves, including speleothems and cave sedimentary deposits.
The measured elevations of speleothems are affected by the local response to glacial and hydro-isostatic adjustment (GIA), and thus might significantly deviate from the global eustatic signal. The contribution of GIA to local relative sea level (RSL) changes is primarily a function of the distance with respect to the ice sheets. The closer one is to the ice sheets, the larger the deviation from the global mean (i.e., the eustatic sea level change). In near-field, ice-proximal settings, the RSL signal is opposite in sign (i.e., trend) and can be 1–2 orders of magnitude larger than the eustatic signal. In these areas, the ice sheet configurations (i.e., areal ice thickness variation) and the spatial patterns of retreat and advance are the dominant factors. The Mediterranean Sea is at an intermediate distance with respect to the ice loading centers/margins, and the northern coastlines are likely to be directly affected by the ice-loading term of the Eurasian ice sheets. However, GIA is strongly modulated by the solid Earth rheological behavior, which can cause large deviations from the eustatic signal, even in far-field regions. Here, in fact, the relevant Earth rheological parameters can enhance the solid Earth response to the water-loading term (counterpart of the ice-loading term). Therefore, the shape and size of the ocean basins become important.
Previous studies have shown that GIA-related vertical motions might have affected the elevations of speleothems [5,36,37]. Different sites (the Bahamas, Bermuda, Mexico, Cuba, and the Mediterranean Sea) show distinct relative sea level responses to glacio- and hydro-isostatic adjustment as a function of the relative distances to the continental ice sheets during MIS 2.
However, the maximum vertical variability of the MIS 5.5 maximum sea level highstand predicted by GIA models in the Mediterranean Sea [36,38] is 2–3 m. Models were tested on a field by MIS 5.5 coastal fossil deposits and fossil tidal notches. This variability largely depends on the mantle viscosity profile and the retreat pattern of the MIS 6 ice sheets. So far, no GIA models have been published for MIS 7 or MIS 5.1 and 5.3 in the Mediterranean Sea. GIA results for MIS 5.1 and 5.3 along a transect between Barbados and Northern Florida have been published by [39]. The Bahamas flowstone is in a far-field position w.r.t. north American ice sheets and should be comparable to the Mediterranean sites (see Figure A2).
The number of speleothem studies for sea level reconstructions significantly increased after the 80s, when the development of mass spectrometric techniques for the measurement of uranium and thorium isotopes led to increases in the typical precision and accuracy of U-series ages compared to alpha-counting measurements and reduced sample size requirements [40,41]. Speleothems can usually provide more reliable records than, for instance, shallow-water corals, given that their dense calcitic or aragonitic structure is less susceptible to post-depositional alteration, significantly reducing the isotope exchange with the surrounding environment.
Isotope-dilution mass spectrometry for submerged speleothem dating was first applied by [1,11] on a flowstone (DWBAH) recovered 15 m below the present sea level of Grand Bahama Island, which contains five hiatuses (Figure A3), and provided a record of the sea level over the past 280 kyr. These studies reconstructed one of the first sea level change curves which, together with the pioneering works by [42,43] on fossil corals, has considerably contributed to knowledge in the field of sea level change.
Similarly, the use of thermal ionization mass spectrometry (TIMS) and multi-collector inductively coupled plasma mass spectrometry (MC-ICPMS) for the precise U-Th dating of Mediterranean speleothems has greatly improved our understanding of former sea level changes.
In addition to U-Th dating, vadose stalagmites and stalactites and POS can also be dated by 14C. However, the radiocarbon ages can be affected by the “dead carbon proportion” (DCP), which is the percentage of dead carbon incorporated in the speleothem or POS at the time of formation. The DCP is mainly the fraction of carbon within the calcium carbonate that is derived from equilibration with the soil CO2 and the radiocarbon-free “dead carbon” from the bedrock [44]. High DCP values (e.g., >20%), resulting from a stronger water–soil–rock interaction of the precipitating water, overestimate the radiocarbon ages and cause a large 14C-U-Th age offset. In a recent study, [45] reported combined 14C and U-Th measurements on vadose stalactites and POS from Mallorca and showed that the use of radiocarbon dating can be problematic when DCP values are high. Here, we provide a thorough review on the use of Mediterranean submerged speleothems to reconstruct past sea level variations, reporting literature and new data from samples retrieved in the western and central Mediterranean Sea, including the Balearic Islands, Croatia, Malta, and Italy (Figure 1).

2. Materials and Methods

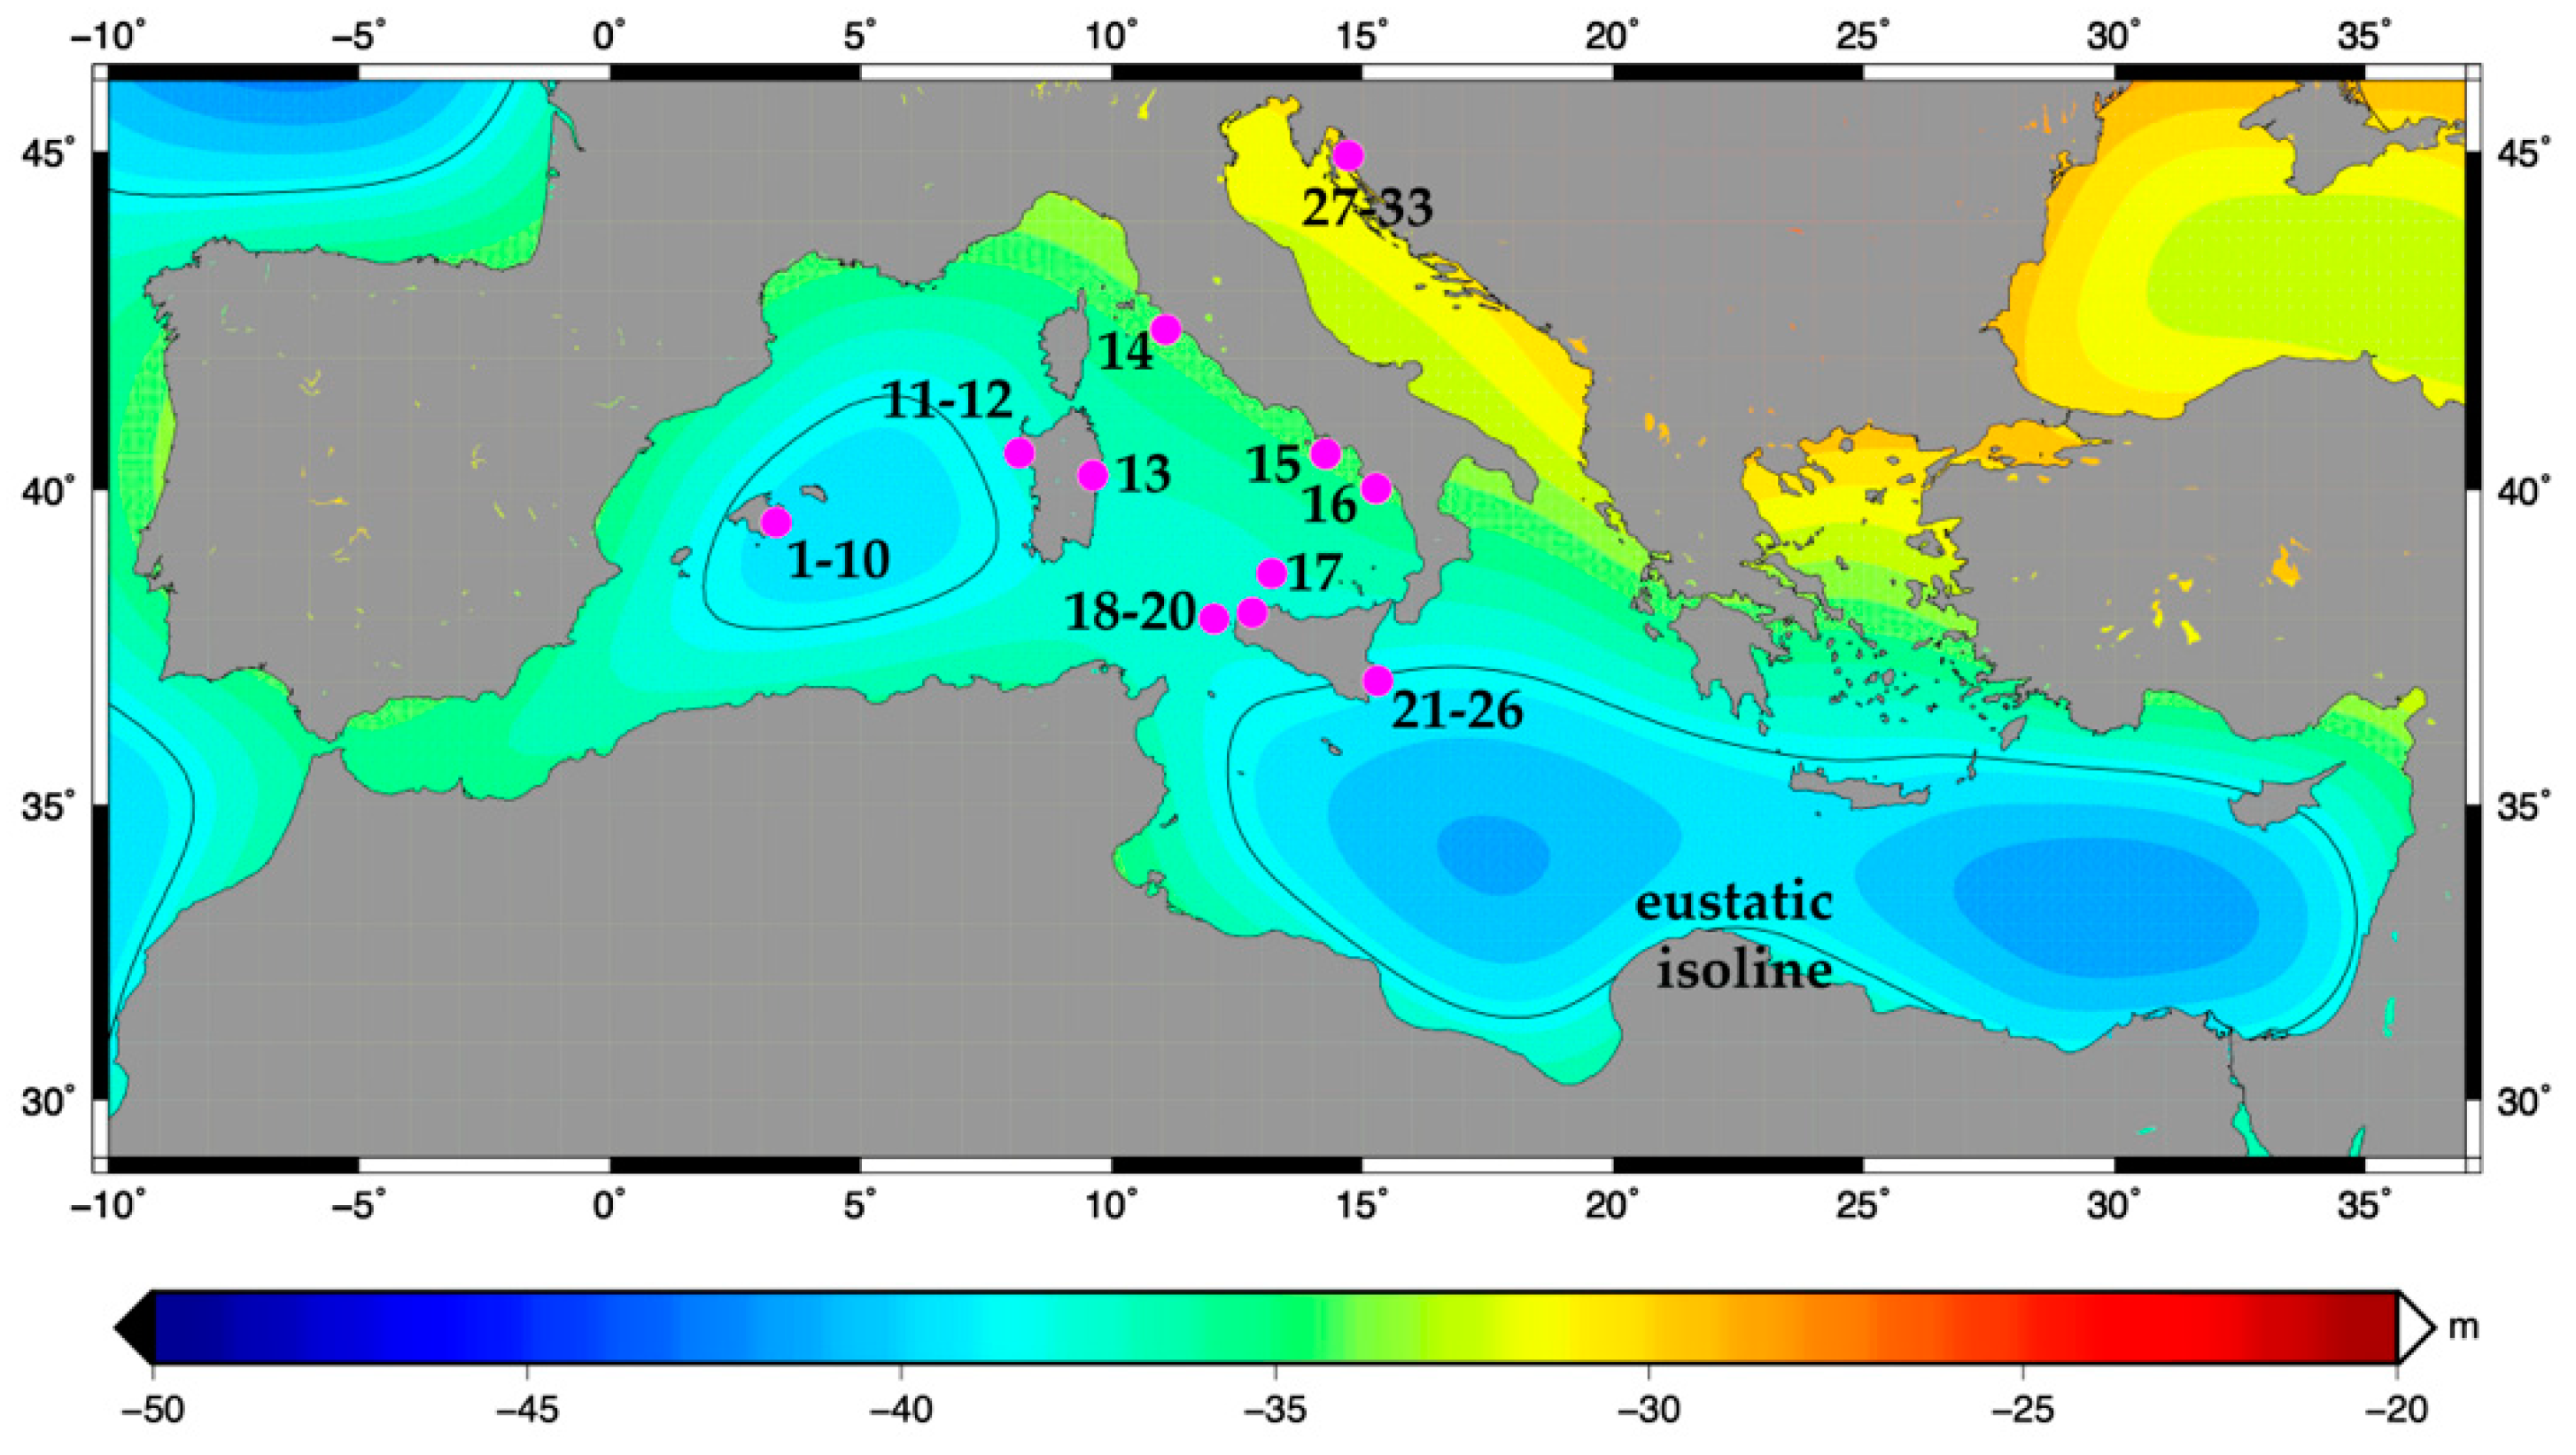
2.1. General Overview of the Mediterranean Region

The Mediterranean Sea (MS) is a marine basin largely bordered by land that covers an area of about 2.5 million km2. Its geographical features have been comprehensively reviewed by [46]. The coastline extends for about 46,000 km and approximately half of this is rocky, with plunging cliffs, sloping coasts, screes, and shore platforms [47]. The Mediterranean Sea can be divided into the Western and Eastern Mediterranean along an imaginary axis between the Strait of Sicily and Tunisia, but a large amount of scientific literature also identifies it as an undefined “central Mediterranean area” [48,49,50].
The MS is situated at the boundary between the subtropical and mid-latitude zones and its climate is characterized by warm and dry summers and mild and rainy winters [51]. It is a semi-enclosed and highly evaporative basin that is connected to the Atlantic Ocean through the Strait of Gibraltar (at a Camarilla sill depth of 284 m) and with the Black Sea through the Strait of Dardanelles (sill depth of ~65 m) and the Bosphorus Strait (sill depth of ~42 m). The Atlantic water that enters the Mediterranean Sea spreads throughout the entire basin and participates in the formation of intermediate and deep waters that contribute to the Mediterranean thermohaline circulation [52].
Tides vary from place to place along the coasts of the Mediterranean, depending on several parameters, such as the coastal geometry and bathymetry. In general, the Mediterranean is characterized by tides with lower amplitudes compared to other oceanic basins. The average tidal amplitude is about 40 cm, with the exception of the remarkably large tides observed in the Gulf of Gabes (Tunisia) and in parts of the North Adriatic Sea, where they may reach amplitudes of up to 1.80 m. In other areas, such as in Greece or Sicily, tides are very small, especially near the amphidromic points, where the tidal range is almost non-existent. At the Strait of Gibraltar, the tide increases to 1.5 m due to the influence of the Atlantic Ocean, but it quickly decreases eastwards. Weather conditions can significantly reduce or amplify the tidal amplitude, with variations of up to 1 m.

2.2. Numerical Modeling of Glacial-Isostatic Adjustment (GIA)

We can compute the ice-driven, GIA-modulated RSL curves by solving the gravitationally self-consistent Sea Level Equation, hereafter called SLE [38,53,54]. The SLE is a linear equation that yields, for any variation of land-based (i.e., grounded) ice thickness, the time- and space-dependent vertical deformation of the mean sea surface and solid surface of the Earth, with the difference between the two being the relative sea level (RSL) change.
By neglecting gravity and solid Earth deformations, and by assuming that the continents are bounded by infinite vertical walls, the solution of the SLE for a prescribed ice mass variation yields the eustatic sea level change, i.e., the change of ice sheet volume (or mass) as meters of equivalent sea level. This solution is straightforward and directly depends on the ice mass change and conversely, on the (constant) ocean area. Furthermore, it does not depend on the geographical location, implying that each location in ocean areas experiences the same amount and sign of sea level change. Accordingly, the local RSL changes are equal to the global eustatic sea level change when deformations and gravity are neglected.
By including gravity, the SLE becomes gravitationally self-consistent and its solution is spatially varying, mostly depending on the distance from the changing ice masses [55]. Self-gravitation, in fact, allows for deviations from the eustatic signal that increase towards the changing ice masses, where the sea level change switches sign with respect to the eustatic signal. Therefore, any ice mass increase, or drop, would result, respectively, in a local sea level rise, or drop, in the proximity of an ice sheet.
Any net surface ice mass gain, or loss, is instantaneously accompanied, respectively, by an increase, or decrease, of the mutual gravitational pull between ice and ocean water mass. The latter is free to move and its surface is an equipotential surface of gravity: The gravity vector is always perpendicular to the mean sea surface. Accordingly, an increase in the ice mass acts as a positive density anomaly, which in turn deflects the gravity vector towards the ice mass, causing a local sea level rise. Because mass must be conserved, the sea level drop in the far field is larger than the eustatic signal, and the average over the oceans of the sea level change is equal to the eustatic signal. Therefore, the local RSL changes are equal to the local changes of the mean sea surface.
The complexity and realism of the SLE increase by including solid Earth deformations in response to surface ice- and water-loading changes. Accordingly, the RSL changes also stem from the vertical motions of the Earth’s solid surface and therefore depend on the relevant rheological parameters of Earth. Earth exhibits a dual rheological behavior with respect to surface load changes: (i) Solid elastic deformation (solid behavior), which is instantaneous (i.e., time-independent) and a linear function of the surface load, and (ii) viscous flow (fluid behavior), which linearly depends on the surface load, on the viscosity, and therefore on the amount of time since the activation of the load (i.e., load change). Therefore, a commonly used model for GIA simulations is the linear Maxwell viscoelastic model, where an elastic component (spring) is combined in series with a viscous element (dashpot). This allows for the calculation of both the immediate (elastic) and delayed (viscous) deformations that decay exponentially over time as a function of viscosity and provided that gravity is the restoring force that tends to restore the isostatic equilibrium. Solid Earth deformations increase the regional variability of RSL changes, but the average over ocean areas remains equal to the eustatic signal (mass conservation).
Solving the gravitationally self-consistent SLE for a deformable Earth model that is characterized by a linear Maxwell viscoelastic rheology implies that, for each point on the surface of the Earth, the predicted RSL change at a specific time depends on all the changes in ice and water thickness (ice and water loading terms) that have occurred everywhere and since the beginning of the chronology. Because the variations of water thickness are the actual RSL changes that one aims to compute, the SLE is integral in its nature. Therefore, a solution can only be obtained through an iterative procedure. Initially, the SLE is solved under eustatic approximation and the uniform but time-dependent water loading term is computed over time. This is then loaded over the ocean areas to retrieve the combined hydro- and glacio-isostatic contributions to water height variations (RSL changes) over the ocean areas. Again, this is loaded on the ocean areas during the next iterative step. The solution converges rather quickly and three to four iterative steps are usually required for the gravitationally self-consistent solution. The latter complies with the requirements of mass conservation and equal gravitational potential for the sea surface.
Here we use the latest, up-to-date version of the open source model SELEN [38,54], which solves the SLE by means of the pseudo-spectral method. The latter implies a discretization of all the variables through spherical harmonics expansion. We include the rotational feedbacks, as well as the form treatment of the time-dependent ocean function (i.e., variable coastlines).
The first component required by SELEN is the Earth rheological model. We assume a self-gravitating, rotating, spherically symmetric, radially stratified, and deformable but not compressible Earth model. The latter is one-dimensional and all the relevant rheological parameters only depend on the Earth’s radius. Accordingly, lateral heterogeneities are not accounted for. The outer shell of the model is perfectly elastic and represents the lithosphere. Between the lithosphere and the inviscid core is the mantle, which is characterized by linear Maxwell viscoelastic rheology. The mantle can be discretized into a number of layers.
First, we discretize the VM2 mantle viscosity profile [56] over a four-layer model, where the upper mantle (UM), the lower upper mantle (LUM), the transition zone (TZ), and the lower mantle (LM) are characterized by a Maxwell viscoelastic rheology and laterally uniform viscosity (see Table 1). We combine this with a lithosphere thickness of 90 km. We use this as a reference model to be combined with three ice sheet chronologies.
We also employ a three-layer model (UM, TZ, and LM) and test three mantle viscosity profiles (MVP 1–3), each combined with a lithosphere thickness of 100 km (Table 2). The viscosity gradient of viscosity as a function of the Earth’s radius increases by one order of magnitude from MVP1 to MVP3.
Here, we focus on the vertical gradient of viscosity and on the role of the LM viscosity, rather than on the role of the lithosphere thickness. In fact, it was shown by [57] that the LM viscosity is the prime mover of the GIA-modulated RSL changes in the Mediterranean Sea, mostly because of the extent of the water load term. In fact, the latter is much larger than the thickness of the lithosphere, and therefore, is sensitive to the viscosity values at deeper positions in the mantle.
We employ the following ice sheet models:
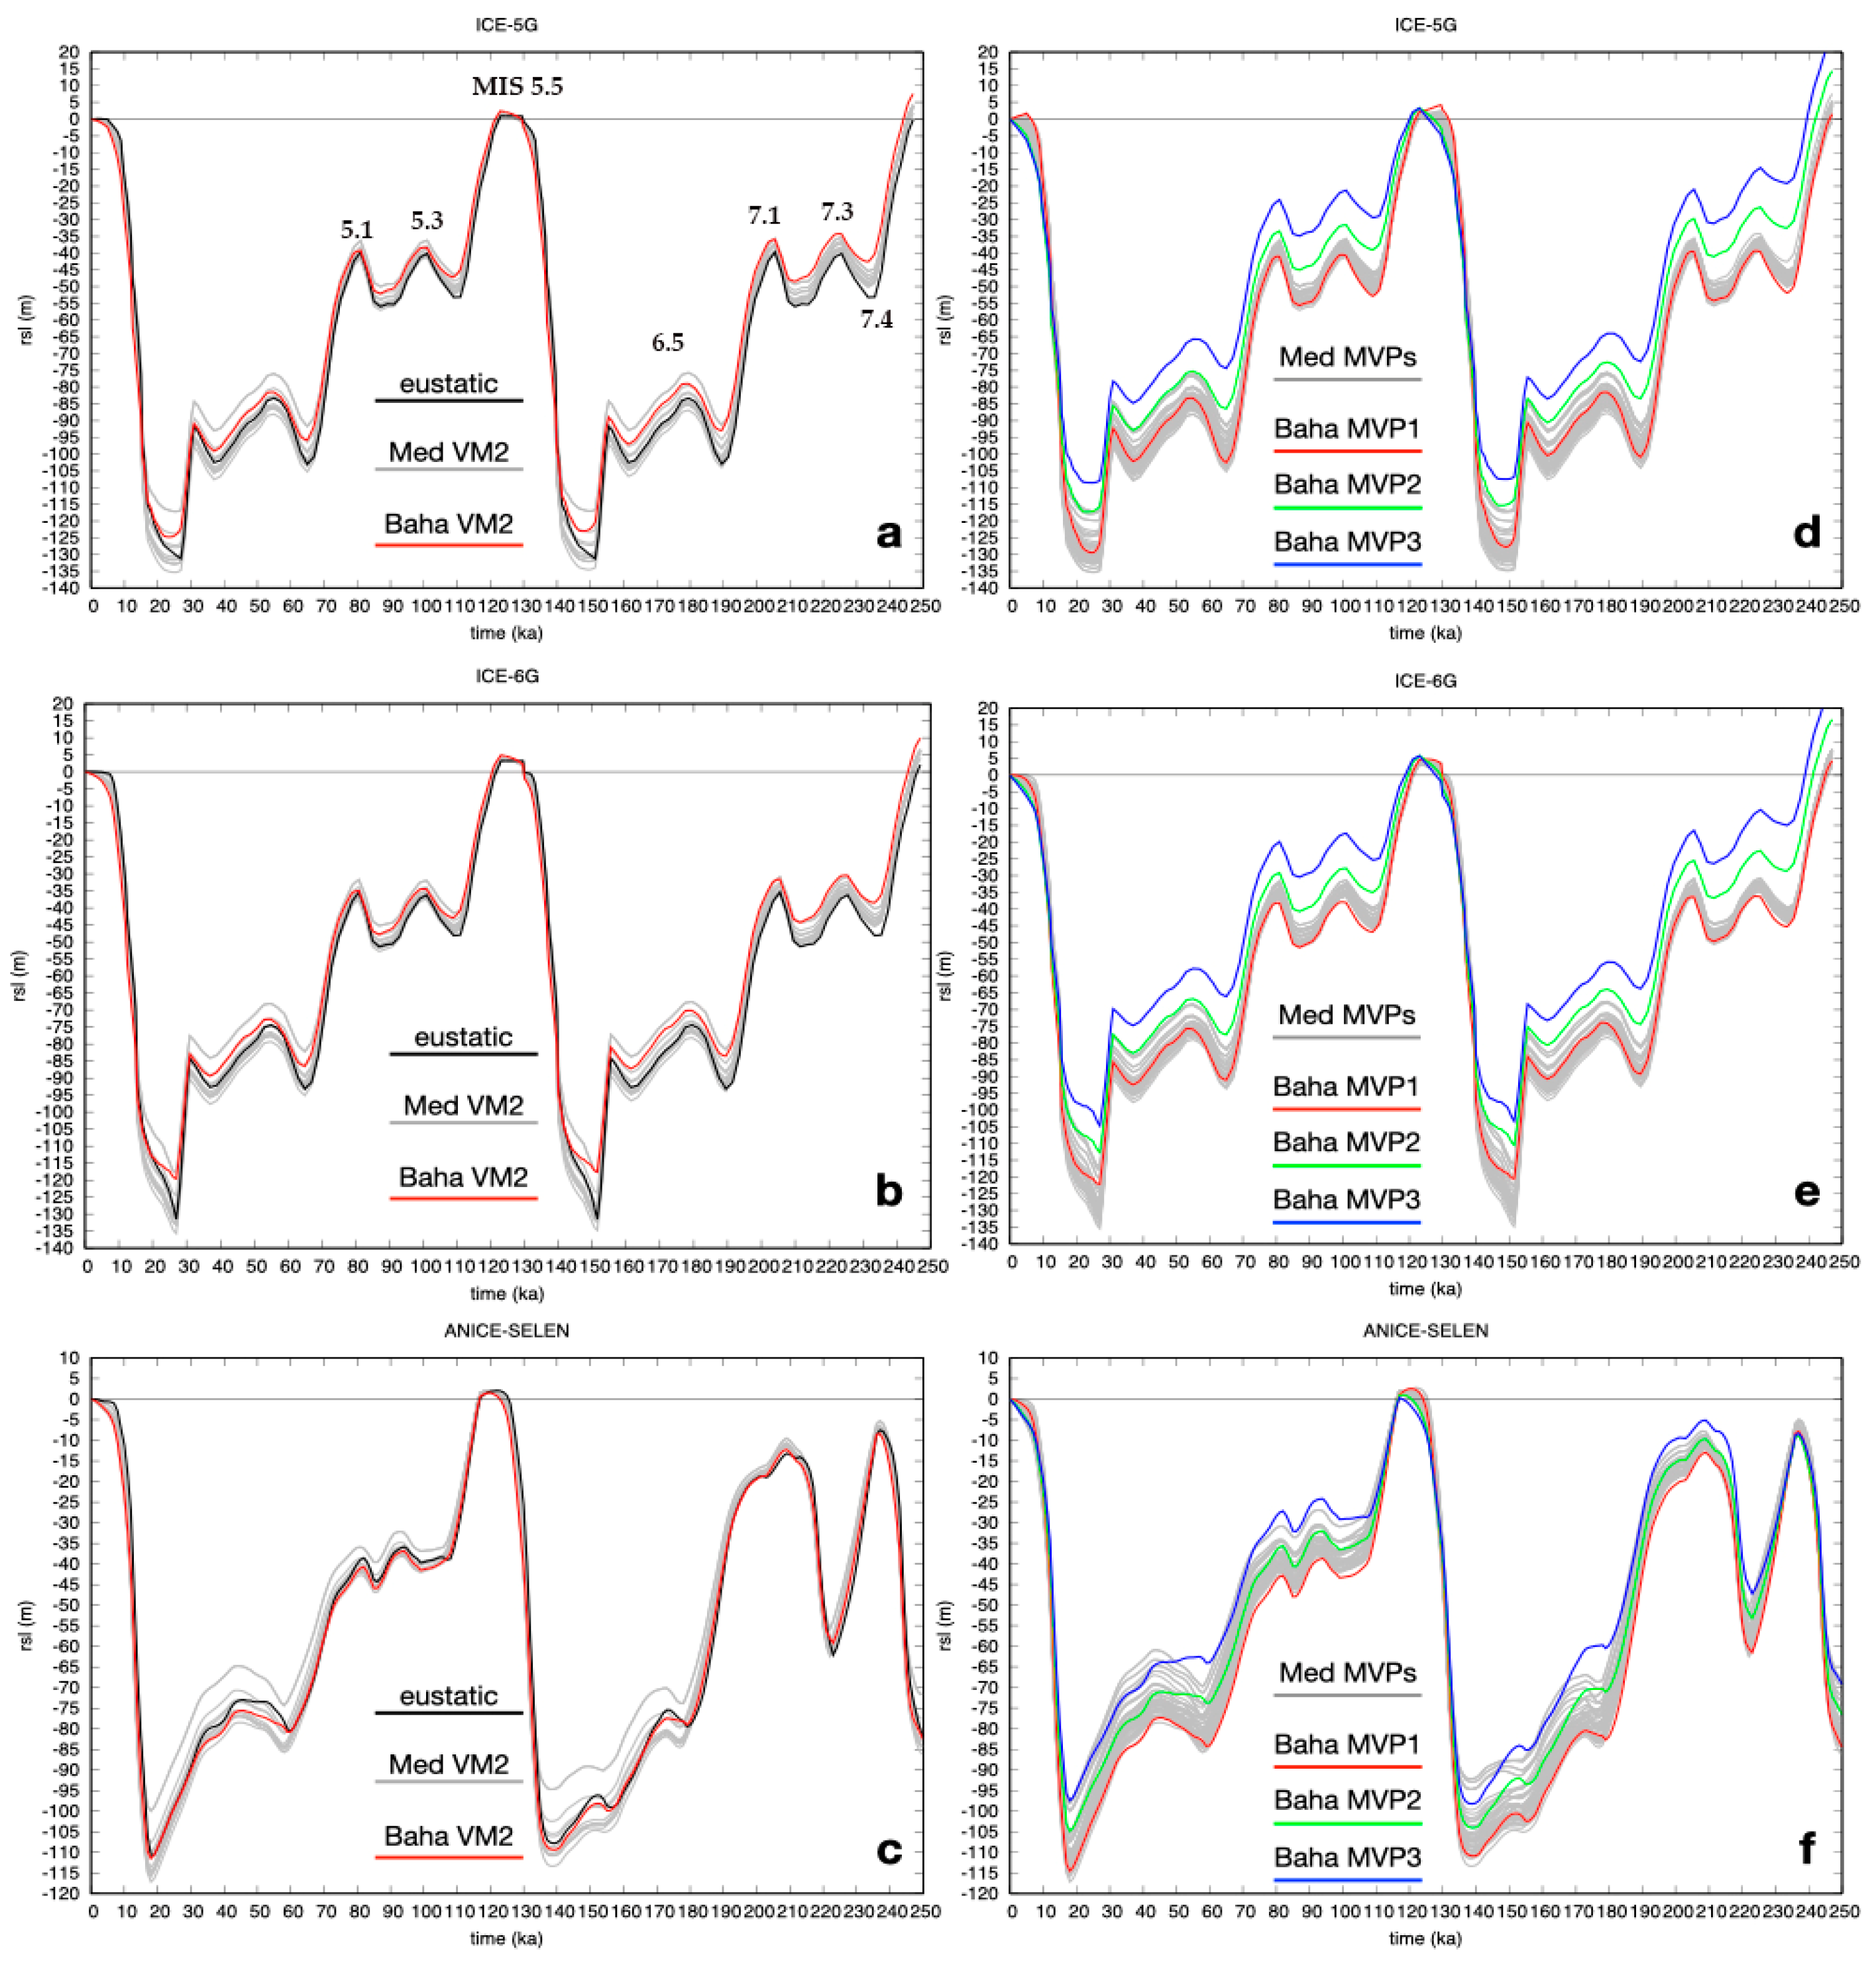
  • ICE-5G [56]: This global model describes the ice-sheet thickness variations over North America, Eurasia, Greenland, and Antarctica during the last 123 ka. The ice sheet evolution between 123 and 26 ka is tuned to the δ18O curve by [58] and lacks any glaciological and geological constraints. Between 26 ka and the present day, ICE-5G is constrained by glaciological, geological, and modern geodetical observations from remote sensing [56]. Here, we combine two ICE-5G chronologies over time in order to cover the time span under consideration and evaluate the GIA-modulated RSL response to the melting of the MIS 6 ice sheets during MIS 5e. The latter is characterized by a ~0.9 m eustatic sea level highstand above present-day msl between 129.5 and 123 ka, mostly coming from a reduced (with respect to the present day) Greenland Ice Sheet;
  • ICE-6G [59]: This model follows from an improvement of the ICE-5G. Here, we apply the same repetition in a series of ICE-5G. According to the ICE-6G, the maximum MIS 5.5 eustatic highstand between 129 and 123 ka is ~3.1 m above present-day msl as a consequence of reduced Greenland and West Antarctic Ice Sheets;
  • ANICE-SELEN [38,60,61]: This global chronology model is the result of an inverse forward modeling procedure, where the δ18O stack [58] is decoupled into the global ice sheet volume and deep-water temperature. For this purpose, 3D thermomechanical ice-sheet models for North America, Eurasia, Greenland, and Antarctica are dynamically coupled to SELEN, in order to include all the GIA feedback. ANICE-SELEN is not constrained by geological or instrumental data. Here, we use the original ANICE-SELEN chronology, which is characterized by a ~2.5 m eustatic highstand during MIS 5 e (125–117 ka), in response to a reduced Greenland Ice Sheet volume.

2.3. Speleothem Samples

The Mediterranean speleothems reported in this study were collected in coastal caves of the Balearic Islands and along the Croatian, Maltese, and Italian coasts (Figure 1; Table 1). The Italian samples were retrieved between 1990 and 2007, at water depths ranging between −0.3 and −48 m. The depth was determined with a digital depth gauge (typical error of ±0.1 m). The depth has not been corrected for tidal data, which means that the elevation error of the studied speleothems is at least ±30 cm (i.e., the sum of the instrument uncertainty and the Mediterranean tidal mean of ±20 cm [50]). It is worth noting that the error associated with the vertical position of the Mediterranean submerged speleothems is lower than for the samples retrieved from other oceanic basins due to the microtidal regime of the Mediterranean. Samples were measured and collected by sawing through the base of the speleothems. For further information regarding the cave morphology, sampling method, date of sampling, and error associated with the radiocarbon and U-Th ages, the reader should refer to the original articles [1,2,3,4,5,6,11,19,21,22,23,24,25,26,28,29,62,63,64,65,66].

2.4. New Stalactite from Palinuro, Italy

A ~10 cm stalagmite was collected in a fossil tidal notch along the carbonate coast of the Palinuro promontory in the Campania region (South Italy) at 2.1 m above the sea level. A variety of living organisms, including the crustose coralline algae Lithophyllum, the acorn barnacle Chthamalus, and the limpet Patella, were observed below the tidal notch, exposed to strong wave conditions. The external surface of the speleothem was completely covered by a blackish patina that is likely the result of the precipitation of Fe-Mn oxides that occurred when the rising sea level approached the speleothem (Figure 2d,g). The top portion of the stalagmite is encrusted by a marine overgrowth that consists of several specimens of the barnacle Chthamalus stellatus, which typically lives in the intertidal zone on high energy rocky shores and can be found above the highest tidal level [67].

2.5. 14C and U-Series Dating of the Stalactite from Palinuro

Three carbonate fragments were sub-sampled from the upper portion of the stalagmite from Palinuro (Figure 2d,g,h) and prepared for radiometric dating. In particular, sub-sample 1 (Palinuro-1) was collected within the marine overgrowth (barnacle) and analysed for AMS−14C. The fragment was carefully cleaned using a small diamond blade to remove any visible speleothem calcite and only retrieve the encrusted overgrowth. The sample was further processed and analysed for 14C at the Center of Applied Physics, Dating and Diagnostics (CEDAD) Laboratory of the University of Salento, Italy, using an Accelerator Mass Spectrometer (AMS). The radiocarbon age was converted to calendar years (cal. yr BP, BP = AD 1950) using the IntCal20 calibration curve [68] and the Calib 7.10 program [69]. The ages of the other two sub-samples (Palinuro-2 and Palinuro-3) were determined through the U-series dating method at the Laboratoire des Sciences du Climat et de l’Environnement (LSCE) at Gif-sur-Yvette, France. The samples were first leached with 0.1 M HCl and then dissolved with diluted HCl and equilibrated with a mixed 236U-233U-229Th spike. The uranium and thorium fractions were separated using UTEVA resin (Eichrom Technologies, USA) and analysed using a ThermoScientific NeptunePlus multi-collector inductively coupled plasma-mass spectrometer, following the protocol developed at LSCE [70]. The 230Th/U ages were calculated from measured atomic ratios through iterative age estimation [71], using the 230Th, 234U, and 238U decay constants of [72,73]. The ages were corrected for the non-radiogenic detrital 230Th fraction using an initial 230Th/232Th activity ratio of 0.85 ± 0.36, which corresponds to the mean upper crust value [74].
The U-Th ages of the DWBAH flowstone reported in [11] have been re-calculated using the most recent 230Th, 234U, and 238U decay constants of [72,73] and corrected for the detrital 230Th fraction using an initial 230Th/232Th activity ratio of 0.8 ± 0.8 [74] (Table A1), as suggested by [75] for the speleothems from the Bahamas. The difference between the original U-Th ages [11] and the re-calculated and corrected ages is minimal (<3.5 kyr for ages younger than 270 kyr).

3. Results

Table 3 and Table 4 report the relevant details of the sampling locations and the published U-Th and 14C ages of the vadose speleothems, POS, and marine biogenic overgrowths used for the present review. In particular, Table 3 summarizes the main results of all the studies dealing with submerged Mediterranean speleothems, which were published between 1992 and 2020: 33 caves (Figure 1, Table 3) carved on carbonate lithology that preserved vadose speleothems, POS, and marine biogenic overgrowth that were used to reconstruct former sea level variations. An essential condition for the conservation of submerged speleothems is that the cave’s entrance must be small in size so that the energy of the waves can be almost completely attenuated.
On the Adriatic coasts of Croatia, speleothems from seven submerged caves distributed along ~300 km of coast (Figure 1 and Figure 3a) were sampled and dated by 14C and U-Th [3,23,66]. Their ages range between 7 and 217 kyr (MIS 1 and MIS 7), and the results are summarized in [25].
Since 1974, a pool of Spanish and international speleologists and geologists have investigated vadose speleothems and POS collected from nine different caves located along the southern coast of Mallorca in the western Mediterranean (Figure 4). The phreatic speleothems were retrieved at 1.2 and 5.8 m above the present sea level and their ages vary between 1 and 231.9 kyr [4,5,27,28,45,62,76]. The main results are reported and discussed in two important studies: [4] focuses on POS sampled in five different caves at 1.2 to 1.5 m, which precipitated within a very narrow temporal range, from 81.95 ± 0.56 to 80.43 ± 0.48 kyr, whilst [5] reports the U-Th ages of 11 POS from eight caves that enabled the relative sea level changes between 126.6 ± 0.4 and 116 ± 0.8 kyr to be reconstructed.
In Italy, the first speleothems sampled for sea level studies were retrieved from 15 submerged caves in the Tyrrhenian Sea (Figure 1 and Figure 5) between 1992 and 1994 [19,63]. Between 2002 and 2017, a couple of studies on speleothems from the Argentarola and Custonaci caves, characterized by an alternation of continental layers, hiatuses, and encrusting marine organisms allowed the sea level change during MIS 7 [2] and the Middle Pleistocene Transition [6] to be constrained.
Finally, a submerged speleothem was sampled at −14.5 m on the southwestern coast of Malta and dated by radiocarbon. The results showed that Malta remained tectonically stable during the Holocene [65].

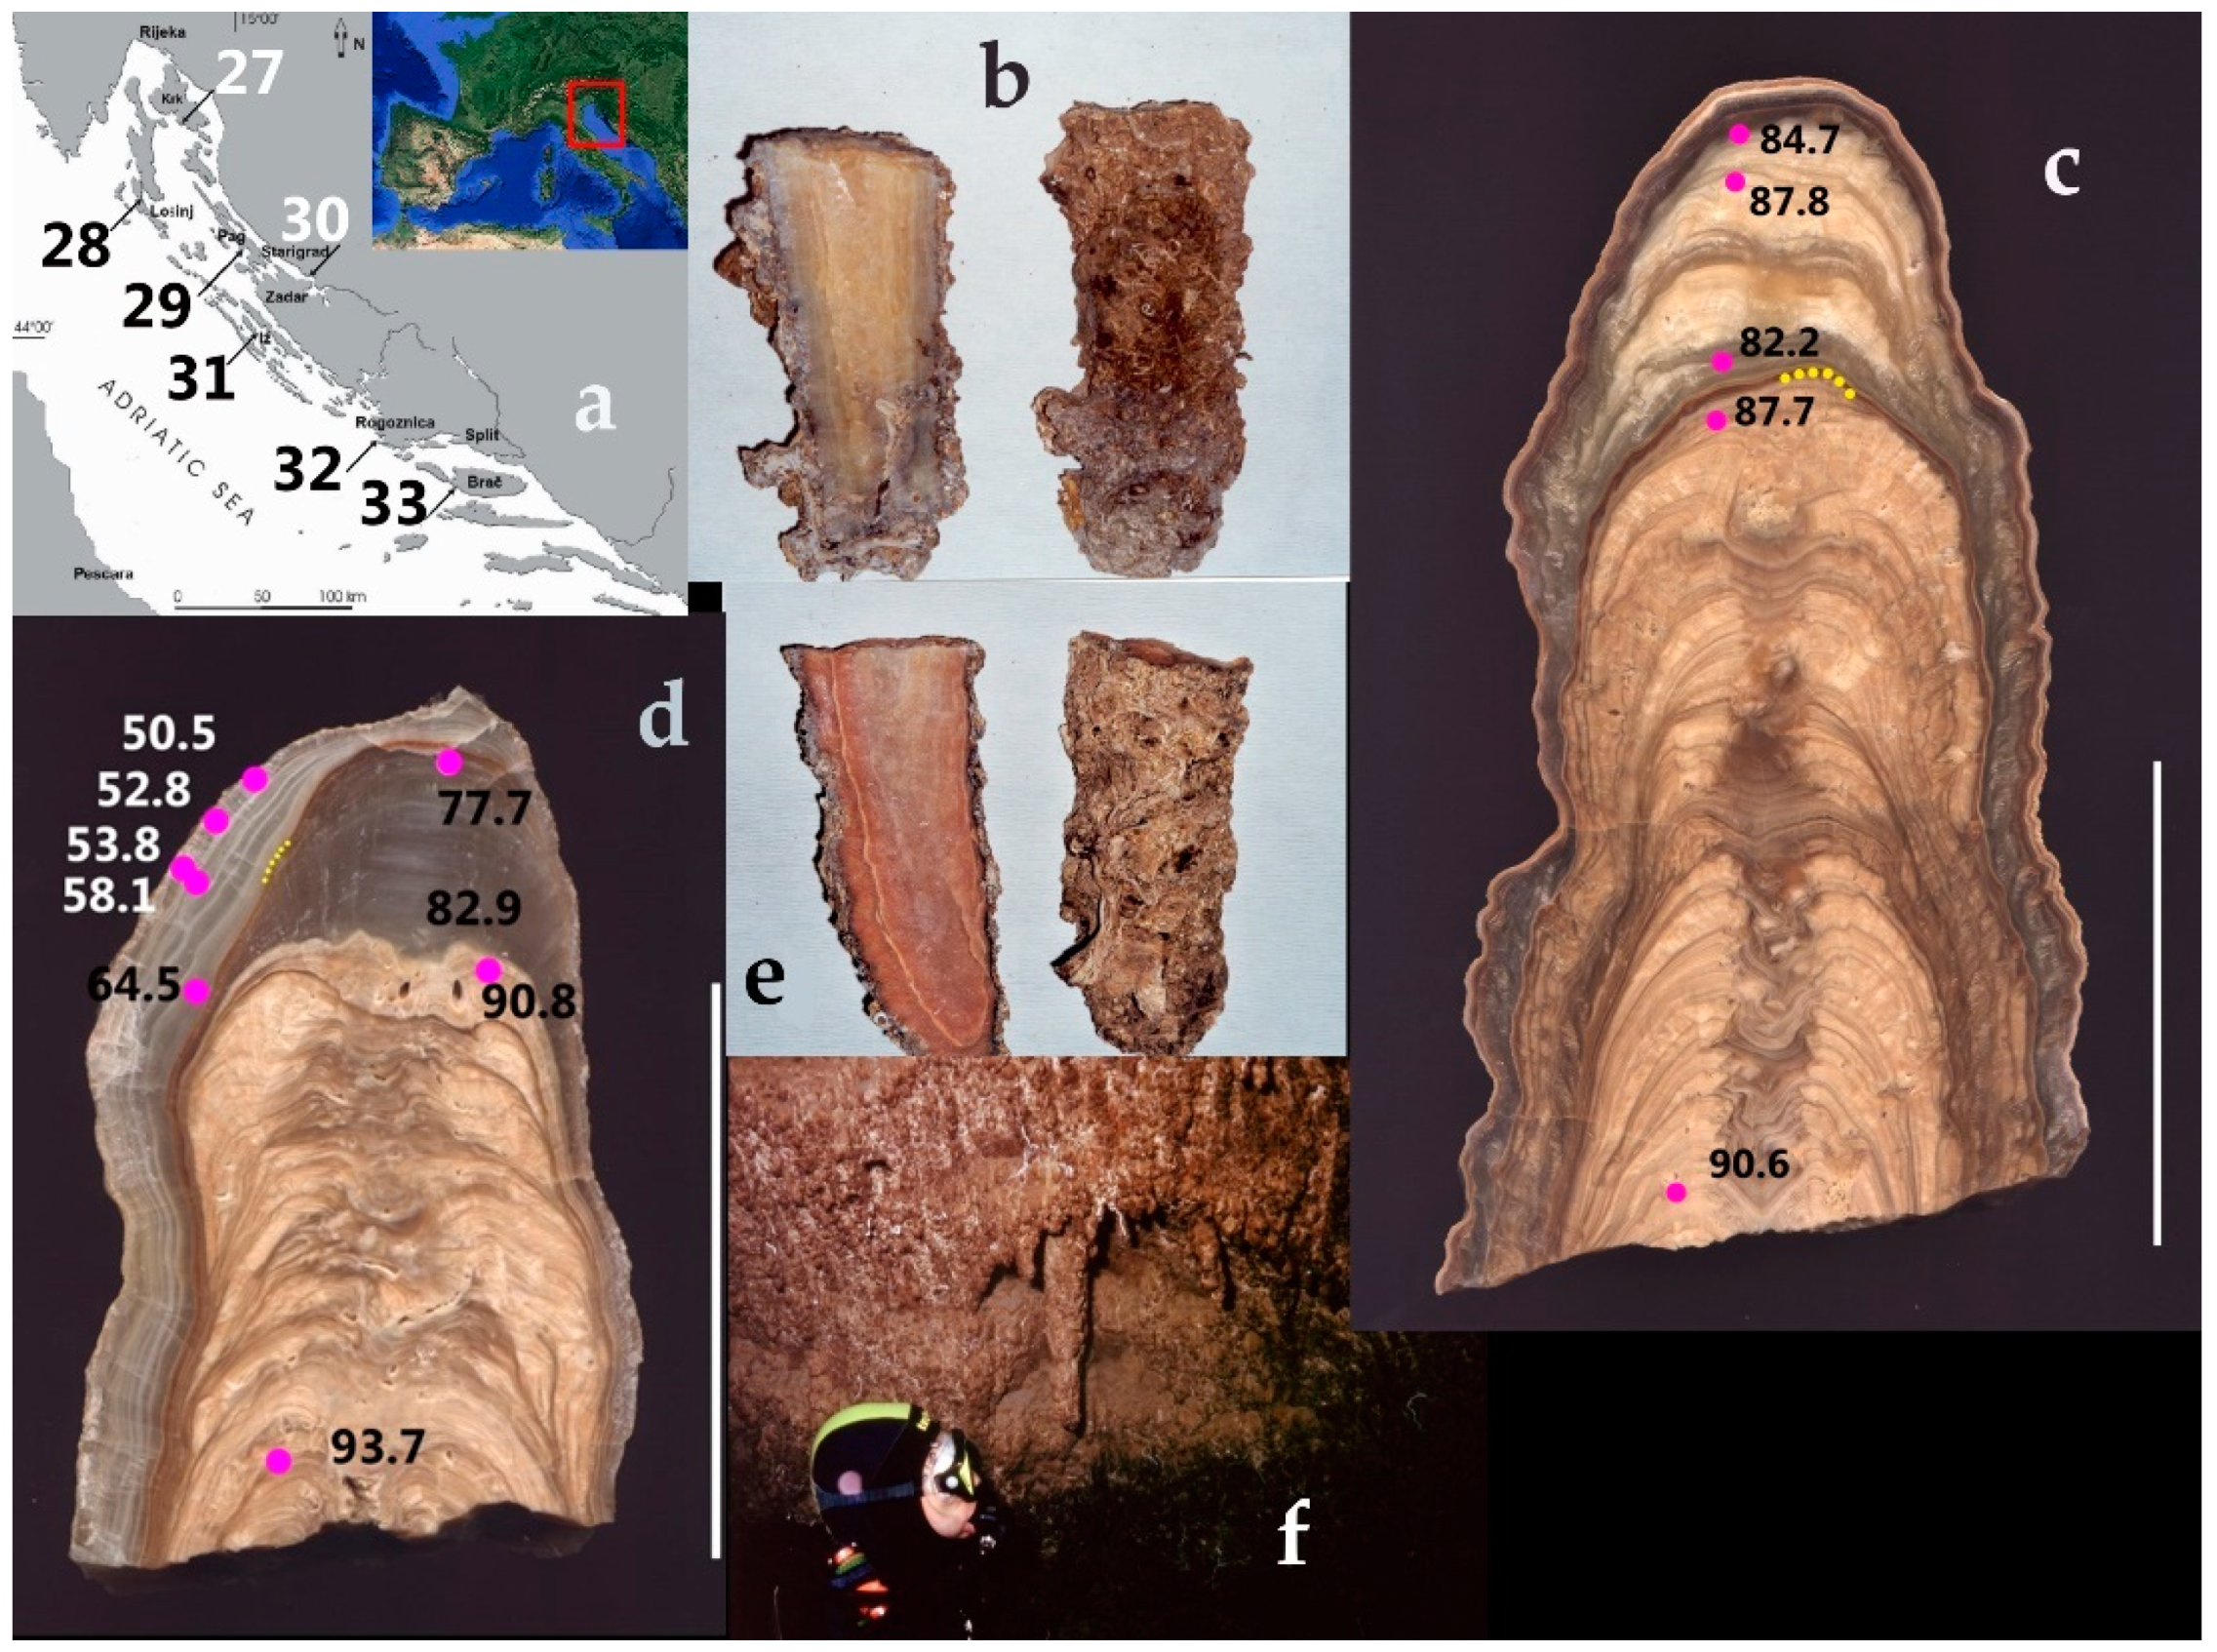
3.1. Croatia (2005–2010)

The Adriatic coast of Croatia is a karstic coast characterized by more than 230 submarine caves that have been investigated over the last two decades to reconstruct former sea level changes (Figure 3, Table 4). Slightly more than half of the caves (n = 126) show full marine conditions, 75 are anchialine (mostly) pits, 13 are submarine springs (vruljas), and 21 are not determined by hydrological or environmental conditions. More than 140 caves contain speleothems [77].
In particular, 16 submerged speleothems were collected at depths between −41.4 and −1.5 m in seven caves (out of 235 visited) located along the Croatian coast over a distance of ~300 km. The age model of these samples was constrained by 15 radiocarbon measurements and 36 U-Th analyses. Among these, the U-Th ages obtained from the stalagmites K-14 and K-18 sampled in U vode Pit (Krk Island, Figure 2) at a −14.5 and −18.8 water depth deserve particular attention. Eleven U-Th ages from K-18 span a ~50 kyr time range, from 97 kyr (MIS 5.3) to 50 kyr (MIS 3), and identify two hiatuses, whereas 5 U-Th measurements from K-14 cover a ~10 kyr period, from 91 to 82 kyr (MIS 5.1), with the presence of one hiatus marked by calcite, gypsum, and halite precipitation (Figure 3a,b) The deposition of speleothem K-18 ceased during MIS 3 (58–28 kyr BP) and few data have been published for MIS 2 (Table 2). The radiocarbon ages of the continental layers of the speleothems L-1-S, L-10-S, and Z-41-S have provided some interesting data on the sea level rise during the Holocene (Table 4): −1.5 m at 3.3 kyr, −10 m at 7.8 kyr, and −41.5 m at 9.2 kyr cal BP. The comparison with the sea level curve predicted by [78] for Croatia reveals a good agreement for the first two points (L-1-S and L-10-S), whereas the value for sample Z-41-S slightly deviates from what is expected.

3.2. Italy (1992–2017)

Between 1992 and 1994, [19,63] published the first relative sea level curve for the Tyrrhenian Sea during the Holocene using the radiocarbon dating of samples at the contact between serpulid overgrowth and continental stalactites. The samples were retrieved at a 41 and 6 m water depth at the sites of Palinuro and Argentarola and 14C ages range between 26 and 3.5 kyr cal BP. The marine overgrowth observed on the Argentarola and Scaletta (Palinuro) speleothems started to encrust the speleothem surface when the rising sea level flooded the caves (Figure 5). The biogenic overgrowth mostly consists of white-yellow tubes precipitated by the polychaete worm Serpula massiliensis, and remaining bryozoans and sponges [2]. This encrustation plays a significant role because it protects the continental portion of the speleothem from degradation, bioerosion, or dissolution. The speleothems from the Argentarola and Rumena caves in Italy [2,6] represent the only cases in the world where more than one continuous deposition of continental and marine layers was observed in the same speleothem (for subsequent marine and continental highstands).
Argentarola cave (Grosseto, [2,19,21,22,63]): Submerged speleothems were collected from −21.7 and −3.5 m and dated by the 14C and the U-series disequilibrium method. The marine overgrowth of the highstand older than 40–50 kyr was not dated given the limit of the radiocarbon method when approaching these ages. The results obtained from speleothems of the Argentarola cave have greatly contributed to understanding of the sea level changes and environmental conditions during MIS 7.5, 7.4, 7.3, 7.2 7.1, 6, and 5.
Scaletta cave (Palinuro, Salerno [19,26,63]): A speleothem was collected at −48 m, representing the deepest sample with marine overgrowth found in the MS. The sea level reached this depth at 10.2 kyr cal BP (Figure 5).
Cattedrale cave (Marettimo island, Trapani [79,80]): A submerged stalactite was retrieved along a horizontal cave at −25 m. The radiocarbon age (9.4 kyr cal BP) obtained from the remainder of a fossil Lithophaga boring mussel that bored the continental portion of the stalactite provided the time of cave submergence (Figure 4e).
Rumena cave (Custonaci, Trapani, [6]): A single stalactite was collected at 98 m above sea level within a small cave. Unlike most of the other speleothems from the Mediterranean, which are covered by serpulids, the stalactite from the Rumena cave has been encrusted by scleractinian corals (Figure 5g,h). The cross section of the sample revealed the presence of four highstands (MIS 25–37), with the outermost coral overgrowth, which represents the final marine ingression, being dated to 1.12 ± 0.2 Myr through the strontium isotopes (87Sr/86Sr) method.
Plemmirio cave (Siracusa, [64]): Submerged speleothems were collected from −25.5 and −26.6 m. The radiometric ages obtained from the U-series disequilibrium method of the speleothem calcite and 14C of the encrusting serpulids range from MIS 1 to 5.1. Nettuno cave (Capo Caccia, [81]): A submerged speleothem was sampled at −52 m, representing the deepest speleothem collected in the MS. Refs. [82,83] reported the age of phreatic speleothems collected from the same cave which, compared with oxidation bands and tidal notches in the external portion of the cave [84], confirms the MIS 5.5 age with a local highstand at 4.2 m (Figure 2c). Other speleothem samples were retrieved from Stalattiti Ubriache grotta Zingaro reserve (Trapani), Grotta di Tragara Capri, Risorgenza di Cala Luna Orosei (Nuoro), and Grotta Azzurra in Ustica [19] and radiocarbon dated. The results from samples at a −9 and −0.6 m depth revealed very recent speleothem formation (between 2 and 4 kyr) (Figure 2i, Table 3). All the sites described in Italy are tectonically stable, with the exception of Plemmirio, which is characterized by an uplift rate of 0.3 mm/yr and Rumena cave, which experienced a continuous tectonic uplift of 0.081 mm/yr for the last 1.4 Myr.

3.3. Malta

Ref. [65] studied a submerged speleothem collected at a −14.5 m depth in a recently discovered submerged cave at Gebel Ciantar, Malta island (Table 1, Figure 2a). Since the cave was mainly formed in a subaerial karst environment, radiocarbon dating of the speleothem with serpulid encrustations (Figure 2f) enabled the sea level during the mid-Holocene, when the cave was fully flooded, to be reconstructed. In particular, the mean radiocarbon age of 7.6 kyr perfectly aligns with the sea level curve predicted by [78] for Malta. Ref. [65] concluded that the Maltese islands were tectonically stable during the mid-Holocene, and this tectonic behavior still persists today.

3.4. Mallorca (1974–2020)

The results of more than 30 years of work carried out in 10 different caves of Mallorca, all located along the southern coast of the island (Figure 1), have been published in numerous papers [4,5,27,28,45,62,76]. POS have been extensively studied and radiometrically dated, including both modern samples formed a few cm above and below the water table and fossil remains collected up to 15 m above the present sea level. The results have significantly contributed to sea level reconstruction of MIS 5.1 and 5.5. In particular, [9] first highlighted the great potential of studying POS in the caves of Mallorca and paved the way for further in-depth investigations of these distinct encrustations. Ref. [28] published the U-Th dating results of 15 POS collected between 1.4 and 5.8 m above the present sea level, spanning ages between 71 and >350 kyr; [76] identified a tilting of the southern coast of Mallorca which reconciles the different heights of speleothems dated to MIS 5.1. Ref. [45] analyzed eight POS samples from Cova de Cala Varques, comparing 14C with U-Th ages.
The results obtained from the two dating methods generally agree, but the use of radiocarbon dating can be problematic when the dead carbon proportion values are high. Refs. [4,5] reported the results of several U-Th measurements conducted on POS samples located at 1.2 to 1.5 m and at 2.2. to 3.2 m above sea level, respectively. The ages obtained by [4] fall within a narrow range, from 81.95 ± 0.56 to 80.09 ± 0.48 (MIS 5.1), whereas the ages calculated by [5] cover MIS 5.5, from 126.6 ± 0.4 to 116 ± 0.8 kyr. Finally, ref. [62] carried out several U-Th analyses on vadose speleothems collected along the eastern coast of Mallorca at 2 and 5.5 m above sea level. The U-Th ages span a large range, from ~440 to ~1500 kyr (Table 3, Figure 4). As also mentioned by the authors, the oldest ages (>650 kyr), which were obtained using the 234U/238U disequilibrium method, suffer from large uncertainties, mainly associated with the errors of the initial δ234U estimates needed to calculate δ234U ages.

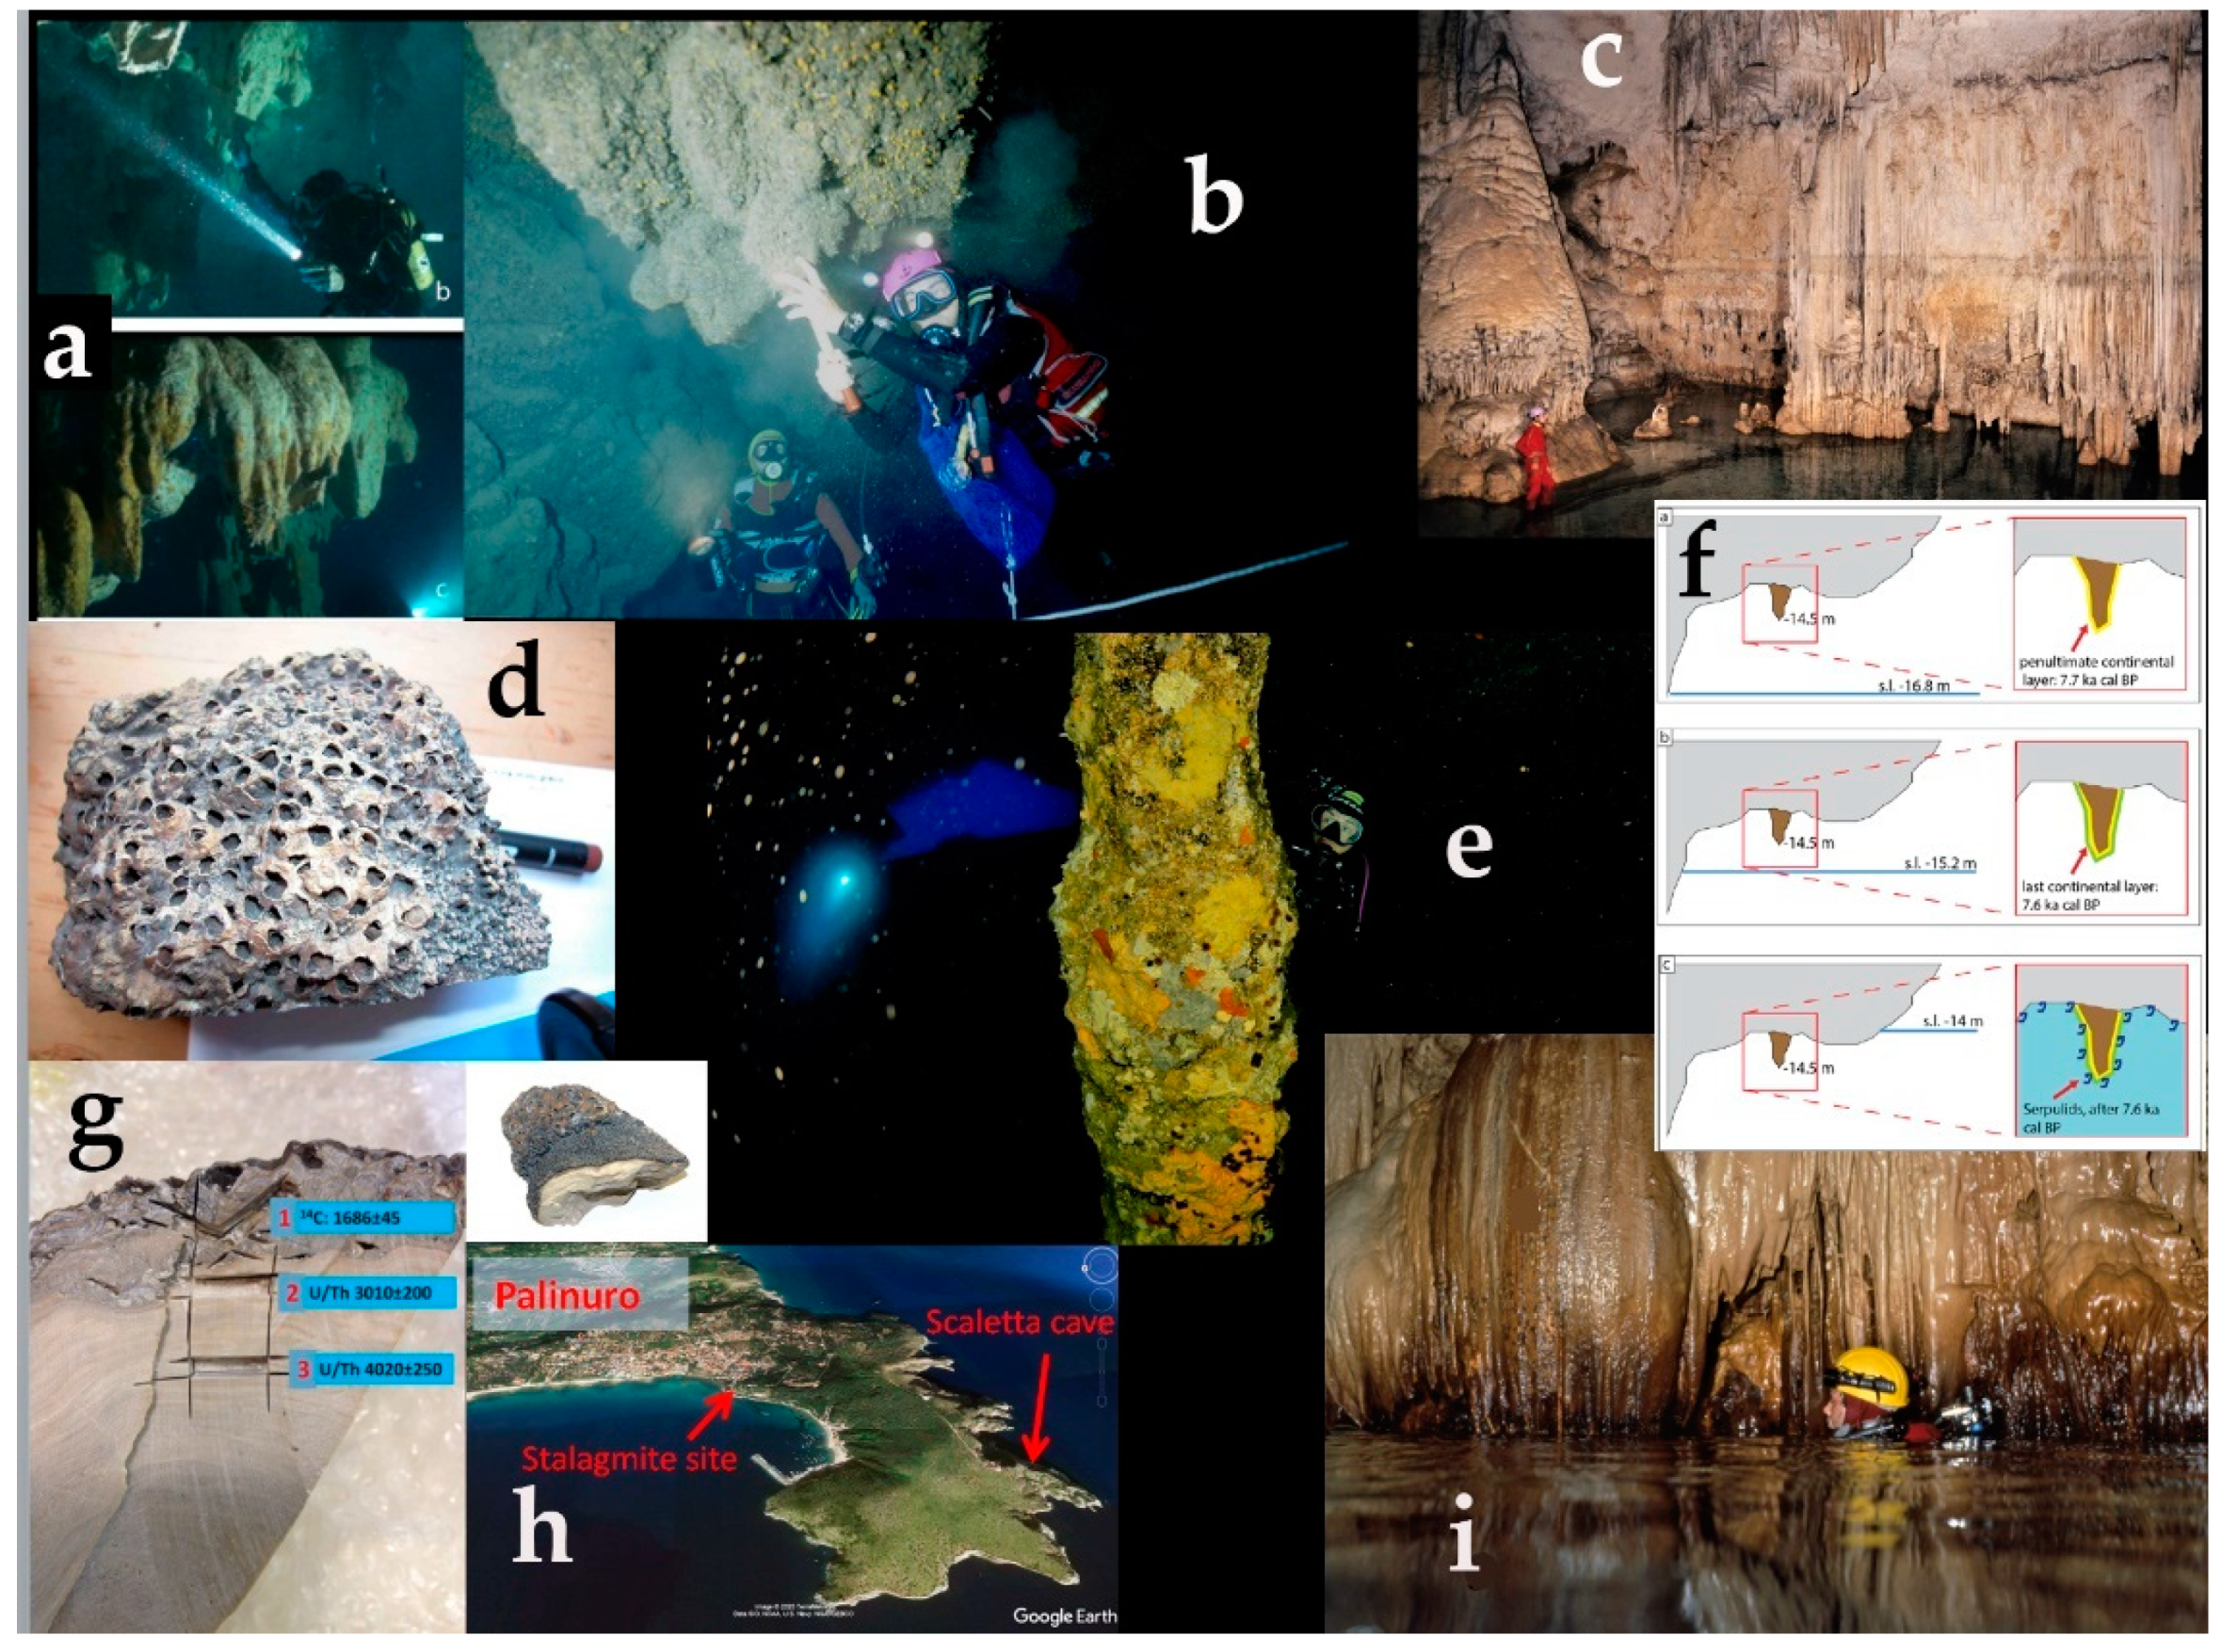
3.5. New Results from the Palinuro Stalactite

The U-Th dating of the vadose portion of the speleothem provided ages between 5.49 ± 1.65 and 4.46 ± 3.74 kyr (Figure 6, Table 5), whereas the radiocarbon measurement of the fragment of a Chthamalus barnacle gave an age of 1.58 kyr cal BP (median probability). The large uncertainties of the U-Th ages, especially for the sample Palinuro-2, derive from the high detrital Th contamination (230Th/232Th < 2).

3.6. Predicted RSL Curves

The predicted RSL curves for ICE-5G, ICE-6G, and ANICE-SELEN and the VM2 mantle viscosity profile (gray curves in Figure 7c) show an increase of variability in the Mediterranean, with respect to the eustatic signal, when moving from the interglacials (i.e., MIS 5.5) through the interstadials (i.e., MIS 5.1–5.3 and MIS 3) and glacials (e.g., Last Glacial Maximum, about 21 kyr cal BP, LGM).
The relatively limited regional RSL variability during the interglacials is characterized by a maximum deviation from the eustatic signal of ~2.5 m for the three ice sheet models (Figure 7a–c), confirming previous findings [36,38,85].
This also supports the results of [39] for the Bahamas, where the RSL gradient as a function of latitude vanishes during the MIS 5.5. Our predicted RSL curves for the Bahamas (red curves in Figure 7a–c) fall within the Mediterranean response, thus confirming that the Bahamas is an intermediate-field site (w.r.t. north American ice sheets), and similar to the northern Mediterranean sites (w.r.t. Fennoscandia and Eurasian ice sheets).
The predicted maximum highstand during the MIS 5.5 in the Bahamas is delayed with respect to the eustatic signal. For both ICE-5G and ICE-6G, the MIS 5.5 peak occurs at the end of the MIS 5.5 and exceeds the eustatic value. For ANICE-SELEN, instead, the delayed maximum peak is lower than the eustatic value.
The predicted RSL variability during the interstadials shows up as deviation from eustasy with the order of ~15 and ~25 m for MIS 5.1–5.3 and MIS 3, respectively. This confirms previous findings for the Bahamas [37,38], and shows that the ice-loading term also causes strong regional RSL gradients in the Mediterranean Sea.
Additionally, in the Bahamas, the deviation from the eustatic signal increases towards the interstadials and glacials [39], implying its dependency on the fluctuations of the north American ice sheets.
In the Bahamas, the predicted RSL curves are above the eustatic value for both ICE-5G and ICE-6G. On the other hand, ANICE-SELEN results are lower than the eustatic curve. The predictions at the Mediterranean sites are distributed around the eustatic values.
The cumulative predictions in the Mediterranean for three ice sheet models and mantle viscosity profiles (MVP1–3) are characterized by a larger variability (gray curves in Figure 7d–f). Again, the variability increases towards the interstadials and glacials, implying that the viscosity gradient is a significant factor in the regional RSL variability in the Mediterranean Sea. The predicted variability in the Bahamas is significantly larger than in the Mediterranean (red, green, and blue curves in Figure 7d–f) and fully bounds the predictions at the Mediterranean sites. Increasing the viscosity gradient, i.e., moving from MVP 1 to MVP 3, results in an upward shift of the RSL curves between MIS 5.5 and LGM. The predicted total RSL glacial-interglacial excursions (glacial-interglacial) for MVP1 are larger than for MVP3, indicating that a larger viscosity gradient (and a larger viscosity value for the lower mantle) results in a significant delay of the solid Earth response. This can be appreciated during the MIS 5.5, when the maximum peak of transgression appears at the end of the interglacial and during the Holocene (i.e., steeper RSL rise curves Figure 8).

4. Discussion

The use of submerged speleothems has provided remarkable results for the sea level change history during the Holocene and for long-term sea level change reconstruction of the Late Pleistocene, in particular, for MIS 1, 7.1, 7.2, 7.3, and 7.5 highstands (Argentarola stalagmites), the MIS 5.1 highstand (Croatia and Mallorca), the MIS 5.5 highstand (Mallorca), and the MIS 6.5 highstand (Nettuno cave in Italy) (Table 3 and Table 4). Unfortunately, marine overgrowth layers encrusting Italian or Croatian speleothems with ages beyond the radiocarbon dating range (i.e., >40–50 kyr) cannot be analysed by the U-series disequilibrium method due to diagenetic overprints that cause the exchange of uranium [86].

4.1. Palinuro Speleothem

For the interpretation of the 14C and U-Th results obtained from the new Palinuro sample, a study of the tidal area was conducted along the promontory of Palinuro over a distance of ~3 km from the sampling site. The survey revealed the presence of a fossil tidal notch, below which we found specimens of the crustose coralline algae Lithophyllum, the acorn barnacle Chthamalus, and the limpet Patella. Based on [78], the sea level was 4.4, 3.3, and 0.73 m lower that the present level at 5.5, 4.5, and 1.6 kyr, respectively (Table 3, Figure 6). Therefore, the barnacles started to colonize the stalagmite at 1.6 kyr, when the rising sea reached a level that exposed the sample to strong wave conditions, favorable for barnacle growth. However, no living barnacles were observed during the sampling of the stalagmite and this might be due to changes of the environmental conditions since the deposition of the fossil barnacles.

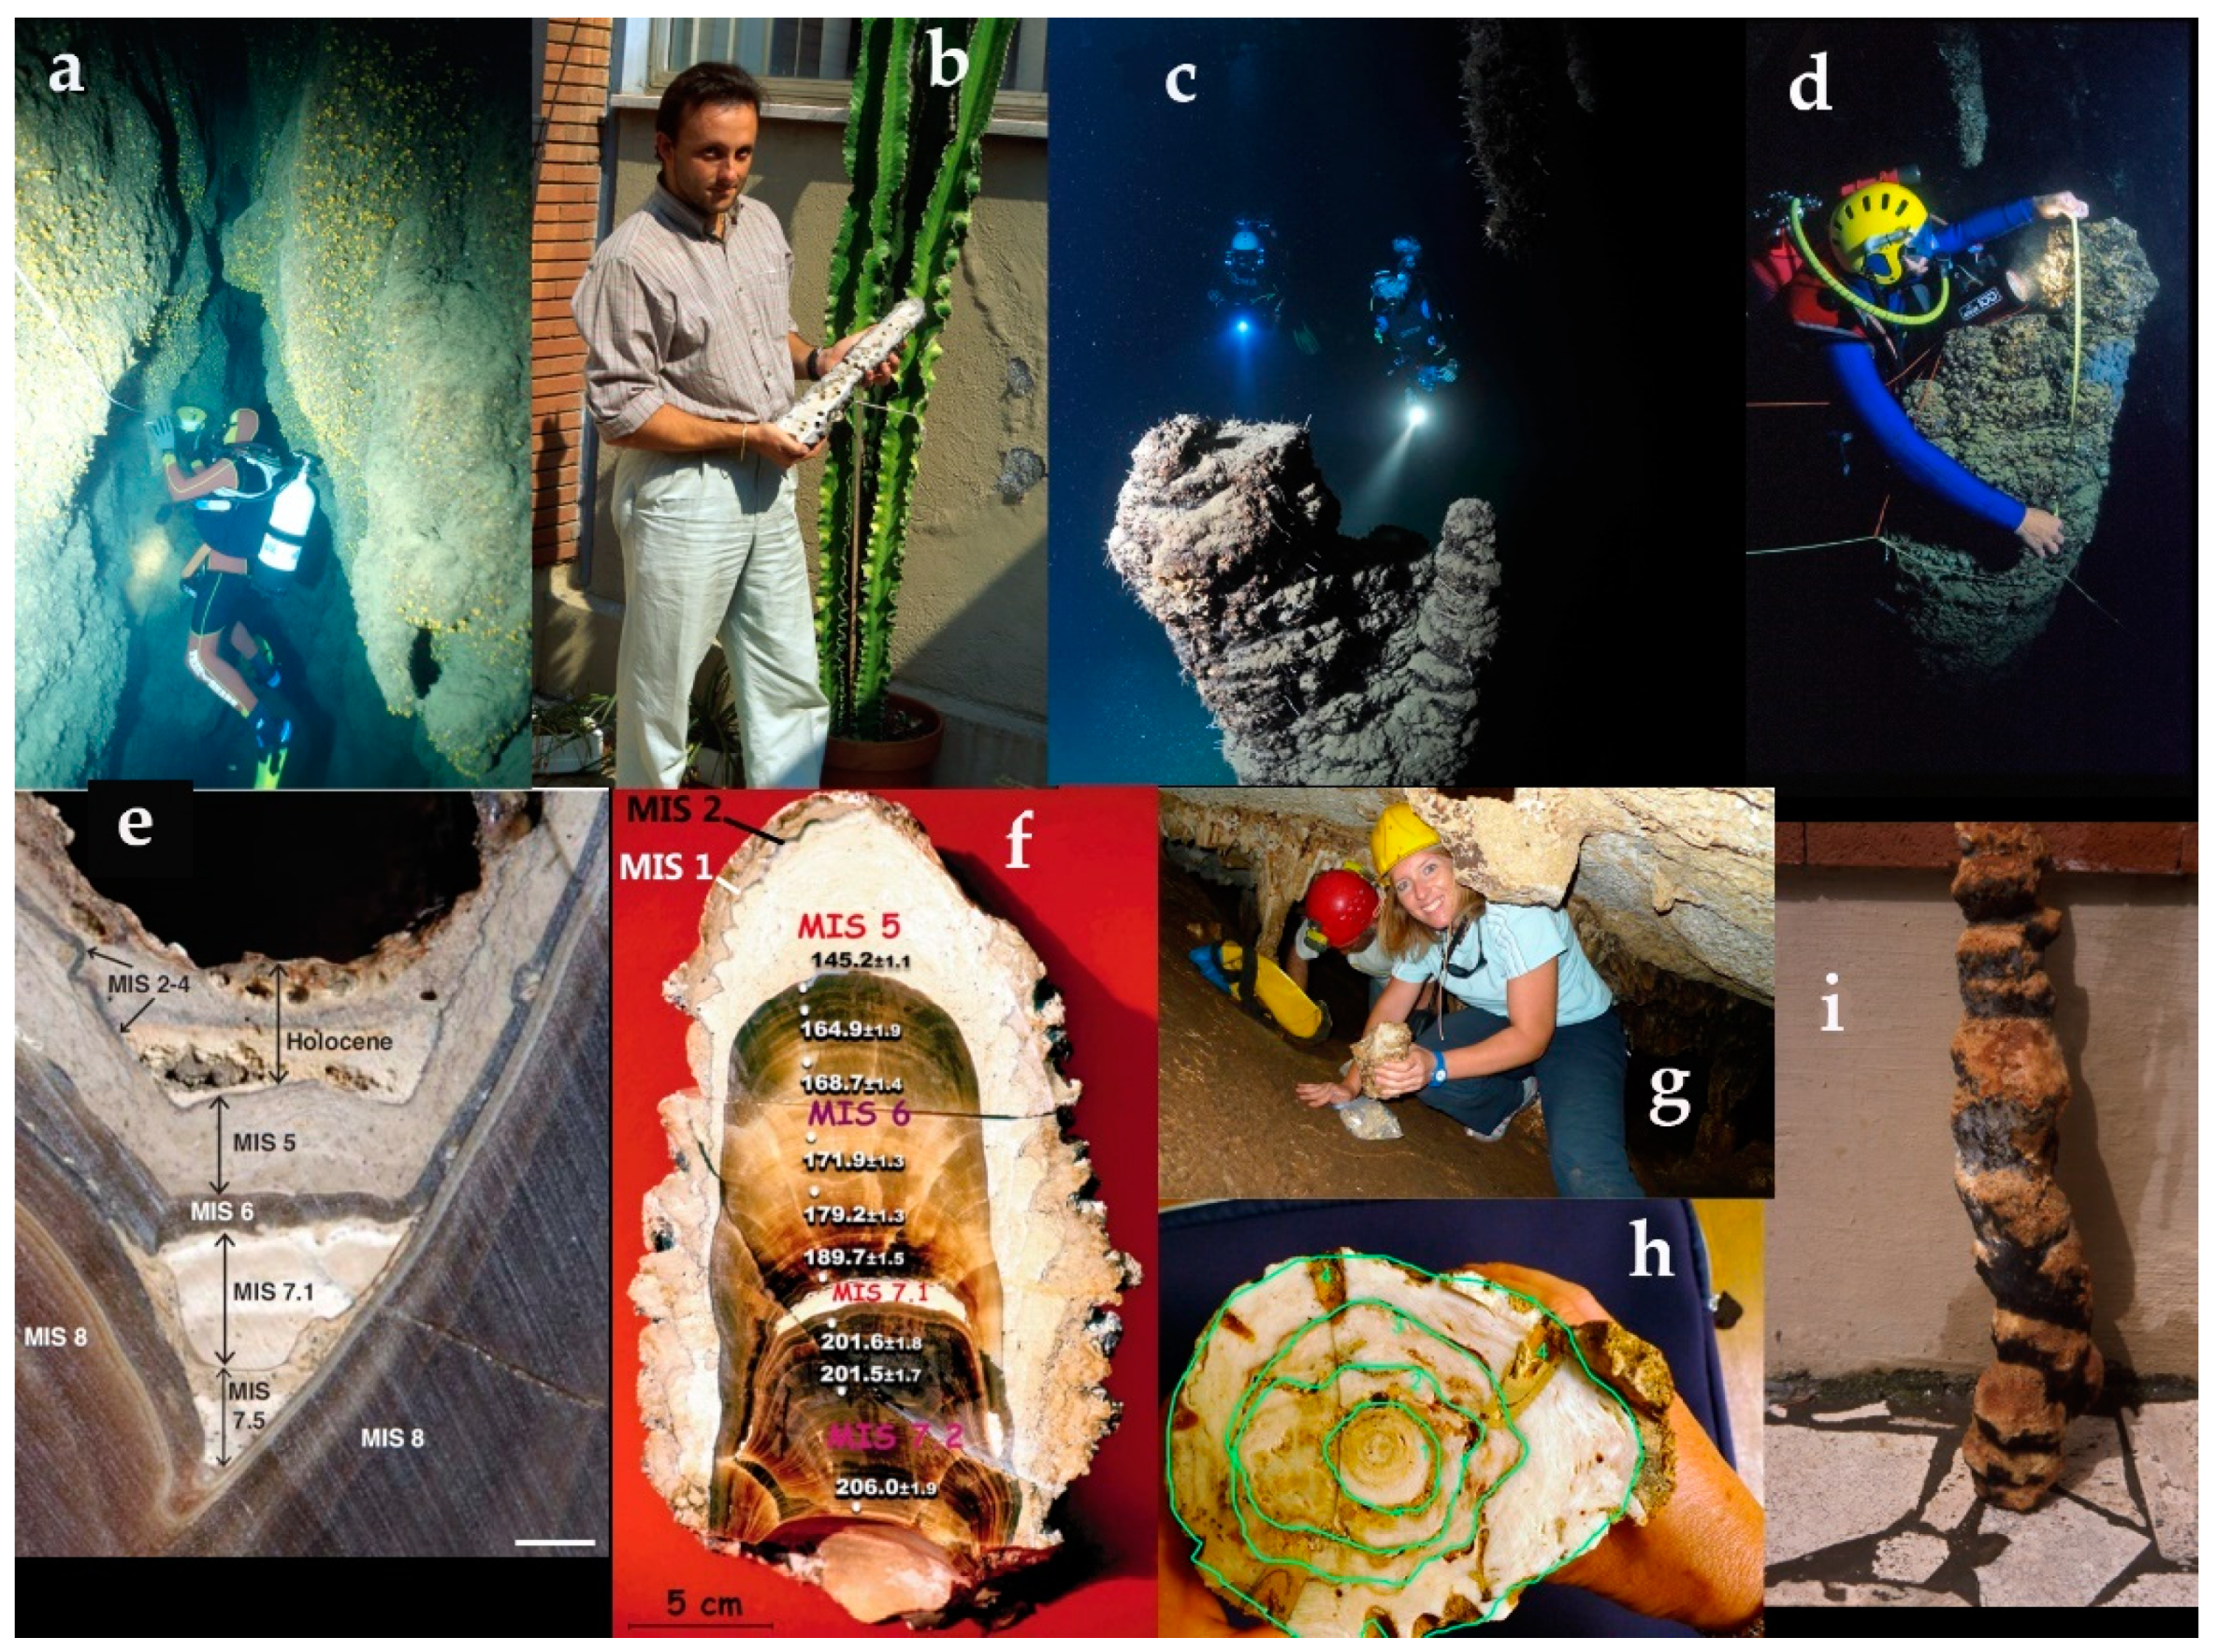
4.2. Speleothems from Italy

U-Th dating and geochemical analyses of the speleothem samples from the Argentarola cave provided detailed information on the timing, duration, and position of sea level highstands during MIS 7.1, 7.2, 7.3, 7.4, and 7.5 [2,22]. Based on the δ18O results obtained from the serpulid overgrowth on a stalagmite collected at −18.5 m from the same cave (Figure 5f) and the correlation with foraminifera δ18O values from the Mediterranean ODP site 975 [87], ref. [21] identified MIS 5 as the time of marine overgrowth deposition, without any visible interruption from MIS 5.1 to MIS 5.5 (Figure 9). It is worth mentioning that the timing of the MIS 7.3 and 7.2 highstands identified by U-Th dating on the speleothem agrees with the global sea level curve reconstructed by [88]. In the Nettuno cave, the deepest speleothem sampled in the Mediterranean at −52 m was dated by the alpha-counting U-series method (see Table 1 Figure 4), which provided an age of 165 ± 12 kyr, corresponding to MIS 6.5 and in agreement with [88].
Finally, the speleothem Plemm A (Table 3) was collected in the Plemmirio cave [62] at −20.2 m, which was corrected to −35.3 m when considering the tectonic uplift (0.2 mm/yr, [88])

4.3. Speleothems from Croatia

The speleothems retrieved along the Croatian coast and studied by [3,24,25,66,89,90] greatly contributed to the sea level reconstruction from 1.5 to 220 kyr. In particular, high-precision U-Th dating of the speleothems K-14 and K-18 sampled at −18.8 and −14.5 m in the U vode Pit cave (Krk Island) provided significant data to constrain the relative sea level curve during the MIS 5.1 highstand. Regarding the presence of two hiatuses in the K-18 stalagmite, on the basis of the lack of XRD analyzes that invoked the presence of a hiatus between 90.8 and 82.9 kyr, and in correspondence with a change in color, we suppose that only the second hiatus was present between 77.7 and 64.5 kyr (Figure 3).
The ~13–18 m difference between the elevation of the two speleothems (−18.8 and −14.5 m) with the ice-volume-equivalent global sea level curve by [91] has been justified by [25], invoking a long-term regional tectonic uplift with an average rate of 0.15–0.25 mm/yr during the last 75–85 kyr. However, the vertical tectonic movements along the Croatian coast are still a matter of debate. For example, [90] suggested a generalized downlift in Istria and uplift along the southern cost of Croatia. Ref. [12] investigated the carbonate coast stretching from Trieste to southern Croatia and showed that the tidal notch is always submerged between 1.8 and 0.5 m below the mean sea level. Furthermore, archaeological studies along the Croatian coast revealed the presence of Roman remains (2 kyr BP), including a pier and fishtanks, at ~1.5–1.8 m below sea level as a result of tectonic subsidence or coseismic downlift [92,93]. Finally, none of the fossil outcrops related to the MIS 5.5 highstand that are usually found at ~+6 m a.s.l. in tectonically stable regions [36,94] have been observed thus far in the north-eastern Adriatic Sea. Therefore, we hypothesize that most of this area is affected by tectonic subsidence (a minimum of 6 m since MIS 5.5), with possible local uplift movements [25]. Accordingly, we decided to correct the elevation of the stalagmites K-14 and K-18 by 4 m, to −10.4 and −14.7 m, respectively, assuming a constant subsidence of 0.048 mm/yr for the last 80 kyr.

4.4. Speleothems from Mallorca

A large number of precise U and Th isotope measurements have been performed on submerged speleothems sampled from 10 coastal caves on the island of Mallorca. Data published by [5] agree with previous studies reporting MIS 5.5 fossil deposits in Mallorca [95,96]. These deposits contain the Tyrrhenian Senegalese faunal assemblage that was analysed by the amino-acid dating technique [95] and remainders of the coral Cladocora caespitosa that were dated by U-Th [96].
The elevation of MIS 5.1 POS samples studied by [4] in Mallorca still represents a scientific debate.
The reconstructions obtained by [88,97] indicate that the sea level during MIS 5.1 was 21.2 and 26.7 m below the present sea level, respectively. However, the global sea level curves do not take into account the local tectonics and GIA. Based on the U-Th results of [96] on fossil corals from Mallorca, we can rule out the presence of MIS 5.1 coral deposits on the Island.
In Sardinia, the presence of fossil tidal notches, attributed to MIS 5.5, was reported by [66] in the Orosei Gulf, which is a tectonically stable coastal area in Italy. The fossil tidal notches in this area show a lateral continuity of tens of kilometers, while there is no evidence of younger fossil tidal notches at a lower elevation.
In other regions worldwide, like in the Caribbean Sea, observational data of MIS 5.1 deposits from submerged speleothems seem to disagree with the finding of POS samples located at ~1.4 m a.s.l. in Mallorca and dated to ~81 kyr BP. The U-Th results for the DWBAH flowstone recovered from 15 m below the present sea level on Grand Bahama Island clearly indicate that, during MIS 5.1, the sea level did not rise as high as −15 to −10 m [11].
Discrepancies in the elevations of different sea level markers, ranging from −20 to + 5 m, are found along a latitudinal transect in tectonically stable areas for the coasts of Haiti, Bermuda, the Bahamas, South Carolina, and Florida. However, these apparent inconsistencies are reconciled when taking into account the isostatic response of the Earth to the North American ice sheets melting during the last glacial cycle [39].
Results from the MIS 5.1 POS samples in Mallorca agree with the finding of some deposits from the same age between +2 and +1.5 m near Gibraltar [98], but disagree with the following:
  • All the eustatic curves (in particular, [88,97]);
  • The U-Th ages reported by [96] for Mallorca;
  • The speleothem from Plemmirio located at −20.2 m [64];
  • The speleothems K-18 and K-14 from Croatia at −18.8 and −14.5 m;
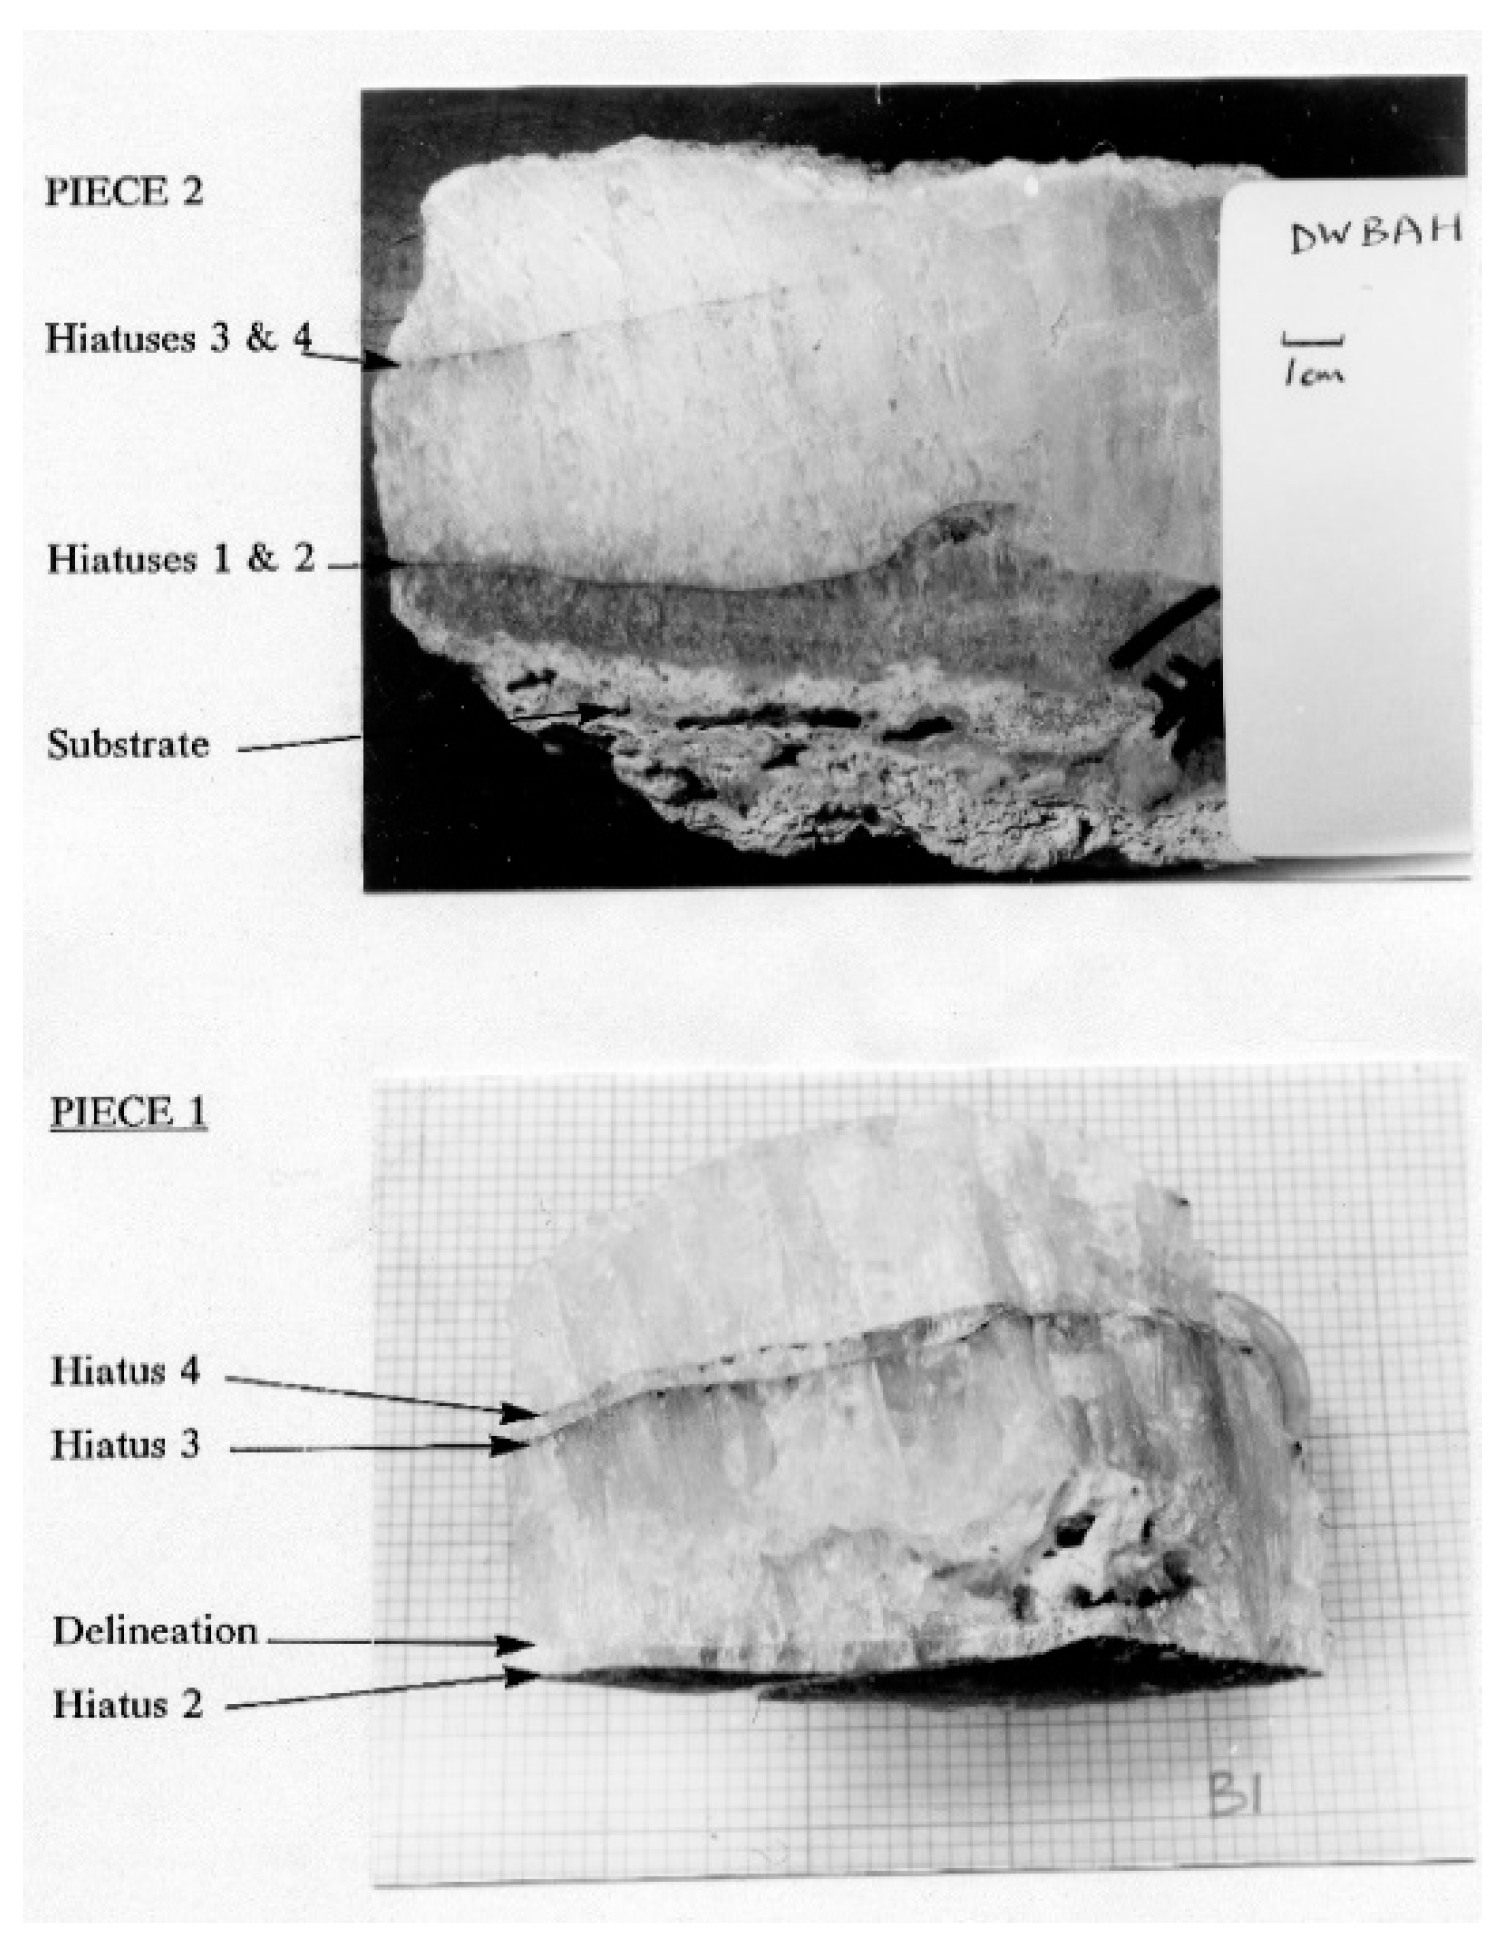
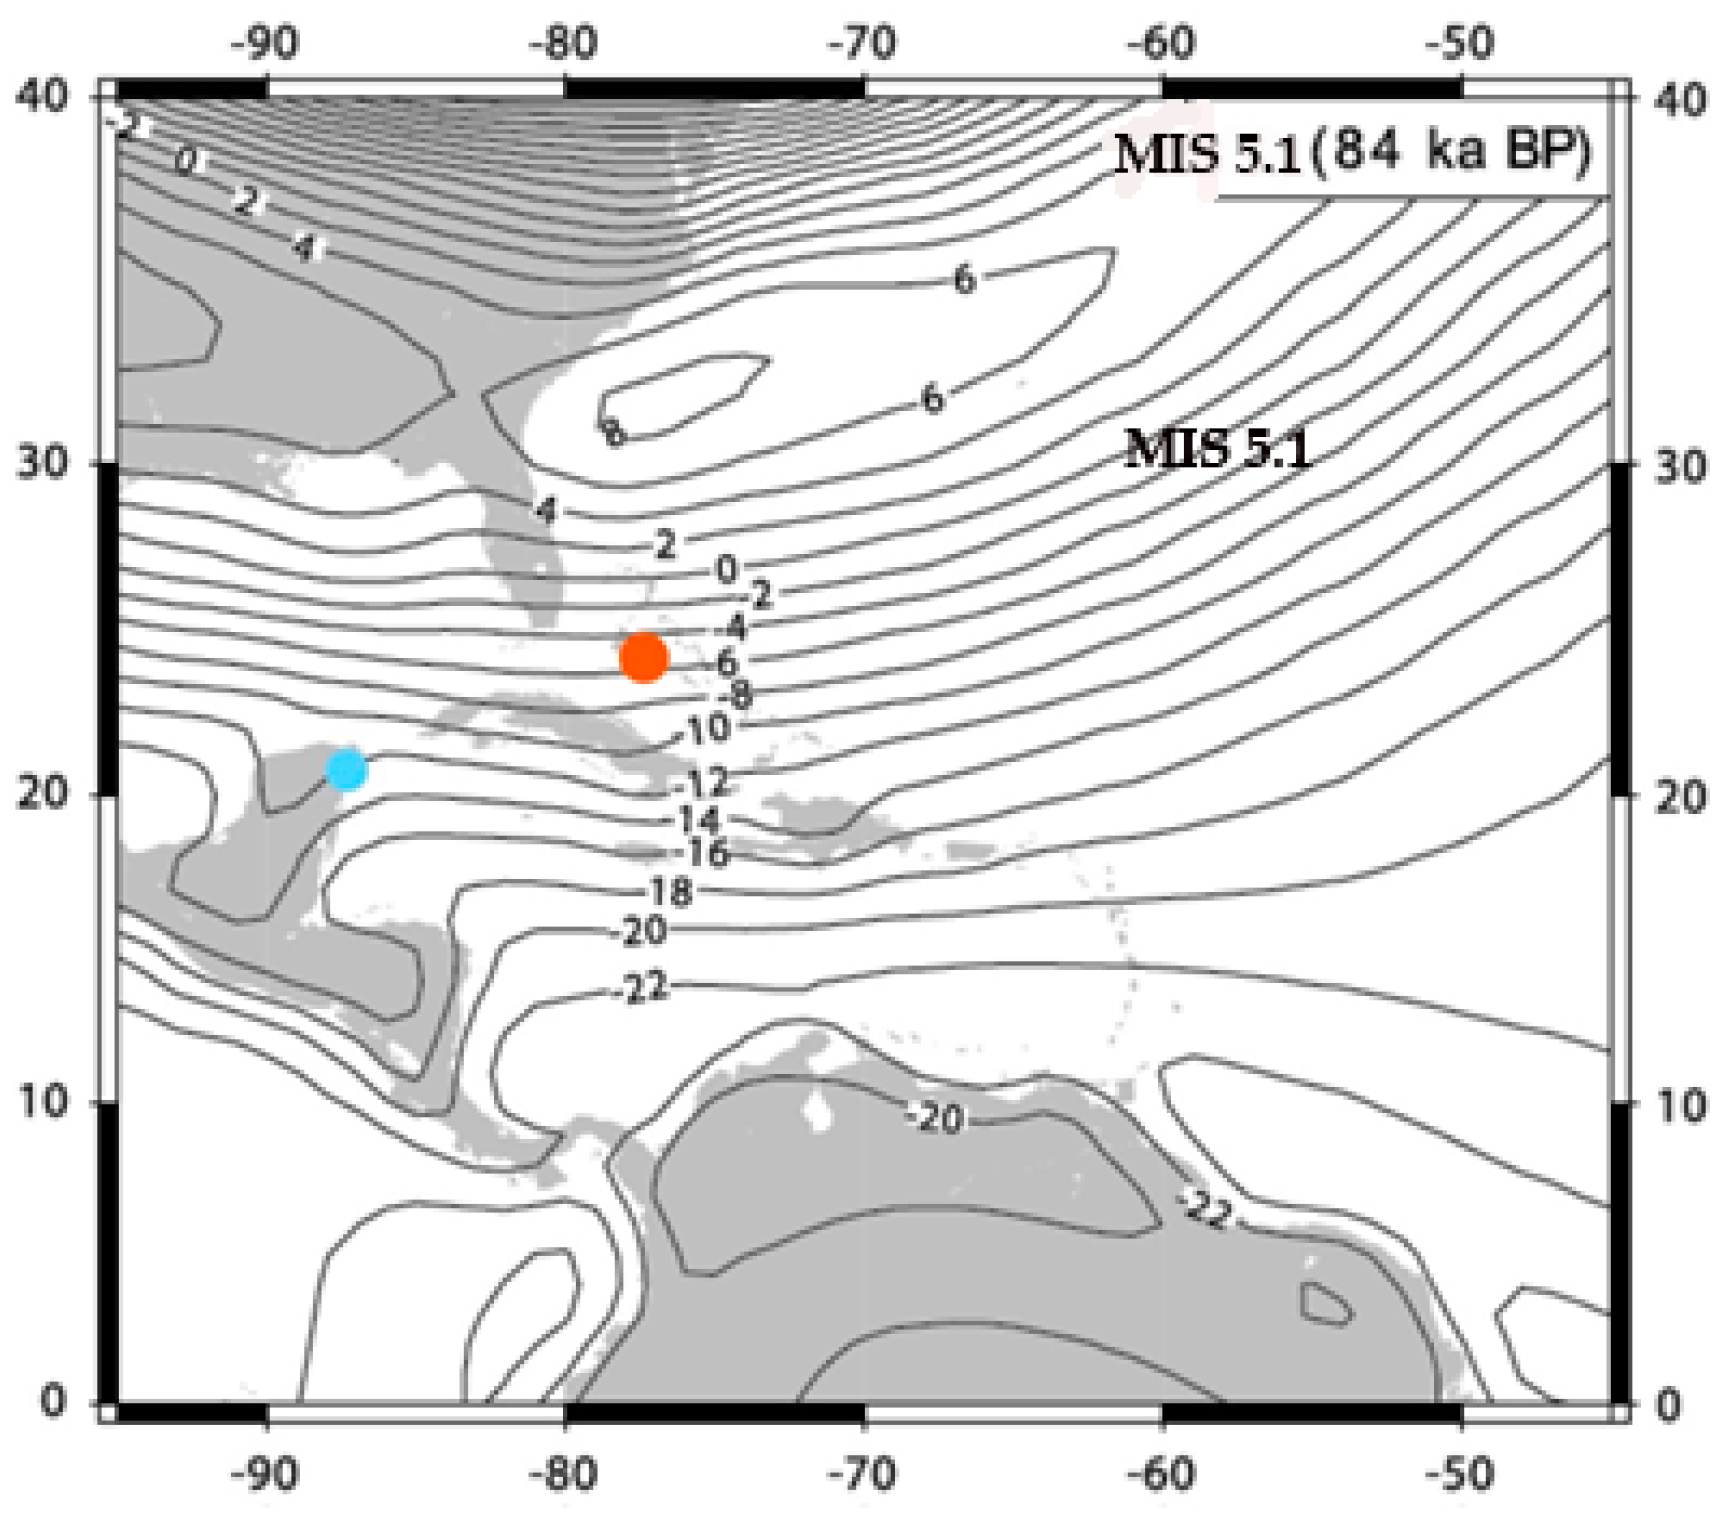
  • The DWBAH flowstone from Bahamas at −15 m (Figure 10);
  • The morphology of the MIS 5.5 tidal notches [36] and the lack of younger tidal notches;
  • The mushroom-like landforms with tidal notches at −25 m found on Tavolara island (Sardinia) and interpreted by [36] as being MIS 5.1 in age;
  • The results of glacial and hydro-isostatic adjustment (GIA) of the Mediterranean Sea (see Figure 7 and Figure 8).
We decided to compare the vertical position of most of the submerged speleothems described in this review with the DWBAH flowstone [1,11]. This exceptional flowstone contain five hiatuses identified by the deposition of a thin layer of red or yellow mud (Figure 10 and Figure A3), and was extensively dated by the U-series disequilibrium method, providing precise ages that unraveled, for the first time, the history of sea level variations from ~300 to ~30 kyr. The hiatuses mark the marine highstands as follows: H1 between 231 and 237 kyr (MIS 7.5); H2 between 213 and 220 kyr (MIS 7.3); H3 between 112 and 127 kyr (MIS 5.5); H4 between 94 and 105 kyr (MIS 5.3); and H5 at 34 kyr. The DWBAH flowstone elevation and original U-Th ages were corrected for a tectonic subsidence of about 1 m for 50 kyr [1] and for the detrital 230Th component (see Materials and Methods and Appendix A Table A1).
Based on the correction for the subsidence, the DWBAH flowstone started to form ~300 kyr ago at −10 m and ceased growing ~39 kyr ago. The flowstone is presently located at −15 m. Similarly, the elevation of the two speleothems sampled in the Plemmirio cave in Sicily (Table 3) was corrected from 20.2 and 35.3 m b.s.l. to 22.7 and 38.2 m b.s.l., considering an uplift rate of ~0.2 mm/yr, as evaluated by [64].
In Croatia, the elevation of the stalagmites K-14 and K-18 was corrected considering a subsidence of ~4 m in 81 kyr. The correction derives from the fact that MIS 5.5 at 6 m a.s.l., or at higher elevations, has never been found in Croatia. This means that MIS 5.5 is below the present-day sea level and 4 m is extrapolated from a subsidence of the coast of at least 6 m in 125 kyr, corresponding to MIS 5.5. The elevation of the other speleothems considered in the present review (i.e., Argentarola cave, Mallorca, Malta, and Sardinia) was not corrected for uplift or subsidence owing to the tectonic stability of these areas.
The distribution of coastal caves in the Mediterranean Sea necessarily reflects the presence of carbonate rocks thick enough to enable the formation of caves, even when the sea level was 60–70 m lower than the present level. Generally, submerged speleothems are rarely preserved in carbonate formations from regions with a strong uplift or subsidence. In the western Mediterranean, research has largely focused on Mallorca, which is a tectonically-stable island with calcarenites that hosts several POS deposits. In Croatia, where the tectonic activity is limited (e.g., small subsidence) and the lithological features are monotonous, the formation of submerged speleothems is very active and preservation is good. In Italy, sea caves predominantly formed in tectonically-stable areas and carved limestones with different ages, textures, and microstructures, including Mesozoic-Paleogene carbonates and Miocene biocalcarenites. Karst in specific sites along the Italian coasts has developed for millions of years, shaping unique caves (e.g., Grotta Rumena, Palinuro, and Argentarola), where speleothems with multiple marine and continental layers have been preserved.

4.5. GIA-Modulated RSL Curves

The GIA-modulated regional RSL variability in the Mediterranean is minimal for the interglacials (~2.5 at MIS 5.5), but increases during the interstadials (~15 m at MIS 5.1–5.3), thus complicating the task of finding the correct eustatic value (gray curves in Figure 7). In fact, the GIA signal is strongly dependent on the solid Earth rheological profile, which is itself an unknown. In particular, the viscosity gradient and the lower mantle viscosity are important parameters in the Mediterranean Sea, as well as in the Bahamas. The predictions for the Bahamas (Figure 8a) are characterized by a larger mantle-driven variability around the eustatic signal than in the Mediterranean sites during MIS 5.1–5.3 (Figure 8b–f). In particular, for each ice sheet model, increasing the vertical viscosity gradient (i.e., moving from MVP 1 to MVP 3) results in a vertical upwards shift of the RSL curves of ~ 25 m (Figure 8a). In Mallorca, on the other hand, the predictions for each ice sheet model are very close to each other (Figure 8b), implying that the local signal is almost eustatic between MIS 5.1 and MIS 5.3, and the role of the mantle viscosity profile is negligible (also see Figure 11 and Figure 12). The MIS 5.1–5.3 RSL variability increases slightly at the other Mediterranean sites and is larger for ANICE-SELEN (blue curves in Figure 8c–e; also see Figure 11 and Figure 12).
When compared to the observations, the predictions are generally significantly lower, with the MVP 3 scenarios reducing the vertical gap between model predictions and observations (Figure 8a–f). In the Bahamas, for each ice sheet model, the MVP 3 profile shifts the RSL curve upwards and closer to the observed transgression at MIS 5.3 (Figure 8a). This implies that a slightly higher eustatic value (hence smaller ice sheet volume) might be required to explain the observed submersion. The observed +1.5 m sea level in Mallorca at 81 ka, on the other hand, stands out as a clear outlier and cannot be reconciled with the current ice-sheet and Earth rheological models (Figure 8b). Predictions for Croatia, Plemmirio, and Argentarola (Figure 8c–e) are in agreement with the observed vertical limits. However, the models cannot exceed the −20 m limit at 81 ka in Argentarola, thus implying that a further melting of ice sheets is required.
The predicted MIS 5.1 regional RSL variability, according to ANICE-SELEN and MVP 3, is characterized by higher-than-eustatic values towards the East-North East and around the continental margins (Figure 11 and Figure 12). On the other hand, the predicted values are lower than the eustatic value at the center of the basins towards the South East (where the ocean loading term dominates). Interestingly, Plemmirio and Mallorca are very close to the eustatic signal (Figure 12).
Predictions based on ANICE-SELEN and MVP 1–3 are in satisfactory agreement with the MIS 7.1–7.2 observations at Argentarola (Figure 8f).

5. Conclusions

The use of submerged speleothems has significantly contributed to reconstructions of the short-term (Holocene) and long-term (Middle and mostly Late Pleistocene) sea level changes in the Mediterranean. Even though there are still some open questions, the different groups that have been working on the speleothems from Mallorca, Croatia, and Italy for many years have carried out extensive and valuable work, which has significantly contributed to improving our knowledge on the sea level changes that occurred during the Mid and Late Pleistocene.
The present review reports the published elevations and radiometric ages (14C and U-Th) of the submerged speleothems in the Mediterranean. Elevation data have been corrected for local tectonics (uplift or subsidence) and compared with results from the DWBAH flowstone on Grand Bahama Island (Figure 13, Figure 14 and Figure 15).
Below, we summarize the main results obtained, following the key time periods investigated:
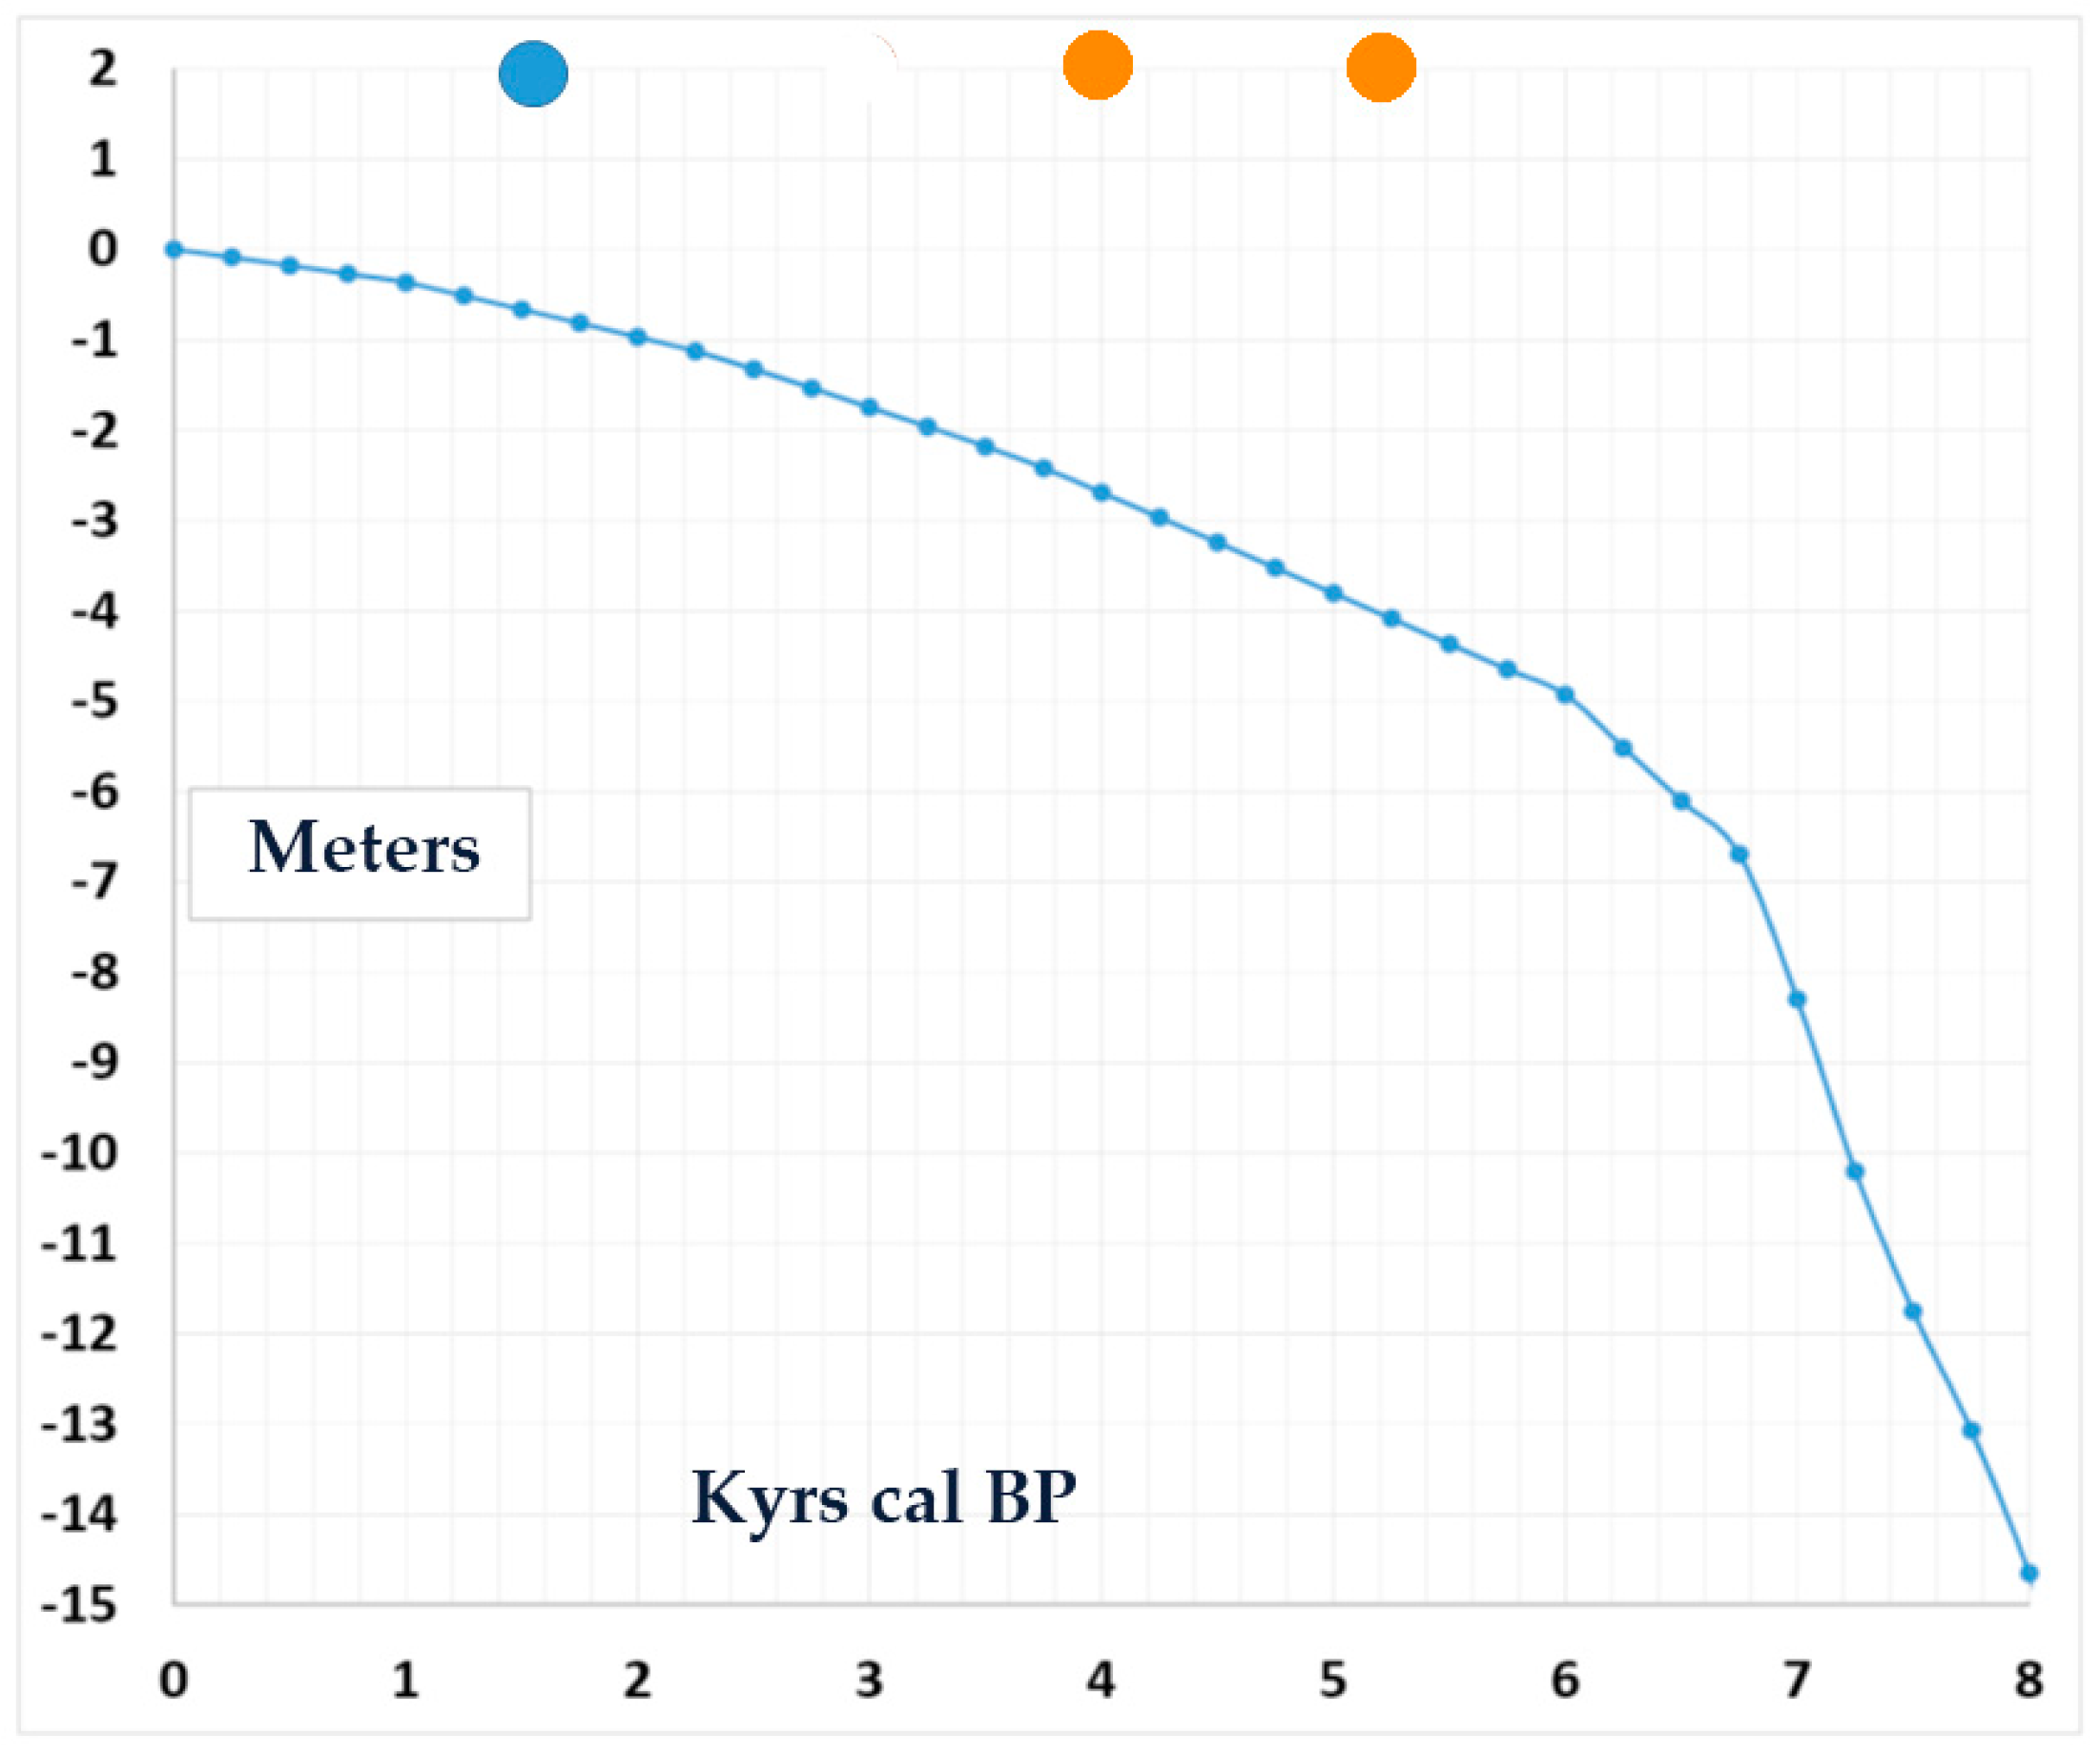
  • Holocene: Most of the data on the Holocene sea level curve in the Mediterranean result from the investigation of continental portions of submerged speleothems, marine overgrowth (serpulids), and Lithophaga boring mussels in samples collected in Italy and Croatia;
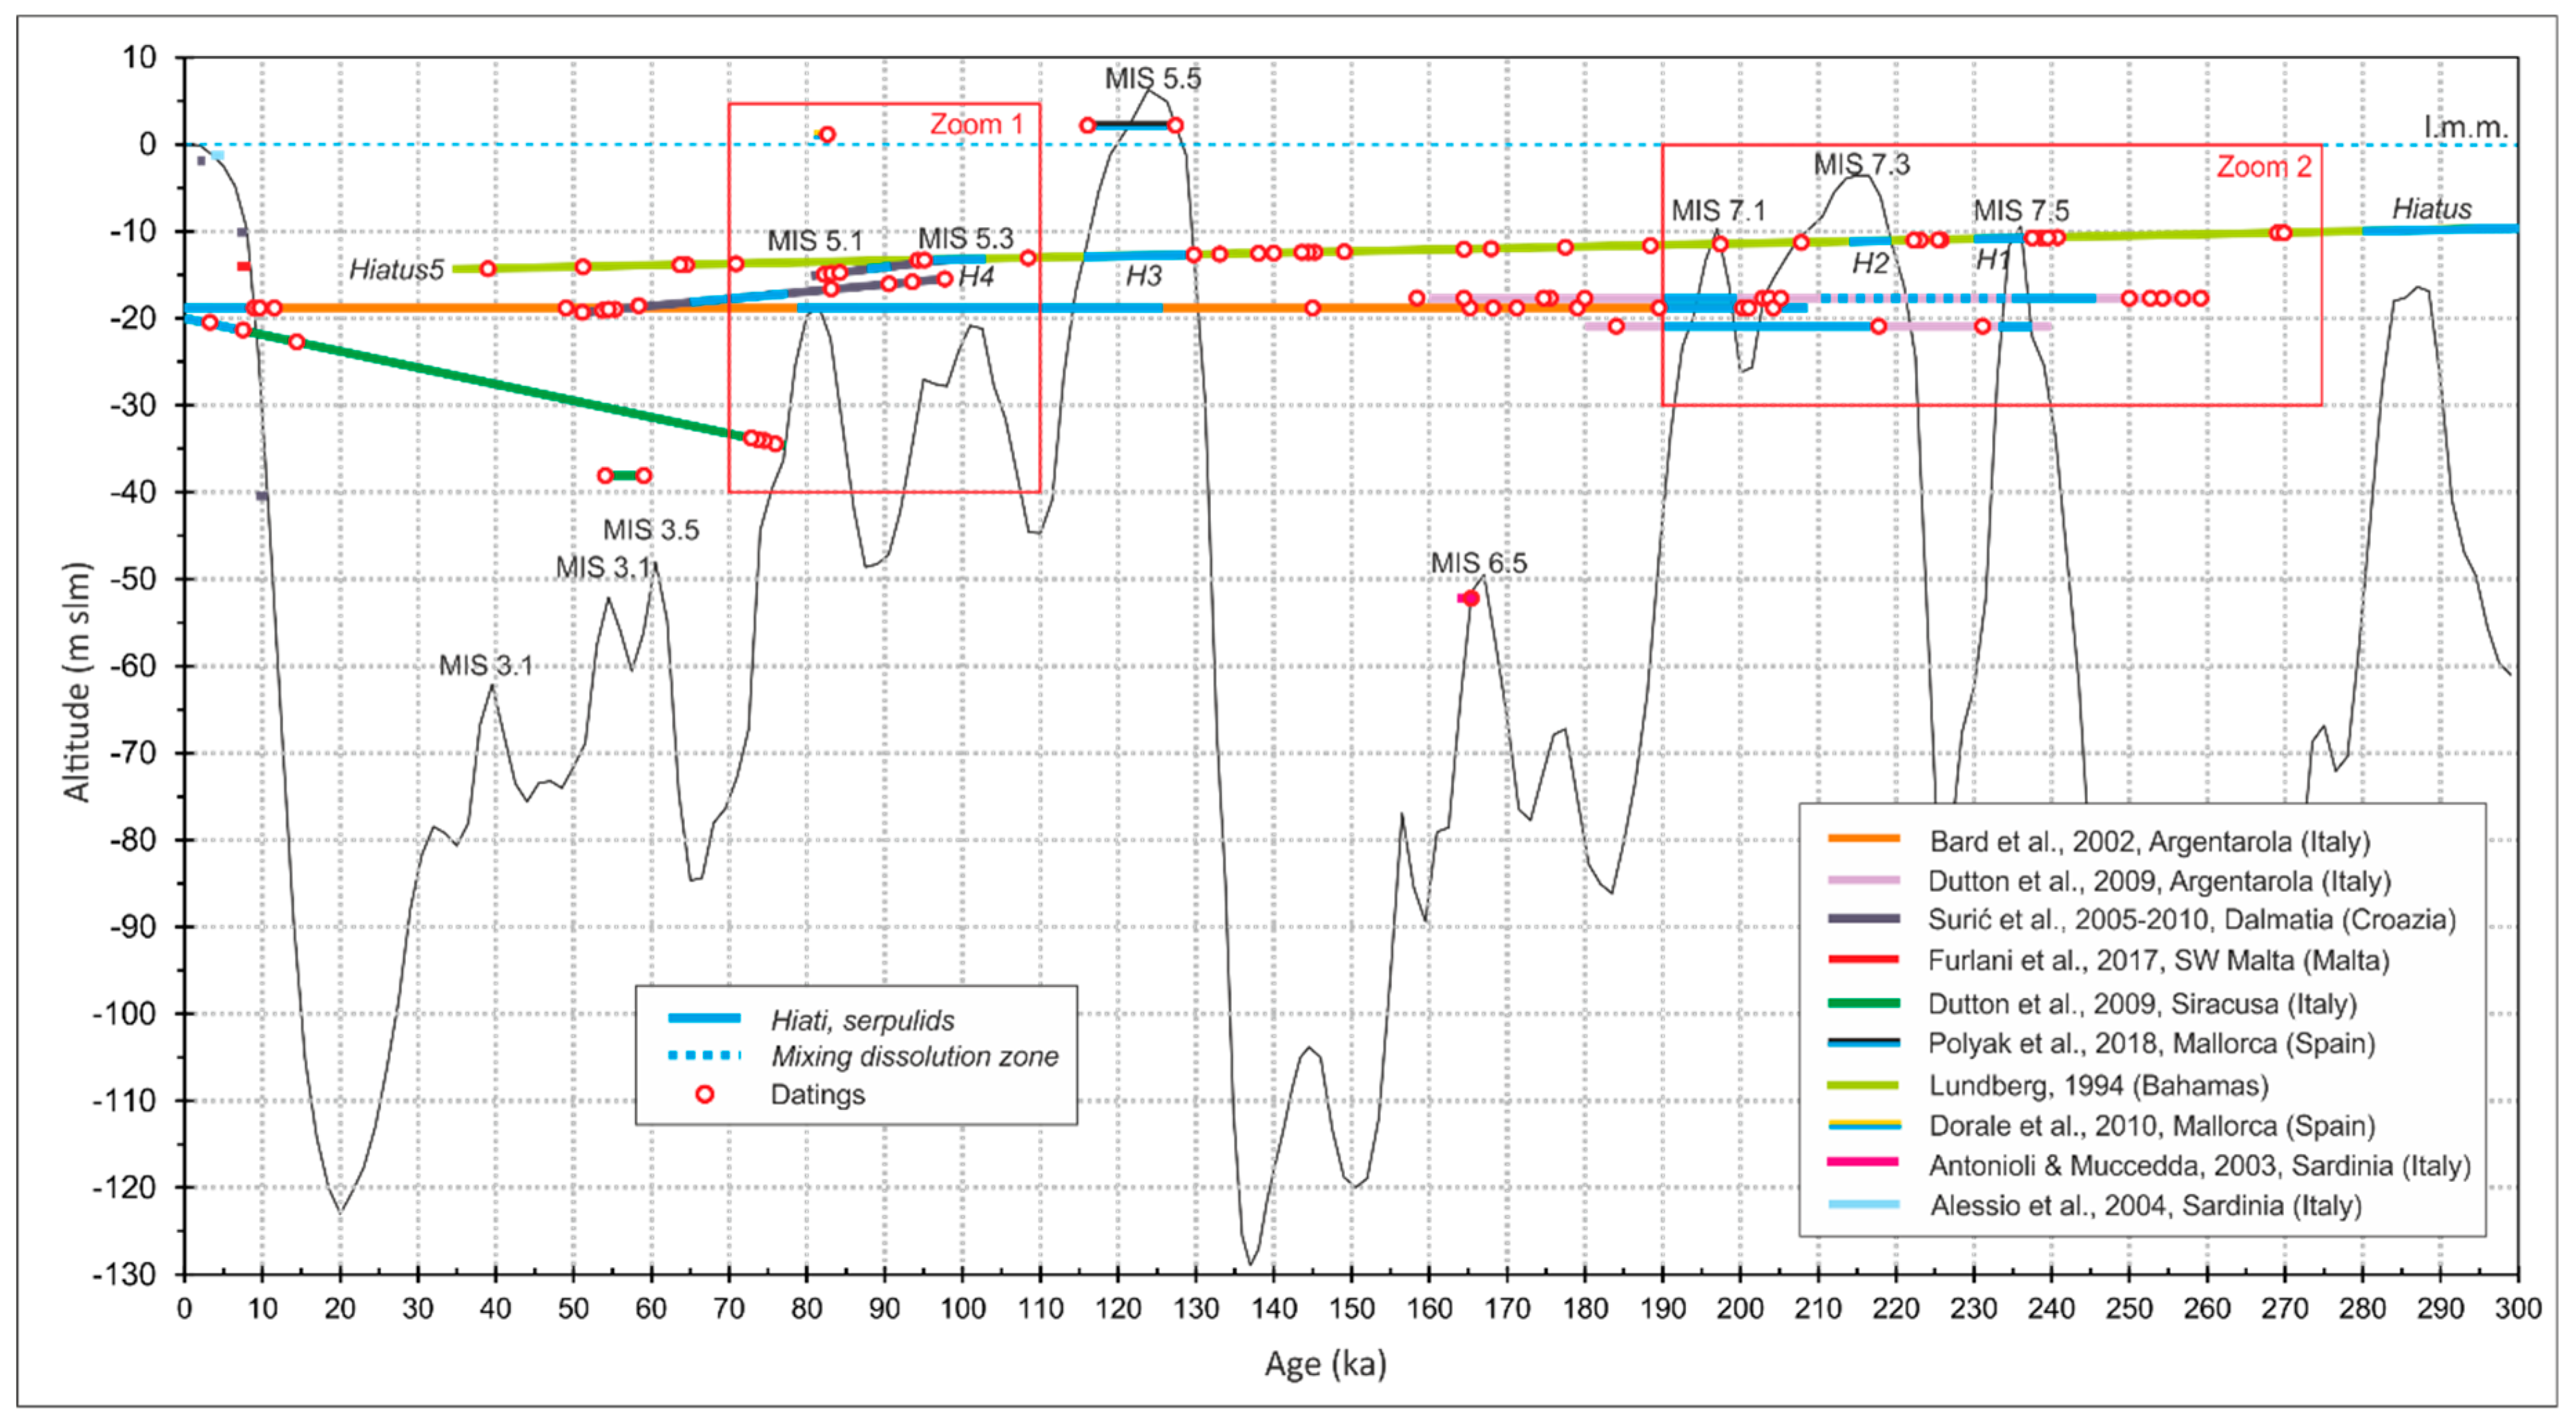
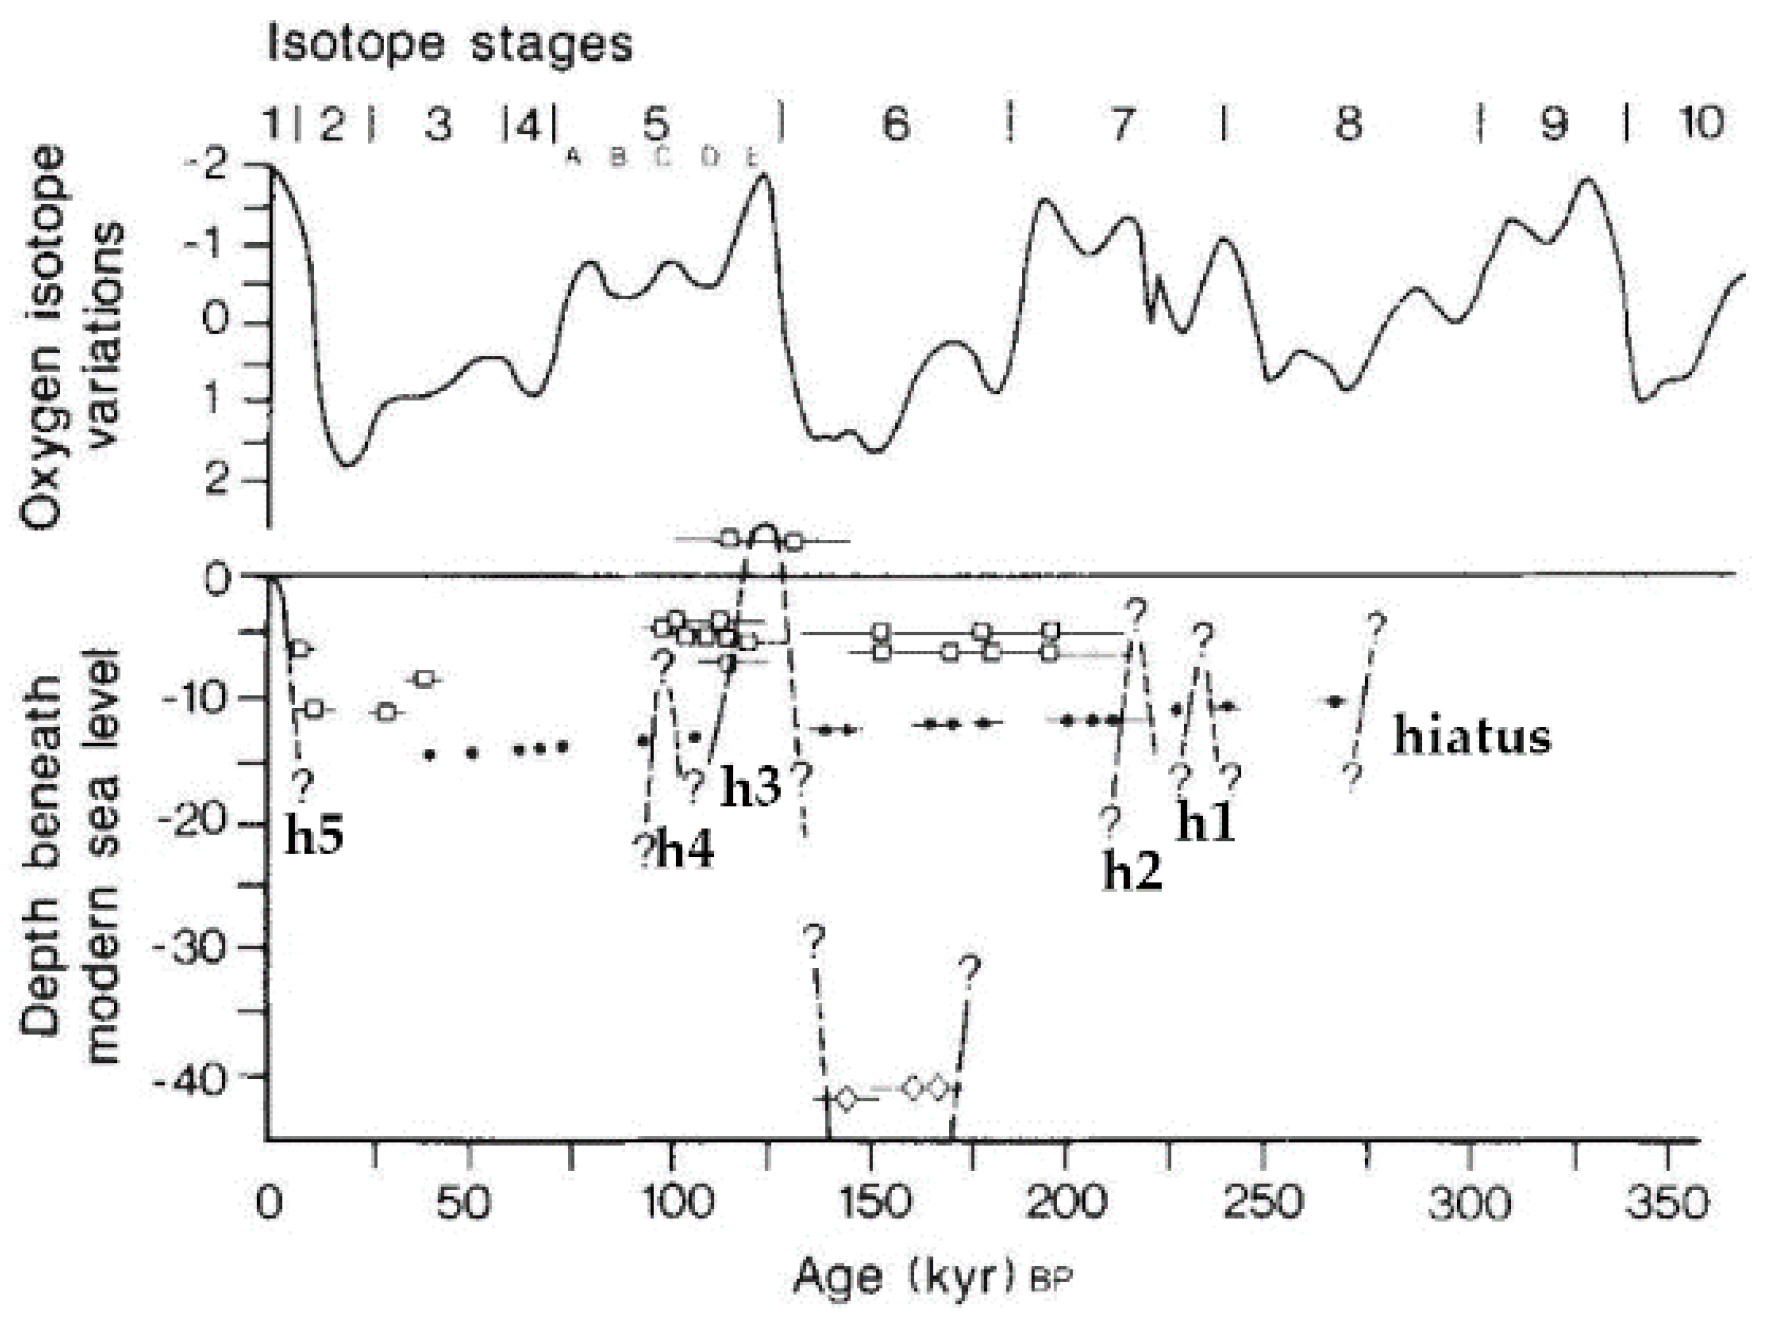
  • MIS 3: The K-14 stalagmite from Croatia shows that the sea level during MIS 3 never reached 15 m b.s.l. The sea level during MIS 3 was lower than 21.7 m in Argentarola, lower than 25 m in Marettimo, and lower than 45 m in Sicily. This latter value was corrected for vertical tectonics;
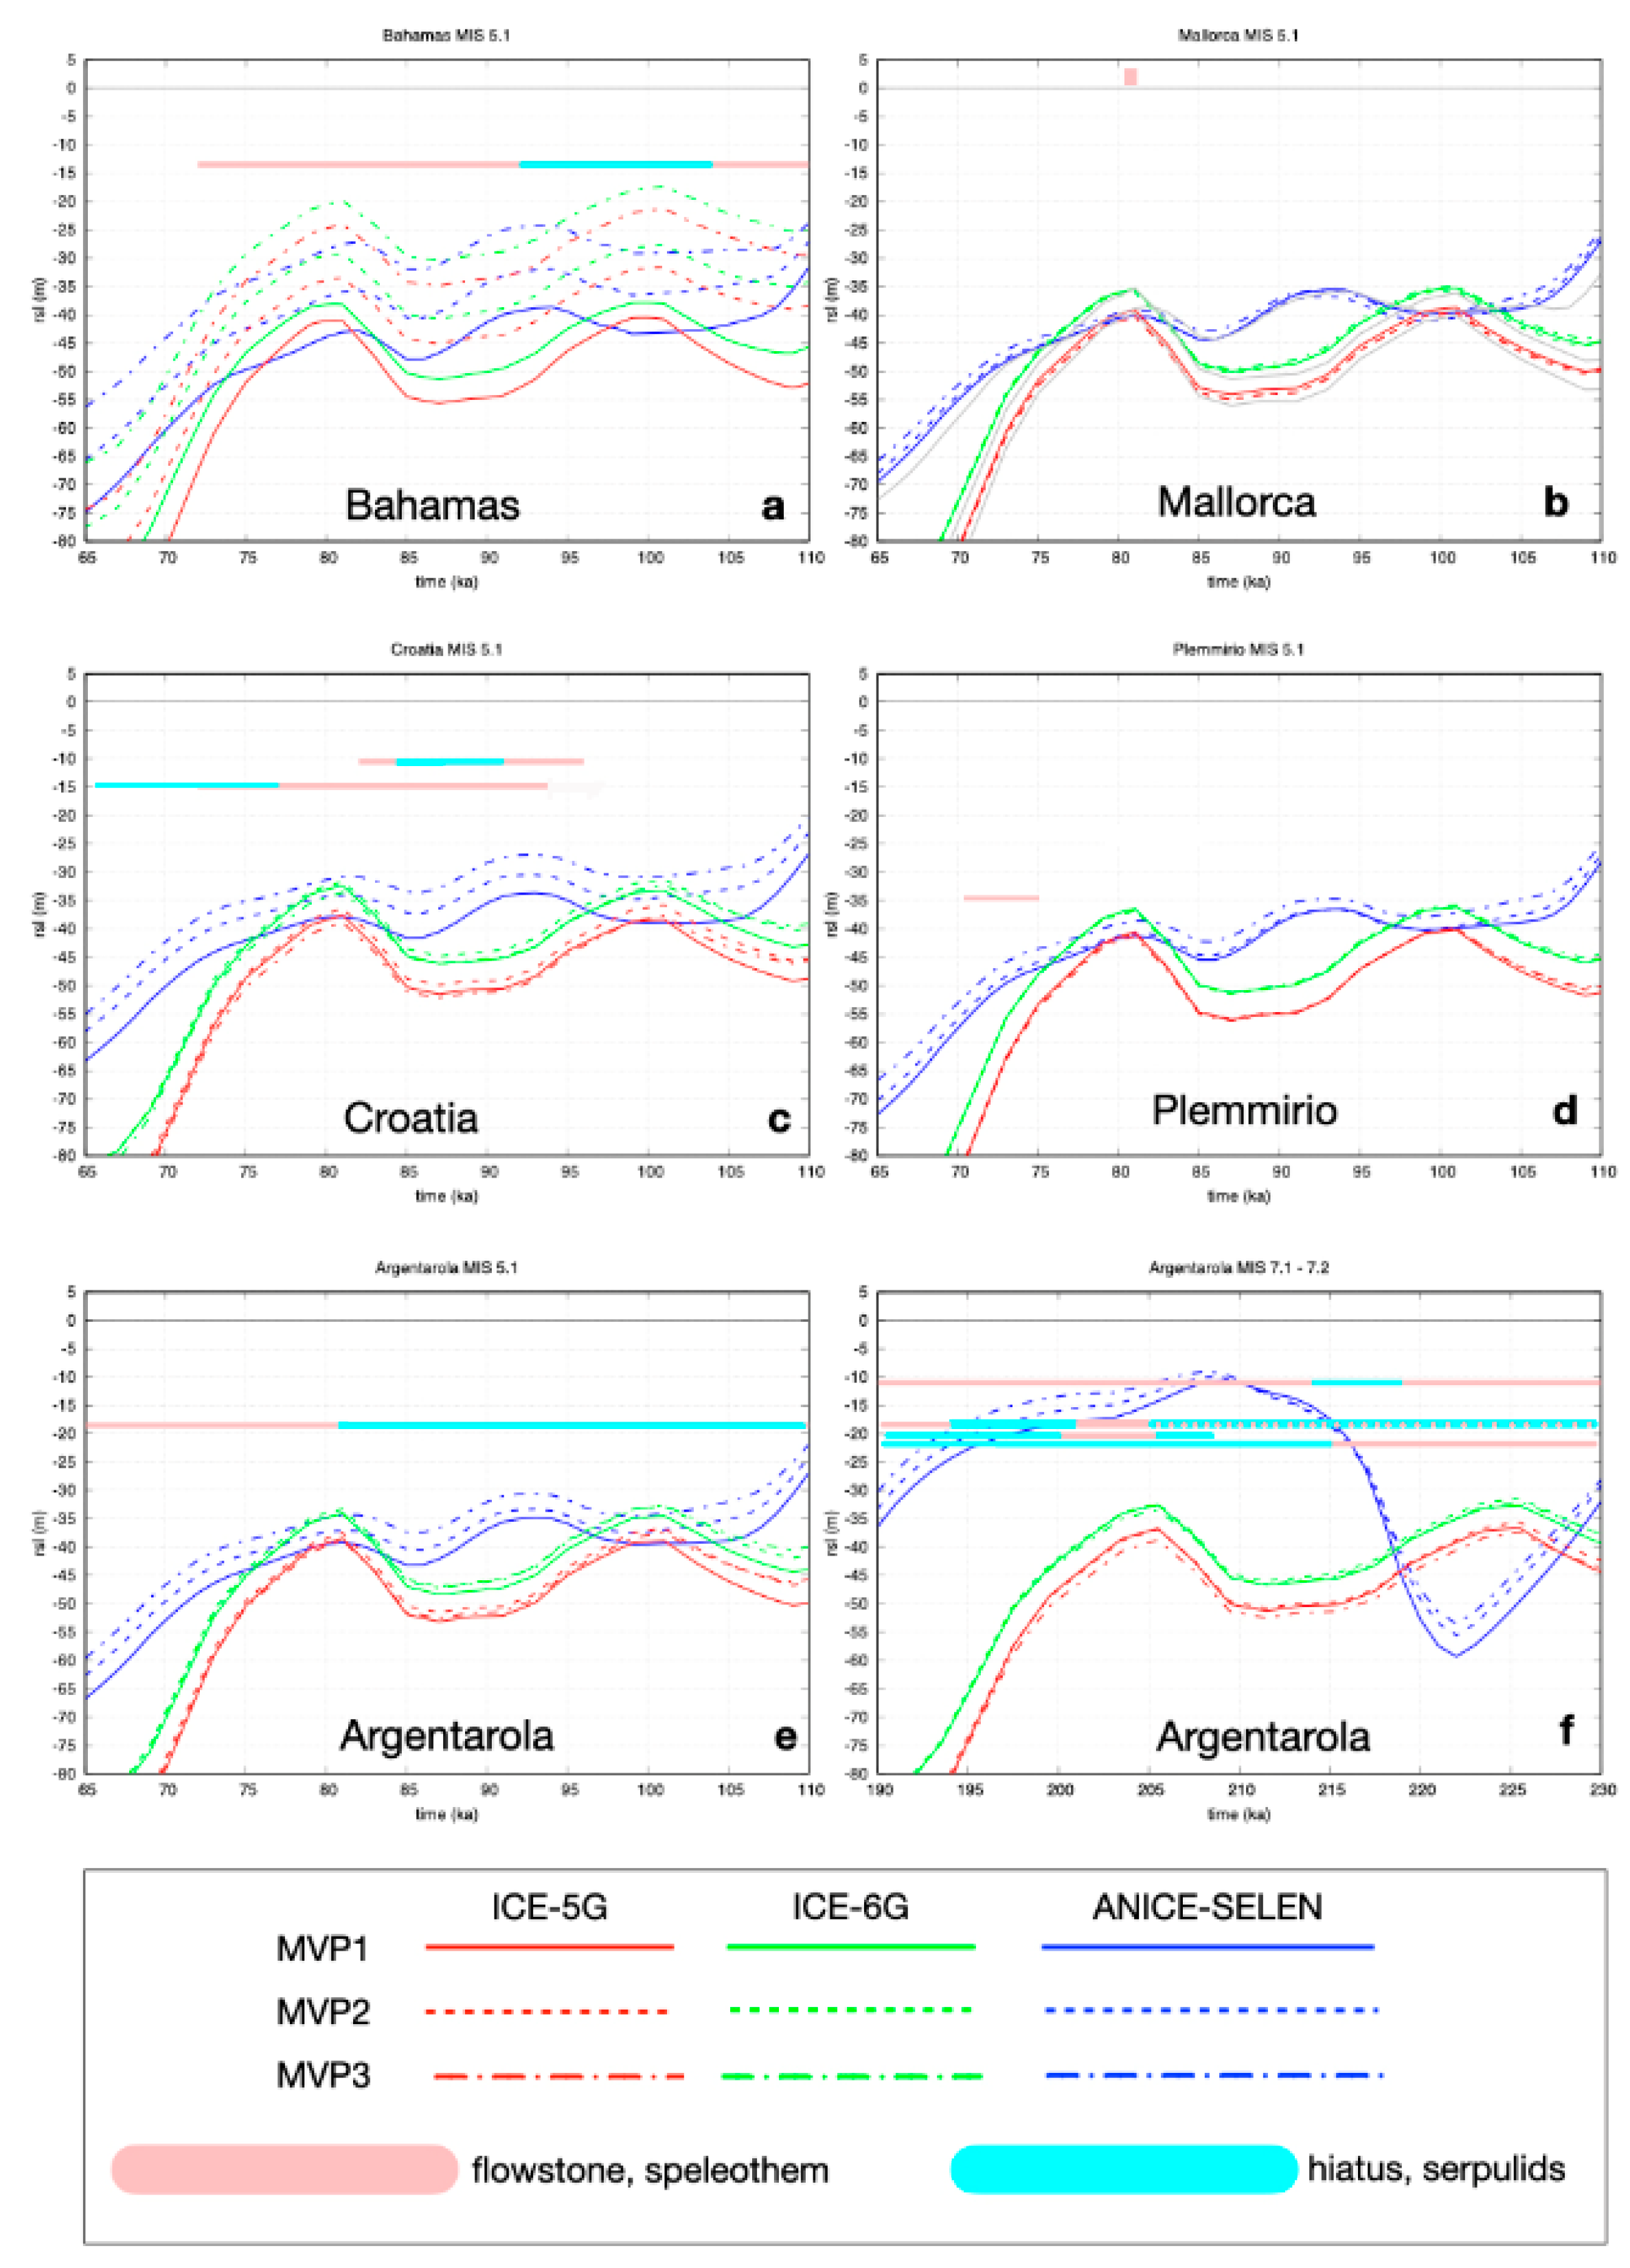
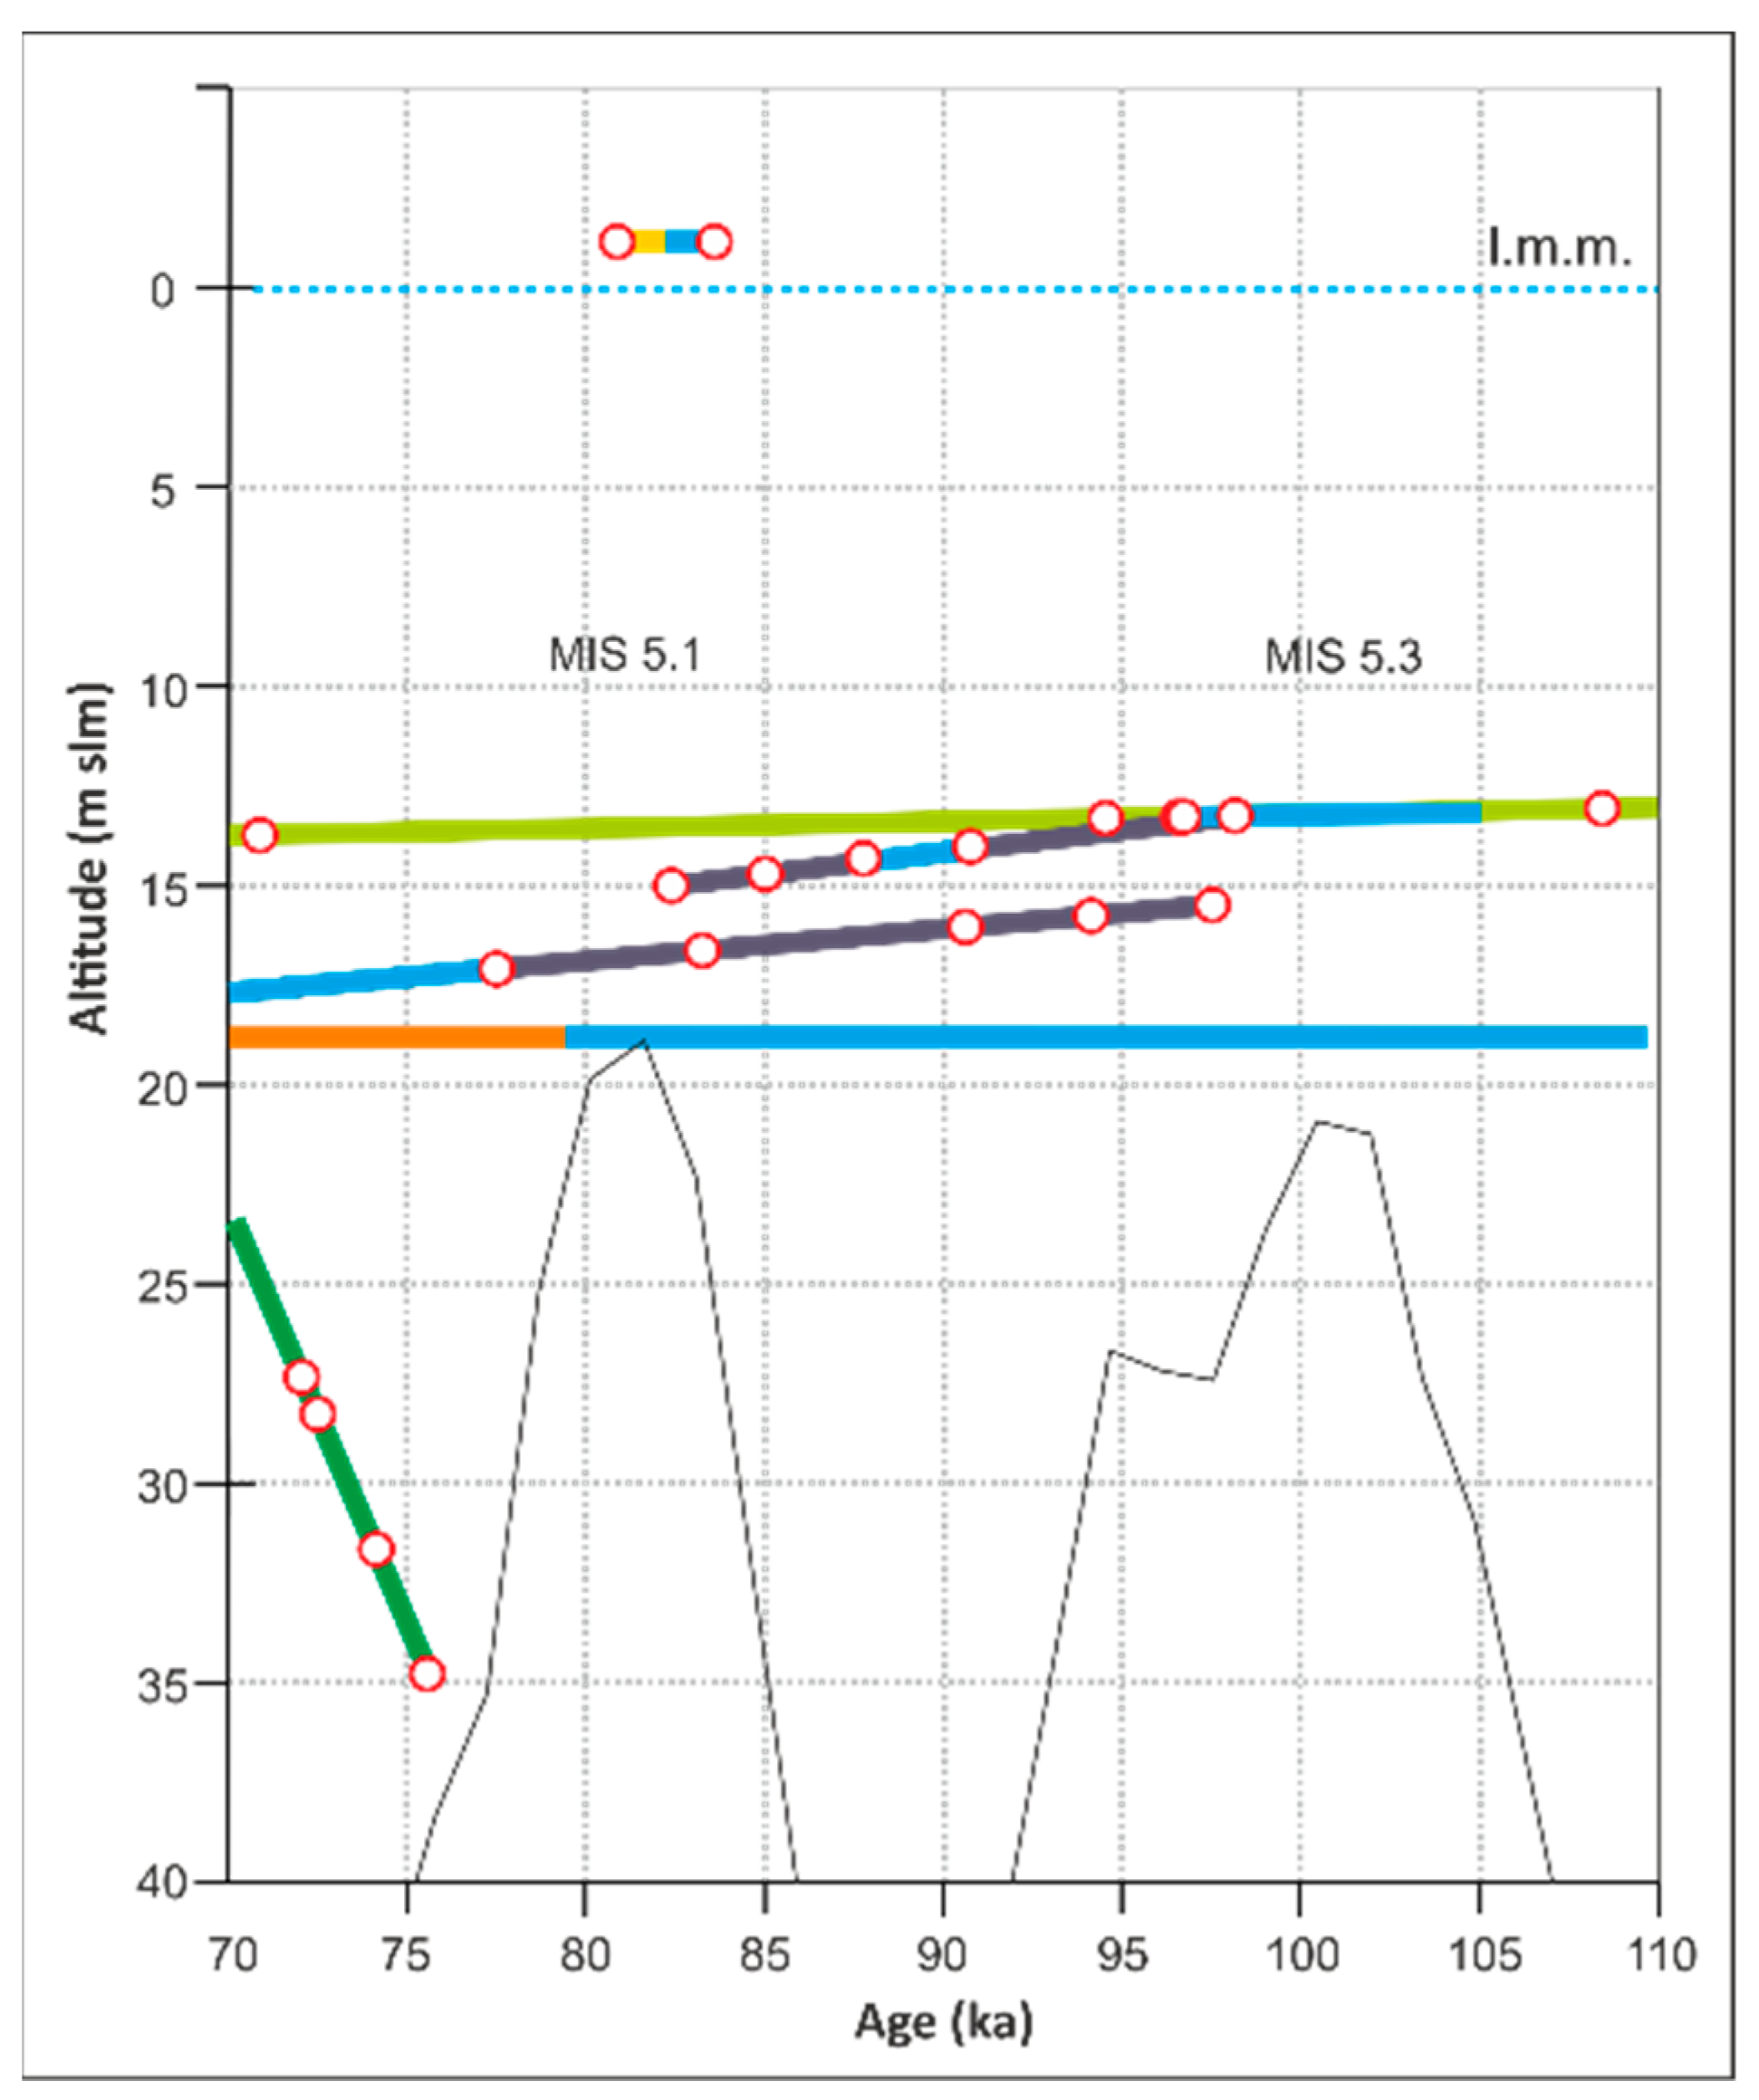
  • MIS 5.1: Samples of phreatic overgrowth on speleothem (POS) collected at 1.5 a.s.l. show a U-Th age of ~81 kyr. However, other speleothem samples from Croatia (K-14 and K-18) and Sicily (Plemm A), collected at a lower elevation (−14.5, −18.8, and −20.2 m, respectively), do not show evidence of growth interruption (hiatus) during MIS 5.1. Ref. [4] estimated a duration of 2.5 kyr for MIS 5.1;
  • MIS 5.3: The sea level highstand corresponding to MIS 5.3 reconstructed by the DWBAH flowstone is higher compared to the global sea level curve reconstructed by [88];
  • MIS 5.5: POS samples in Mallorca record a relative sea level at 2.15 ± 0.75 m [5]. However, other fossil evidence suggests a sea level between 7 and 8 m a.s.l. [36]; [5] reported a duration of 11 kyr for MIS 5.5, from 116 to 127 kyr;
  • MIS 6.5: The deepest stalagmite collected so far in the MS from the Nettuno cave (Sardinia) at −52 m and dated to ~165 kyr [81] suggests that the sea level was lower than the elevation of the submerged sample;
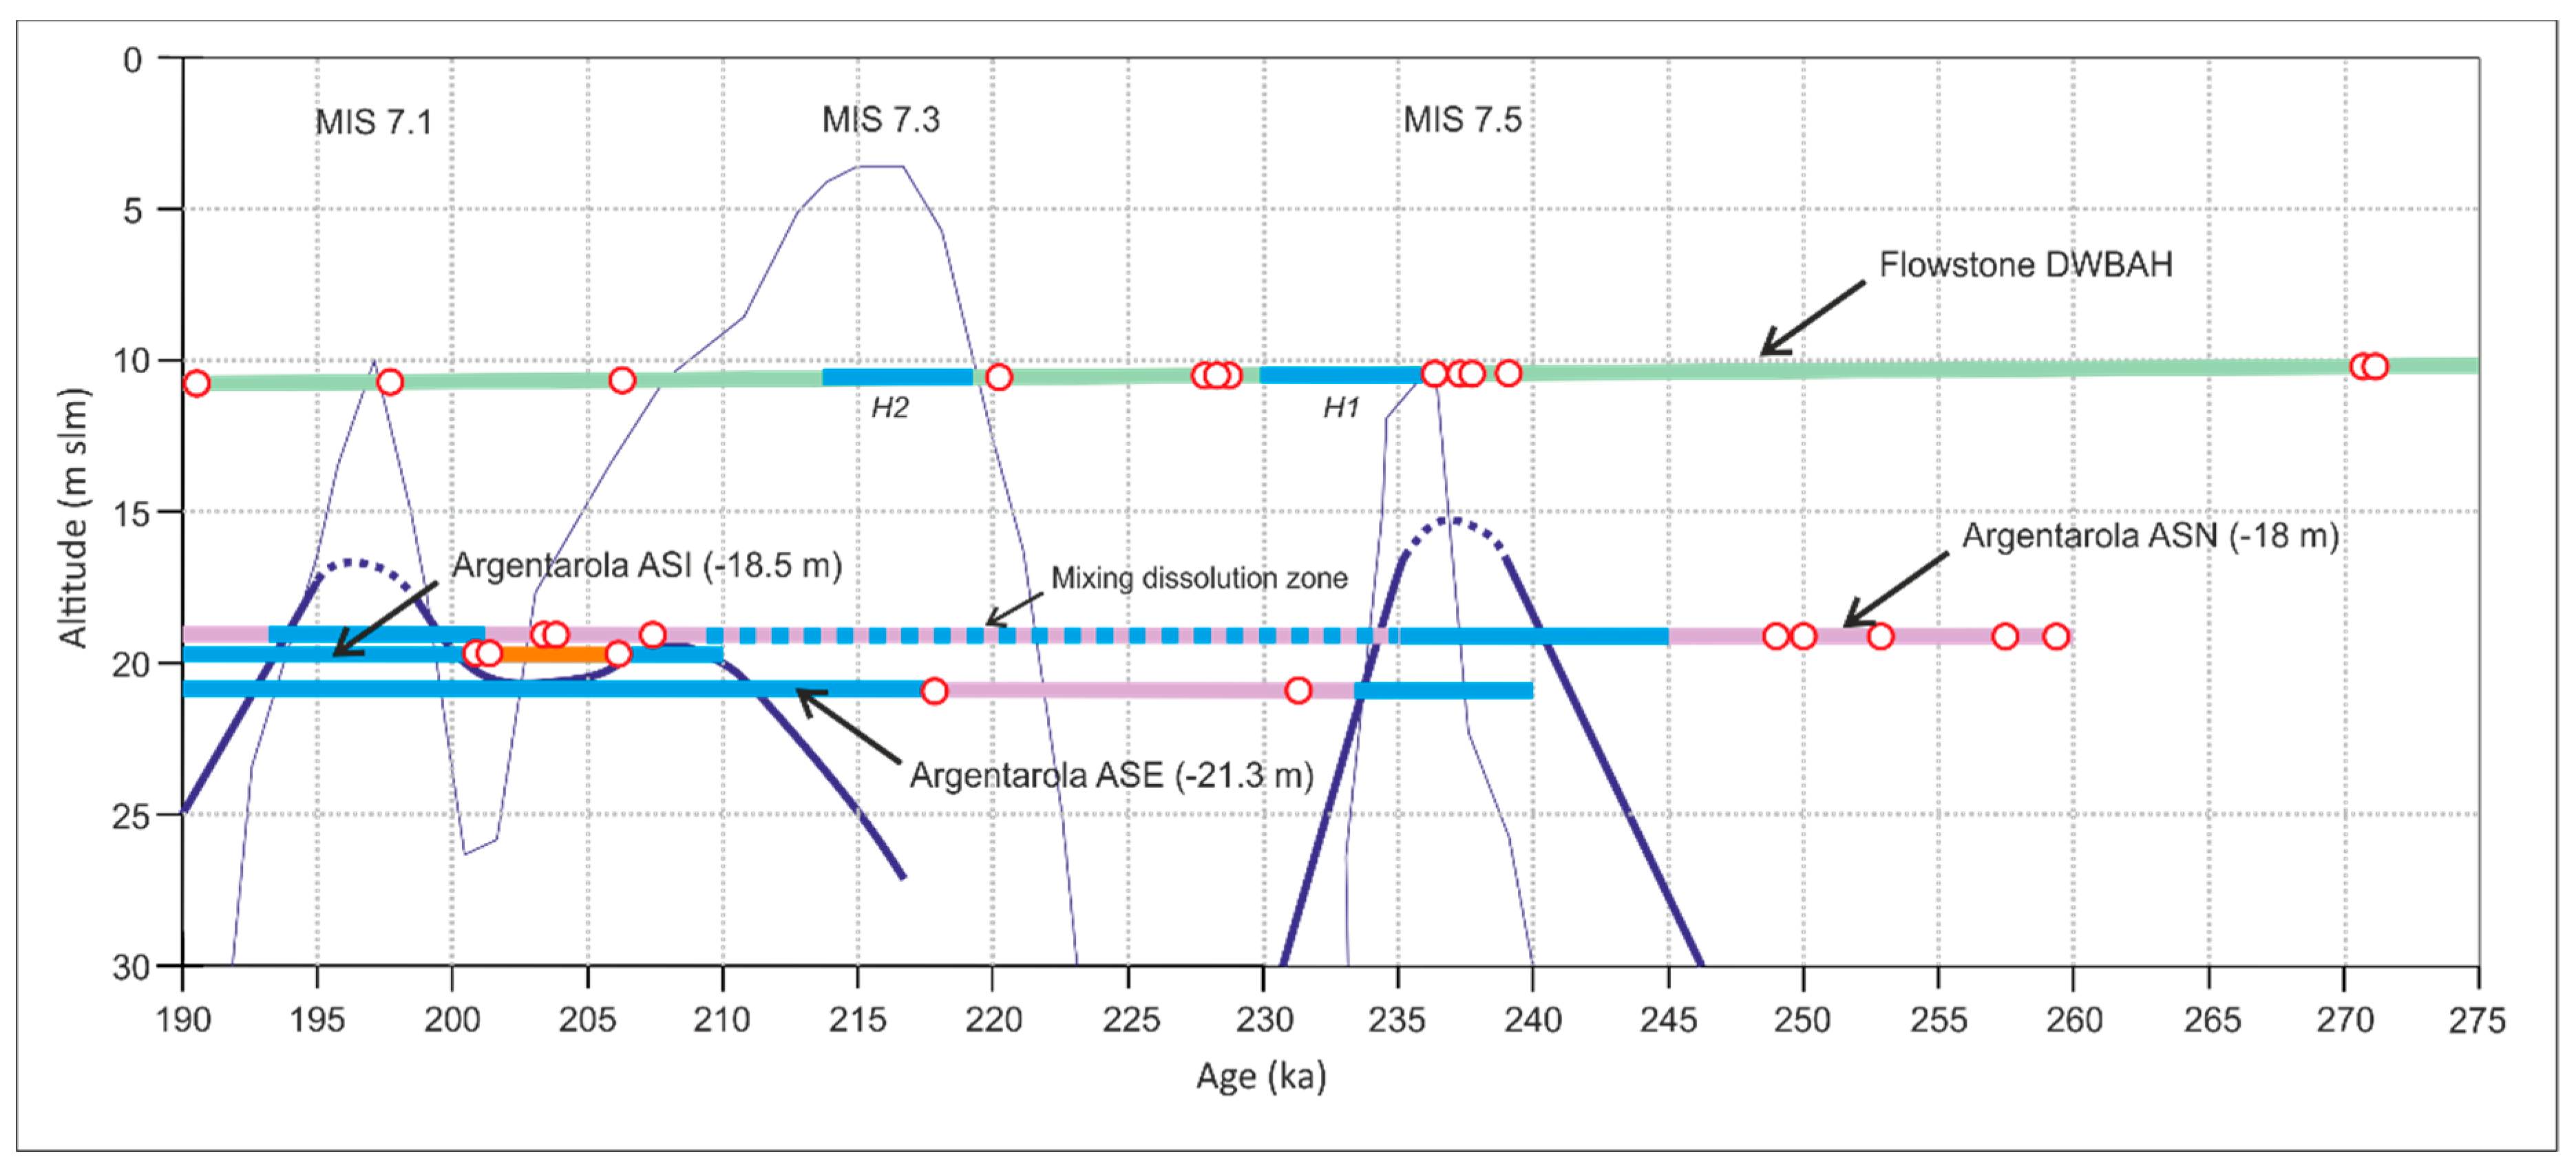
  • MIS 7.1: Three speleothems from the Argentarola cave (Figure 13) clearly show a serpulid layer between MIS 6 and MIS 7.2 [2,22]. The sea level was therefore higher than 18 m b.s.l. Based on the results from the DWBAH flowstone, lacking a hiatus at 197 kyr [11], the sea level was lower than 12 m b.s.l., in agreement with the global sea level [88]. The duration of the sea level highstand was between 201.5 and 198.7 kyr [22];
  • MIS 7.2: The highstand is represented in the Argentarola cave. The sea level stillstand between 18.5 and 21 m b.s.l. is quite similar to the global curve that reaches 27 m b.s.l.;
  • MIS 7.3: Based on the results from the stalagmites of the Argentarola cave (Figure 13), the sea level was slightly lower than 18 m b.s.l. In fact, speleothems record the presence of the sea at 21.3 and 18.5 m b.s.l. Therefore, the results from Mediterranean speleothems reduce the elevation of the MIS 7.3 highstand, reconstructed from the global sea level curve [88]. However, the DWBAH flowstone shows a hiatus during MIS 7.3, which seems to be older than the marine layers from the Argentarola stalagmites. The duration of the sea level highstand was between 217.2 and 201.6 kyr [22];
  • MIS 7.5: The results from the stalagmites of the Argentarola cave and DWBAH flowstone indicate that the sea level was between 18 and 12 m b.s.l., again in agreement with the global sea level curve [88]. The duration of the sea level highstand was between 248.9 and 231.0 kyr [22].
Some GIA models have been published for the Mediterranean basin [5,36,38]. The latter two models have been tested in the field, with a comparison of coastal fossil deposits dated to MIS 5.5 and fossil tidal notches of the same age. The maximum reported differences for the entire Mediterranean basin for MIS 5.5 are less than 2.5 m in elevation. This value is consistent with the predicted GIA-driven RSL variability within the Mediterranean basin during MIS 5.5.
Here, we show, for the first time, that the regional RSL variability increases during interstadials MIS 5.1–5.3 and glacials (MIS 2), most likely as a consequence of the ice-loading-induced spatial RSL gradients. However, because the GIA signal also depends on Earth rheology, this further complicates the search for eustatic constraints in the Mediterranean Basin.
Overall, we argue that the observations call for a revised eustatic value (i.e., ice sheet volume) during MIS 5.1–5.3 and MIS 7.1–3. In particular, we speculate that a reduction of the ice sheet volume, and thus an increase of the eustatic value, is needed for MIS 5.1–5.3. This is consistent with the recent findings of [99], which are based on a novel ice sheet modeling technique.
In particular, for MIS 5.1, based on the elevations below sea level observed in the ASI stalagmite (Figure 13 and Figure 15, Table 3) between the well-dated continental layers of MIS 6 and MIS 3 at −18 m [2,21] and the elevation of the Bahamian flowstone [5] at −13.5 m, which is considered mid-field like the Mediterranean (Figure 7 and Figure 8), and therefore comparable with the Mediterranean speleothems described in Figure 13, Figure 14 and Figure 15, it is possible to hypothesize a eustatic altitude of MIS 5.1 of approximately −16 m (average between −18.5 and −13.5 m). According to Figure 12, the Mallorca site is located around this eustatic altitude, while the Croatian site (samples K-14 and K-18, Table 4) would be raised for isostatic reasons by about 7 m, in agreement with [99] and the novel ice sheet modeling technique described.
However, we also argue that the high value observed in Mallorca (1.5 m above m.s.l.) cannot be reconciled with GIA and would require a drastic reduction of the ice sheet volume, which is not required at other sites.

Author Contributions

Conceptualization: F.A., P.M. and P.S.; Data curation: F.A., P.M. and P.S.; Formal analysis: F.A., S.F., P.M., P.S.; Methodology: F.A., S.F., P.M. and P.S.; Visualization: F.A., S.F., P.M. and P.S.; Writing—original draft: F.A., S.F., P.M. and P.S.; Writing—review & editing: F.A., S.F., P.M. and P.S. All authors have read and agreed to the published version of the manuscript.

Funding

This research received no external funding.

Institutional Review Board Statement

The study was conducted according to the guidelines of the Declaration of Helsinki, and approved by the Institutional Review Board (or Ethics Committee) of INGV, CNR University of Trieste.

Informed Consent Statement

Informed consent was obtained from all subjects involved in the study.

Acknowledgments

We greatly acknowledge two anonymous reviewers who gave us the opportunity to increase the clarity of our manuscript, as well as Edouard Bard, David Richards, Gianfranco Scicchitano, Maša Surić, and Joaquin Gines for discussions. We also thank Derek Ford, Joyce Lundberg, Mauro Mucedda, Maša Surić, and Paola Tuccimei for sending photos or papers and Edwige Pons-Branchu for the U-Th dating of the speleothem from Palinuro.

Conflicts of Interest

The authors declare no conflict of interest.

Appendix A

Figure A1. Tide amplitude and POS accretion, redrawn from [29].
Geosciences 11 00077 g0a1
Figure A2. GIA for Caribbean Islands and Florida (redrawn from [39]).
Geosciences 11 00077 g0a2
Figure A3. U-Th ages vs. the sampling depth of the flowstone DWBAH (redrawn from [1]).
Geosciences 11 00077 g0a3
Table A1. Ages of the flowstone DWBAH [11] corrected for the detrital 230Th component. Age re-calculated represents the age re-calculated using the most recent 230Th, 234U, and 238U decay constants of [72,73]. Age cor. represents the age corrected for the detrital 230Th fraction using an initial 230Th/232Th activity ratio of 0.8 ± 0.8, as suggested by [75] for the speleothems from the Bahamas.
SampleU conc.234U/238U230Th/234U230Th/232ThAge uncor.−22Age re-calculatedAge cor.
(ppm)Act.At.Act.(kyr)(kyr)(kyr)(kyr)(kyr)
10.141.070.85200196.977197.9197.6
20.131.070.823621779.411.1180.2180.0
40.121.060.791499164.11011.7165.6165.6
50.131.060.816821771010.5175.7175.6
60.141.060.8562168.24.14.1170.5170.4
70.151.060.5884994.38.28.893.693.5
8/900.131.060.72202129.54.44.4129.0128.9
100.131.060.741466144.19.410.5143.8143.8
10r0.131.060.731635138.91010.5139.9139.9
110.211.070.8467188.75.34.7191.7190.7
120.281.070.7264133.62.32.3135.7134.8
130.161.060.5819692.62.62.393.693.3
140.151.060.48145970.63.84.170.870.7
14r0.151.060.45139564.54.44.464.864.7
150.191.060.45125064.21.21.264.864.7
160.151.060.451236645.35.664.864.7
170.081.020.387995155.152.052.0
180.121.050.323739.11.41.438.838.7
F0.161.060.7418641433.52.9143.8143.8
G0.181.060.752484145.94.74.7147.8147.8
H0.21.060.7526421494.14.7147.8147.8
I0.21.060.7324611405.95.3139.9139.9
N0.211.060.89228226.28.28.2228.5228.2
P0.261.050.91567241.477239.3239.3
Q0.341.060.9854236.711.714.1237.3237.2
Qr0.341.050.93963269.521.125.8271.6271.5
R0.381.050.97133328.118.823.4337.5337.0
A10.091.050.861285208.622.328.1207.0206.9
T10.141.060.91573239.119.923.4237.3237.3
T20.141.060.89121522511.715.2228.5228.5
T40.221.060.8917322575.9228.5228.1
T4r0.211.060.88223222.79.48.2220.4220.1
B10.221.060.9769240.29.310.5237.3237.2
B20.161.050.93186274.29.49.4271.6271.2
Y0.251.040.64278108.42.93.2110.4110.2

References

  1. Li, W.X.; Lundberg, J.; Dickin, A.P.; Ford, D.C.; Schwarcz, H.P.; McNutt, R.; Williams, D. High-precision mass-spectrometric uranium-series dating of cave deposits and implications for palaeoclimate studies. Nature 1989, 339, 534–536. [Google Scholar] [CrossRef]
  2. Bard, E.; Antonioli, F.; Silenzi, S. Sea-level during the penultimate interglacial period based on a submerged stalagmite from Argentarola Cave (Italy). Earth Planet. Sci. Lett. 2002, 196, 135–146. [Google Scholar] [CrossRef]
  3. Surić, M.; Richards, D.A.; Hoffmann, D.L.; Tibljaš, D.; Juračić, M. Sea-level change during MIS 5a based on submerged speleothems from the eastern Adriatic Sea (Croatia). Mar. Geol. 2009, 262, 62–67. [Google Scholar] [CrossRef]
  4. Dorale, J.A.; Onac, B.P.; Fornós, J.J.; Ginés, J.; Ginés, A.; Tuccimei, P.; Peate, D.W. Sea-level highstand 81, 000 years ago in mallorca. Science 2010, 327, 860–863. [Google Scholar] [CrossRef]
  5. Polyak, V.J.; Onac, B.P.; Fornós, J.J.; Hay, C.; Asmerom, Y.; Dorale, J.A.; Ginés, J.; Tuccimei, P.; Ginés, A. A highly resolved record of relative sea level in the western Mediterranean Sea during the last interglacial period. Nat. Geosci. 2018, 11, 860–864. [Google Scholar] [CrossRef]
  6. Stocchi, P.; Antonioli, F.; Montagna, P.; Pepe, F.; Lo Presti, V.; Caruso, A.; Corradino, M.; Dardanelli, G.; Renda, P.; Frank, N.; et al. A stalactite record of four relative sea-level highstands during the Middle Pleistocene Transition. Quat. Sci. Rev. 2017, 173, 92–100. [Google Scholar] [CrossRef] [Green Version]
  7. Grund, A. Die Karsthydrographie: Studien aus Westbosnien. Geogr. Abhandungen 1903, 7, 1–200. [Google Scholar]
  8. Spalding, R.F.; Mathews, T.D. Stalagmites from caves in the Bahamas: Indicators of low sea level stand. Quat. Res. 1972, 2, 470–472. [Google Scholar] [CrossRef]
  9. Ginés, A.; Ginés, J. Consideraciones sobre los mecanismos de fosilización de la “Cova de Sa Bassa Blanca” y su paralelismo con formaciones marinas del Cuaternario. Bolletí la Soc. d’Història Nat. les Balear. 1974, 19, 11–28. [Google Scholar]
  10. Richards, D.A.; Smart, P.L.; Lawrence Edwards, R. Maximum sea levels for the last glacial period from U-series ages of submerged speleothems. Nature 1994, 367, 357–360. [Google Scholar] [CrossRef]
  11. Lundberg, J.; Ford, D.C. Late pleistocene sea level change in the Bahamas from mass spectrometric U-series dating of submerged speleothem. Quat. Sci. Rev. 1994, 13, 1–14. [Google Scholar] [CrossRef]
  12. Furlani, S.; Cucchi, F.; Biolchi, S. Late Holocene widening of Karst voids by marine processes in partially submerged coastal caves (Northeastern Adriatic Sea). Geogr. Fis. Din. Quat. 2012, 35, 129–140. [Google Scholar]
  13. Sunamura, T. Geomorphology of Rocky Coasts; John Wiley & Sons: Chichester, UK, 1992; ISBN 0471917753. [Google Scholar]
  14. Mylroie, J.E.; Carew, J.L. The flank margin model for dissolution cave development in carbonate platforms. Earth Surf. Process. Landforms 1990, 15, 413–424. [Google Scholar] [CrossRef]
  15. Iliffe, T.M. Anchialine Cave Biology. In The Natural History of Biospeleology; Camach, A.I., Ed.; Museo Nacional De Ciencias Naturales: Madrid, Spain, 1992; pp. 615–636. [Google Scholar]
  16. Amorosi, A.; Antonioli, F.; Bertini, A.; Marabini, S.; Mastronuzzi, G.; Montagna, P.; Negri, A.; Rossi, V.; Scarponi, D.; Taviani, M.; et al. The Middle-Upper Pleistocene Fronte Section (Taranto, Italy): An exceptionally preserved marine record of the Last Interglacial. Glob. Planet. Change 2014, 119, 23–38. [Google Scholar] [CrossRef]
  17. Peirano, A.; Morri, C.; Bianchi, C.N.; Rodolfo-Metalpa, R. Biomass, Carbonate standing stock and production of the mediterranean coral Cladocora caespitosa (L.). Facies 2001, 44, 75–80. [Google Scholar] [CrossRef]
  18. Aguirre, J.; Jiménez, A.P. Fossil analogues of present-day Cladocora caespitosa coral banks: Sedimentary setting, dwelling community, and taphonomy (Late Pliocene, W Mediterranean). Coral Reefs 1998, 17, 203–213. [Google Scholar] [CrossRef]
  19. Alessio, M.; Allegri, L.; Antonioli, F.; Belluomini, G.; Impronta, S.; Manfra, L.; Preite, M. La curva di risalita del Mare Tirreno negli ultimi 43 ka ricavata da datazioni su speleotemi sommersi e dati archeologici. Mem. Descr. Serv. Geol. Naz. 1994, 52, 261–276. [Google Scholar]
  20. Antonioli, F.; Silenzi, S.; Frisia, S. Tyrrhenian Holocene palaeoclimate trends from spelean serpulids. Quat. Sci. Rev. 2001, 20, 1661–1670. [Google Scholar] [CrossRef]
  21. Antonioli, F.; Bard, E.; Potter, E.K.; Silenzi, S.; Improta, S. 215-ka history of sea-level oscillations from marine and continental layers in Argentarola Cave speleothems (Italy). Glob. Planet. Change 2004, 43, 57–78. [Google Scholar] [CrossRef]
  22. Dutton, A.; Bard, E.; Antonioli, F.; Esat, T.M.; Lambeck, K.; McCulloch, M.T. Phasing and amplitude of sea-level and climate change during the penultimate interglacial. Nat. Geosci. 2009, 2, 355–359. [Google Scholar] [CrossRef]
  23. Surić, M.; Juračić, M.; Horvatinčić, N.; Krajcar Bronić, I. Late Pleistocene-Holocene sea-level rise and the pattern of coastal karst inundation: Records from submerged speleothems along the Eastern Adriatic Coast (Croatia). Mar. Geol. 2005, 214, 163–175. [Google Scholar] [CrossRef]
  24. Surić, M.; Jalžić, B.; Petricioli, P. Submerged Speleothemes—Expect the Unexpected. Examples from the Eastern Adriatic Coast (Croatia). Acta Carsologica 2007, 36, 389–396. [Google Scholar] [CrossRef] [Green Version]
  25. Surić, M.; Juračić, M. Late Pleistocene—Holocene environmental changes—Records from submerged speleothems along the Eastern Adriatic coast (Croatia). Geol. Croat. 2010, 63, 155–169. [Google Scholar] [CrossRef]
  26. Antonioli, F.; Oliverio, M. Holocene Sea-Level Rise Recorded by a Radiocarbon-Dated Mussel in a Submerged Speleothem beneath the Mediterranean Sea. Quat. Res. 1996, 45, 241–244. [Google Scholar] [CrossRef]
  27. Ginés, J.; Ginés, A.; Fornós, J.J.; Tuccimei, P.; Onac, B.; Gràcia, F. Phreatic overgrowth on speleothems (POS) from Mallorca, Spain: Updating forty years of research. In Mallorca: A Mediterranean Benchmark for Quaternary Studies, 18; Societat d’Història Natural de les. Balears: Palma, Spain, 2012; pp. 111–146. ISBN 978-84-7632-995-5. [Google Scholar]
  28. Vesica, P.L.; Tuccimei, P.; Turi, B.; Fornós, J.J.; Ginés, A.; Ginés, J. Late Pleistocene Paleoclimates and sea-level change in the Mediterranean as inferred from stable isotope and U-series studies of overgrowths on speleothems, Mallorca, Spain. Quat. Sci. Rev. 2000, 19, 865–879. [Google Scholar] [CrossRef]
  29. Tuccimei, P.; Soligo, M.; Ginés, J.; Ginés, A.; Fornós, J.; Kramers, J.; Villa, I.M. Constraining Holocene sea levels using U-Th ages of phreatic overgrowths on speleothems from coastal caves in Mallorca (Western Mediterranean). Earth Surf. Process. Landforms 2010, 35, 782–790. [Google Scholar] [CrossRef]
  30. Gascoyne, M.; Benjamin, G.J.; Schwarcz, H.P.; Ford, D.C. Sea-level lowering during the Illinoian glaciation: Evidence from a Bahama “blue hole”. Science 1979, 205, 806–808. [Google Scholar] [CrossRef]
  31. Harmon, R.S.; Land, L.S.; Mitterer, R.M.; Garrett, P.; Schwarcz, H.P.; Larson, G.J. Bermuda sea level during the last interglacial. Nature 1981, 289, 481–483. [Google Scholar] [CrossRef]
  32. Moseley, G.; Smart, P.L.; Richards, D.A.; Hoffmann, D.L. Speleothem constraints on marine isotope stage (MIS) 5 relative sea levels, Yucatan Peninsula, Mexico. J. Quat. Sci. 2013, 28, 293–300. [Google Scholar] [CrossRef]
  33. Moseley, G.E.; Richards, D.A.; Smart, P.L.; Standish, C.D.; Hoffmann, D.L.; ten Hove, H.; Vinn, O. Early–middle Holocene relative sea-level oscillation events recorded in a submerged speleothem from the Yucatán Peninsula, Mexico. Holocene 2015, 25, 1511–1521. [Google Scholar] [CrossRef]
  34. De Waele, J.; D’Angeli, I.M.; Bontognali, T.; Tuccimei, P.; Scholz, D.; Jochum, K.P.; Columbu, A.; Bernasconi, S.M.; Fornós, J.J.; Grau González, E.R.; et al. Speleothems in a north Cuban cave register sea-level changes and Pleistocene uplift rates. Earth Surf. Process. Landf. 2018, 43, 2313–2326. [Google Scholar] [CrossRef]
  35. Van Hengstum, P.J.; Richards, D.A.; Onac, B.P.; Dorale, J.A. Coastal caves and sinkholes. In Handbook of Sea-Level Research; John Wiley & Sons, Ltd.: Chichester, UK, 2015; pp. 83–103. [Google Scholar]
  36. Antonioli, F.; Ferranti, L.; Stocchi, P.; Deiana, G.; Lo Presti, V.; Furlani, S.; Marino, C.; Orru, P.; Scicchitano, G.; Trainito, E.; et al. Morphometry and elevation of the last interglacial tidal notches in tectonically stable coasts of the Mediterranean Sea. Earth-Sci. Rev. 2018, 185, 600–623. [Google Scholar]
  37. Muhs, D.R.; Simmons, K.R.; Schumann, R.R.; Schweig, E.S.; Rowe, M.P. Testing glacial isostatic adjustment models of last-interglacial sea level history in the Bahamas and Bermuda. Quat. Sci. Rev. 2020, 233, 106212. [Google Scholar] [CrossRef]
  38. Stocchi, P.; Vacchi, M.; Lorscheid, T.; de Boer, B.; Simms, A.R.; van de Wal, R.S.W.; Vermeersen, B.L.A.; Pappalardo, M.; Rovere, A. MIS 5e relative sea-level changes in the Mediterranean Sea: Contribution of isostatic disequilibrium. Quat. Sci. Rev. 2018, 185, 122–134. [Google Scholar] [CrossRef] [Green Version]
  39. Potter, E.K.; Lambeck, K. Reconciliation of sea-level observations in the Western North Atlantic during the last glacial cycle. Earth Planet. Sci. Lett. 2004, 217, 171–181. [Google Scholar] [CrossRef]
  40. Chen, J.H.; Lawrence Edwards, R.; Wasserburg, G.J. 238U, 234U and 232Th in seawater. Earth Planet. Sci. Lett. 1986, 80, 241–251. [Google Scholar] [CrossRef]
  41. Lawrence Edwards, R.; Chen, J.H.; Wasserburg, G.J. 238U234U230Th232Th systematics and the precise measurement of time over the past 500,000 years. Earth Planet. Sci. Lett. 1987, 81, 175–192. [Google Scholar] [CrossRef] [Green Version]
  42. Bard, E.; Hamelin, B.; Fairbanks, R.G.; Zindler, A.; Mathieu, G.; Arnold, M. U-Th and 14C ages of corals from Barbados and their use for calibrating the 14C time scale beyond 9000 years B.P. Nucl. Inst. Methods Phys. Res. B 1990, 52, 461–468. [Google Scholar] [CrossRef]
  43. Bard, E.; Hamelin, B.; Arnold, M.; Montaggioni, L.; Cabioch, G.; Faure, G.; Rougerie, F. Deglacial sea-level record from Tahiti corals and the timing of global meltwater discharge. Nature 1996, 382, 241–244. [Google Scholar] [CrossRef]
  44. Genty, D.; Massault, M.; Gilmour, M.; Baker, A.; Verheyden, S.; Kepens, E. Calculation of past dead carbon proportion and variability by the comparison of AMS 14C and TIMS U-Th ages on two Holocene stalagmites. Radiocarbon 1999, 41, 251–270. [Google Scholar] [CrossRef] [Green Version]
  45. Tuccimei, P.; van Strydonck, M.; Ginés, A.; Ginés, J.; Soligo, M.; Villa, I.M.; Fornós, J.J. Comparison of 14C and U-Th ages of two holocene phreatic overgrowths on speleothems from Mallorca (Western mediterranean): Environmental implications. Int. J. Speleol. 2011, 40, 1–8. [Google Scholar] [CrossRef] [Green Version]
  46. Woodward, J. The Physical Geography of the Mediterranean; Oxford University Press: Oxford, UK, 2009; ISBN 9780199268030. [Google Scholar]
  47. Furlani, S.; Pappalardo, M.; Gómez-Pujol, L.; Chelli, A. The rock coast of the Mediterranean and Black seas. Geol. Soc. Mem. 2014, 40, 89–123. [Google Scholar] [CrossRef]
  48. Benjamin, J.; Rovere, A.; Fontana, A.; Furlani, S.; Vacchi, M.; Inglis, R.H.; Galili, E.; Antonioli, F.; Sivan, D.; Miko, S.; et al. Late Quaternary sea-level changes and early human societies in the central and eastern Mediterranean Basin: An interdisciplinary review. Quat. Int. 2017, 449, 29–57. [Google Scholar] [CrossRef] [Green Version]
  49. Mather, A. Tectonic Setting and Landscape Development. In The Physical Geography of the Mediterranean; Oxford University Press: Oxford, UK, 2009. [Google Scholar]
  50. Anzidei, M.; Lambeck, K.; Antonioli, F.; Furlani, S.; Mastronuzzi, G.; Serpelloni, E.; Vannucci, G. Coastal structure, sea-level changes and vertical motion of the land in the mediterranean. Geol. Soc. Spec. Publ. 2014, 388, 453–479. [Google Scholar] [CrossRef]
  51. Rohling, E.J.; Abu-Zied, R.; Casford, C.S.L.; Hayes, A.; Hoogakker, B.A.A. The Mediterranean Sea: Present and Past. In Physical Geography of the Mediterranean Basin; Oxford University Press: Oxford, UK, 2009; ISBN 978-0-19-926803-0. [Google Scholar]
  52. Millot, C.; Taupier-Letage, I. Circulation in the Mediterranean Sea. In Handbook of Environmental Chemistry; Saliot, A., Ed.; Springer: Heidelberg, Germany, 2005. [Google Scholar]
  53. Farrell, W.E.; Clark, J.A. On Postglacial Sea Level. Geophys. J. R. Astron. Soc. 2007, 46, 647–667. [Google Scholar] [CrossRef]
  54. Spada, G.; Stocchi, P. SELEN: A Fortran 90 program for solving the “sea-level equation”. Comput. Geosci. 2007, 33, 538–562. [Google Scholar] [CrossRef]
  55. Woodward, R.S. On the Form and Position of the Sea Level with Special References to Its Dependence on Superficial Masses Symmetrically Disposed about a Normal to the Earth’s Surface; Bulletin of the United States Geological Survey, 48; Government Printing Office: WA, USA, 1888. [CrossRef]
  56. Peltier, W.R. Global glacial isostasy and the surface of the ice-age Earth: The ICE-5G (VM2) model and GRACE. Annu. Rev. Earth Planet. Sci. 2004, 32, 111–149. [Google Scholar] [CrossRef]
  57. Stocchi, P.; Spada, G. Influence of glacial isostatic adjustment upon current sea level variations in the Mediterranean. Tectonophysics 2009, 474, 56–68. [Google Scholar] [CrossRef]
  58. Lisiecki, L.E.; Raymo, M.E. A Pliocene-Pleistocene stack of 57 globally distributed benthic δ18O records. Paleoceanography 2005, 20, 1–17. [Google Scholar] [CrossRef] [Green Version]
  59. Argus, D.F.; Peltier, W.R.; Drummond, R.; Moore, A.W. The Antarctica component of postglacial rebound model ICE-6G_C (VM5a) based on GPS positioning, exposure age dating of ice thicknesses, and relative sea level histories. Geophys. J. Int. 2014, 198, 537–563. [Google Scholar] [CrossRef]
  60. de Boer, B.; Stocchi, P.; Whitehouse, P.L.; van de Wal, R.S.W. Current state and future perspectives on coupled ice-sheet – sea-level modelling. Quat. Sci. Rev. 2017, 169, 13–28. [Google Scholar] [CrossRef] [Green Version]
  61. de Boer, B.; Stocchi, P.; van de Wal, R.S.W. A fully coupled 3-D ice-sheet–sea-level model: Algorithm and applications. Geosci. Model Dev. 2014, 7, 2141–2156. [Google Scholar] [CrossRef] [Green Version]
  62. Lucia, G.; Polyak, V.J.; Ginés, J.; Fornòs, J.J.; Ginés, A.; Asmerom, Y.; Onac, B.P. Chronology of Middle Pleistocene Coastal Karst Evolution and Relative Sea-Level Changes in Mallorca. J. Coast. Res. 2020, in press. [Google Scholar] [CrossRef]
  63. Alessio, M.; Allegri, L.; Antonioli, F.; Belluomini, G.; Ferranti, L.; Improta, S.; Manfra, L.; Proposito, A. Risultati preliminari relativi alla datazione di speleotemi sommersi nelle fasce costiere del Tirreno centrale. G. Geol. 1992, 54, 165–194. [Google Scholar]
  64. Dutton, A.; Scicchitano, G.; Monaco, C.; Desmarchelier, J.M.; Antonioli, F.; Lambeck, K.; Esat, T.M.; Fifield, L.K.; McCulloch, M.T.; Mortimer, G. Uplift rates defined by U-series and 14C ages of serpulid-encrusted speleothems from submerged caves near Siracusa, Sicily (Italy). Quat. Geochronol. 2009, 4, 2–10. [Google Scholar] [CrossRef]
  65. Furlani, S.; Antonioli, F.; Gambin, T.; Biolchi, S.; Formosa, S.; Lo Presti, V.; Mantovani, M.; Anzidei, M.; Calcagnile, L.; Quarta, G. Submerged speleothem in Malta indicates tectonic stability throughout the Holocene. Holocene 2018, 28, 1588–1597. [Google Scholar] [CrossRef]
  66. Surić, M.; Lončarić, R.; Lončar, N. Submerged caves of Croatia: Distribution, classification and origin. Environ. Earth Sci. 2010, 61, 1473–1480. [Google Scholar] [CrossRef]
  67. Pannacciulli, F.G.; Relini, G. The vertical distribution of Chthamalus montagui and Chthamalus stellatus (Crustacea, Cirripedia) in two areas of the NW Mediterranean Sea. Hydrobiologia 2000, 426, 105–112. [Google Scholar] [CrossRef]
  68. Reimer, P.J.; Austin, W.E.N.; Bard, E.; Bayliss, A.; Blackwell, P.G.; Bronk Ramsey, C.; Butzin, M.; Cheng, H.; Edwards, R.L.; Friedrich, M.; et al. The IntCal20 Northern Hemisphere Radiocarbon Age Calibration Curve (0-55 cal kBP). Radiocarbon 2020, 62, 725–757. [Google Scholar] [CrossRef]
  69. Stuiver, M.; Reimer, P.J.; Reimer, R.W. CALIB Radiocarbon Calibration, Version 7.10. Available online: http://calib.org/calib/ (accessed on 28 July 2016).
  70. Pons-Branchu, E.; Douville, E.; Roy-Barman, M.; Dumont, E.; Branchu, P.; Thil, F.; Frank, N.; Bordier, L.; Borst, W. A geochemical perspective on Parisian urban history based on U-Th dating, laminae counting and yttrium and REE concentrations of recent carbonates in underground aqueducts. Quat. Geochronol. 2014, 24, 44–53. [Google Scholar] [CrossRef] [Green Version]
  71. Ludwig, K.R.; Titterington, D.M. Calculation of 230Th-U isochrons, ages, and errors. Geochim. Cosmochim. Acta 1994, 58, 5031–5042. [Google Scholar] [CrossRef]
  72. Cheng, H.; Lawrence Edwards, R.; Shen, C.C.; Polyak, V.J.; Asmerom, Y.; Woodhead, J.; Hellstrom, J.; Wang, Y.; Kong, X.; Spötl, C.; et al. Improvements in 230Th dating, 230Th and 234U half-life values, and U-Th isotopic measurements by multi-collector inductively coupled plasma mass spectrometry. Earth Planet. Sci. Lett. 2013, 371–372, 82–91. [Google Scholar] [CrossRef]
  73. Jaffey, A.H.; Flynn, K.F.; Glendenin, L.E.; Bentley, W.C.; Essling, A.M. Precision measurement of half-lives and specific activities of U235 and U238. Phys. Rev. C 1971, 4, 1889–1906. [Google Scholar] [CrossRef]
  74. Hans Wedepohl, K. The composition of the continental crust. Geochim. Cosmochim. Acta 1995, 59, 1217–1232. [Google Scholar] [CrossRef]
  75. Richards, D.A.; Dorale, J.A. Uranium-series chronology and environmental applications of speleothems. Rev. Miner. Geochem. 2003, 52, 407–460. [Google Scholar] [CrossRef]
  76. Fornós, J.J.; Gelabert, B.; Ginés, A.; Ginés, J.; Tuccimei, P.; Vesica, P. Phreatic overgrowths on speleothems: A useful tool in structural geology in littoral karstic landscapes. the example of eastern mallorca (balearic islands). Geodin. Acta 2002, 15, 113–125. [Google Scholar] [CrossRef] [Green Version]
  77. Surić, M.; Juračić, M. Late Pleistocene–Holocene palaeoenvironmental changes—Records from submerged speleothems from the Eastern Adriatic Sea (Croatia). In Proceedings of the International interdisciplinary scientific conference Sustainability of Karst Environment Dinaric Karst and other Karst Regions, Zagreb, Croatia, 23–26 September 2009. [Google Scholar]
  78. Lambeck, K.; Antonioli, F.; Anzidei, M.; Ferranti, L.; Leoni, G.; Scicchitano, G.; Silenzi, S. Sea level change along the Italian coast during the Holocene and projections for the future. Quat. Int. 2011, 232, 250–257. [Google Scholar] [CrossRef]
  79. Antonioli, F.; Cremona, G.; Immordino, F.; Puglisi, C.; Romagnoli, C.; Silenzi, S.; Valpreda, E.; Verrubbi, V. New data on the Holocenic sea-level rise in NW Sicily (Central Mediterranean Sea). Glob. Planet. Chang. 2002, 34, 121–140. [Google Scholar] [CrossRef]
  80. Lambeck, K.; Antonioli, F.; Purcell, A.; Silenzi, S. Sea-level change along the Italian coast for the past 10,000 yr. Quat. Sci. Rev. 2004, 23, 1567–1598. [Google Scholar] [CrossRef]
  81. Antonioli, F.; Mucedda, M.; Silenzi, S.; Verrubbi, V. Seal level and hydrological conditions during MIS 6.5 from a submerged speleothem sampled at −52 m in Sardinia (Italy). In Proceedings of the Karst 3 Congress, Montpellier, France, 20–24 April 2003; Abstract Volume, pp. 18–24. [Google Scholar]
  82. Tuccimei, P.; Antonioli, F.; Delitala, M.C.; Fornós, J.J.; Ginés, A.; Ginés, J.; Mucedda, M.; Orrù, P.; Taddeucci, A. Sea level changes during Oxygen Isotope Stage 5 at Capo Caccia (Alghero, Sardinia), based on U-Th datings of phreatic overgrowths on speleothems and geomorphological evidences. In Proceedings of the “L’Eemiano e il Tirreniano in Italia”, Verona, Italy, 12–13 September 2000; pp. 24–26. [Google Scholar]
  83. Tuccimei, P.; Fornós, J.J.; Ginés, J.; Ginés, A.; Gràcia, F.; Mucedda, M. Sea level change at Capo Caccia (NW Sardinia) and Mallorca (Balearic Islands) during oxygen isotope substage 5e, based on Th/U datings of phreatic overgrowths on speleothems. In Proceedings of the Geomorfologia litoral i Quaternari. Homenatge a Joan Cuerda Barceló; Pons, G.X., Vicens, D., Eds.; SHNB Societat d’Història Natural de les Balears: Palma de Mallorca, Spain, 2007; pp. 121–135. [Google Scholar]
  84. Antonioli, F.; Ferranti, L.; Lo Schiavo, F. The submerged neolithic burials of the grotta Verde at Capo Caccia (Sardinia, Italy) implication for the Holocene sea level rise. Mem. Descr. Serv. Geol. Naz. 1996, 52, 290–312. [Google Scholar]
  85. Lorscheid, T.; Stocchi, P.; Casella, E.; Gómez-Pujol, L.; Vacchi, M.; Mann, T.; Rovere, A. Paleo sea-level changes and relative sea-level indicators: Precise measurements, indicative meaning and glacial isostatic adjustment perspectives from Mallorca (Western Mediterranean). Palaeogeogr. Palaeoclimatol. Palaeoecol. 2017, 473, 94–107. [Google Scholar] [CrossRef]
  86. Edwards, R.L.; Gallup, C.D.; Cheng, H. Uranium-series dating of marine and lacustrine carbonates. In Uranium-Series Geochemistry, Reviews in Mineralogy and Geochemistry; Mineralogical Socity of America: Chantilly, VA, USA, 2003; Volume 52, pp. 363–405. ISBN 9781501509308. [Google Scholar]
  87. Capotondi, L.; Vigliotti, L. Magnetic and microfaunal characterization of Late Quaternary sediments from the Western Mediterranean: Inferences about sapropel formation and Paleoceanographic implications. In Ocean Drilling Program: Scientific Results; Texas A and M University: College Station, TX, USA, 1999; Volume 161, pp. 505–518. [Google Scholar]
  88. Waelbroeck, C.; Labeyrie, L.; Michel, E.; Duplessy, J.C.; McManus, J.F.; Lambeck, K.; Balbon, E.; Labracherie, M. Sea-level and deep water temperature changes derived from benthic foraminifera isotopic records. Quat. Sci. Rev. 2002, 21, 295–305. [Google Scholar] [CrossRef]
  89. Surić, M.; Horvatinčić, N.; Suckow, A.; Juračić, M.; Barešić, J. Isotope records in submarine speleothems from the Adriatic coast, Croatia. Bull. Soc. Geol. Fr. 2005, 176, 363–373. [Google Scholar] [CrossRef]
  90. Surić, M.; Korbar, T.; Juračić, M. Tectonic constraints on the late Pleistocene-Holocene relative sea-level change along the north-eastern Adriatic coast (Croatia). Geomorphology 2014, 220, 93–103. [Google Scholar] [CrossRef]
  91. Lambeck, K.; Chappell, J. Sea level change through the last glacial cycle. Science 2001, 292, 679–686. [Google Scholar] [CrossRef] [PubMed]
  92. Florido, E.; Auriemma, R.; Faivre, S.; Radić Rossi, I.; Antonioli, F.; Furlani, S.; Spada, G. Istrian and Dalmatian fishtanks as sea-level markers. Quat. Int. 2011, 232, 105–113. [Google Scholar] [CrossRef]
  93. Radić Rossi, I.; Antonioli, F.; Spada, G.; Zubčić, K.; Meštrov, M. Sea level and shoreline changes in the Pakoštane area over the past six millennia. In The Late Roman Shipwreck in Its Geological-Geographical and Cultural-Historical Context; Radić Rossi, I., Boetto, G., Eds.; Institute for Maritime Heritage Ars Nautica, University of Zadar: Zadar, Croatia, 2018; pp. 205–224. [Google Scholar]
  94. Ferranti, L.; Antonioli, F.; Mauz, B.; Amorosi, A.; Dai Pra, G.; Mastronuzzi, G.; Monaco, C.; Orrù, P.; Pappalardo, M.; Radtke, U.; et al. Markers of the last interglacial sea-level high stand along the coast of Italy: Tectonic implications. Quat. Int. 2006, 145–146, 30–54. [Google Scholar] [CrossRef]
  95. Hearty, P.J.; Miller, G.H.; Stearns, C.E.; Szabo, B.J. Aminostratigraphy of Quaternary shorelines in the Mediterranean basin. Geol. Soc. Am. Bull. 1986, 97, 850–858. [Google Scholar] [CrossRef]
  96. Muhs, D.R.; Simmons, K.R.; Meco, J.; Porat, N. Uranium-series ages of fossil corals from Mallorca, Spain: The “Neotyrrhenian” high stand of the Mediterranean Sea revisited. Palaeogeogr. Palaeoclimatol. Palaeoecol. 2015, 438, 408–424. [Google Scholar] [CrossRef] [Green Version]
  97. Siddall, M.; Rohling, E.J.; Almogi-Labin, A.; Hemleben, C.; Meischner, D.; Schmelzer, I.; Smeed, D.A. Sea-level fluctuations during the last glacial cycle. Nature 2003, 423, 853–858. [Google Scholar] [CrossRef]
  98. Rodríguez-Vidal, J.; Cáceres, L.M.; Finlayson, J.C.; Gracia, F.J.; Martínez-Aguirre, A. Neotectonics and shoreline history of the Rock of Gibraltar, southern Iberia. Quat. Sci. Rev. 2004, 23, 2017–2029. [Google Scholar] [CrossRef]
  99. Gowan, E.J.; Zhang, X.; Khosravi, S.; Rovere, A.; Stocchi, P.; Hughes, A.C.; Gyllencreutz, R.; Mangerud, J.; Svendsen, J.I.; Lohmann, G. Global ice sheet reconstruction for the past 80000 years. PANGEA 2019. in print. [Google Scholar] [CrossRef]
Figure 1. Overview map of the Mediterranean region showing the locations of the coastal caves discussed in this study. Specific information (latitude, longitude, sampling depths, dating method, and ages) is reported in Tables 3 and 4.
Geosciences 11 00077 g001
Figure 2. Coastal caves and submerged speleothems in Italy and Malta. (a) Stalactites sampled at −14 m in Malta. (b) Sampling survey conducted at −41 m in the Scaletta cave (Palinuro) by F. Antonioli, L. Ferranti, and M. Oliverio. (c) Oxidation bands observed at +4 m in the Nettuno cave and phreatic speleothems (photo by Mauro Mucedda). (d,e) Stalagmite collected in Palinuro encrusted by specimens of the barnacle Chthamalus. Cross section of the sample showing the portions collected for 14C and U-series disequilibrium dating. (f) Cattedrale cave (Marettimo Island). (g) Growth model of the stalactite sampled in the Gebel Ciantar cave in Malta [65]. (h) Photo of the Palinuro promontory with the sampling sites of Scaletta cave and the stalagmite with barnacle overgrowth. (i) Risorgenza di Cala Luna cave. Photo by F. Antonioli.
Geosciences 11 00077 g002
Figure 3. Coastal caves and submerged speleothems from Croatia. (a) Map of the Adriatic Sea showing the locations of the Croatian caves [21]. (b) Stalactite P-23, with overgrowth, from a cave in Tihovac Bay (Pag Island) −23 m. (c) Stalagmite K-14 from U vode Pit (Krk Island) at −14.5 m. Pink dots represent the portions of the speleothem collected for U-Th dating, and yellow dots are the areas where X-ray diffraction analyses were conducted by [3] to identify the hiatus between 87 and 82 kyr. (d) Stalagmite K-18 from U vode Pit (Krk Island) at −18.8 m. Pink dots represent the portions of the speleothem collected for U-Th dating, and yellow dots are the areas where X-ray diffraction analyses were carried out by [3] to identify the hiatus between 77.7 and 64.5 kyr. (e) Stalactite R-21 from Zmajevo uho Pit at −21.1 m. Photo by M. Surić. (f) Cave near Iški Mrtovnjak. Photo by M. Kvarantan.
Geosciences 11 00077 g003
Figure 4. Photos of phreatic overgrowth on a speleothem (POS) in Mallorca. (a,b): Modern aragonite POS at Cova des Pas de Vallgornera (Llucmajor, Mallorca). Photos by Tony Merino and Bogdan P. Onac. (c) POS at +2.6 m in Cova des Pas de Vallgornera (Llucmajor, Mallorca), dated to MIS 5.5. Photo by Tony Merino. (d,e) Some POS at Cova des Pas de Vallgornera (Llucmajor, Mallorca). Photos by Bogdan P. Onac. (f) Ancient POS at Coves del Drac (Manacor, Mallorca). Photo by Joaquín Ginés.
Geosciences 11 00077 g004
Figure 5. Coastal caves and submerged speleothems from Italy. (a): Sampling survey at −27 m in the Scaletta cave (Palinuro). (b) Prof. Marco Oliverio (Sapienza University) carrying the stalagmite collected at −48 m in the Scaletta cave (Palinuro). (c,d) Argentarola cave and a large stalagmite covered by serpulid overgrowth. (e) Stalagmite ASN collected at −18 m in the Argentarola cave. The 6 cm portion of the stalagmite covers the last 280 kyr, from MIS 8 to MIS 1 [18]. (f) Stalagmite ASL collected at −18.5 m in the Argentarola cave [2]. (g) View of the Custonaci cave. (h) Stalactite collected at + 98 m in the Rumena cave, showing four marine highstands [6]: (i)Stalactite collected at −53 m in the Nettuno cave. Photo by F. Antonioli.
Geosciences 11 00077 g005
Figure 6. Sea level rise curve since 8 kyr cal BP for Palinuro. Orange squares: U-Th ages of the continental portion of the stalagmite. Blue dot: 14C age of the barnacle overgrowth. Also see Figure 2.
Geosciences 11 00077 g006
Figure 7. Cumulative predicted relative sea level (RSL) curves for ICE-5G (a,d), ICE-6G (b,e), and ANICE-SELEN (c,f) ice sheet models, in combination with different mantle viscosity profiles. The gray curves are for each site within the Mediterranean Sea, the red curves are for the Bahamas, and the black curves represent the eustatic signal (with respect to the present-day ocean function) for each ice sheet model.
Geosciences 11 00077 g007
Figure 8. Predicted RSL curves for ICE-5G (red curves), ICE-6G (green curves), and ANICE-SELEN (blue curves) ice sheet models, in combination with mantle viscosity profiles (MVP) 1–3 (solid, dashed, and dotted, respectively) at each site and with respect to the measured elevations. (a) predicted RSL curves at MIS 5.1 in the Bahamas and with respect to the elevation of the flowstone. (b) predicted RSL curves at MIS 5.1 in Mallorca. (c) predicted RSL curves at MIS 5.1 in Croatia and elevation of the speleothems. (d) predicted RSL curves at MIS 5.1 at Plemmirio and elevation of the speleothem. (e) predicted RSL curves at MIS 5.1 at Argentarola and elevation of the speleothems. (f) predicted RSL curves at MIS 7.1–7.2 at Argentarola and elevation of the speleothems.
Geosciences 11 00077 g008
Figure 9. δ18O series of the marine layer of ASI (−18.5, MIS 5.5), compared with ODP 975 (Central Mediterranean sea) (redrawn from [21]).
Geosciences 11 00077 g009
Figure 10. The DWBAH flowstone, sampled at −15 m on the Grand Bahama Island (courtesy of Joyce Lundberg).
Geosciences 11 00077 g010
Figure 11. Predicted MIS 5.1–5.3 RSL curves for the Bahamas and at the relevant Mediterranean sites for ANICE-SELEN and the MVP 3 mantle viscosity profile. The black curve shows the eustatic.
Geosciences 11 00077 g011
Figure 12. Predicted RSL elevation in the Mediterranean Sea during MIS 5.1 according to ANICE-SELEN and the MVP 3 mantle viscosity profile. The pink dots indicate the location of the sites. The black isoline corresponds to the eustatic value (−38.5 m).
Geosciences 11 00077 g012
Figure 13. Elevations and radiometric ages (14C and U-Th) of the Mediterranean speleothems and marine overgrowths discussed in the present study and a comparison with the DWBAH flowstone Table A1. Argentarola (Italy), −18.5 m [2] and −18 and −21.7 m [22]; Plemmirio (Italy), −23 m [64]; Grotta di Nettuno (Italy), −3 m [81]; U vode Pit (Krk Island, Croatia), Stalagmite K− 4 (−14.5 m) and K-18 (−18.8 m) [3]; POS from Mallorca (Spain), + 1.5 m [4,5]; Malta [65]; DWBAH Flowstone (Bahamas), −15 m [11]. Black line: global sea level curve reconstructed by [88].
Geosciences 11 00077 g013
Figure 14. Zoom 1 of Figure 15. Light green line: DWBAH flowstone [11]; orange line: Stalagmite ASI (−18.5) from Argentarola cave, −18.5 m [2]; black line: Speleothems K14 and K18; yellow and blue line: Mallorca POS; green line: Plemmirio [64]; fine black line: global sea level curve reconstructed by [88].
Geosciences 11 00077 g014
Figure 15. Zoom 2 of Figure 15. Green line: DWBAH flowstone [11]; orange line: Stalagmite ASN (−18 m) from Argentarola cave [22], and stalagmite ASI (−18.5) from Argentarola cave [2]; black line: global sea level curve reconstructed by [88]; dark blue line: sea level drown with observed data.
Geosciences 11 00077 g015
Table 1. Glacial and hydro-isostatic adjustment (GIA).
VM2LT (km)UM (×1021 Pa⋅s)LUM (×1021 Pa⋅s)TZ (×1021 Pa⋅s)LM (×1021 Pa⋅s)
900.670.440.462.53
Table 2. GIA.
Table 2. GIA.
MVPsLT (km)UM (×1021 Pa⋅s)TZ (×1021 Pa⋅s)LM (×1021 Pa⋅s)
MVP1100112
MVP21000.50.55
MVP31000.250.510
Table 3. Locations and geographic coordinates of the caves and speleothems reported in this study, with information on the speleothem layer(s) analysed, dating method, and time range. POS: phreatic overgrowth on the speleothem; MOVR: marine overgrowth; LB: Lithophaga bores; and MIS: Marine Isotope Stage. For further details on the ages of samples collected from locations 27–33, refer to Table 4.
Submerged CaveCoordinates
(Lat, Long)
LithologyReferenceLayerDating MethodTime Range
(kyr cal BP)
Depth (m)
110 Mallorca, SpainAverage
(10 caves)
Mesozoic toVesica et al. (2000)Continental; POS U-Th
1 Cova de Cala Falcò Miocene calcarenites (TIMS)83.9+ 1.9
2 Cova de Cala Varques 36.0, 83.4, 71.3, 119.9+ 1.4
3 Cova des Serral 121.3+ 1.5
4 Cova de Dimoni39.49976 107.9, 112,9, 119.7+ 2.5
5 Coved del Pirata3.31629 130.4+ 2.1
6 Covas de na Barxa 124.7+ 2.4
7 Cova de na Mitjana 231.9, > 300+ 4.9, + 5.8
8 Cova del Drac > 350+ 3.3
2 Cova de Cala Varques-Miocene calcarenitesTuccimei et al. (2010)Continental; POSU-Th
(MC-ICPMS)
1.1–2.8
-MioceneDorale et al. (2010)Continental; POS U-Th mean +1.4
2 Cova Varques calcarenites (TIMS)80.12–81.95 (MIS 5.1)+1.25–1.57
4 Cova Dimoni +1.48–1.45
1 Cova Falcò +1.53–1.57
9 Cova des Pas de Vallgonera +1.52–1.6
19 Mallorca-MiocenecalcarenitesPolyak et al. (2018)Continental; POSU-Th
(MC-ICPMS)
116.0–126.6 (MIS 5.5)mean +2.15
1 Cova Falcò-MioceneLucia et al. (2020)ContinentalU/Th465+2
calcarenites (MC-ICPMS)558+2.9
643+2.8
500+3
4 Cova Dimoni 948–482+5
10 Sa Ferradura 1084–587+3
1355–588+5.5
1205–672+4.5
1460–702+3.5
11 Grotta di Nettuno, Sardinia, Italy
12 Eurhotel, Sardinia, Italy
40.56463
8.16042
-
Mesozoic
limestones
Antonioli and Mucedda (2003)
Alessio et al. (1994)
Continental
Continental
Continental
U-Th
(alpha-counting)
14C
165 ± 12 (MIS 6)
5.371
7.283
−52
−1
−1
14C
13 Risorgenza cala Luna,40.22420MesozoicAlessio et al. (1994)Continental14C25.377 (MIS 2)−9
Orosei gulf, Sardinia, Italy9.62864limestones
14 Argentarola cave, Italy42.4181Upper TriassicAntonioli et al. (2004)Continental U/Th6.5–9.6
11.08142dolomitic MOVR(TIMS) −3.5, −21.7
limestone
14 Argentarola, Grosseto,42.4181Upper TriassicBard et al. (2002)Continental U/Th145.2–189.7 (MIS 6)−18.5
Italy11.08142dolomitic MOVR(TIMS)<201.6 (MIS 7.1)
ASI −18.5 limestone 201.6 (MIS 7.2)
14 Argentarola cave,42.4181Upper TriassicDutton et al. (2009a)Continental U/Th201.5–189.7 (MIS 7.1)−18, −21.7
Italy11.08142dolomitic MOVR(MC-ICPMS)217.2–206.0 (MIS 7.3)
ASN −18 m limestone (TIMS)248.9–231.0 (MIS 7.5)
ASE −21.3 m 35.2–48.4 (MIS 3)
157.3–180.8 (MIS 6)
203.3–207.1 (MIS 7.2)
248.9–259.0 (MIS 8)
183.1 (MIS 6)
217.2–2131.0 (MIS 7.4)
15 Capri, Italy40.55307
14.26406
Jurassic- Cretaceous
limestone
Alessio et al. (1994)Continental14C3.92−3.5
16 Scaletta cave, Palinuro,
14 Argentarola cave, Italy
40.02373
15.27159
Mesozoic
limestones
Alessio et al. (1992, 1994); Antonioli and Oliverio (1996) Alessio et al. (1992, 1994)Continental MOVR14CMIS 1-2
10.2
MIS 1-2
−41, −27−48
16, −14, −12,
−10, −4
17 Ustica, Italy38.70513
13.19478
Pleistocene
volcanic rocks
Alessio et al. (1994)Continental14C3.8−0.3
18 Castellammare,38.09348MesozoicAlessio et al. (1994)Continental14C8.3−0.3
Palermo, Italy12.80470limestones 15.0−1.3
19 Rumena cave38.0730MesozoicStocchi et al. (2017)Continental,U-Th – 87Sr/86Sr +98
Custonaci (Trapani, Italy)12.6708dolomites MOVR; hiati(MC-ICPMS)1,4 (MIS 25−37)
20 La Cattedrale,37.99338MesozoicAntonioli et al. (2002)Continental,14C9.5−25
Marettimo, Trapani, Italy12.04360limestone MOVR U/Th25.0 (MIS 2)
LB (alpha-counting)39.3 (MIS 3)
2125 Plemmirio caves,Average
(5 caves)
PleistoceneDutton et al. (2009b)Continental U-Th
Italy37.00520
15.31240
limestones MOVR(MC-ICPMS)
(TIMS)
21 Plemm-A 8.3−20.2
21 Plemm-A41.5–44.5 (MIS 3)−20.2
21 Plemm-A72.4–75.3 (MIS 5.1)−20.2
22 Plemm-B44.4–52.9 (MIS 3)−17.0
23 Plemm-C8.8–13.0 (MIS 1)−17
23 Plemm-C9.2–8.4 (MIS 1)−15.5
24 Mada-SC10.4 (MIS 1)−36.6
24 Mada SC41.5, 44.5 (MIS 3)−36.6
25 St.Pam30.9, 43.6 (MIS 3)−16.0
26 Gebel Ciantar Cave, Malta44.9789614.61674Late Oligocene-Furlani et al. (2018)Continental 14C7.6, 7.7−14.5
Middle Miocene
Globigerina
limestone
MOVR
2733 Croatia Eastern AdriaticAverage
(7 caves)
Mesozoic
limestones
Suric et al.
(2005,2007, 2009, 2010)
Continental14CMIS 1,2,3
27 U vode Pit (Krk Island);44.9389
14.7218
Suric and Juracic (2010)MOVR U-ThMIS 5.1, 5.5, 7.1−1.5, −38.5
28 Medvjeđa spilja Cave (Lošinj Island) hiati(MC-ICPMS)
29 Pit near Iški Mrtovnjak 30 Cave in Tihovac Bay (Pag Island)
31 Vrulja Zečica
32 Zmajevo uho Pit;
33 Pit in Lučice Bay(Brač island).
Flowstone Bahamas26.13029
77.17577
Pleistocene
limestones
Li et al. (1989),
Lundberg and Ford (1994)
Continental; hiatiU-Th (TIMS)See
Table A1
−15
Table 4. Location, depth, sample code, U-Th, and radiocarbon ages of the speleothem studied in Croatia (also see Figure 3). 14C ages of speleothems L-1 and L-10 measured through liquid scintillation counting and speleothems Z-41, B-38, B-36, B-34, B-28, P-23, and R-21 measured by an alpha proportional counter. The youngest parts are marked with an A and S, while B refers to the oldest parts. 14C ages are expressed as conventional 14C corrected for A0 = 85% and measured δ13C (−8‰ when not measured), and as calibrated ages. From [23,24].
LocationDepth
(m)
SampleUncorr.
Age
(ka)
frsCorrected
Age
(ka)
U vode Pit
(Krk Island)
14.5K-14-B-50d108.784.7 ± 12.3
K-14-B-4590.387.8 ± 1.3
K-14-B-1d82.982.2 ± 1.1
K-14-A-172d93.287.7 ± 3.7
K-14-A-1095.790.6 ± 2.9
18.8K-18-S183.1131.4 ± 28.4
K-18-C-14L55.753.8 ± 2.1
K-18-C-14R57.255.2 ± 1.4
K-18-C-14R52.350.5 ± 5.3
K-18-C-14M54.552.8 ± 1.1
K-18-C-1158.758.1 ± 1.4
K-18-C-265.264.5 ± 1.2
K-18-B-4078.177.7 ± 1.4
K-18-B-1083.382.9 ± 0.6
K-18-A-95L99.997.2 ± 1.4
K-18-A-95R93.990.8 ± 1.5
K-18-A-594.793.7 ± 3.4
Medvjeđa spiljaCave
(Lošinj Island)
1.5L-1-2124.9120.4 ± 3.2
10L-10-T133.833.2 ± 0.5
L-10-T134.233.7 ± 0.6
L-10-T220.620.2 ± 0.5
L-10-25217.3216.8 ± 10.5
Pit near Iški Mrtovnjak14M-14-T43.639.3 ± 2.0
19M-19-T1A55.455.3 ± 1.9
M-19-T1B45.244.8 ± 1.0
M-19-T268.168.1 ± 0.7
23M-23-T202.2201.3 ± 5.5
M-23-T202.9202.0 ± 7.4
Cave in Tihovac Bay
(Pag Island)
23P-23-MO53.228.7 ± 11.2
P-23-T146.937.3 ± 4.2
P-23-T233.333.2 ± 0.7
P-23-T333.131.9 ± 0.9
Vrulja Zečica 41.5Z-41-B-40--
Z-41-B-28371.2308.1 ± 53.8
Z-41-B-2642.130.2 ± 5.2
Z-41-A340.421.9 ± 8.2
Table 5. Results of the 14C and U-Th dating of the vadose speleothem (Palinuro-2 and Palinuro-3) and marine overgrowth (Palinuro-1) from Palinuro. 238U and 232Th concentrations were determined using the enriched 236U and 229Th isotopes, respectively. δ234Um = {[(234U/238U)sample/(234U/238U)eq] − 1} × 1000, where (234U/238U)sample is the measured atomic ratio and (234U/238U)eq is the atomic ratio at secular equilibrium. δ234U(0) corr is the initial value and is calculated by the equation δ234U(0) = δ234Um exp(λ234t), where t is the corrected age in years and λ234 is the decay constant for 234U. * Ages corrected for detrital 230Th using an initial 230Th/232Th activity ratio of 0.85 ± 0.36 [74].
Sample
Code
AMS-14C
14C-Age (yrs BP)Median Probability (yrs BP)Calibrate Age (yrs BP, 2s Range)
Palinuro-11686±4515801513–1646
U-Series Dating
238U (µg/g)232Th (ng/g)d234Um (‰)(230Th/238U)act(230Th/232Th)actAge (ka)d234U(0) corrAge corr (ka) *
Palinuro-20.336±0.003104.72±0.1181.5±0.70.12697±0.000661.24±0.0113.62±0.0882.6±0.74.46±3.74
Palinuro-30.148±0.00119.14±0.0154.1±2.00.08615±0.003482.03±0.089.31±0.4154.9±2.05.49±1.65
Publisher’s Note: MDPI stays neutral with regard to jurisdictional claims in published maps and institutional affiliations.

