1. Introduction
Fast-moving landslides (i.e., debris/earth flows) are among the natural phenomena which produce severe damage and fatalities. The high velocity that the flow mass can reach during propagation, due to the characteristics of moving material, allow an extended area to be rapidly covered, so the consequences of a “rapid landslide” impact are pronounced when it occurs near structures or a lifeline. Therefore, in the last few decades, many efforts have been made to investigate the factors affecting the dynamics of these events, and to develop models able to simulate the flow propagation, with the aim of producing landslide maps and developing appropriate strategies for the prevention and mitigation of related risks.
To achieve reliable predictions, information about the three components of risk (hazards, exposition, and vulnerability), and geological and geotechnical data, are strictly necessary. With this aim, here, with the traditional in situ and laboratory characterization, innovative procedures are introduced to investigate soil behavior, such as, for example, triaxial laboratory tests with suction control [
1]. Numerical models, likewise, have been developed to simulate landslide flow propagation and run-out [
2,
3,
4,
5,
6,
7,
8,
9].
From a theoretical point of view, debris flows are very peculiar. At first approximation, they can be classified as suspensions—mixtures of fluid and grains. The fact that the grain size is not uniform complicates their understanding: the smallest grains are microscopic clay particles, while the biggest ones are large-sized granular soil. The interaction between the grains and fluid also takes different forms depending on the grain size.
The dynamics of microscopic grains are dominated by electrostatic forces, while big grains are driven by hydrodynamic interactions with the fluid.
Numerical models developed for simulating debris/earth flows generally refer to hyper-concentrated flows, which differ in their adopted rheological schemes. In particular, they can be separated into single-phase models and two-phase models.
Single-phase models assume that a debris flow acts as a homogeneous Bingham fluid, composed of a mixture of water and sediment. From a rheological point of view, such a mixture can be described by Herschel–Bulkley [
10], or in even more complex models such as, for example, that described by a quadratic law that assumes that the total friction stresses can be divided into different terms—yield stresses, viscosity stresses, and turbulent-dispersive stresses—all of them being functions of the sediment concentration in the mixture.
The hypothesis of the Binghamian nature of the fluid is necessary in order to simulate the arrest of the flow. In the two-phase models, the exchange of mass between the erodible bed and the flow is taken into account as well. The fundamentals of such models were first developed by Bagnold [
11], and then applied to the debris flows by Takahashi [
12].
In these models, the solid concentration is an unknown variable which influences the global behavior of the flow, which can be properly accounted for by the model itself. In particular, it has been noted that the first type of model is more suitable for cases characterized by fine sediments, when the viscous shear rate is high. The second type of model is more suitable in cases in which the viscosity of the interstitial fluid is negligible and the solid fraction is composed of coarser material, so that the inertial shear rate acts predominately due to the collisions between gravels.
The choice of the rheology and related rheological parameter values is a fundamental aspect of numerical simulation; therefore, to improve knowledge of the rheological properties of the debris flow (e.g., the concentration of solid material, evolutionary characteristics of viscous water/soil mass movement, mixture density, viscosity, etc.), direct comparisons between numerical predictions and results deduced by case histories or physical model simulations can be used.
On the other hand, evaluation of the hydromechanical properties of the unsaturated soils by innovative laboratory tests is another important aspect of understanding debris/earth flows.
Difficulties in numerical modeling of this heterogeneous moving mass are mainly linked to the simulation of the complex behavior assumed by the mass during propagation. As stressed by Iverson et al. [
13], the debris flow during propagation does not behave with a fixed rheology, since it changes its rheological characteristics in space and time.
To derive information for the calibration of the model parameters, the results of an experimental study and the back-analysis of a debris flow undertaken in the Enna municipality (Sicily, Italy) on February 2014 are reported and discussed here. The numerical simulations were carried out using a pseudo-2D model developed for debris flow modeling that adopts depth-integrated flow equations.
2. The Case Study
Due to its nature and the complex morphological, geological, and lithotechnical conditions, as well as the particularly non-homogeneous and complicated hydrogeological aspects, the Sicilian territory is characterized by various types of landslides (mainly debris/earth flows) and floods. Because of the progressive neglect of mountainous areas and a lack maintenance of the slopes and hydraulic structures used to regulate rainwater, events related to hydrogeological risks can cause significant damage. The study area is located close to the municipality of Enna, in the middle of Sicily, and is characterized by a morphology with very high hills and catchment areas of small to moderate extensions (about 0.3 km2).
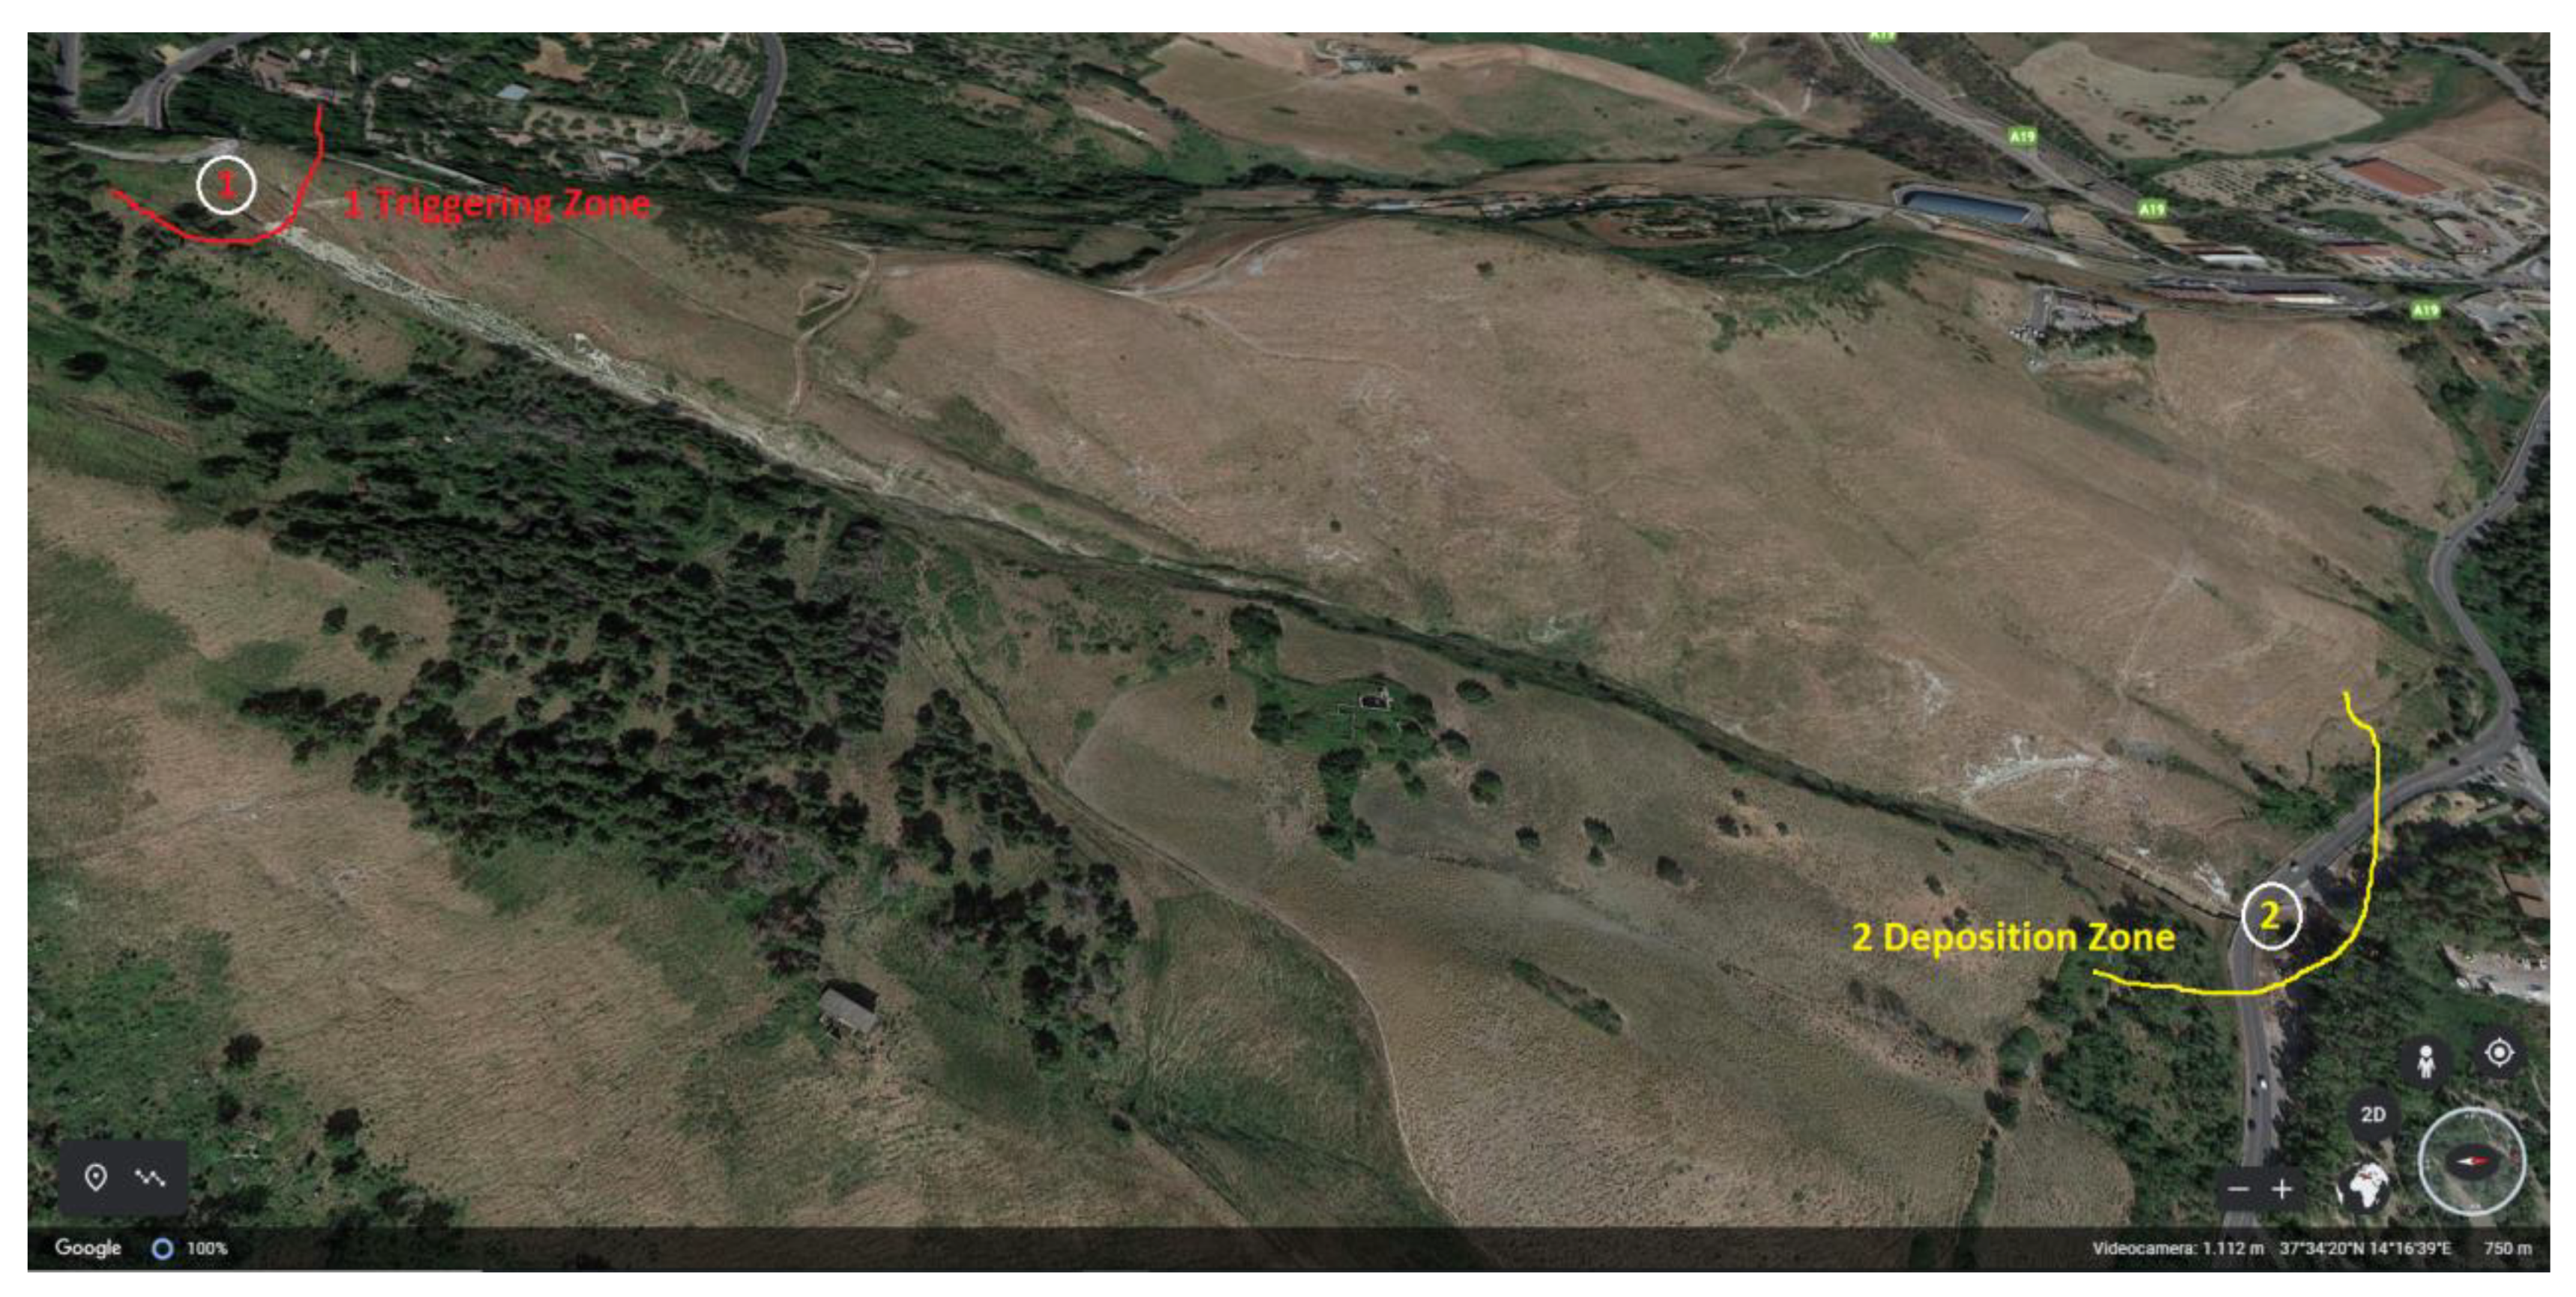
During the night between the 1st and the 2nd of February 2014, heavy rainfall struck the area (about 150 mm of rainfall in less than 1 h), causing severe damage and interrupting the main infrastructure connecting to the city at the highway “A19 Palermo-Catania” (
Figure 1a).
Figure 1b shows the landslide path from the source area to the accumulation zone.
A basin ends at the base of the slope, and represents the deposition zone of the rapid flow phenomena, including for the event that occurred in February 2014 (
Figure 2).
2.1. The 2014 Enna Debris Flow
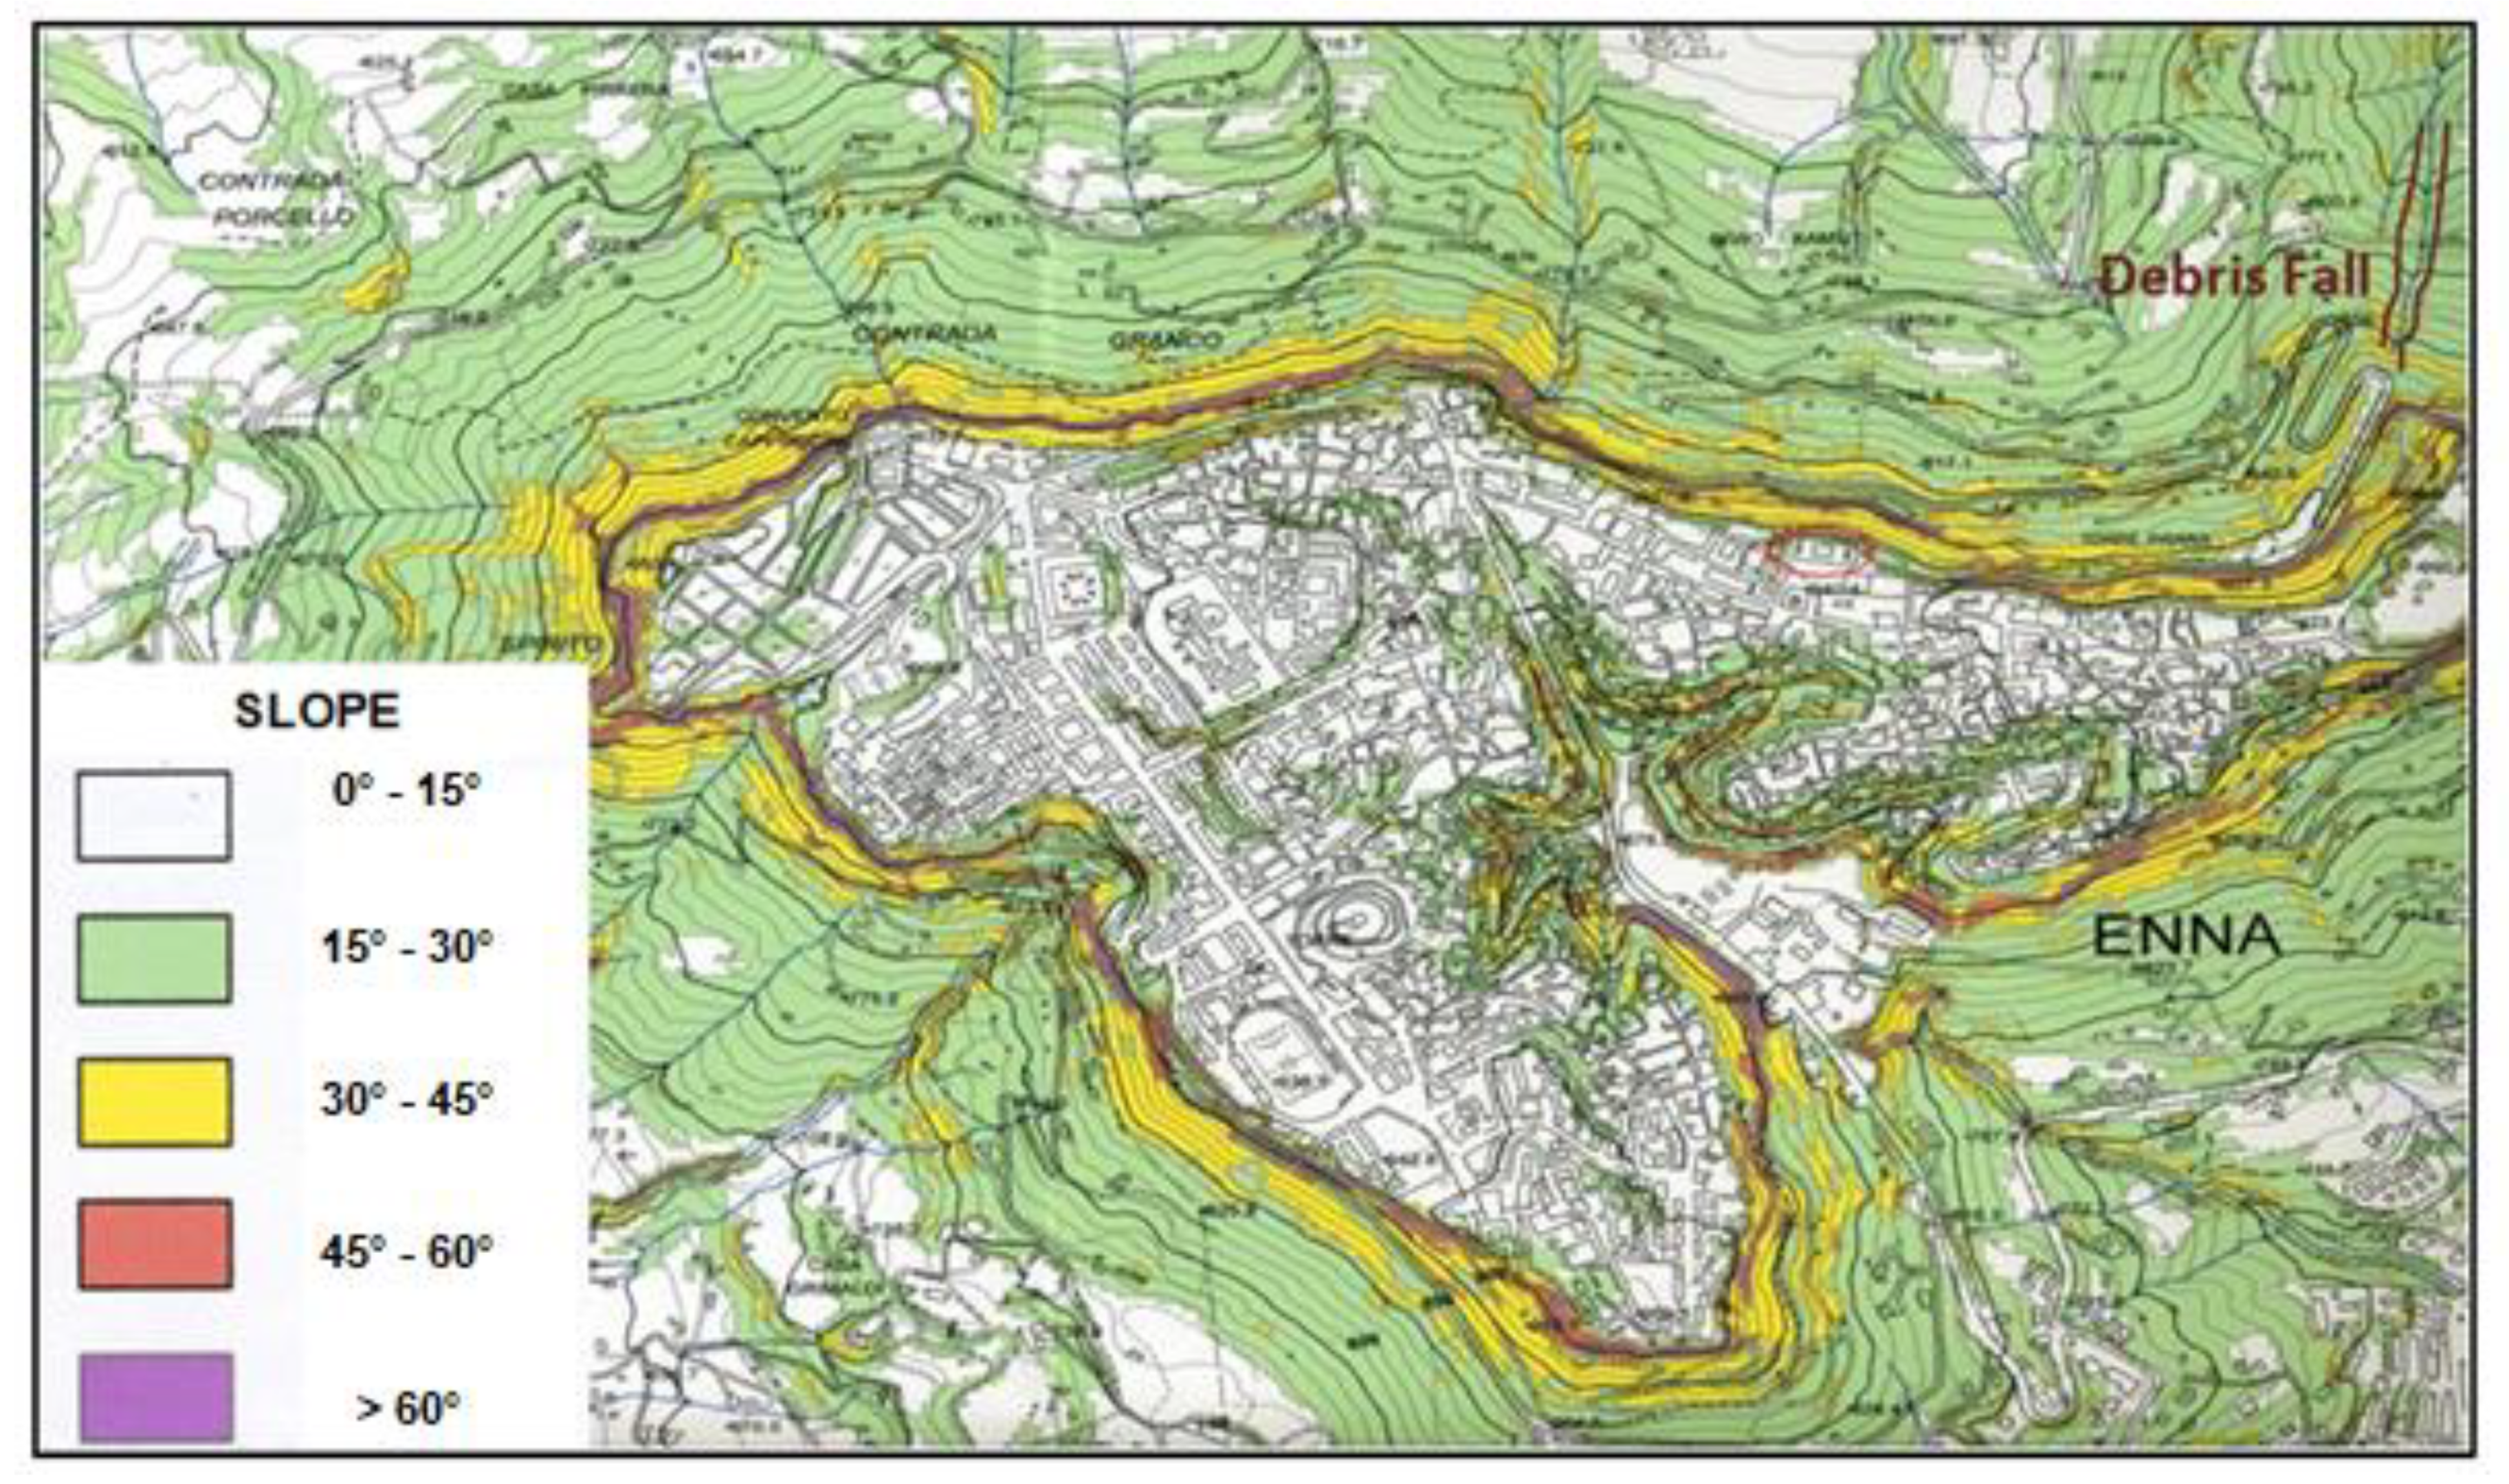
Enna is the least populated Sicilian province. Its altitude ranges from 58 to 1561 m a.s.l., with a morphology of high hills with slope angles ranging from 15° to 60° (
Figure 3). The landscape features a high number of streams and lakes, mostly artificial and used for irrigation purposes.
The city of Enna is located in a hilly area, and from a geological point of view (
Figure 3), is made up of Numidian Flysch of lower Oligocene age, marly and sandy brown clay of medium Miocene age, and river alluvium of Holocene age [
14]. The climate is characterized by an average daily temperature of about 14 °C, with fluctuations between day and night of about 15 °C. Usually, short and intense rainstorms occur between October and March.
The event of 2nd February 2014 occurred in an area characterized by a catchment with a small extension of 0.158 km2. This area is characterized by a high urban density with narrow roads, that during the event became the bed of the runoff flows.
The Enna area is characterized by the following main lithostratigraphic units [
15]: “Trubi”, Enna marls, calcarenites, gray-dark brown “brecciated” clays, and gray-blue clays (
Figure 4).
Superficial gravitational movements are triggered at the level of the altered blue-gray clayey marls, having thicknesses varying from 2.0 m up to about 4.0 m. These phenomena mainly affect the upper part of the geological formation, especially during intense rainy phenomena.
2.2. Site Characterization and Geotechnical Soil Properties Evaluation
The test site was accurately investigated by in situ surveys and laboratory tests. Boreholes, electrical tomographies (
Figure 5), and standard and cone penetration tests were carried out in areas close to the landslide event (
Figure 6). The boreholes, in particular, showed that the debris flow mainly consisted of cohesionless silty sand materials (
Figure 7).
Laboratory tests on soil samples were carried out for evaluation of their geotechnical properties. The main geotechnical parameters, derived by laboratory tests performed on soil samples retrieved from a survey carried out in the area on the debris flow event, are reported in
Table 1. It shows the physical parameters expressed in terms of soil unit weight
γ, water content
wn, Atterberg limits
wL and
wp, degree of saturation
Sr, and strength properties derived by means of direct shear tests and standard unconsolidated undrained triaxial tests, in terms of friction angle
ϕ′, cohesion
c′, and undrained cohesion
cu, respectively.
The geotechnical soil parameters reported in
Table 1 show that the samples recovered in the area of the debris flow are almost saturated. Evaluation of the hydromechanical properties of the unsaturated soils was an important aspect of this study on this landslide.
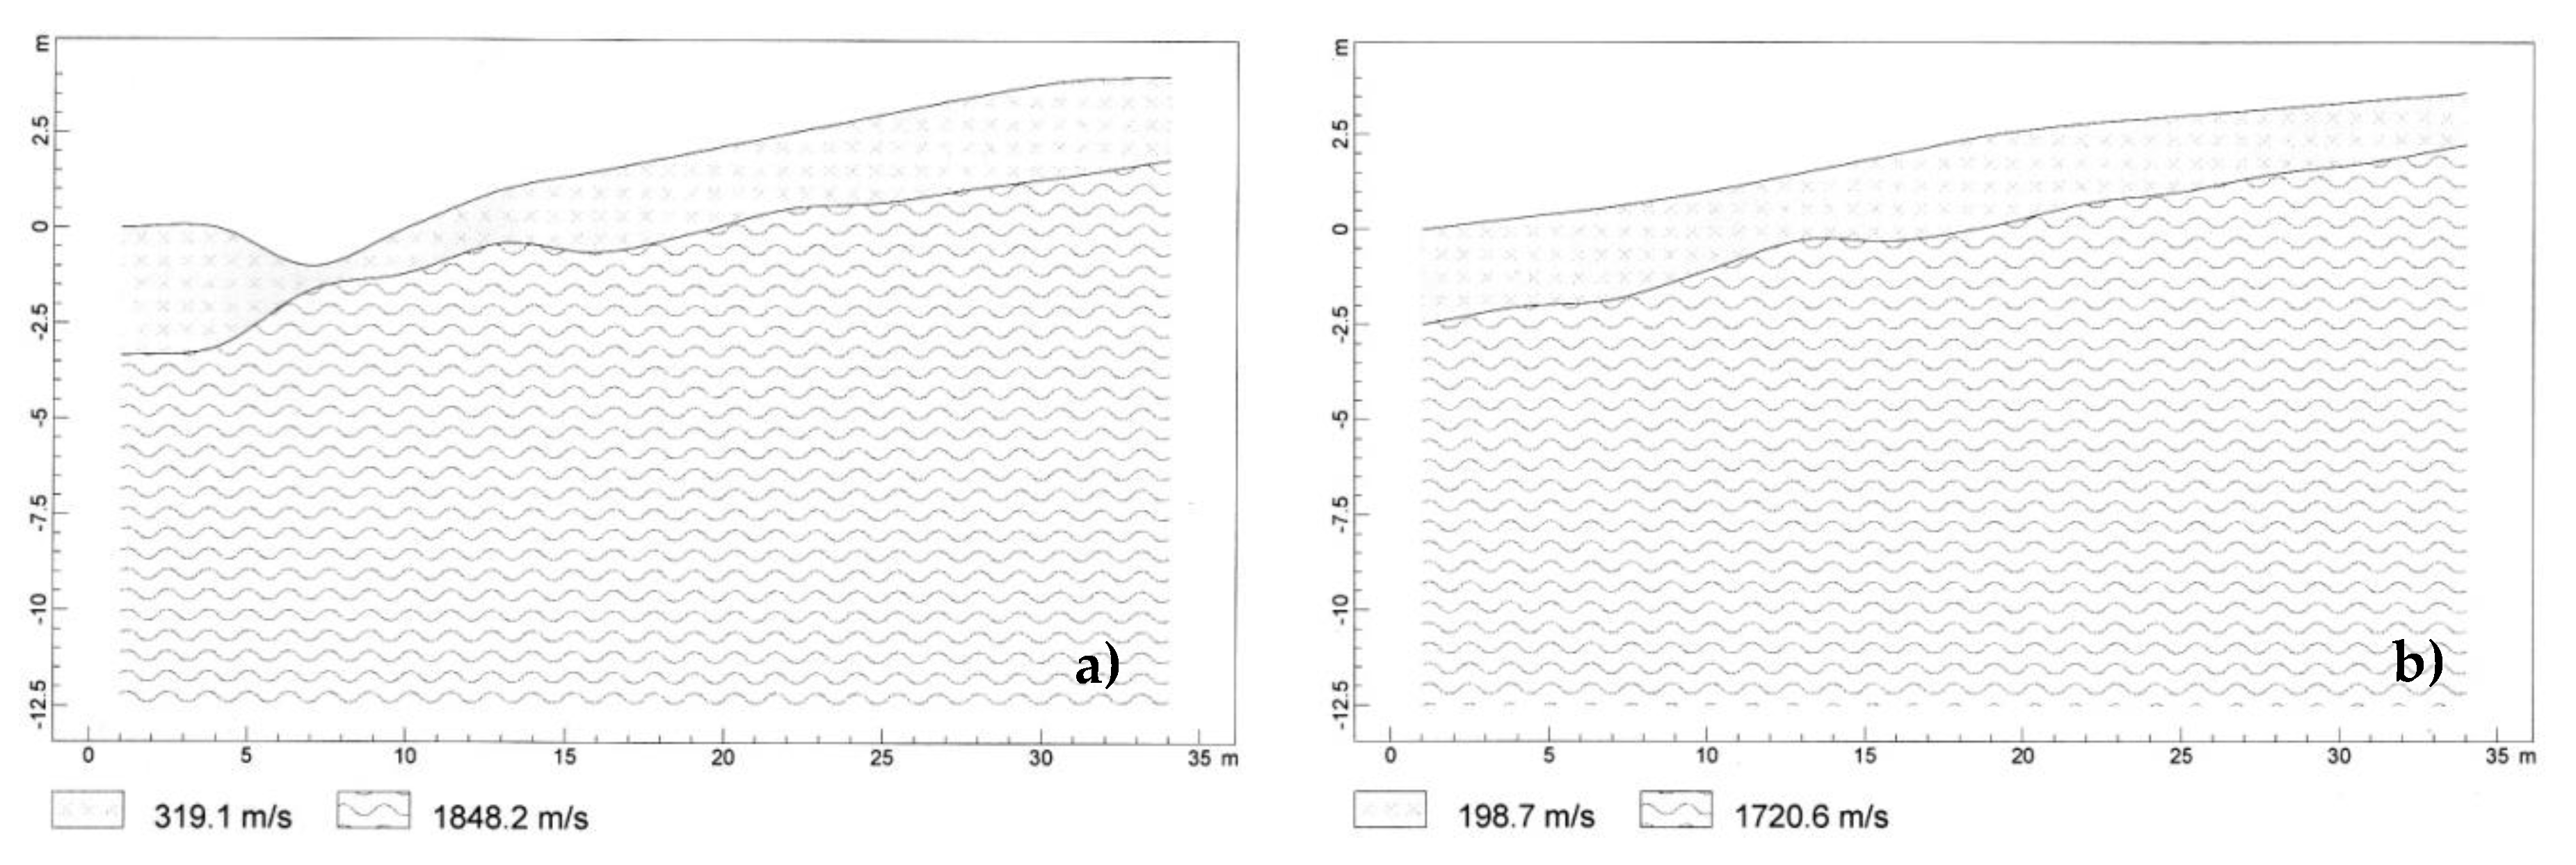
In
Figure 8 and
Figure 9, the results of two tomographies carried out very close to the run-out area and along the path of the debris flow, respectively, are shown. In the first case (
Figure 8), the results are expressed in terms of primary wave seismic velocities
Vp (m/s). In the second case, the results are expressed by the electrical resistivity model (
Figure 9a) and the chargeability model (
Figure 9b), obtained using the electrical resistivity tomography (ERT) method. In this last case, the high correlation of electrical resistivity to soil moisture can be used to detect anomalies (
Figure 9b), which can be related to an unsaturated material, potentially subjected to instability phenomena [
16].
2.3. Laboratory Triaxial Tests in Unsaturated Conditions
Unsaturated soils with pore water pressures that are negative relative to atmospheric conditions are widespread, especially at shallow depths from the surface. The shear strength parameters of these soils are crucial for stability analyses of surface soils, such as analyses of slopes against slope failures and landslides. Saturated soil mechanics are a complex subject, consisting of the solid phase form and its interaction with the aqueous phase.
When the soil dries such that there is also an air phase, it becomes unsaturated and its behavior is far more complex because of the interface between the air and the water, and the volumetric response of the air under changing conditions of pressure and temperature.
Additionally, the pressure in the water phase becomes negative (tensile), and measuring such pressures has, until recently, been fraught with problems.
In this study, laboratory tests were carried out to investigate the influence of matric suction on the shear strength and mechanical behavior of soil. The axis translation technique was applied, and a double-walled triaxial cell was used to measure the soil matric suction and variation of pore air volume, respectively. It can be deduced that matric suction influences the shear strength of unsaturated soils, and their failure mode in the final state of loading. Suction increases with an increase in axial strain during monotonic shearing.
2.3.1. Mechanical Behavior of Unsaturated Soil
Engineering tests show that there are significant differences between the mechanical behavior of unsaturated soils and completely saturated or completely dry soils. Normally, the theory of soil mechanics considers the soil as completely saturated or dry. However, it has been discovered that there are unsaturated areas of the soil, where gaps between the soil particles are filled with a mixture of air and water. Often in practice, these areas have been underestimated when assuming that the soil is completely saturated or completely dry.
Three phases characterize the unsaturated soil: solid particles, water, and air. The mechanical and hydraulic behavior and the tensional state are influenced by the presence of these two fluids inside the pores (one of which is compressible), and the interaction between them and with the solid skeleton. The presence of the three phases makes it necessary to take into account the differences in air and water pressures, phase compressions and their interactions, and chemical effects. In fact, the contractile skin between the fluid phases causes a surface tension effect that gives the shape of the characteristic aggregate structure of fine-grained soils.
The physical quantity that characterizes unsaturated soils is matric suction, and it is defined as the difference between pore air pressure and pore water pressure. The resistance of unsaturated soils has been formulated in terms of two independent stress variables: the net normal stress and matric suction [
17].
Triaxial laboratory tests are very useful in suction control, using the axis translation technique, for the evaluation of the main features (i.e., the deviator stress, the pore air pressure and pore water pressure, the axisymmetrical volume change, and the air/water volume changes). The water content of unsaturated soil has a direct influence on soil suction, and so the relationship between water content and suction is sought in the form of a soil water characteristic curve (SWCC).
2.3.2. Soil–Water Characteristic Curve (SWCC)
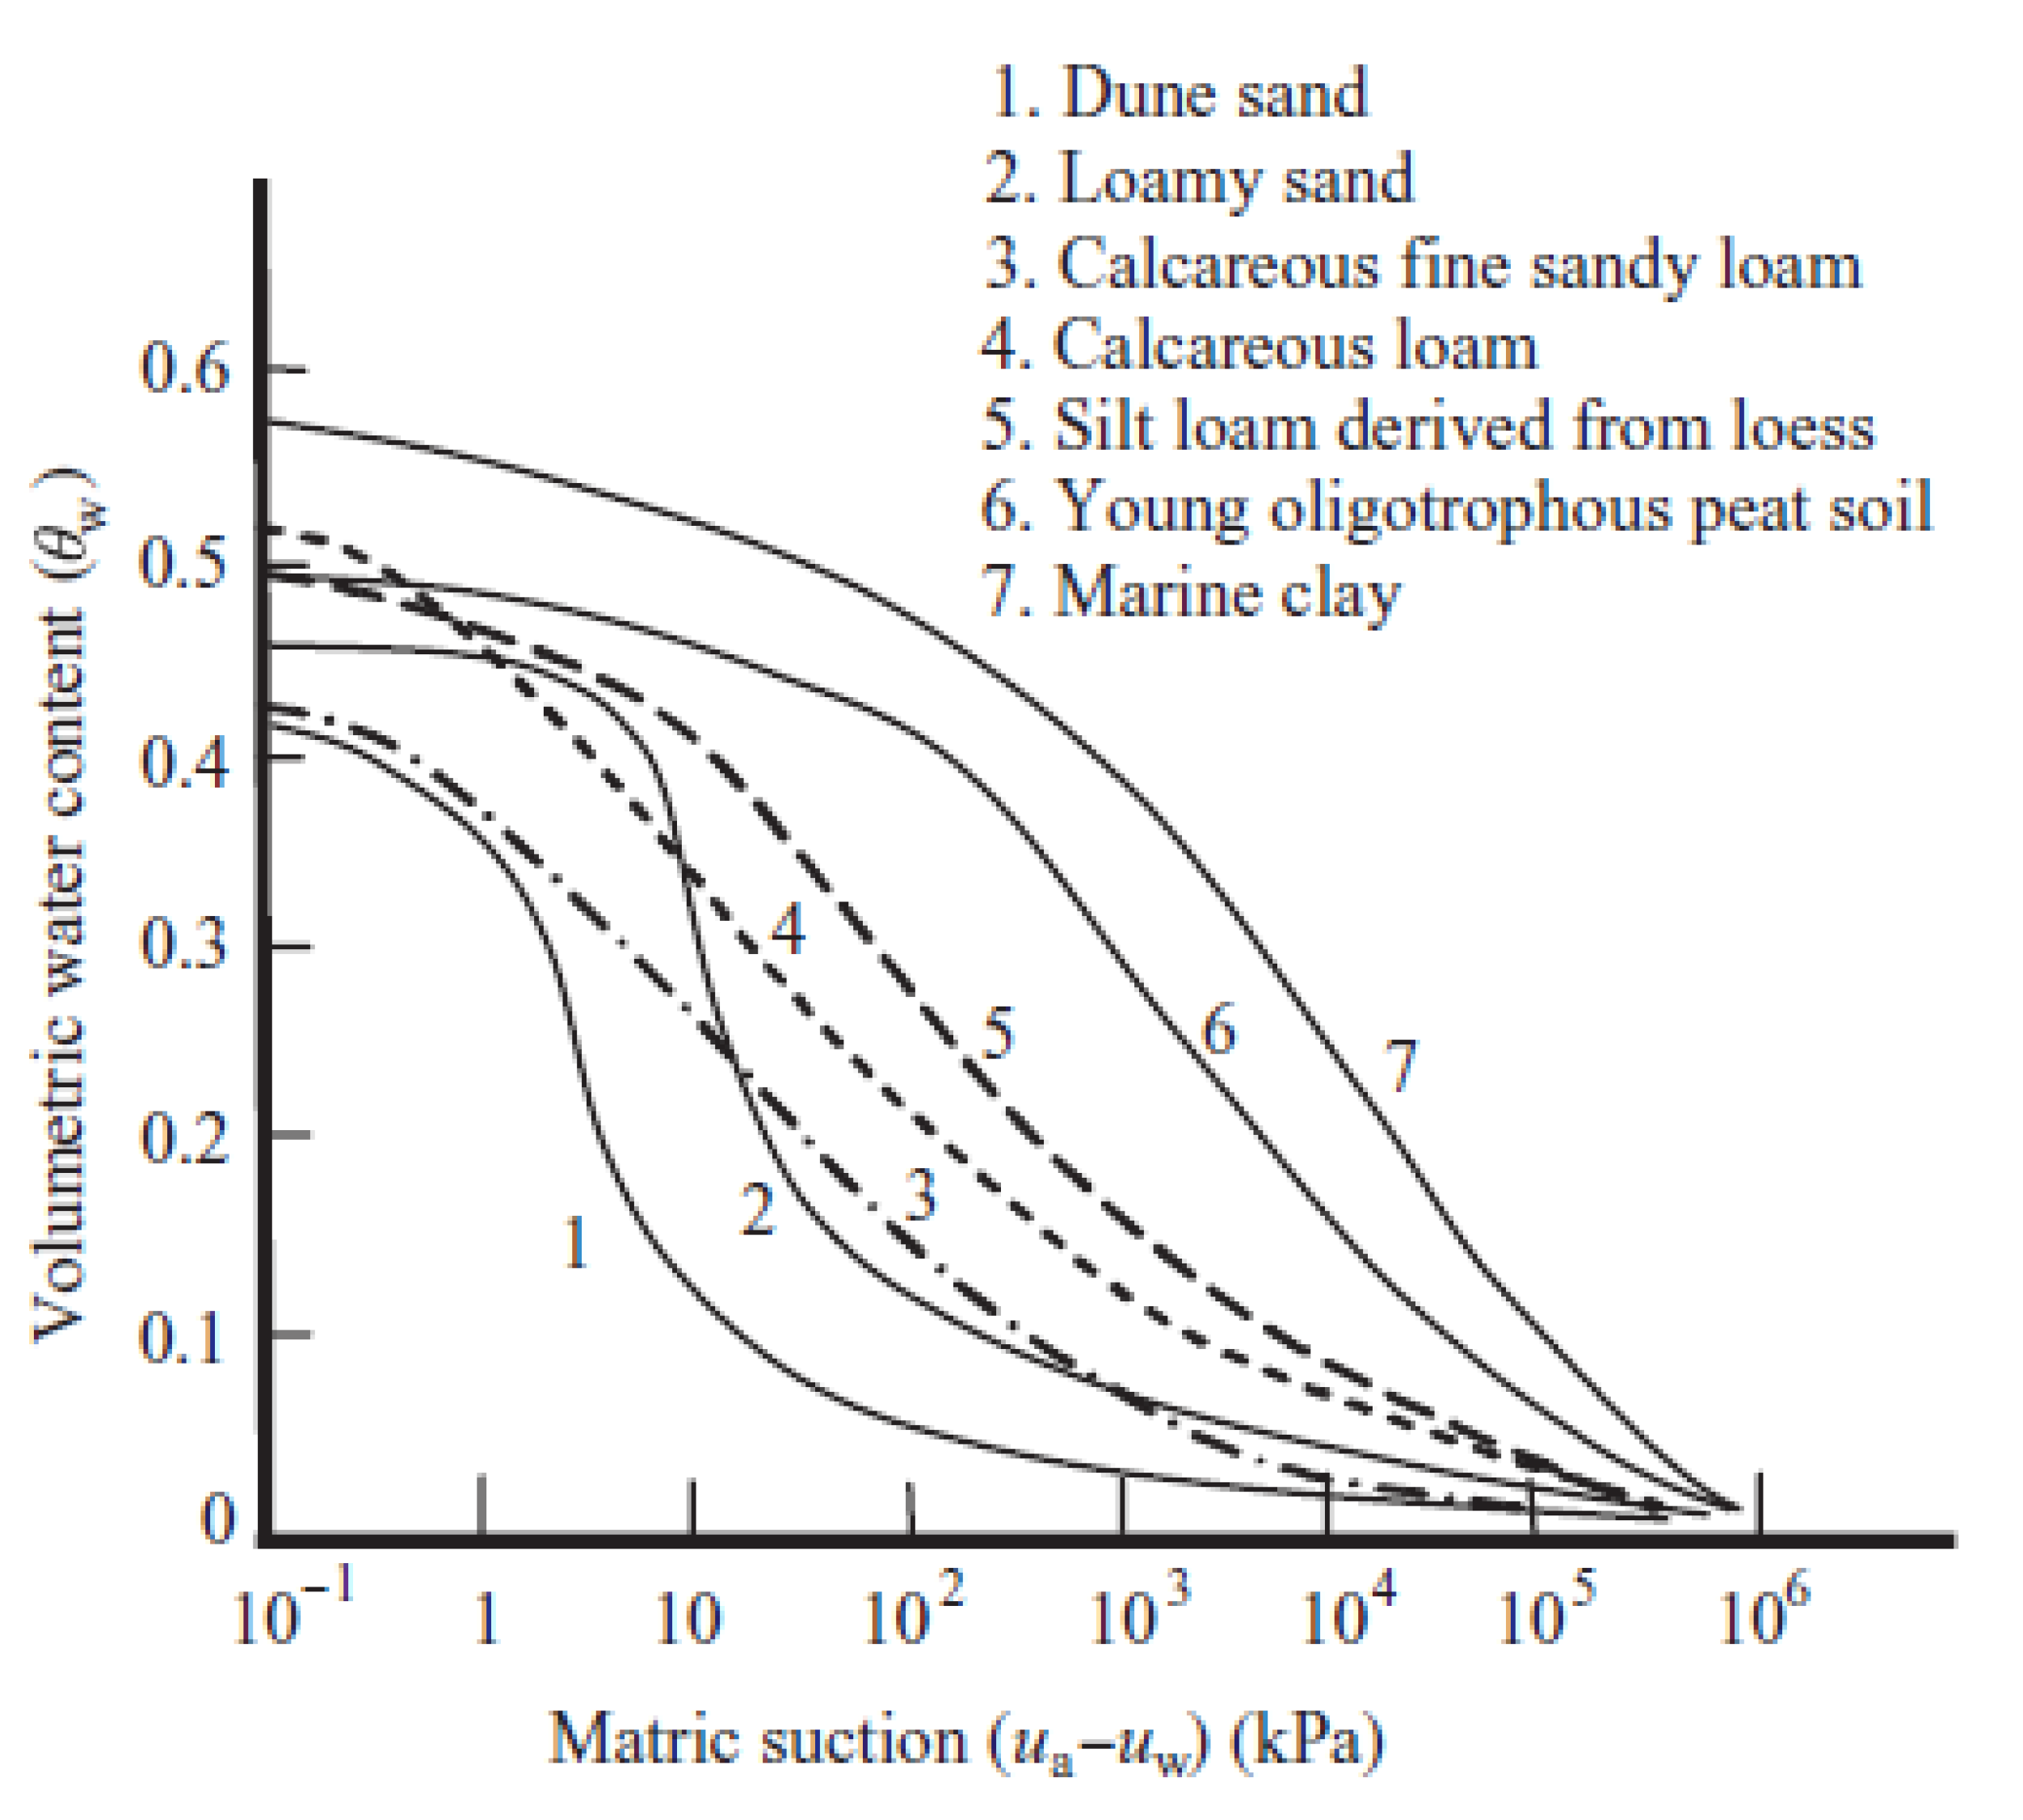
In a Soil–Water Characteristic Curve (SWCC), suction can be expressed in terms of matric suction (ua − uw) or total suction Ψ. However, in practice, the total suction can be assumed to be equal to the matrix (for high values of suction up to 3000 kPa), neglecting osmotic suction.
The total suction corresponding to a water content of zero (close to 10
6 kPa) seems to be substantially the same for all types of soil [
18].
Figure 10 shows the typical SWCC diagrams of volumetric water content θ
w against suction s = (u
a − u
w) for a range of soils from Holland [
19].
The behavior of saturated soils is described by the principle of effective stress [
20], but it would be a mistake to apply it to unsaturated soils characterized by the presence of air, water, and air–water interfaces in the voids.
Fredlund et al. [
21] formulated the shear strength equation for an unsaturated soil as:
where τ
f = shear stress at failure, c′ = apparent effective cohesion, (σ − u
a)
f = (σ
net)
f = the net stress at failure, σ = total normal stress, u
a = pore air pressure, φ
b = angle indicating the rate of increase in shear strength relative to the matric suction at failure, and u
w = pore water pressure.
Equation (1) can be reduced to an effective stress equation as follows:
where
χf = the effective stress parameter, varying between 0 and 1.
Vanapalli et al. [
18] examined the relationship between the degree of saturation and
χf, based on the shear strength results reported by Escario et al. [
22]. The following expressions for
χf are in good agreement with the shear strength for matric suctions ranging between 0 and 1500 kPa.
where
S = degree of saturation,
θw = volumetric water content,
θs = saturated volumetric water content,
κ = parameter optimized to obtain the best fit between measured and predicted values,
θr = residual volumetric water content, and
Sr = residual degree of saturation.
Thu et al. [
23] found from constant water content triaxial testing of compacted silt that φ
b was not linearly related to matric suction. The value of φ
b at low suction (soil remaining saturated) equaled the effective stress friction angle φ’.
2.3.3. Axis Translation Technique
The axis translation technique was devised by Hilf [
24] for the control of suction in unsaturated soils during triaxial laboratory tests [
25]. This technique is based on the principle of obtaining the measurement of positive values of pore water pressure in unsaturated soils by increasing the pore air pressure and total stress, and preventing cavitation. The difference between pore air pressure and the pore water pressure is suction.
The triaxial cell is formed by a double cell that has the same pressure inside and outside the internal cell (
Figure 11). There will be no expansion of the internal cell, which allows the use of a transducer of volume change in the cell pressure line. During the test, it is necessary to measure the volume of water leaving the sample, and the variation of the total sample volume.
A saturated high-air entry ceramic disc is used to prevent air from entering into the pore water measuring system (ceramic discs are produced up to an air inlet value of 1500 kPa). Complete saturation of the disc is essential before its use in a test. Wheeler and Sivakumar [
25] recommended a procedure for this purpose.
In the measuring system, the air entry value of the ceramic disc must be higher than the matric suction to be measured, to avoid pore water going into the system. This increases if the pore size of the disc decreases, controlling the curvature radii of the air–water menisci at the filter boundary.
This technique has two disadvantages: first, in situ stress conditions cannot be replicated in laboratory tests; second, there is a risk of air diffusion through the high air entry filter into the pore water pressure system, producing air bubbles and influencing the acquired measurements.
Different types of stress path tests could be carried out, such as constant suction, constant net stress, constant volume tests, constant rates of strain, or fully drained or undrained strain-controlled tests.
2.4. Laboratory Testing Program
A better understanding of the behavior of unsaturated soils has been obtained from laboratory and in situ studies. In this field, the development of suction tests was a major breakthrough that has radically changed testing methodologies.
Today, perhaps the greatest advances have been reached with the implementation of more complete constitutive models for unsaturated soils in numerical analyses. Laboratory test data are still required to supply representative parameters for the constitutive models, and to provide frameworks of behavior against which the implemented models can be validated.
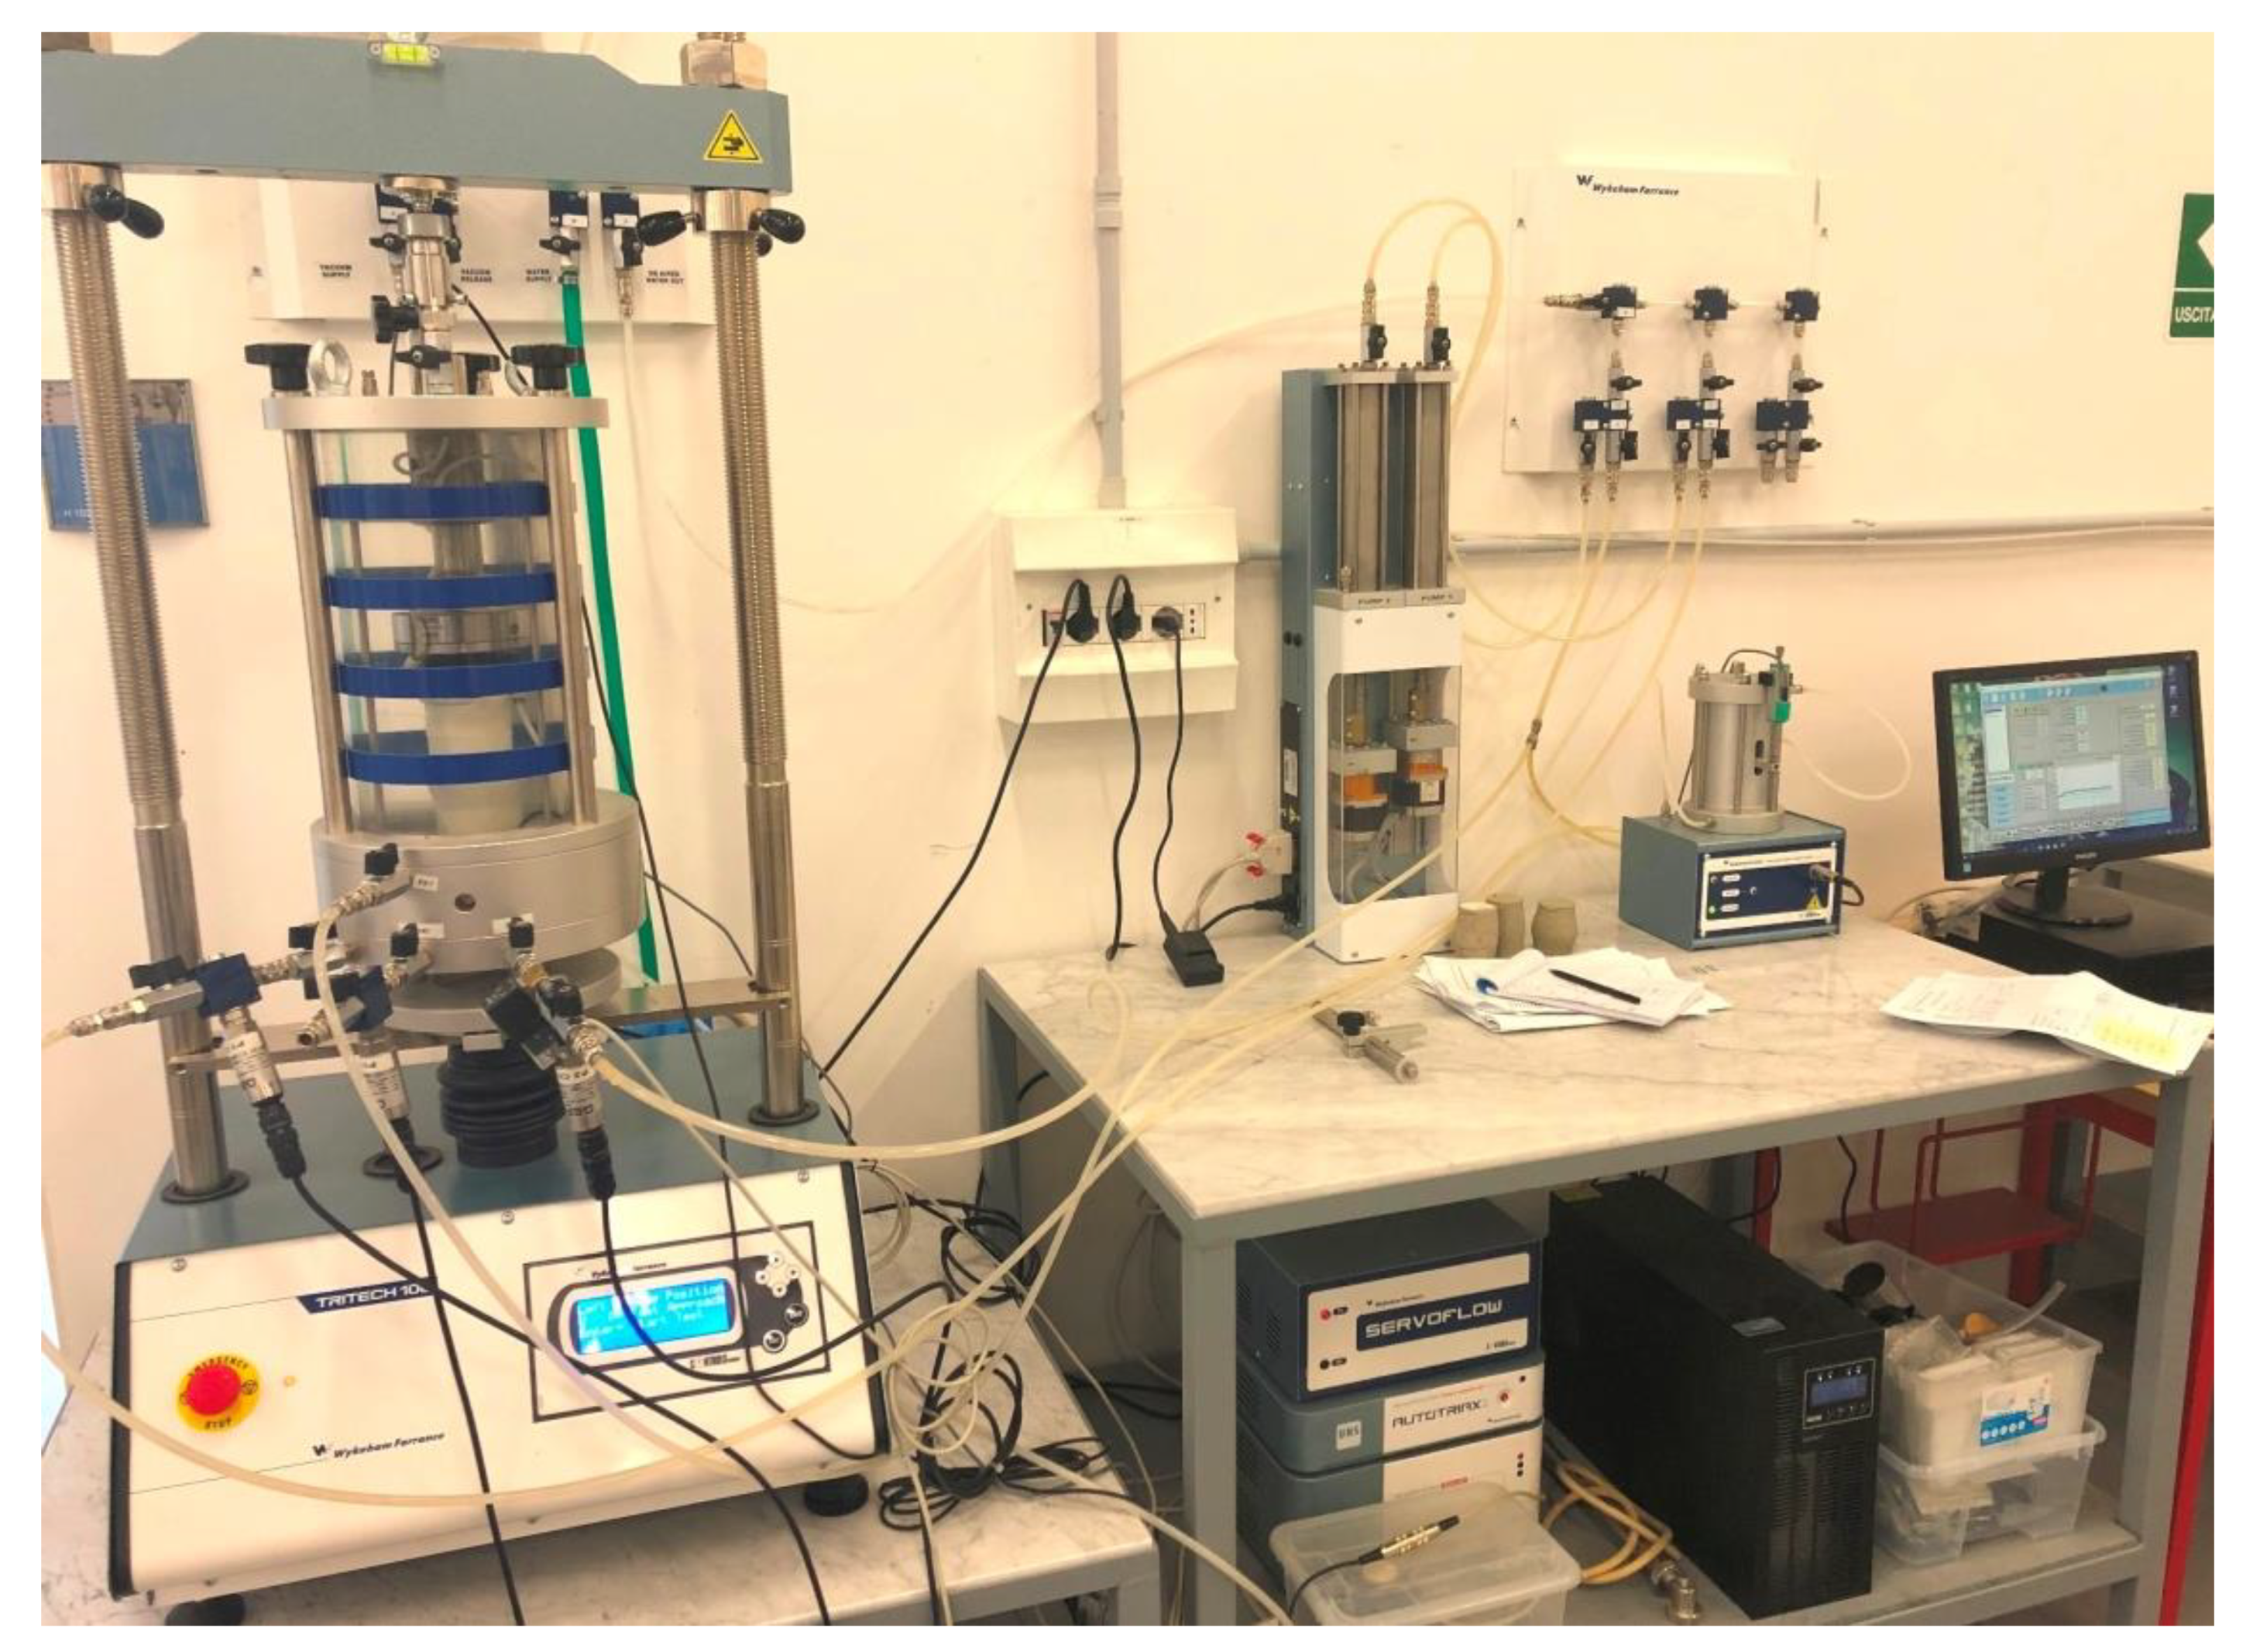
Most existing constitutive models are based on laboratory testing programs that have been achieved using the axis-translation technique, where pore pressures are positive. In this work, the unsaturated stress–strain behaviors of soil specimens were investigated by triaxial tests carried out in the Geotechnical Laboratory of the University of Enna “Kore” (Sicily, Italy).
Figure 12 shows a sketch of the testing apparatus used in this study. During the triaxial tests, the following stages were performed: saturation, isotropic consolidation, SWCC, and monotonic shear using the triaxial machine.
The physical properties of the soil specimens are given in
Table 2. The soil sample used in this study was a sandy clayey silt (
Figure 13), with a soil particle density of 24.76 kN/m
3.
The specimen was packaged through a filter paper and porous stone at the head and high air entry stone (Haes) at the base, and wrapped in a membrane and o-rings. First, the Haes disk was saturated for 24 h with a pressure of 800 kPa before starting the test.
In the SWCC stage, the air pressure at the top of the soil sample was increased and decreased in steps of 20 kPa above the water pressure of the pores, recording the different suction values for the construction of the Soil–Water Characteristic Curves (SWCC). Initially, the matric suctions (plateau of the SWCC) were increased to about 100 kPa (
Table 3). Then, in the monotonic shear stage, a rate of strain of 0.30%/hr was calculated, and an axial strain
ε of 20% was established. In the final state of loading, the failure mode shown in
Figure 14 was observed.
In carrying out the test, it was possible to analyze the behavior of the specimen subjected to different load steps until the established strain value was reached.
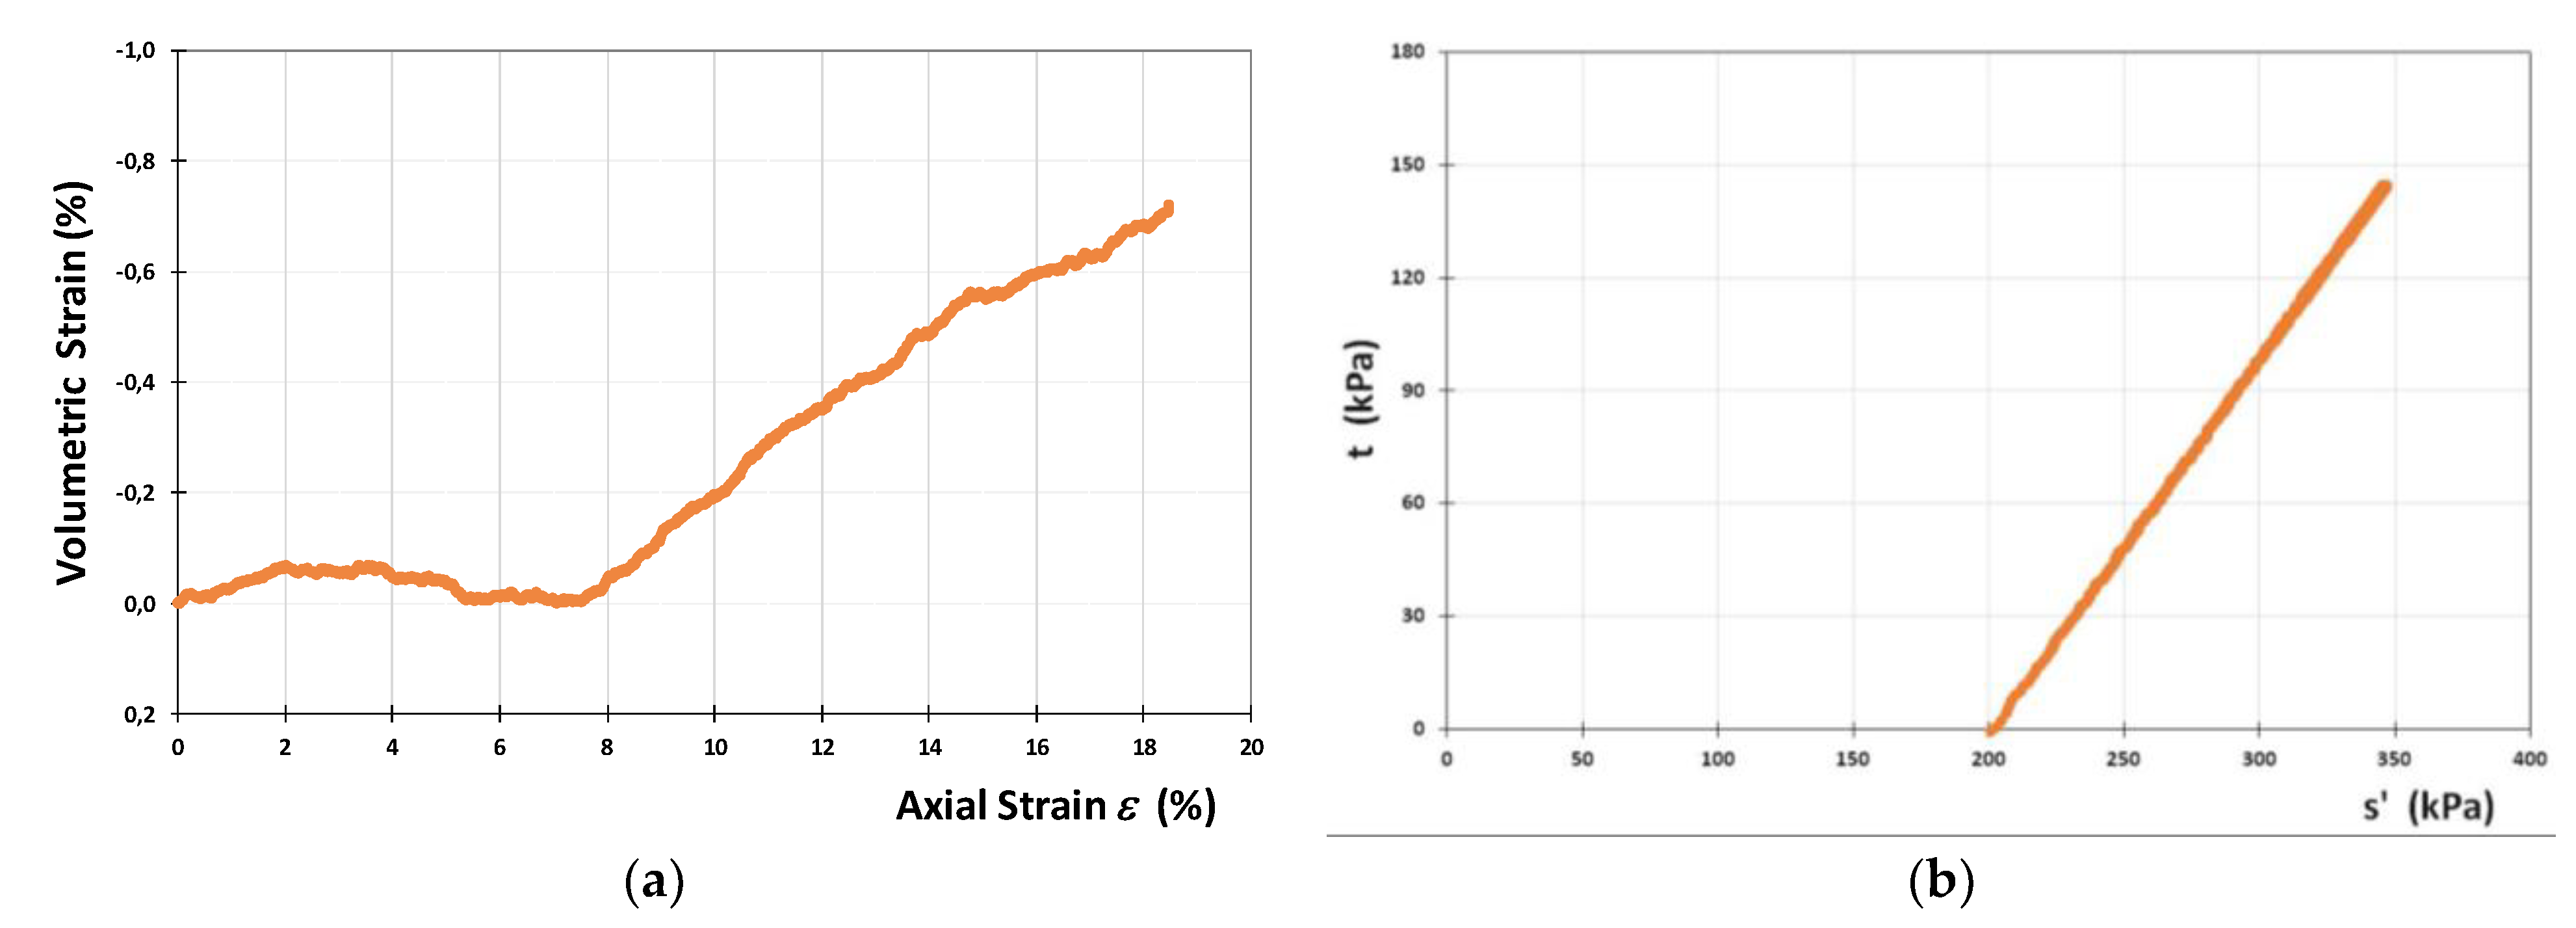
In
Figure 15a,b, the relationship between soil suction and volumetric water content, and the relationship between deviatoric stress and axial strain for an unsaturated specimen are reported, respectively. Finally, in
Figure 16a,b, the volumetric strain versus axial strain relationship and the stress-path for the unsaturated specimen on the (s’; t) plane are reported, respectively, with
s’ = (σ’
1 + σ’
3)/2 and
t the maximum shear stress (σ
1 − σ
3)/2 (critical state variable for the unsaturated soil).
3. Numerical Modeling
The aim of the proposed study was to investigate rainfall-induced landslides on partially saturated soil slopes, by modeling the February 2014 debris flow that occurred in the Enna municipality (Sicily, Italy). The specific objectives of this study were: (1) the identification of geomorphological features and the spatial model of the landslide, (2) integrated analysis through laboratory tests and field tests and, finally, (3) discussion of the results of the numerical analysis.
Propagation models applicable to hyper-concentrated flows differ for the adopted rheological schemes. Simplified single-phase models find an “equivalent” fluid, whose rheological properties are such that the bulk behavior of the flowing body can simulate the expected bulk behavior of the real landslide. Generally, the debris flow is considered as a homogeneous Bingham fluid, composed of a mixture of water and sediment. The hypothesis of the Binghamian nature of the fluid is necessary in order to simulate the arrest of the flow. The rheological characteristics can vary depending on the lithology, grain-size distribution, and sediment concentration.
To check the possibility of numerically simulating the debris flow event, the FLO-2D code [
26], which is not fully two-dimensional, based on a monophasic Bingham scheme and modeled through the quadratic rheological law developed by O’Brien and Julien [
27], was used.
This code is widely used, even though the setting of rheological parameter values for prediction purposes is still problematic. The presented numerical analysis, in particular, intended to investigate: (i) the capability of the code to simulate the dynamics of the debris flow (propagation and deposition) and (ii) the influence of the associated rheological parameters on the numerical results, calibrated from the soil parameters evaluated by in situ and laboratory tests, including non-conventional triaxial tests in unsaturated conditions.
3.1. The FLO-2D Model
FLO-2D is a commercial computer code developed by O’Brien [
26], and adopted for debris flow phenomena modeling and delineating flood hazards. It is a pseudo-2D model in space that adopts depth-integrated flow equations.
In the FLO-2D model, hyper-concentrated sediment flows are simulated considering the flow as a homogeneous (monophase) non-linear Bingham fluid, based on an empirical quadratic rheological relationship developed by O’Brien and Julien [
27].
In particular, the basic equations implemented in the model consist mainly of the well-known continuity equation and equation of motion, according to a total friction slope
Sf expressed as:
where
h is the flow depth,
V is the depth-averaged velocity,
g is the gravitational acceleration,
τB is the Bingham yield stress,
ρ is the mixture density,
k is the laminar flow resistance coefficient,
μB is the Bingham viscosity, and
n is the pseudo-Manning resistance coefficient, which accounts for both turbulent boundary friction and internal collisional stresses, expressed as:
The yield stress
τB, the dynamic viscosity
μB, and the resistance coefficient
n are influenced by the sediment concentration, and these parameters can be described by the following equations [
13]:
where
Cv is the volumetric concentration and
α1,
α2,
β1, and
β2 are the empirical coefficients defined by laboratory tests performed by O’Brien and Julien [
27], while
nt is the turbulent
n value.
More detailed information about the numerical scheme and the general constitutive fluid equations adopted can be found in O’Brien [
26].
3.2. Back Analysis Procedure
Several applications of the FLO-2D model can be found in the literature, which mainly differ in relation to the sediment characteristics, and hence, in the adopted rheological parameters [
28,
29,
30,
31]. Various comparisons with other methodologies [
32,
33] have demonstrated that FLO-2D, if appropriately calibrated, represents a useful tool for predicting the behavior of future landslides of the same type and in similar settings.
In this case, to construct the DTM for modeling the debris flow in Enna (
Figure 17), a grid system with a cell size of 2.0 × 2.0 m was implemented by the FLO-2D code [
34].
The hydrological input reported in
Figure 18a,b was applied at the upstream section of the catchment basin, where the triggering was observed [
35,
36,
37,
38]. The rainfall from the ground surface is a key factor in slope instability. Many debris flows begin as shallow landslides induced by direct infiltration of intense rainfall and runoff into cover materials [
39,
40,
41,
42,
43,
44,
45]. In FLO-2D, the precipitation is an input and it starts after triggering to estimate the propagation velocities and the mobilized volumes.
The discharge rate value of the debris flow in the upper part of the catchment basin was calculated according to the expression proposed by Armanini et al. [
46].
The following values of the empirical coefficients defined by the laboratory tests performed by O’Brien and Julien [
27],
α1 = 0.0060,
β1 = 19.9,
α2 = 0.0007, and
β2 = 29.8, were chosen for the numerical simulation, with the aim of selecting those corresponding to similar characteristics of the area from morphological and lithological points of view [
31].
The presence of the road has been taken into consideration. Assuming a value of the Manning resistance coefficient equal to n = 0.04, the debris flow concentration was chosen equal to 0.57, while the slope angle was α = 20°.
More detailed information about the numerical scheme and the general constitutive fluid equations adopted can be found in O’Brien [
34].
According to Armanini et al. [
47], a relationship can be found between the friction angle of the soil and the debris flow concentration. With this aim, in the future, triaxial tests will be carried out to investigate this possibility, to relate the values of the coefficients chosen in the numerical simulation to the strength parameters of the unsaturated soil.
3.3. Numerical Simulation
A reconstruction of the inundated area (
Figure 19a) was obtained as the output of the simulations performed by FLO-2D [
34]. The computed maximum flow depths during the event are presented in
Figure 19b. The highest predicted flow depth is about 4.0 m.
Figure 19c represents the final flow depths. The highest value of the predicted final flow depth is about 1.4 m.
Finally, the predicted maximum velocities are shown in
Figure 19d. It is possible to observe that the maximum velocities were registered corresponding to the upper part of the basins, where the slope is the highest, with values ranging from 1 to 2 m/s.
The predicted values are, in general, in good agreement with those observed. This is supported by the comparison between the computed volumes and the measurement of the deposited sediment after the event, resulting from the surveys of Regional Civil Protection [
38].
Several numerical simulations have been performed, attributing different concentration values to the mixture, and it can be deduced that the simulations carried out by using higher concentration values for the incoming hydrograph led to results that differ a lot from reality, as deposit height is higher and inundated areas are reduced compared to in reality. When decreasing the concentration value, there is instead a considerable increase in the area affected by the debris flow, with a decrease in flow height due to a greater fluidity of the mixture.
From this point of view, the present study gives us better knowledge of the hydraulic parameters that can be used for other models in areas with similar soil composition, with the aim to investigate the global dynamics of the event.
These results can be applied to risk calculations, reproducing in thematic maps by different risk levels the distribution of the flow mass on the propagation path, its intensity, and the zone where the elements will experience an impact.
4. Concluding Remarks
Debris flows are natural phenomena which often cause severe damage and fatalities. Therefore, in the last few decades, many efforts have been made to develop models able to numerically simulate debris flow propagation, with the aim of producing reliable hazard maps.
The rainfall from the ground surface is a key factor for slope instability, as well as the pre-event degree of saturation of the soil and the interaction between the slope and the atmosphere. Many debris flows begin as shallow landslides induced by direct infiltration of intense rainfall, and runoff into cover materials.
Similarly, the pore water pressure plays a role during the propagation stage. The entrainment of further material makes the propagation patterns more complex.
The dynamic approach can be numerically solved through models based on fluid mechanics. It is possible to find propagation models applicable to hyper-concentrated flows, which mainly differ in their adopted rheological schemes. Thus, the choice of rheological parameters is a fundamental aspect of the numerical simulation.
To improve knowledge of the rheological properties of debris flow, comparisons between numerical predictions, innovative laboratory tests, and results deduced by case histories or physical model simulations can be used.
In this context, the present study underlines the possibility of acquiring knowledge of the hydro-mechanical parameters, which can be used for numerical simulations in areas with a similar soil composition. Finally, matric suction, which reflects soil infiltration, can be considered very important for the analysis of rainfall-induced landslides.


