Abstract
The geothermal powerplant of Soultz-sous-Forêts (France) is investigating the possibility of producing more energy with the same infrastructure by reinjecting the geothermal fluid at lower temperatures. Indeed, during the operation of the powerplant, the geothermal fluid is currently reinjected at 60–70 °C in a deep fractured granite reservoir, and the MEET project aims to test its reinjection at 40 °C. A 3D hydrothermal study was performed in order to evaluate the spreading of the thermal front during colder reinjection and its impact on the production temperature. In the first step, a 3D structural model at fault scale was created, integrating pre-existing models from 2D vintage seismic profiles, vertical seismic profiles, seismic cloud structure and borehole image logs calibrated with well data. This geometrical model was then adapted to be able to run hydrothermal simulation. In the third step, a 3D hydrothermal model was built based on the structural model. After calibration, the effect of colder reinjection on the production temperature was calculated. The results show that a decrease of 10 °C in the injection temperature leads to a drop in the production temperature of 2 °C after 2 years, reaching 3 °C after 25 years of operation. Lastly, the accuracy of the structural model on which the simulations are based is discussed and an update of the structural model is proposed in order to better reproduce the observations.
1. Introduction
The Upper Rhine Graben is known for its great potential for the exploitation of geothermal energy at high temperatures. Indeed, it is characterized by strong local geothermal anomalies. Usually, the geothermal gradient in continental crust is approximately 30 °C/km. However, it can reach 100 °C/km in the Upper Rhine Graben (URG) thanks to large convection loops in the granitic basement and the Triassic sandstone [1], up to the Muschelkalk in some parts of the graben.
Soultz-sous-Forêts is located at around 50 km north of Strasbourg in the URG. The geothermal project began in 1984 and the first drilling began in 1987 [2]. The initial goal was to use the heat in the deep crystalline rocks to produce electricity by fracturing the granite to create an artificial heat exchanger as part of a hot dry rock (HDR) project. For this, an initial phase of drilling, stimulation, circulation tests and observation was carried out until 2007 to study the crystalline rock and the feasibility of future operations. This showed that hydrothermal fluid circulation was occurring in the natural fracture system. The geothermal fluid is a 100 g/L NaCl type brine. Hydraulic, thermal and chemical stimulations were performed to increase the permeability and the connections between the reservoir and the wells [3]. The term Enhanced Geothermal System (EGS) was defined from the research work on Soultz-sous-Forêts. The site gradually shifted from a research to industrial facility. Commercial electricity production began in June 2016 [4].
Three wells are currently operated, GPK-2, GPK-3 and GPK-4, reaching a depth of more than 5000 m. Their trajectories are distributed in the north–south direction, following the maximum horizontal stress direction. GPK-2 is the production well and GPK-3 and GPK-4 are used as injection wells. The powerplant uses an organic Rankine cycle (ORC) to convert the heat into electricity to produce a gross power of 1.7 MWe. Currently, the powerplant produces, in a sustainable manner, fluid at more than 150 °C and the injection temperature is approximately 60–70 °C [5].
The MEET H2020 project (Multidisciplinary and multi-context demonstration of EGS exploration and Exploitation Techniques and potentials) aims at improving deep geothermal energy development in Europe in different ways [6]. In existing EGS plants, it plans to demonstrate the feasibility of reinjecting at lower temperatures, down to 40 °C, thus increasing the potential heat valorization of 30%. For this purpose, various investigations have been carried out in the framework of the MEET project, regarding the on-site feasibility of colder reinjection [7] and its chemical effects [8]. The objective of the works presented here was to evaluate the potential consequences of a decrease in the injection temperature on the production temperature on a long-term basis.
2. Materials and Methods
2.1. Pre-Existing Soultz Structural Models
The European Cenozoic Rift System groups several rifts formed in response to Alpine and Pyrenean orogens at the beginning of the Cenozoic era. The URG is one of these Tertiary rifts. The rifting began during the Lower Eocene due the Pyrenean compressive tectonic phase, which created or reactivated N–S and NE–SW Variscan faults. It was followed by an E–W extension tectonic phase during the Oligocene, which was characterized by strong subsidence [9]. This crustal thinning induced the rise of the Moho, which formed regional thermal anomalies at URG scale.
The basement has been reached at 1400 m at Soultz-sous-Forêts. It is composed of two different granites: a porphyritic monzogranite and a fined-grained two-mica granite. The latter is found at the bottom of wells, at around 4500 mTVD [10]. The first one can be very hydrothermally altered, especially around nearly vertical fault zones, which are very abundant within the first km at the top basement. The small-scale fractures associated with fault zones are mostly sealed with secondary quartz, calcite and illite.
The monzogranite is covered by sedimentary layers from Permo-Trias to Quaternary. The Permian is poorly represented. The Trias sequence is the most important in this sedimentary cover, from 1350 m to 750 m, characterized by sandstones, alternation of limestone, marls and dolomites (from marine to fluvial environment). Then, Jurassic layers with alternation of limestones and marls appear from 750 m to 600 m. The Tertiary era marked the opening of the rift with the presence of evaporites and deposits of thin lacustrine sediments.
Three pre-existing structural models of the nearby Soultz reservoir have been used in order to build the complete structural model presented in Section 4.1:
- The first 3D structural model of Soultz-sous-Forêts was built in 1994 [10] from well data and seismic profiles interpreted by the BRGM [11]. This model contains 5 horizons from Jurassic to granite layers and faults in the sedimentary part.
- Later, a new interpretation of the PN84J seismic line [12] allowed the achievement of another 3D geological model. It considers 3 horizons: the granitic basement, the Buntsandstein unit and the Mélettes layer. It also contains faults in the sedimentary part.
- In another model [13], the two-mica granite interface was considered as a layer.
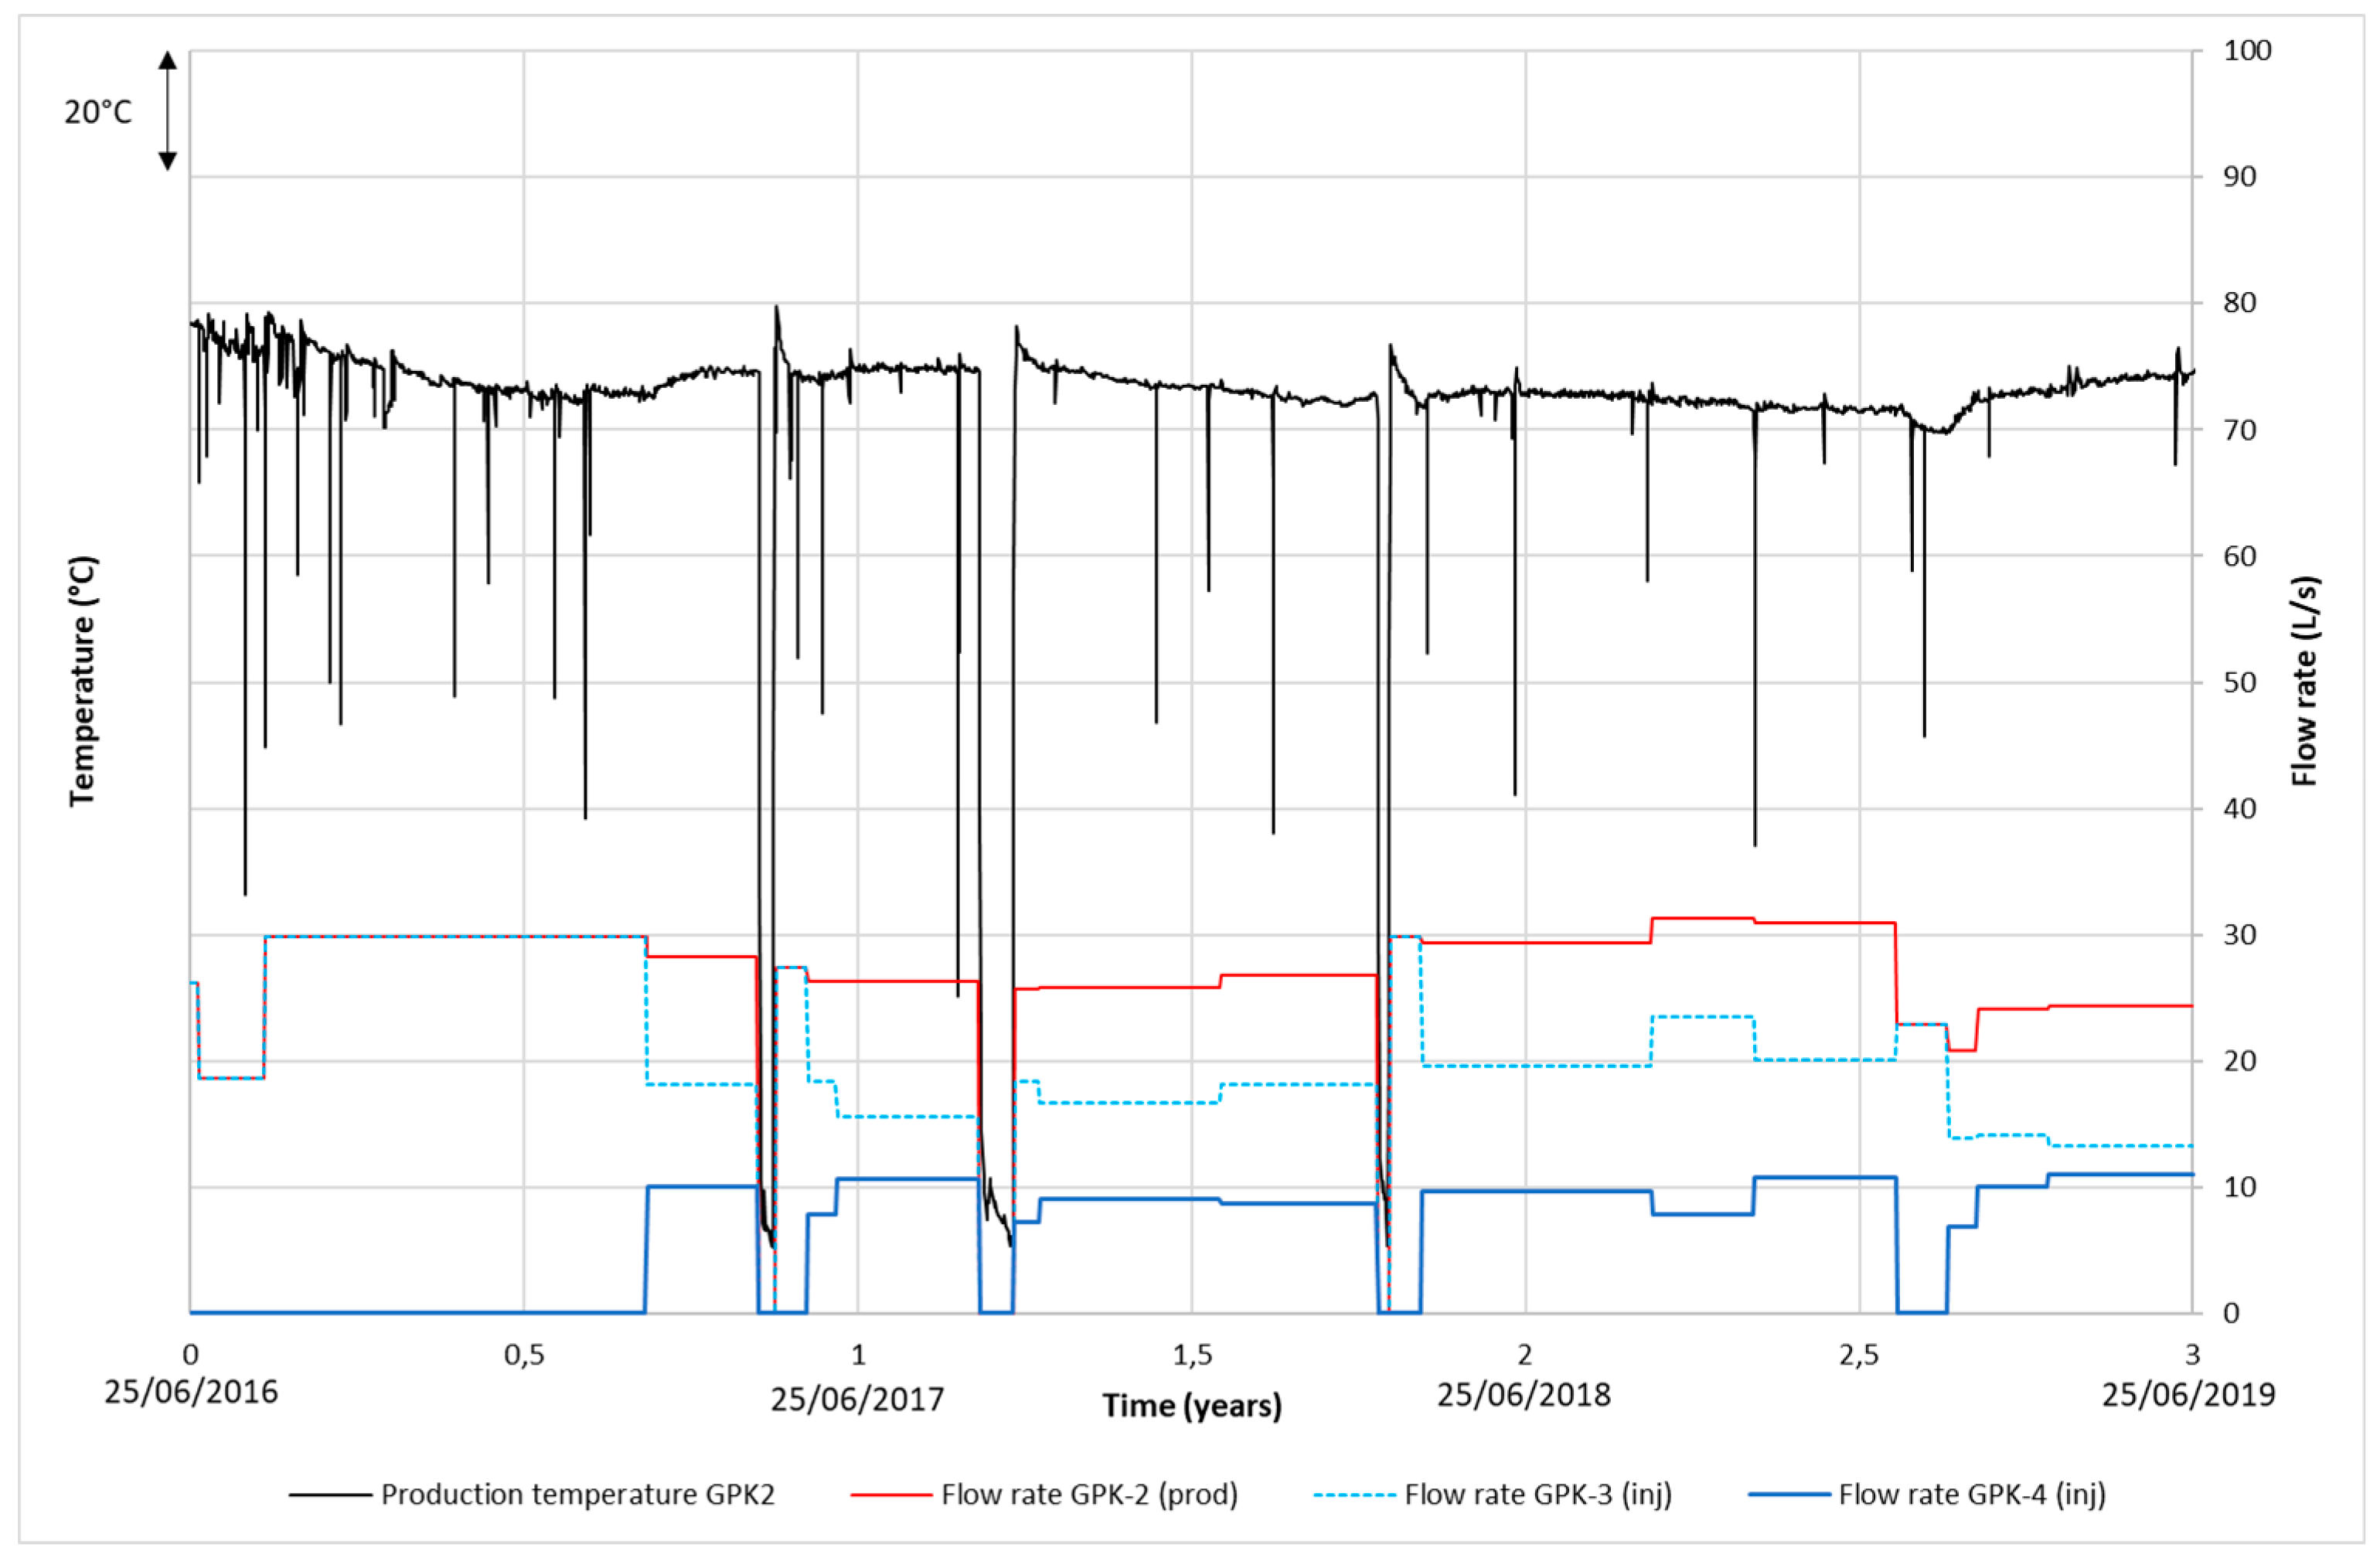
2.2. Operation Data and Calibration Dataset
The powerplant is operated with GPK-2 as a producer and GPK-3 and GPK-4 as injectors. GPK-2, GPK-3 and GPK-4 are cemented to 1431, 1447 and 1446 mMDGL (Measured Depth from Ground Level), respectively. At these depths, GPK-2 has been drilled in 8″1/2 until 5057 mMDGL and cased in 7″ until 4440 mMDGL. GPK-3 and GPK-4 have been drilled in 9″5/8 until 4592 and 4767 mMDGL and in 8″1/2 until 5111 and 5270 mMDGL. In these wells, a zone between 4000 m and 4500 m TVD is cemented. GPK-2 is cemented between 4200 m and 4500 m.
Feeding zones behind the casing have been reported [14] (in the upper granite reservoir section) for GPK-2 and GPK-3, connecting the well to its annulus from, respectively, 1431 and 1447 mMDGL to 4170 and 3988 mMDGL. As GPK-4 does not present any significant leaks in its casing between 1400 m and 4500 m, only its open hole below 4767 mMDGL is considered. The trajectory of GPK-2 and GPK-3 was taken from the top of Buntsandstein the bottom to take into account the known feed zones. Indeed, the cased section is cemented at the top and bottom only, and nearly the entire granite section can be considered an open hole. The Buntsandstein is then cemented but has been taken into account for its hydrothermal connection with upper granite via nearly vertical fault zones.
Operation data used for model calibration range from 25 June 2016 to 24 June 2019 (3 years). The average production rate is 25–30 L/s. Injection is 100% in GPK-3 until the beginning of March 2017 (almost 7 months) and is then split into GPK-3 and GPK-4 (see Figure 1).
Figure 1.
Soultz-sous-Forêts operation data used for calibration. Temperature absolute values are hidden for confidentiality reasons. Source: GEIE EMC.
2.3. Software and Codes Used
The works presented in this paper could be carried out using two commercial software licenses:
- The reservoir modeling software PETREL 2019, developed by Schlumberger, for structural modeling, using the Structural Framework workflow.
- The Finite Element simulation software FEFLOW 7, edited by DHI, for hydrothermal calculation.
The meshing of the simplified structural model was performed with MeshIt, a software program for the three-dimensional volumetric meshing of faulted reservoirs, developed by GFZ [15].
3. Results
3.1. Structural Model
3.1.1. Complete Structural Model
For this study, the model of Renard and Courrioux 1994 [10] was used as the basis. The horizons and regional faults provided in this model are based on vintage 2D seismic line interpretations. The horizons and regional faults of this model were loaded and reconstructed in Petrel. The well trajectories of GPK-1, GPK-2, GPK-3, GPK-4, EPS-1 and 4550 were also imported into the model. The two-mica granite layer [11] was also imported as a layer according to the depth in GPK-3 and GPK-4 where it was observed.
The major faults from this model, identified in the sedimentary units (Kutzenhausen, Soultz and Hermerswiller faults), were extended into the basement.
For the lower part of the structural model, information about local faults was collected thanks to different data [13,16]:
- Cuttings;
- Well logs including oriented borehole logs (caliper, gamma ray, Ultrasonic Borehole Imager);
- Vertical seismic profiles (VSPs);
- Microseismicity studies.
As a result, the constructed model contains six geological layers. A total of 50 structures representing local faults could be integrated into the Petrel model (Figure 2). Each fault was added by informing its orientation and its dip in the table of the well that is intersected. Then, in the 3D model, each fault identified in several wells was linked to create surfaces.
Figure 2.
Complete 3D structural model of Soultz-sous-Forêts (in gray: regional fault zones from 2D seismic data interpretation; in color: local fault zones). The arrow on the bottom right of the figure indicates north.
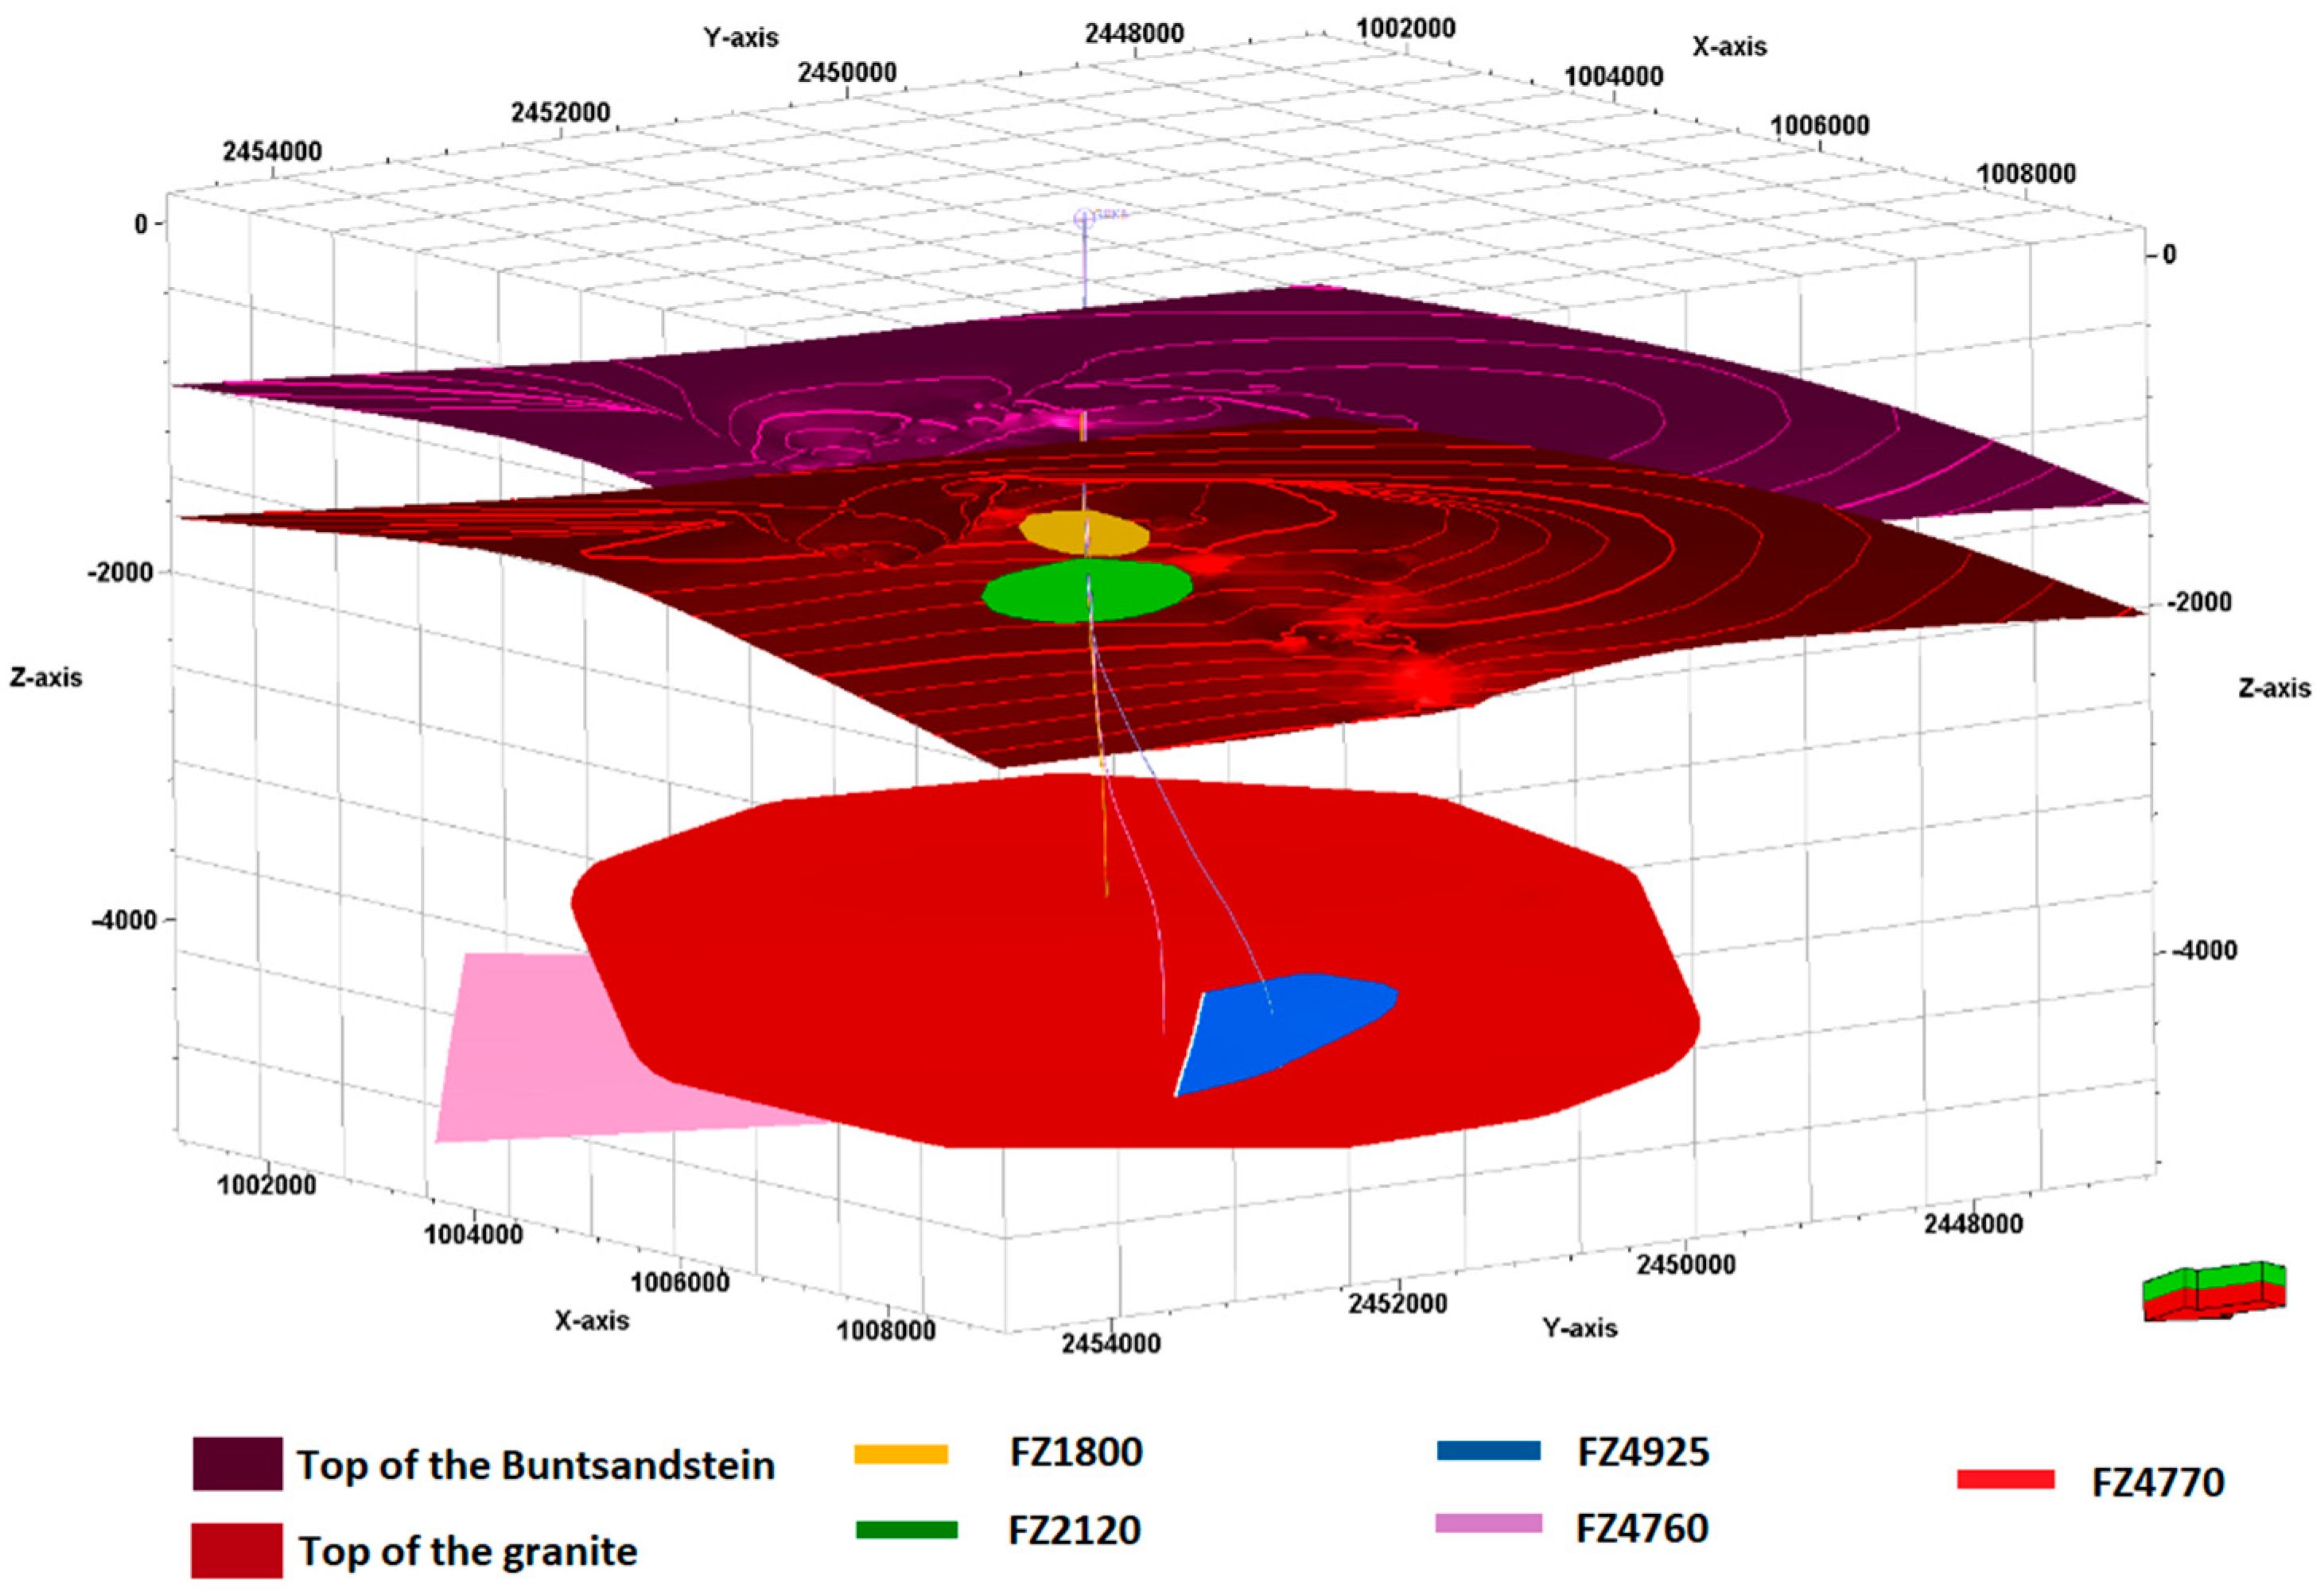
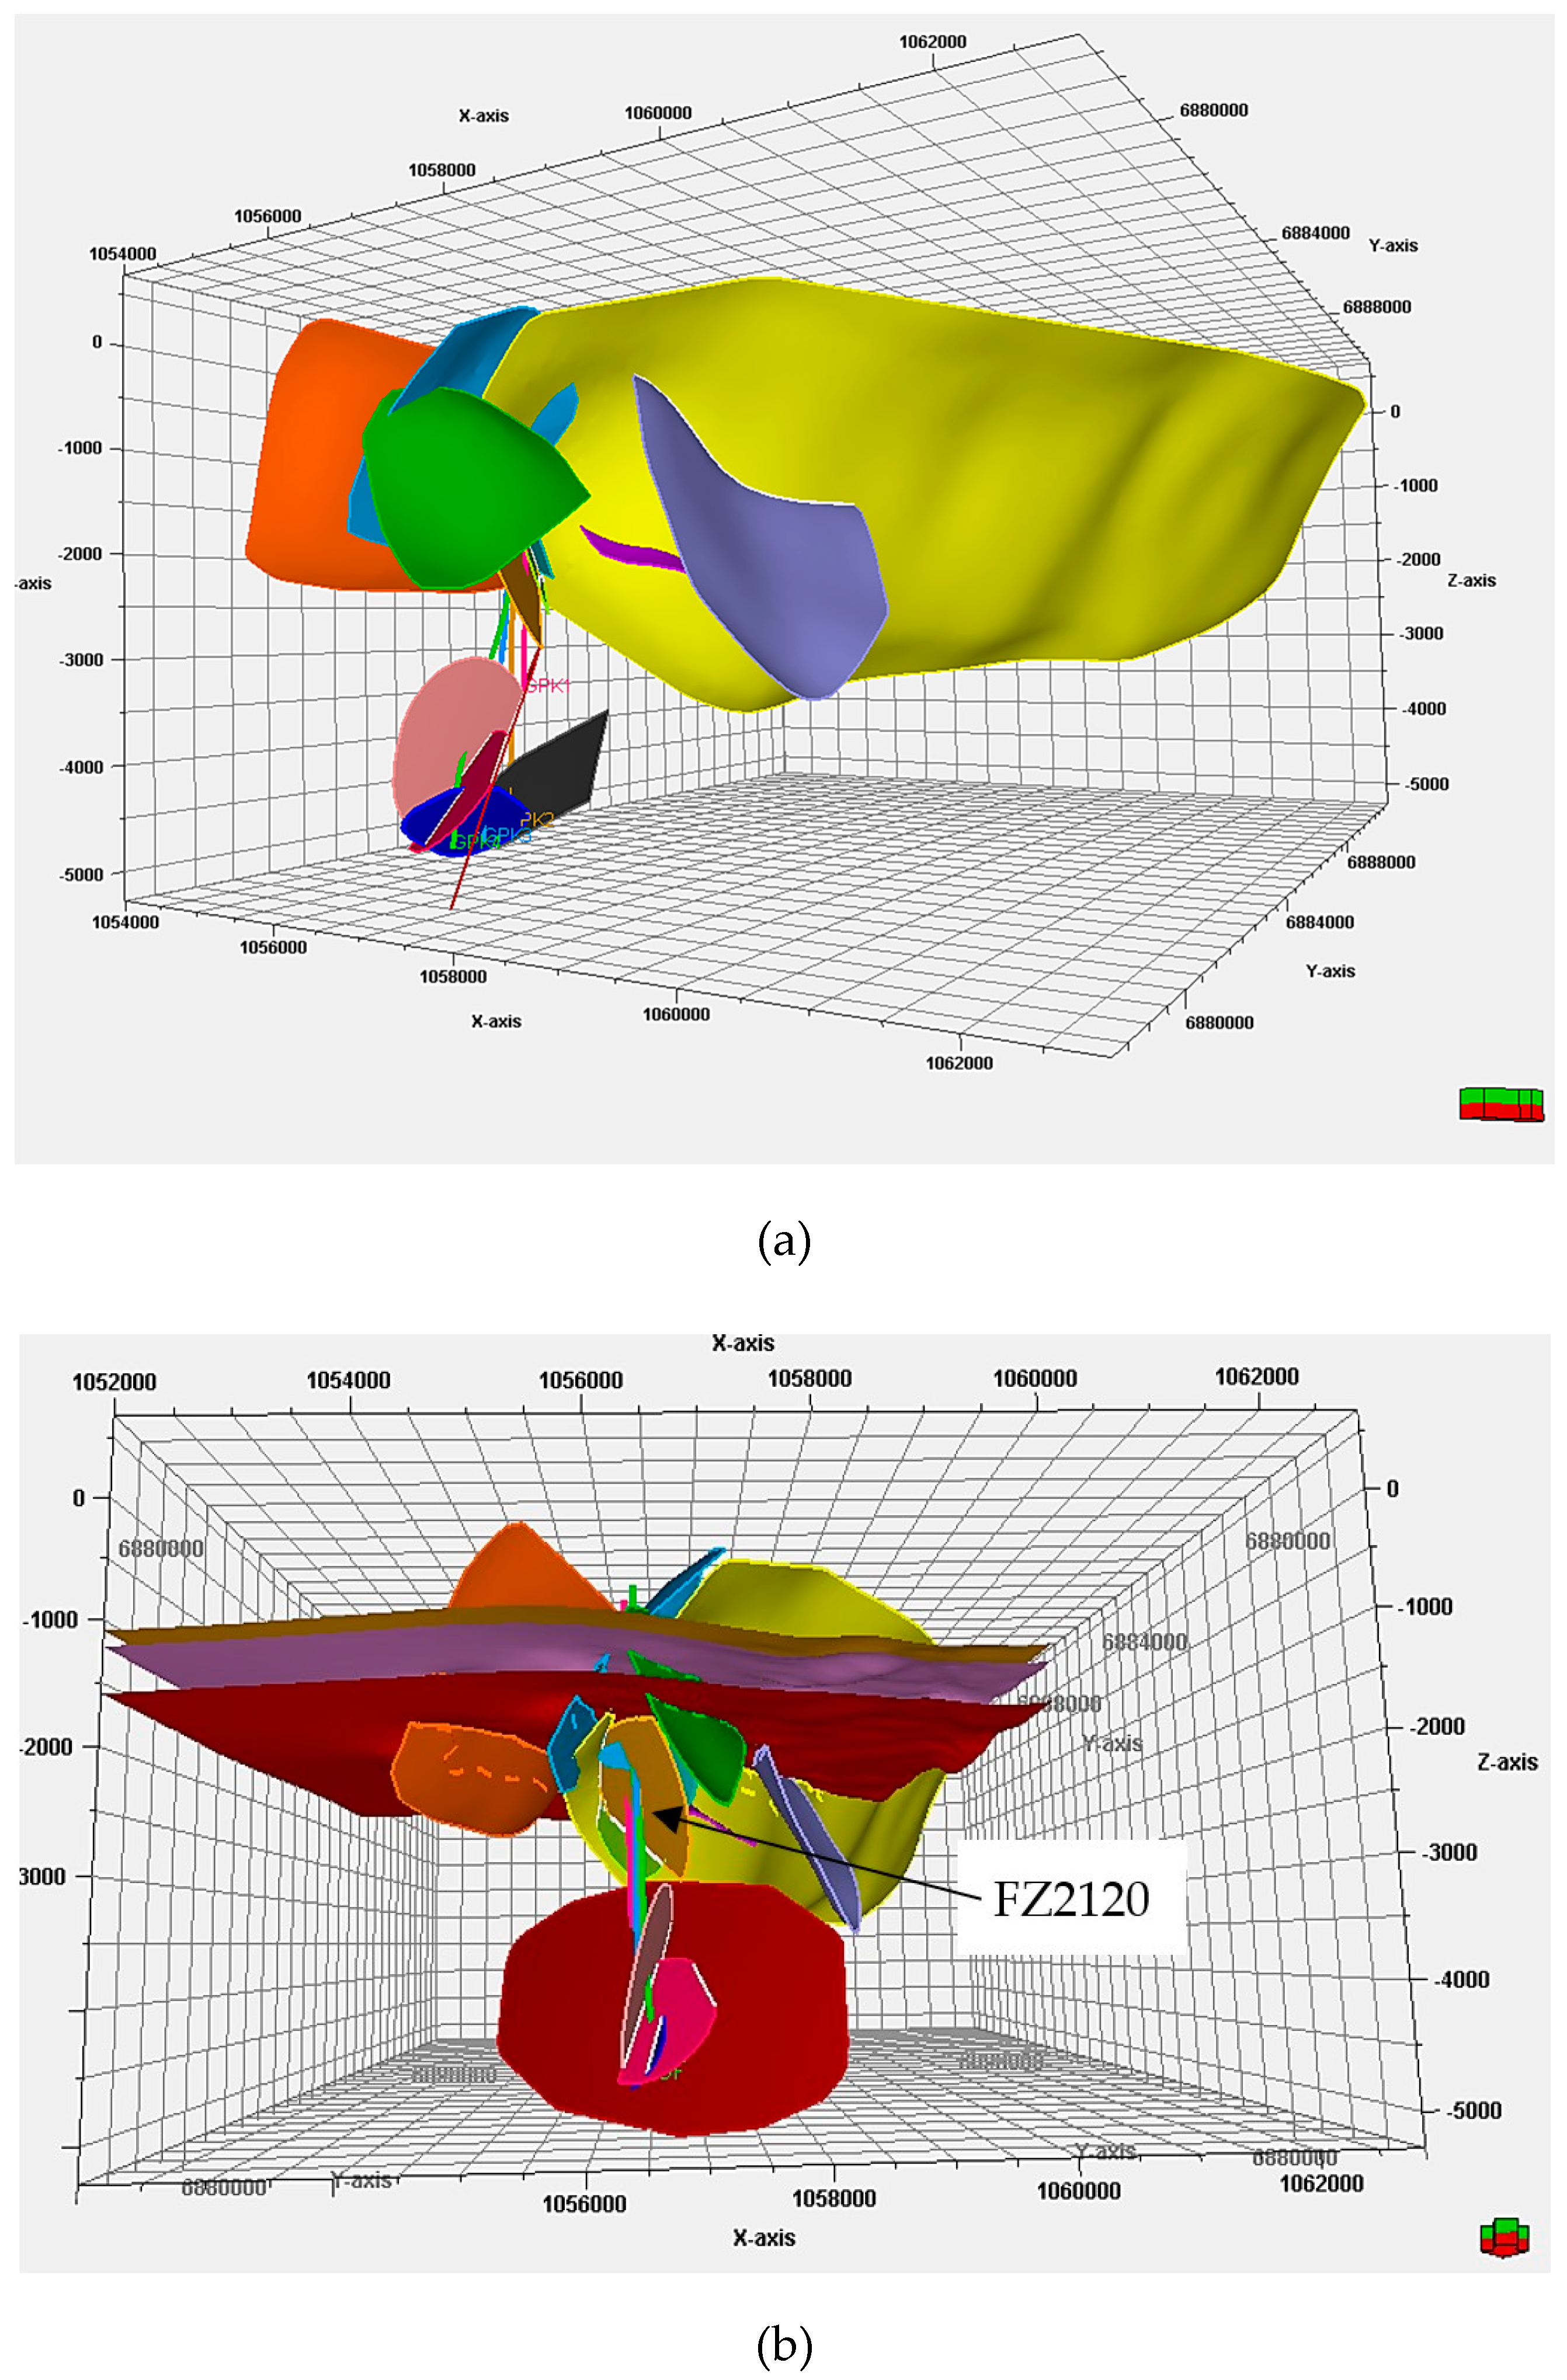
3.1.2. Simplified Structural Model for Meshing
The sedimentary faults are considered far enough from the wells to not have any influence on the simulations, so it was decided to not keep them in the 3D hydrothermal model. Indeed, these faults are located at a distance greater than the downhole distance between the wells, which is generally considered the well radius of influence in the reservoir for geothermal systems.
To study the hydrothermal circulation in the granite and between wells, faults were selected based on the following criteria:
- Permeable faults: they must present flow or thermal anomalies, or have been detected by a microseismicity cloud.
- Extension: they must intersect several wells to respect the connections between them.
- Contribution of the flow: recent flow logs and precedent studies [17] allowed the estimation of the flow produced and injected in the different sections of the wells. In order to respect these contributions in the hydraulic calibration, it was necessary to keep faults crossing the well in specific sections (Table 1, Figure 3).
Table 1. Estimated flow contributions of the faults, derived from flow log data.
Figure 3. Simplified 3D structural model of Soultz-sous-Forêts. The arrow on the bottom right of the figure indicates north.
Finally, five faults were chosen (Figure 3):
- GPK-3-FZ4770 intersects GPK-3 at 4770 mMDGL (Measured Depth from Ground Level). It is the largest observed in the UBI. It controlled 70% of fluid losses during the hydraulic test and it matches with the microseismic structure MS-GPK-3-2003a. It also intersects the leakage of GPK-2 at 3900 mMDGL.
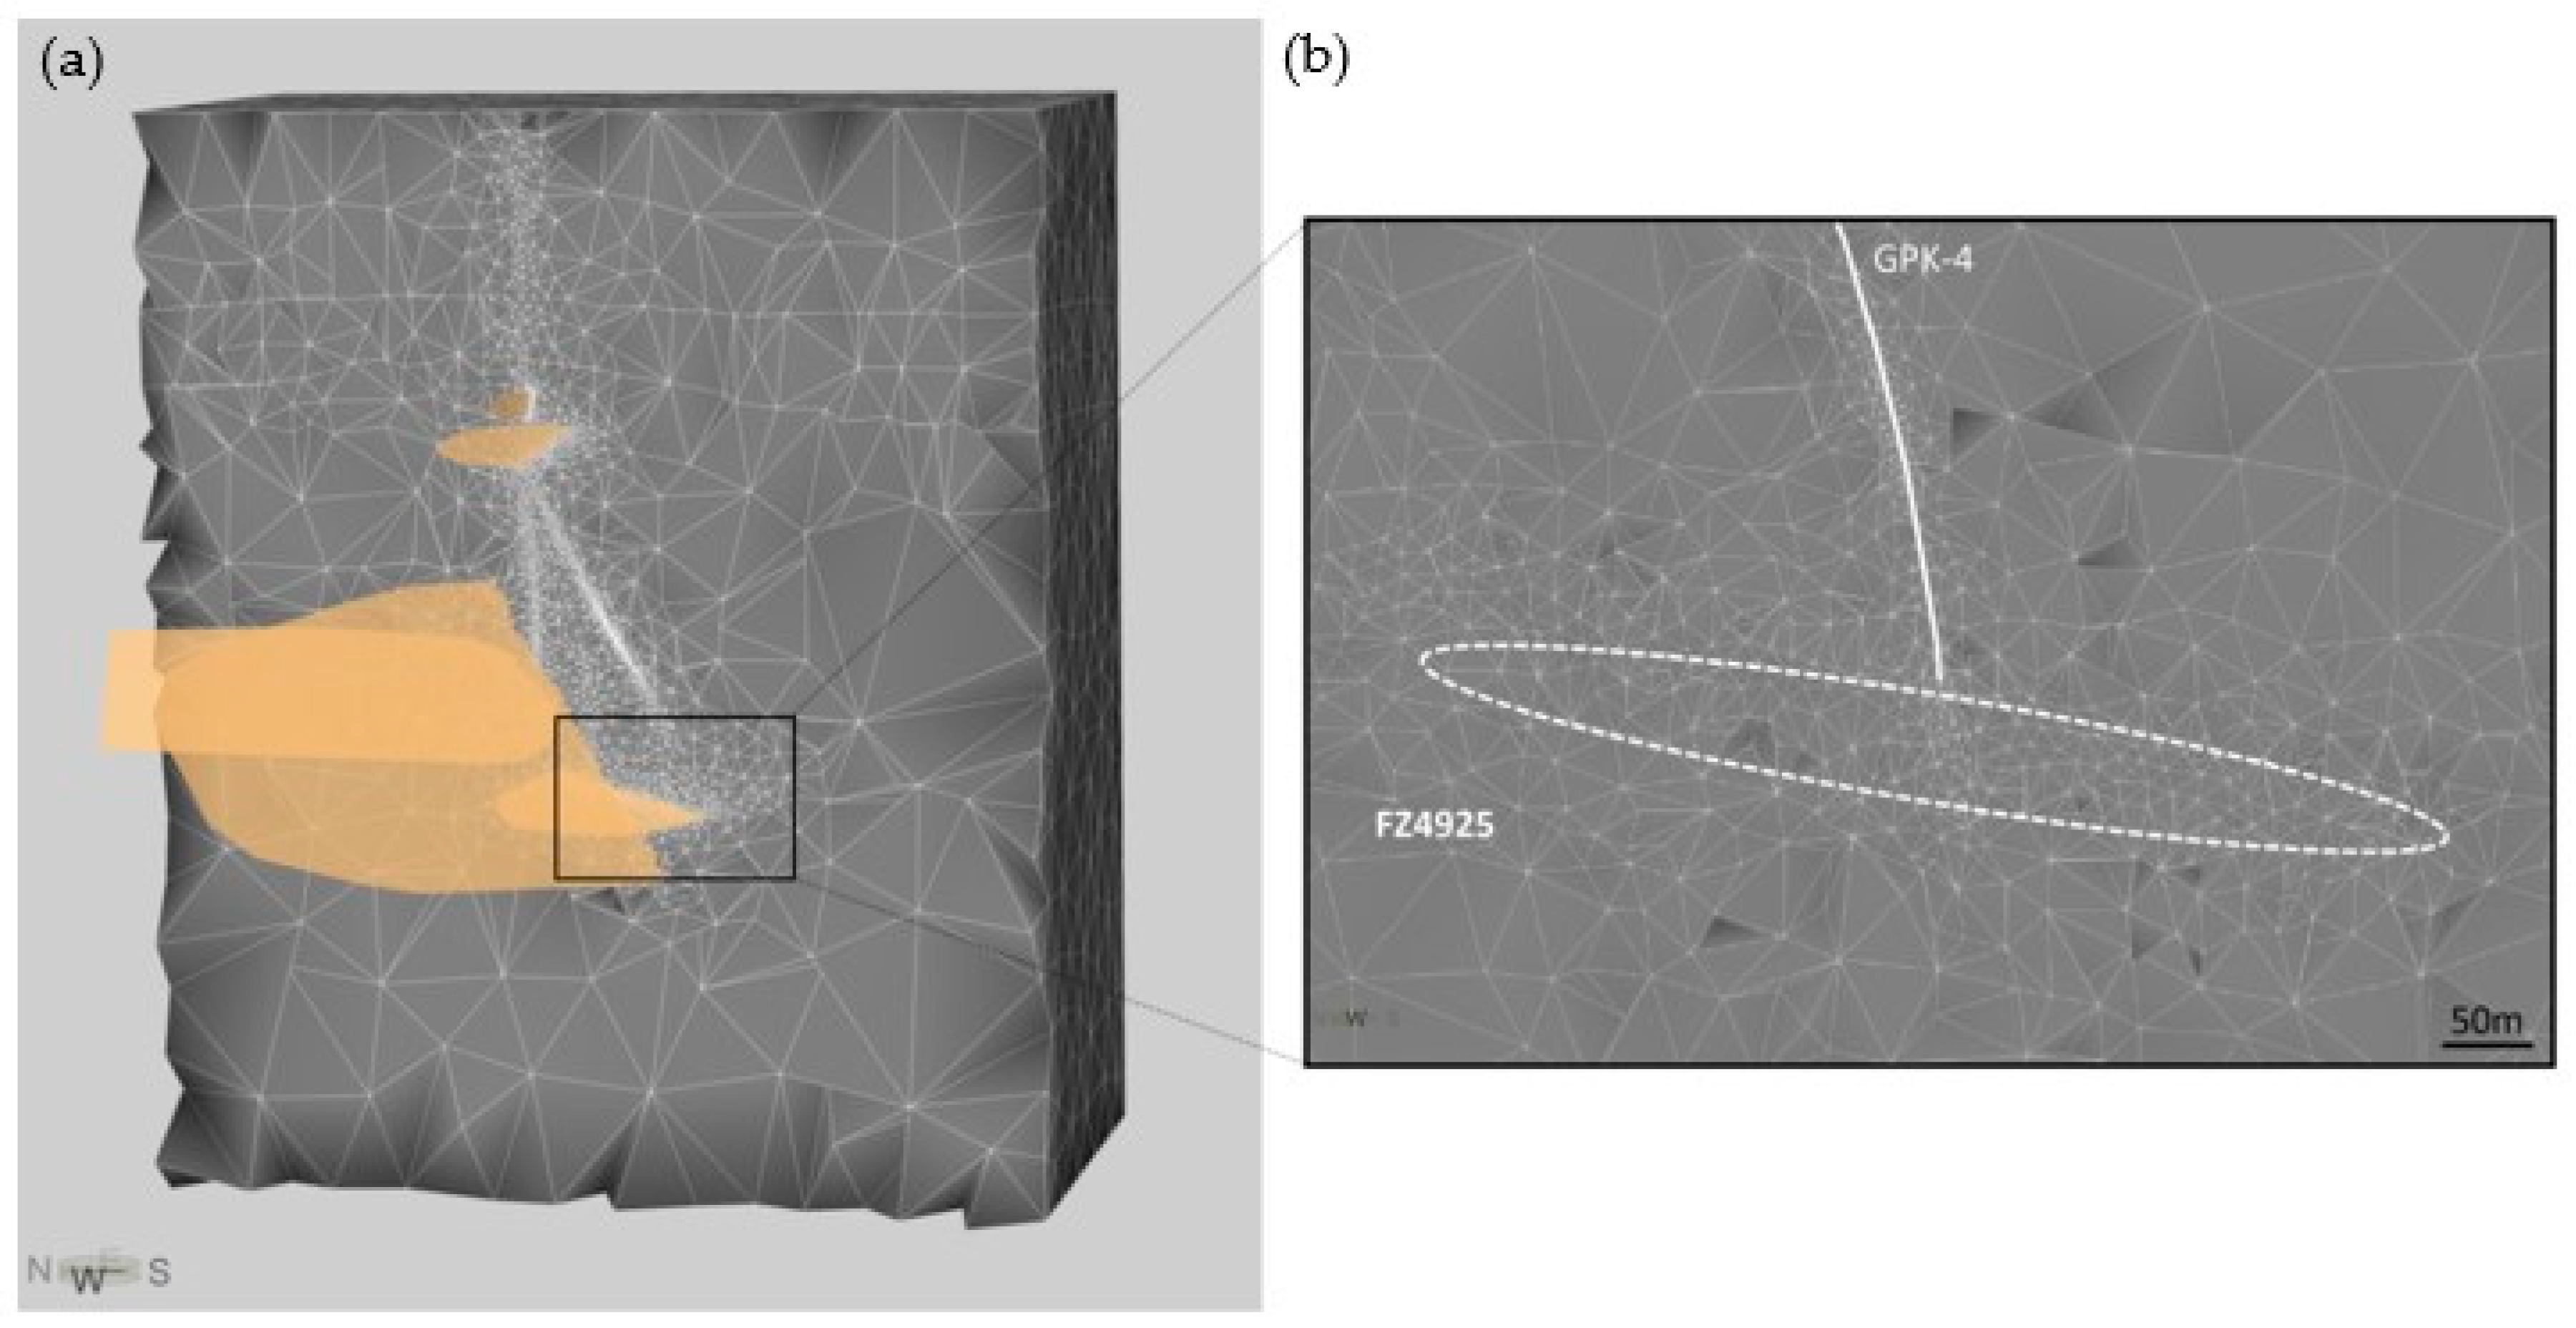
- Then, the microseismicity structure MS-GPK3-2003c fits with the FZ4925 fracture that intersects GPK-4 at 4924 mMDGL. It also intersects the fracture GPK-3-FZ4770, creating a needed connection with the other wells, so it is important to take it into account in the hydrothermal circulation.
- At a shallower level, GPK2-FZ2120 was selected because of its extent. Indeed, it intersects GPK-2 at 2123 mMDGL but also GPK-3 and GPK-4 at similar depths, connecting the three annuluses together. Moreover, it induces total mud losses and took 95% of the flow during drilling.
- Tracer tests demonstrated that around 60% of the flow comes from the far field through the open hole of GPK-2 but, recently, this contribution has decreased and is now estimated at around 35%. To represent this entry, the fault GPK2-FZ4760 was selected. Even if there were no geophysical measurements in the deepest part of GPK-2, an orientation of N170° and a dip of 65°W at 4760 m were inferred based on gamma ray, caliper logs and cutting observations [16]. This fault was extended to one of the boundaries of the model to simulate the far-field influx.
- GPK4-FZ1800 was the last fault selected because of its intersection with GPK-4 at 1801 mMDGL and GPK-3, the thickness of the damage zone (observed on UBI) and mud losses during drilling. A sensibility study revealed that this fault has not much impact on the model and it was chosen before the hypothesis of keeping only the open hole of GPK-4. Thus, it was kept in the structural model but not in the hydrothermal simulations.
3.2. Mesh
The horizons and faults were extracted from Petrel as surfaces and imported in MeshIt, intermediate software that allows the building of units. Once the model was structured, it was imported into FEFLOW. The entire model was refined by the Tetgen algorithm, especially near the surfaces of faults where the distance between two points was 20 m and the well trajectory where the refinement varied between 5 and 1 m near the intersection between faults and wells (Table 2). This created an unstructured 3D tetrahedral mesh (Figure 4). Faults were assigned to their corresponding surface as 2D discrete feature elements.
Table 2.
Meshing parameters.
Figure 4.
(a) Meshing of the 3D structural model and (b) magnification of the refinement meshing near GPK-4 and the fault FZ4925 (b).
3.3. Boundary Conditions and Initial State
The boundary conditions are defined as follows:
- Constant head of 10 m (=hydrostatic pressure gradient) boundary conditions on the lateral sides and on top of the model.
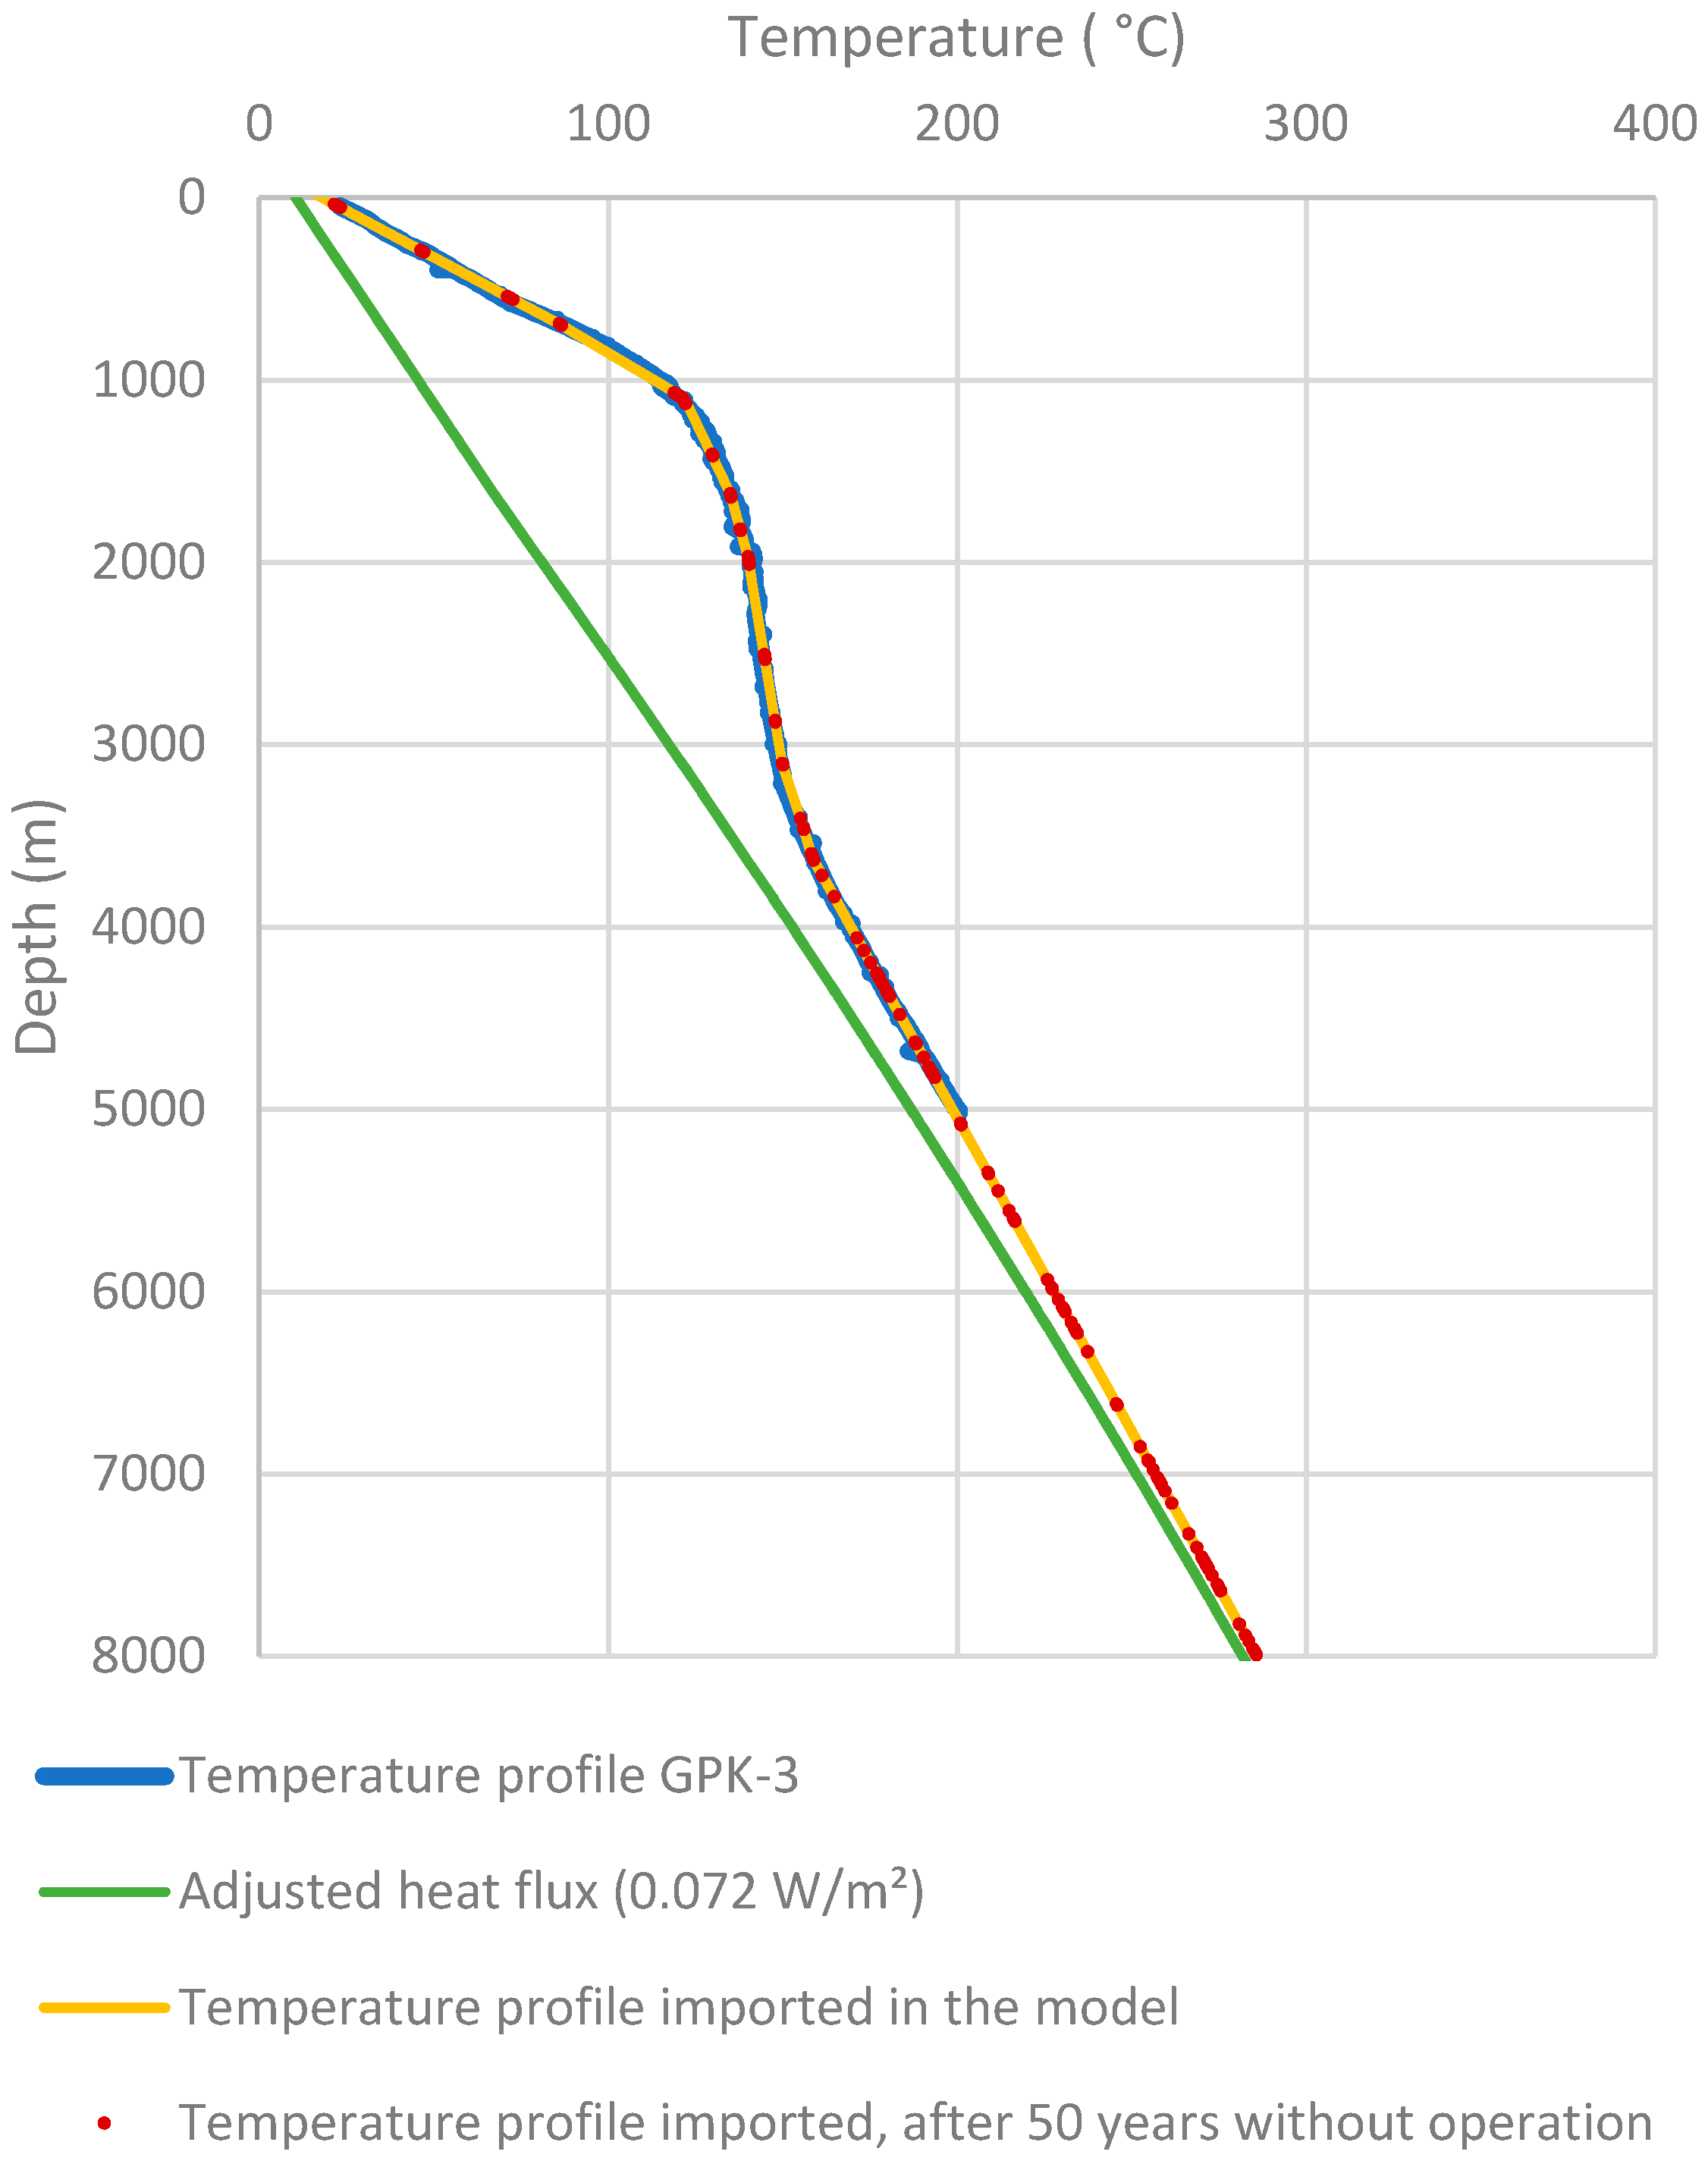
- A heat flux of 0.072 W/m2 coming from the bottom of the model. This value was adjusted in order to reproduce the observed temperature gradient in the deepest part of the reservoir (see green line in Figure 5), where a conductive-only heat transport regime is assumed.
Figure 5. Comparison between GPK-3 temperature profile measured at equilibrium (in blue) and initial condition of the model (in yellow). The red points show the temperature extracted from the model after 50 years without pumping. The green line shows the result of a 0.072 W/m2 conductive-only thermal regime. - The temperature is 10 °C at the surface (0 m).
The initial state is defined by:
- A hydrostatic pressure gradient in the model.
- A non-linear temperature distribution, varying with depth (Figure 5). As the model does not simulate convection and does not aim at reproducing long-term fluid flow, which would explain the observed temperature profile in Soultz (suggesting upwelling of hot fluid), the measured temperature profile at the wells was imported as a temperature distribution for the initial state. A simple transient hydrothermal simulation assuming no well use showed that this temperature profile remained almost unchanged over 50 years (see red points in Figure 5). Thus, within the timeframe of the simulation, the temperature distribution is representative of the real temperature profile of GPK-3 during the 30 years of simulations discussed in this study.
3.4. Calibration Results
The calibration must respect:
- The estimated contribution of the faults in each section of the wells (Table 1);
- The measured wellhead pressure during the past 3 years of operation—around 0 bar for GPK-2, 1 bar for GPK-3 and 18 bar for GPK-4 according to the flow rate attributed earlier;
- The production temperature observed in GPK-2, which is very dependent on the preferential fluid flow paths governed by the relative hydraulic properties of the different fault zones.
The calculations were run in a steady-state hydraulic regime and transient thermal regime. Fluid parameters were derived from the analysis realized at the nearby Rittershoffen geothermal site (thermal conductivity of 0.681 W/m/K and thermal capacity of 3.86 MJ/m3/K). The calibration was done manually by varying the hydraulic parameters of faults and matrix as the hydraulic conductivity and the thickness of faults. Initial geological layers and faults’ hydraulic parameters were derived from the literature [13,14,18,19]. Fault thickness was derived from geological data (cutting analysis), also reported in these publications.
A sensitivity analysis was manually performed in order to calibrate the model. It highlighted the high impact of the fault hydraulic properties (hydraulic conductivity and thickness). The calibration was carried out in two steps. At first, the flow contributions of the faults and well pressures were fitted at best (see Table 3) using realistic parameters, in order to calibrate the fault transmissivity. Then, the hydraulic conductivity and thickness of each fault were adjusted, keeping the transmissivity of each fault constant. As a result, GPK-2′s production temperature could also be acceptably fitted (see Figure 6). It is important to mention that the output GPK-2 production temperature from FEFLOW is a mean temperature from the different contributions. Therefore, it was necessary to correct the FEFLOW output to take into account temperature losses in the well when the fluid circulates upwards over a few kilometers in the well in order to be able to compare the model results with observed temperature data (wellhead measurements). The temperature losses were calculated using a polynomial function of the flowrate and reservoir temperature, calculated using wellbore simulator HEX-B for the GPK-2 well [20]. The same work was realized on the input injection temperature for GPK-3 and GPK-4 (i.e., the input temperature given to FEFLOW is higher than operation values as it takes into account the heating of the fluid when going down in the well). It must be pointed out that numerical instabilities (oscillations) were observed in the calculated temperature after the shutdown/restart of the plant, inducing rapid fluid velocity changes in the model.
Table 3.
Fault contributions obtained at the end of the calibration (in bold). Estimated real contributions from Table 1 are recalled in italic.
Figure 6.
Comparison between simulated and operation data. The corrected value (orange line) takes into account temperature losses in the well in order to be comparable to wellhead values.
At the end of the calibration, the faults had transmissivities between 6.30 × 10⁻⁵ and 3 × 10⁻⁴ m2/s, except the FZ4760 one, which showed significantly higher transmissivity. Indeed, this fault is known as a main contributor to GPK-2 from logging data. However, many structures contribute to the production of the GPK-2 open-hole with an important connection to the far-field [17]. In order to reproduce the high contribution of this zone to the system, the best solution was to artificially extend this fault to the boundary of the model. As a result, this fault represents the entire contribution of the far field to the production well. The final geological layers and fault parameters are shown in Table 4 and Table 5.
Table 4.
Geological layer parameters after calibration.
Table 5.
Fault parameters after calibration.
3.5. Long-Term Simulation Results
In order to calculate the reinjection temperature effect over a long period, the simulation was run over 30 years, including the first 3 years of calibration. Four runs were carried out, simulating reinjection temperatures of, respectively, 70, 60, 50 and 40 °C (see Figure 7).
Figure 7.
Variation in calculated production temperature in GPK-2 with injection temperatures, calculated over 30 years. The figure shows corrected values (comparable to wellhead values).
The results show that a decrease of 10 °C in the injection temperature in GPK-3 and GPK-4 is expected to produce a drop of approximately 2.8 °C in the production temperature at GPK-2 over 30 years. It is interesting to note that this drop does not increase significantly with time, as the drop is already significant (2 °C) after 2 years of operation (i.e., after 5 years of simulation).
3.6. Short-Term Simulation Results
Additional simulations were run using this numerical model, assuming a lower reinjection temperature in the reservoir for 4 months only, and then returning to the actual (70 °C) reinjection temperature (Figure 8). This showed that the effect of a lower injection temperature over a few months would have a short-term impact on the production temperature, which would drop from one to two degrees one year after the injection temperature changes. This effect disappears approximately 2 years after returning to the initial injection temperature of 70 °C.
Figure 8.
Variation in calculated production temperature in GPK-2 using colder reinjections over 4 months only, shown over 10 years. The figure shows corrected values (comparable to wellhead values).
4. Discussion
4.1. Outcomes of the Simulations
The works presented here are part of a wider simulation effort aiming at understanding the Soultz-sous-Forêts geothermal site’s behavior. Thus, the results presented here are a work in progress, but the calculations to come aim at understanding how the far-field contribution integrates in the Soultz system (by which fault connections). Therefore, the remaining work will not change or update the results/conclusions of the works presented here. The simulation results show that:
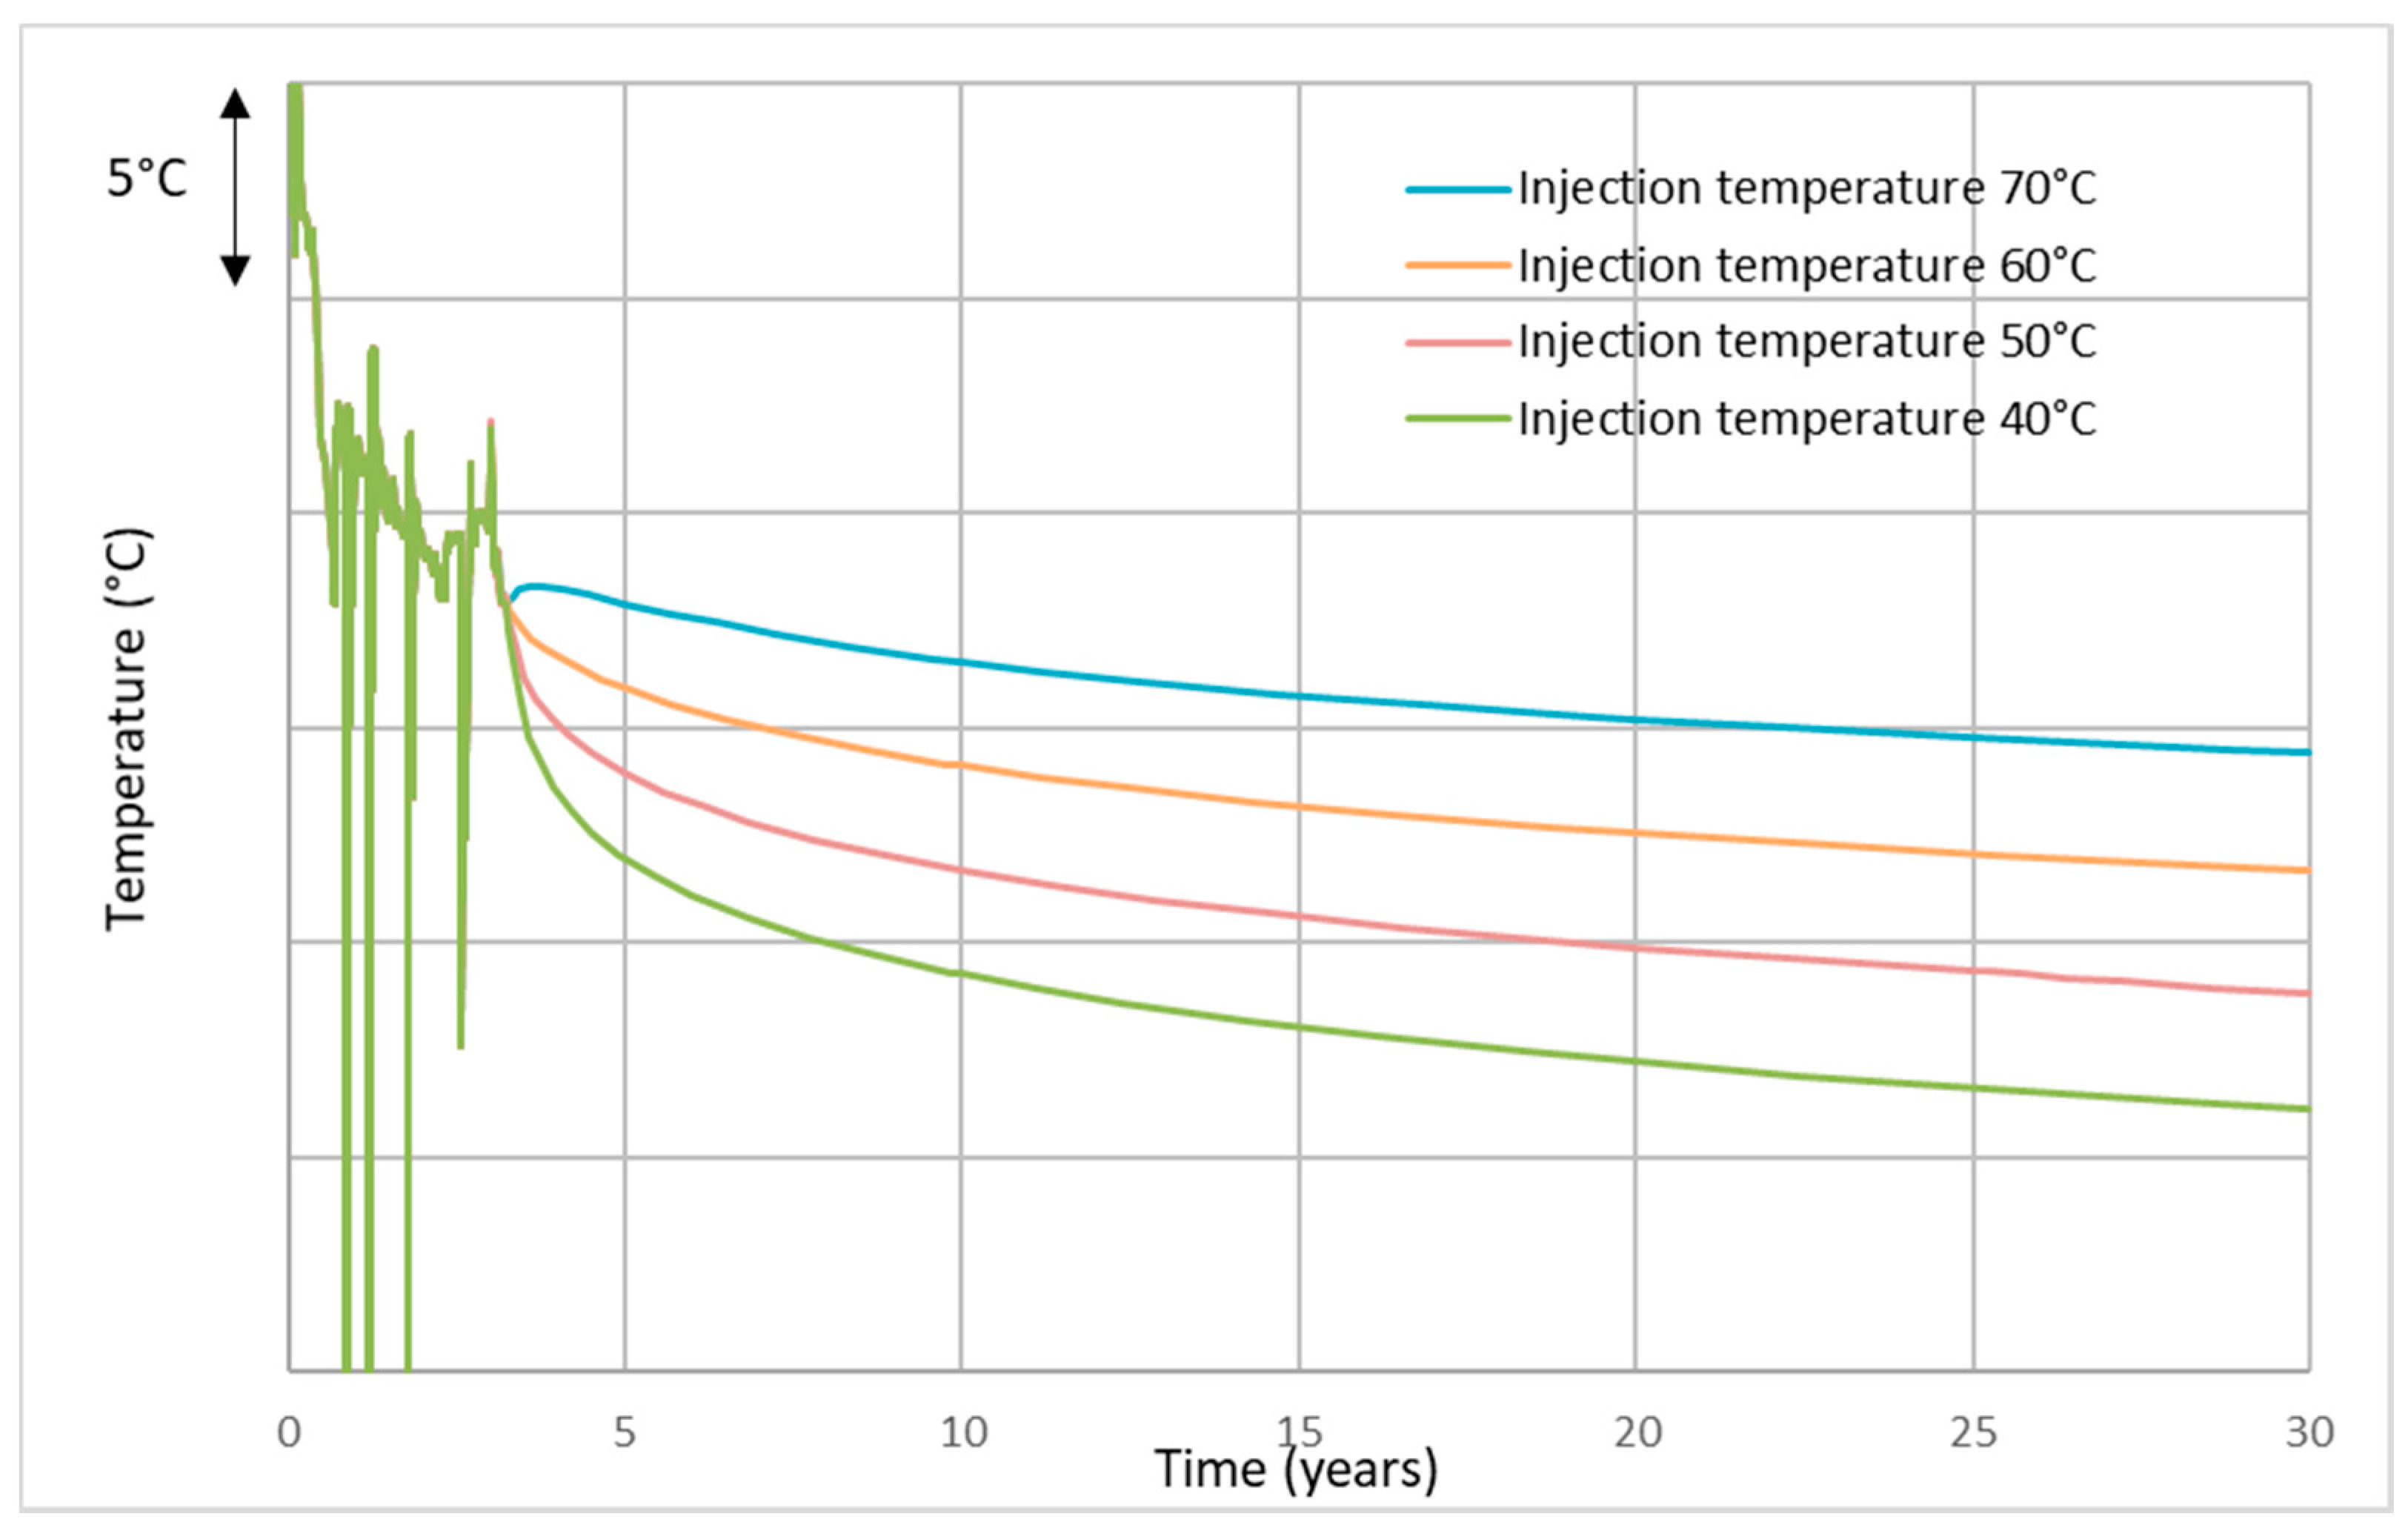
- A temporary decrease (over a few months) in the injection temperature does not affect the production temperature over a long time, as the production temperature returns to the initial production temperature after a maximum of 2 years.
- A permanent decrease in the injection temperature will have a limited effect on the production temperature. According to the models, a 10 °C injection temperature decrease in GPK-3 and GPK-4 is expected to produce a drop of up to 3 °C in the production temperature at GPK-2 over 30 years.
- Moreover, colder reinjection does not significantly affect the temperature distribution in the reservoir. The cold front does not propagate faster, and the “cooled-down” volume reaches a lower temperature at its core but the temperature impact at the fringe remains limited, as the cold fluid will finally drain more energy from the surrounding rock. This is the reason that the temperature impact at the production well remains limited.
To summarize, a significant decrease in the injection temperature (from 70 °C down to 40 °C) in order to produce more energy appears to have a clear but limited impact on the reservoir and on the production temperature. This impact is mainly due to fast connections, likely to occur in the upper part of the reservoir, due to production casing integrity issues. Thus, from a reservoir point of view, this work confirms that using colder injections to increase the total produced energy is perfectly feasible.
4.2. Simulation Results vs. Observations
In the framework of the MEET project, a low-temperature ORC unit was tested in Soultz-sous-Forêts. It was installed after the existing high-temperature ORC unit, thus taking fluid at 70 °C as an input (output temperature of the existing ORC unit). This small additional ORC unit has been running for 3 months, from mid-March to mid-June 2021 [6]. The objective of this test was (1) to quantify the efficiency of such a low-temperature ORC unit and (2) to reinject fluid at a lower temperature in Soultz during a few months and observe the effect on the reservoir. This would have allowed comparison of the model results with observation data. Unfortunately, the thermal power of the ORC unit was too low to create a significant change in the reinjection temperature.
A recent observation of the production temperature suggests that the injection temperature has a slightly stronger effect than that inferred by the model (which shows that a decrease of 10 °C in the injection temperature is expected to produce a drop of approximately 2–3 °C in the production temperature after a few years). Indeed, it is suspected that the permeability of the main fault zones (which are the largest flow contributors to the wells) has been increasing since the system begun operation. This leads to a faster connection between wells. This seems to be confirmed by the pressure decrease observed at the injection wells.
The process behind the possible permeability increase in the most permeable faults is unclear. Indeed, mineral crystallization during brine circulation could lead to a permeability decrease in the circulation zones, as mineralization could progressively close the fractures [21]. Nevertheless, this effect might be compensated by other processes, either purely thermal (fracture aperture increasing as the surrounding rock is being cooled down) or mechanical (fracture aperture increasing due to failure processes). The cooling of the reservoir and subsequent stress change around the injection well could also positively impact the fracture’s mechanical behavior, allowing fracture opening by jacking at lower pressures. Interestingly, this possible permeability increase in the most permeable faults leads to the conclusion that the most permeable fault network located in the first kilometer of the Soultz granitic basement is a promising geothermal target. The successful geothermal Rittershoffen project targeting such local faults located in the first kilometer of the top basement confirmed this observation [22].
4.3. Structural Model Update
The calibration effort led the model to reproduce realistic values of the wellhead pressures, to fit accurately the contribution of the faults at the wells and leading to a good fit of the production temperature over the 3 year calibration period. This certainly shows that the structural model is representative of the reservoir.
Nevertheless, the calibration also showed the limitations of the structural model behind the simulations. Indeed, it appeared necessary to extend one of the faults (FZ4760) to the boundary of the model and to attribute to this structure higher transmissivity values than inferred during the hydraulic tests of the well, in order to obtain the far-field contribution from the reservoir to the system. It is possible that the hydraulic properties of this fault increase with time since testing, as mentioned previously, but this possibly shows that some of the faults included in the model could be connected to great extension structures such as the Soultz horst border faults, which have at least 500 m of vertical offset that connects the system to the regional geothermal reservoir.
In 2018, Electricité de Strasbourg conducted a 3D seismic acquisition survey [23]. This seismic acquisition covered the Soultz-sous-Forêts wells and reservoir. Processing was on-going when the structural model presented here was built and the interpretation was finalized recently; thus, detailed structural results of the 3D seismic acquisition were not available for this work.
Thus, it was decided to update the local Soultz structural model by considering the 3D seismic interpretation results. In light of the seismic results, some faults in the granite included in the model, derived from imaging well data, are connected to regional-scale structures derived from the 3D seismic survey (see Figure 9), especially in the upper part of the reservoir (1500–2500 m—for example, FZ2120). This could possibly validate the contribution of the far field to the Soultz hydraulic system through the upper part of the reservoir. However, this update could also prove to be insufficient to reproduce the far-field contribution in the deep reservoir and show that connections to the far field exist in the deep reservoir but could not be seen in the 3D seismic data.
Figure 9.
(a) the image shows the new regional faults on the upper part of the reservoir (yellow, orange, blue, green and violet structures) and faults in the deep reservoir used in the model presented in this paper. (b) the image shows the same new regional faults, the new horizons top Muschelkalk (brown), top Buntsandstein (pink) and top Granite (red) and the new structural fault model in the granite.
4.4. Future Work
New numerical simulations will be carried out for the testing of various fault contribution calibrated with operation data. In order to allow more flexibility during the gridding/meshing process (from the structural model to the calculator), it was decided to run these numerical simulations with ECLIPSE, which uses a regular grid, as it is a finite difference code, in contrast to FEFLOW, which needs a mesh as it is based on finite elements. The gridding process used by ECLIPSE should allow more flexibility at the interface between the structural model and the numerical simulation results. These new simulations should help to validate the hypothesis of a far-field reservoir connection through regional faults in the upper part of the reservoir.
Author Contributions
Materials and methods, C.B.; structural model, P.R., É.D. and A.G.; meshing, P.R. and R.H.; calibration, P.R. and R.H.; long-term simulation, P.R. and R.H.; discussion, C.B. Authorship is limited to those who have contributed substantially to the work reported. All authors have read and agreed to the published version of the manuscript.
Funding
This project has received funding from the European Union’s Horizon 2020 research and innovation program under grant agreement no. 792037 (MEET project).
Data Availability Statement
Relies on mostly confidential data owned by us.
Acknowledgments
The authors would like to warmly thank the Soultz-sous-Forêts site owner, EEIG Exploitation Minière de la Chaleur, for data access and GFZ Potsdam, especially Mauro Cacace and Guido Blöcher, for their support and the use of MeshIt.
Conflicts of Interest
The authors declare no conflict of interest.
References
- Vidal, J.; Genter, A.; Schmittbuhl, J. How do permeable fractures in the Triassic sediments of Northern Alsace characterize the top of hydrothermal convective cells? Evidence from Soultz geothermal boreholes (France). Geotherm. Energy 2015, 3, 8. [Google Scholar] [CrossRef] [Green Version]
- Gérard, A.; Genter, A.; Kohl, T.; Lutz, P.; Rose, P.; Rummel, F. The deep EGS (Enhanced Geothermal System) project at Soultz-sous-Forêts (Alsace, France). Geothermics 2006, 35, 502–516. [Google Scholar] [CrossRef]
- Schill, E.; Genter, A.; Cuenot, N.; Kohl, T. Hydraulic performance history at the Soultz EGS reservoirs from stimulation and long-term circulation tests. Geothermics 2017, 70, 110–124. [Google Scholar] [CrossRef]
- Ravier, G.; Seibel, O.; Pratiwi, A.S.; Mouchot, J.; Genter, A.; Ragnarsdóttir, K.; Sengelen, X. Towards an optimized operation of the EGS Soultz-sous-Forets power plant (Upper Rhine Graben, France). In Proceedings of the European Geothermal Congress, The Hague, The Netherlands, 11–14 June 2019. [Google Scholar]
- Mouchot, J.; Ravier, G.; Seibel, O.; Bosia, C.; Pratiwi, A. Deep geothermal plants operation in Upper Rhine Graben: Lessons learned, first year of operation from EGS geothermal plants in Alsace. In Proceedings of the European Geothermal Congress, The Hague, The Netherlands, 11–14 June 2019. [Google Scholar]
- Dalmais, E.; Genter, A.; Trullenque, G.; Leoutre, E.; Leiss, B.; Bär, K.; Mintsa, A.-C.; Ólafsson, D.I.; Rajsl, I.; Wagner, B. MEET Project: Toward large scale deployment of deep geothermal energy in Europe. In Proceedings of the World Geothermal Congress 2020, Reykjavik, Iceland, 26 April–2 May 2020. [Google Scholar]
- Seibel, O.; Mouchot, J.; Ravier, G.; Ledesert, B.; Sengelen, X.; Hebert, R.; Ragnarsdottir, K.; Olafsson, D.I.; Haraldsdottir, H.O. Optimised valorisation of the geothermal resources for EGS plants in the Upper Rhine Graben. In Proceedings of the World Geothermal Congress 2020, Reykjavik, Iceland, 26 April–2 May 2020. [Google Scholar]
- Ledésert, B.; Hébert, R.; Mouchot, J.; Bosia, C.; Ravier, G.; Seibel, O.; Dalmais, É.; Ledésert, M.; Trullenque, G.; Sengelen, X.; et al. Scaling in a geothermal heat exchanger at soultz-sous-forêts (Upper Rhine Graben, France): A XRD and SEM-EDS characterization of sulfide precipitates. Geosciences 2021, 11, 271. [Google Scholar] [CrossRef]
- Briais, J.; Lasseur, E.; Homberg, C.; Beccaletto, L.; Couëffé, R.; Bellahsen, N.; Chateauneuf, J.J. Sedimentary record and structural analysis of the opening of the European Cenozoic Rift System: The case of the Upper Rhine Graben. In Proceedings of the EGU General Assembly Conference Abstracts, Vienna, Austria, 23–28 April 2017; p. 17227. [Google Scholar]
- Renard, P.; Courrioux, G. Three-dimensional geometric modeling of a faulted domain: The Soultz Horst example (Alsace, France). Comput. Geosci. 1994, 20, 1379–1390. [Google Scholar] [CrossRef] [Green Version]
- Menjoz, A.; Cautru, J.P.; Criaud, A.; Genter, A. Stimulation des réservoirs géothermiques en milieu cristallin–Caractérisation des réservoirs fractures. Rapp. Annu. D’activités 1988, 35–42. [Google Scholar]
- Place, J. Caractérisation des Chemins de Circulations de Fluides Dans le Réseau Poreux d’un Batholite Granitique, Application au Site Géothermique de soultz-sous-Forêts. Ph.D. Thesis, Université de Strasbourg, Strasbourg, France, 2010. [Google Scholar]
- Dezayes, C.; Genter, A.; Valley, B. Structure of the low permeable naturally fractured geothermal reservoir at Soultz. C. R. Geosci. 2010, 342, 517–530. [Google Scholar] [CrossRef] [Green Version]
- Held, S.; Genter, A.; Kohl, T.; Kölbel, T.; Sausse, J.; Schoenball, M. Economic evaluation of geothermal reservoir performance through modeling the complexity of the operating EGS in Soultz-sous-Forêts. Geothermics 2014, 51, 270–280. [Google Scholar] [CrossRef]
- Cacace, M.; Blöcher, G. MeshIt—a software for three dimensional volumetric meshing of complex faulted reservoirs. Environ. Earth Sci. 2015, 74, 5191–5209. [Google Scholar] [CrossRef]
- Sausse, J.; Dezayes, C.; Dorbath, L.; Genter, A.; Place, J. 3D model of fracture zones at Soultz-sous-Forêts based on geological data, image logs, induced microseismicity and vertical seismic profiles. C. R. Geosci. 2010, 342, 531–545. [Google Scholar] [CrossRef]
- Sanjuan, B.; Pinault, J.-L.; Rose, P.; Gérard, A.; Brach, M.; Braibant, G.; Crouzet, C.; Foucher, J.-C.; Gautier, A.; Touzelet, S. Tracer testing of the geothermal heat exchanger at Soultz-sous-Forêts (France) between 2000 and 2005. Geothermics 2006, 35, 622–653. [Google Scholar] [CrossRef]
- Gentier, S.; Rachez, X.; Ngoc, T.D.T.; Peter-Borie, M.; Souque, C. 3D Flow modelling of the medium-term circulation test performed in the deep geothermal site of Soultz-sous-Forêts (France). In Proceedings of the World Geothermal Congress 2010, Bali, Indonesia, 25 April 2010. [Google Scholar]
- Dezayes, C.H.; Chevremont, P.; Tourlière, B.; Homeier, G.; Genter, A. Geological Study of the GPK4 HFR Borehole and Correlation with the GPK3 Borehole (Soultz-sous-Forêts, France). Open File Report BRGM/RP-53697-FR. 2005. 85p. Available online: http://infoterre.brgm.fr/rapports/RP-53697-FR.pdf (accessed on 3 December 2021).
- Megel, T.; Kohl, T.; Gérard, A.; Rybach, L.; Hopkirk, R. Downhole pressures derived from wellhead measurements during hydraulic experiments. In Proceedings of the World Geothermal Congress 2005, Antalya, Turkey, 24–29 April 2005. [Google Scholar]
- Audigane, P.; Royer, J.; Kaieda, H. Permeability characterization of the Soultz and Ogachi large-scale reservoir using induced microseismicity. Geophysics 2002, 67, 204–211. [Google Scholar] [CrossRef]
- Baujard, C.; Genter, A.; Dalmais, E.; Maurer, V.; Hehn, R.; Rosillette, R.; Vidal, J.; Schmittbuhl, J. Hydrothermal characterization of wells GRT-1 and GRT-2 in Rittershoffen, France: Implications on the understanding of natural flow systems in the rhine graben. Geothermics 2017, 65, 255–268. [Google Scholar] [CrossRef] [Green Version]
- Richard, A.; Maurer, V.; Toubiana, H.; Carriere, X.; Genter, A. How to upscale geothermal energy from deep fractured basement in the Upper Rhine Graben? The impact of a new 3D seismic dataset. In Proceedings of the World Geothermal Congress 2020+1, Reykjavik, Iceland, 30 March–27 October 2021. [Google Scholar]
Publisher’s Note: MDPI stays neutral with regard to jurisdictional claims in published maps and institutional affiliations. |
© 2021 by the authors. Licensee MDPI, Basel, Switzerland. This article is an open access article distributed under the terms and conditions of the Creative Commons Attribution (CC BY) license (https://creativecommons.org/licenses/by/4.0/).