Article

Basement Mapping of the Fucino Basin in Central Italy by ITRESC Modeling of Gravity Data

1
Dipartimento di Biologia, Ecologia e Scienze della Terra, Università della Calabria, 87036 Cosenza, Italy
2
Istituto Nazionale di Geofisica e Vulcanologia, Sezione di Napoli, Osservatorio Vesuviano, 80124 Napoli, Italy
3
Dipartimento di Scienze della Terra, dell’Ambiente e delle Risorse, Università di Napoli ‘Federico II’, 80126 Napoli, Italy
4
CRUST—“Centro InterRUniversitario per l’Analisi SismoTettonica Tridimensionale con Applicazioni Territoriali”, 66100 Chieti, Italy
*
Author to whom correspondence should be addressed.
Geosciences 2021, 11(10), 398; https://doi.org/10.3390/geosciences11100398
Submission received: 23 July 2021 / Revised: 10 September 2021 / Accepted: 14 September 2021 / Published: 22 September 2021
(This article belongs to the Section Geophysics)

Abstract

:
Sediments infilling in intermontane basins in areas with high seismic activity can strongly affect ground-shaking phenomena at the surface. Estimates of thickness and density distribution within these basin infills are crucial for ground motion amplification analysis, especially where demographic growth in human settlements has implied increasing seismic risk. We employed a 3D gravity modeling technique (ITerative RESCaling—ITRESC) to investigate the Fucino Basin (Apennines, central Italy), a half-graben basin in which intense seismic activity has recently occurred. For the first time in this region, a 3D model of the Meso-Cenozoic carbonate basement morphology was retrieved through the inversion of gravity data. Taking advantage of the ITRESC technique, (1) we were able to (1) perform an integration of geophysical and geological data constraints and (2) determine a density contrast function through a data-driven process. Thus, we avoided assuming a priori information. Finally, we provided a model that honored the gravity anomalies field by integrating many different kinds of depth constraints. Our results confirmed evidence from previous studies concerning the overall shape of the basin; however, we also highlighted several local discrepancies, such as: (a) the position of several fault lines, (b) the position of the main depocenter, and (c) the isopach map. We also pointed out the existence of a new, unknown fault, and of new features concerning known faults. All of these elements provided useful contributions to the study of the tectono-sedimentary evolution of the basin, as well as key information for assessing the local site-response effects, in terms of seismic hazards.

1. Introduction

The Apennine chain resulted primarily from the structural effects of Cenozoic compressive tectonics, involving the mesozoic marine carbonate series until the middle/late Miocene, followed by Plio-Quaternary extensional tectonics. The latter triggered a massive normal faulting, superimposed on the relicts (thrusts, folds, and reverse faults) of the previous phase, forming intermontane basins. Among these, the Fucino is an intermontane plain. It represents the surface expression of a sedimentary basin that was created through extensional tectonic activity, which has affected the Central Apennine area since the late Messinian times (e.g., [1]). This tectonic activity is still ongoing. The Fucino is a typical basin, bounded by normal fault systems and NW–SE oriented (Figure 1). It lies within the Apennine segmented normal fault system, which extends from Tuscany to the Calabrian Arc. According to [2], the Fucino basin is a half-graben and is filled with Plio-Quaternary alluvial and lacustrine deposits (more than 1000 m thick in the central part of the basin). The interpretation of regional seismic reflection profiles [3,4] showed the subsurface geometry of the basin. Several authors analyzed geological surface data, borehole stratigraphy, and seismic data [2,5,6], correlating sedimentary and seismic facies and providing estimates for the depth to the base of the Plio-Pleistocene sediments. Several uncertainties still exist, however, concerning the location of faults and their extent, the variation of seismic velocities with depth, the geological interpretation of reflective surfaces, and the overall reliability of the 2D/3D models [6,7,8,9,10].
The basin is one of the most seismically active zones of the central Apennines. It was the epicentral area of the 1915 Mw 7.0 earthquake [11]. A primary reason for the amplification of the magnitude and the lengthening of the ground motion of seismic waves in the sedimentary basin is their trapping within low-velocity sediments (basin-site effects). In the Fucino Plain, these sediments include Plio-Quaternary alluvial and lacustrine sediments as well as Cenozoic clay and sandy flysch formations. Consequently, knowledge of the depth of the marine carbonate basement underlying this sediment pile could be essential to accurate modelling of the seismic wave propagation. It could also be crucial for the determination of seismic action on ground soils.
Therefore, it is very important to improve our knowledge of the structural setting of the Fucino area by (a) modelling the morphology of the rigid basement underlying the softer sedimentary pile, (b) estimating the density variation of the sediments with burial depth, and (c) recovering the trend of the main faults driving the overall structural evolution.
In this paper, we advanced knowledge in these areas by modeling gravity anomalies. In contrast to other geophysical approaches, gravity data have two useful characteristics, namely (1) their sensitivity to density contrast between basement and sediments filling the basin and (2) their areal sampling, naturally leading to a full 3D modeling of the basement morphology.
We modeled the gravity anomalies of the Fucino basin using a recently proposed method, based on a simple relation between the depth to the basement (as given by wells perforating the basement or other geophysical data interpretations) and the gravity field [12,13]. An interesting feature of the utilized method was that the depth-density function was not assumed a priori. Instead, it was estimated using a data-driven procedure.

2. Geological Setting

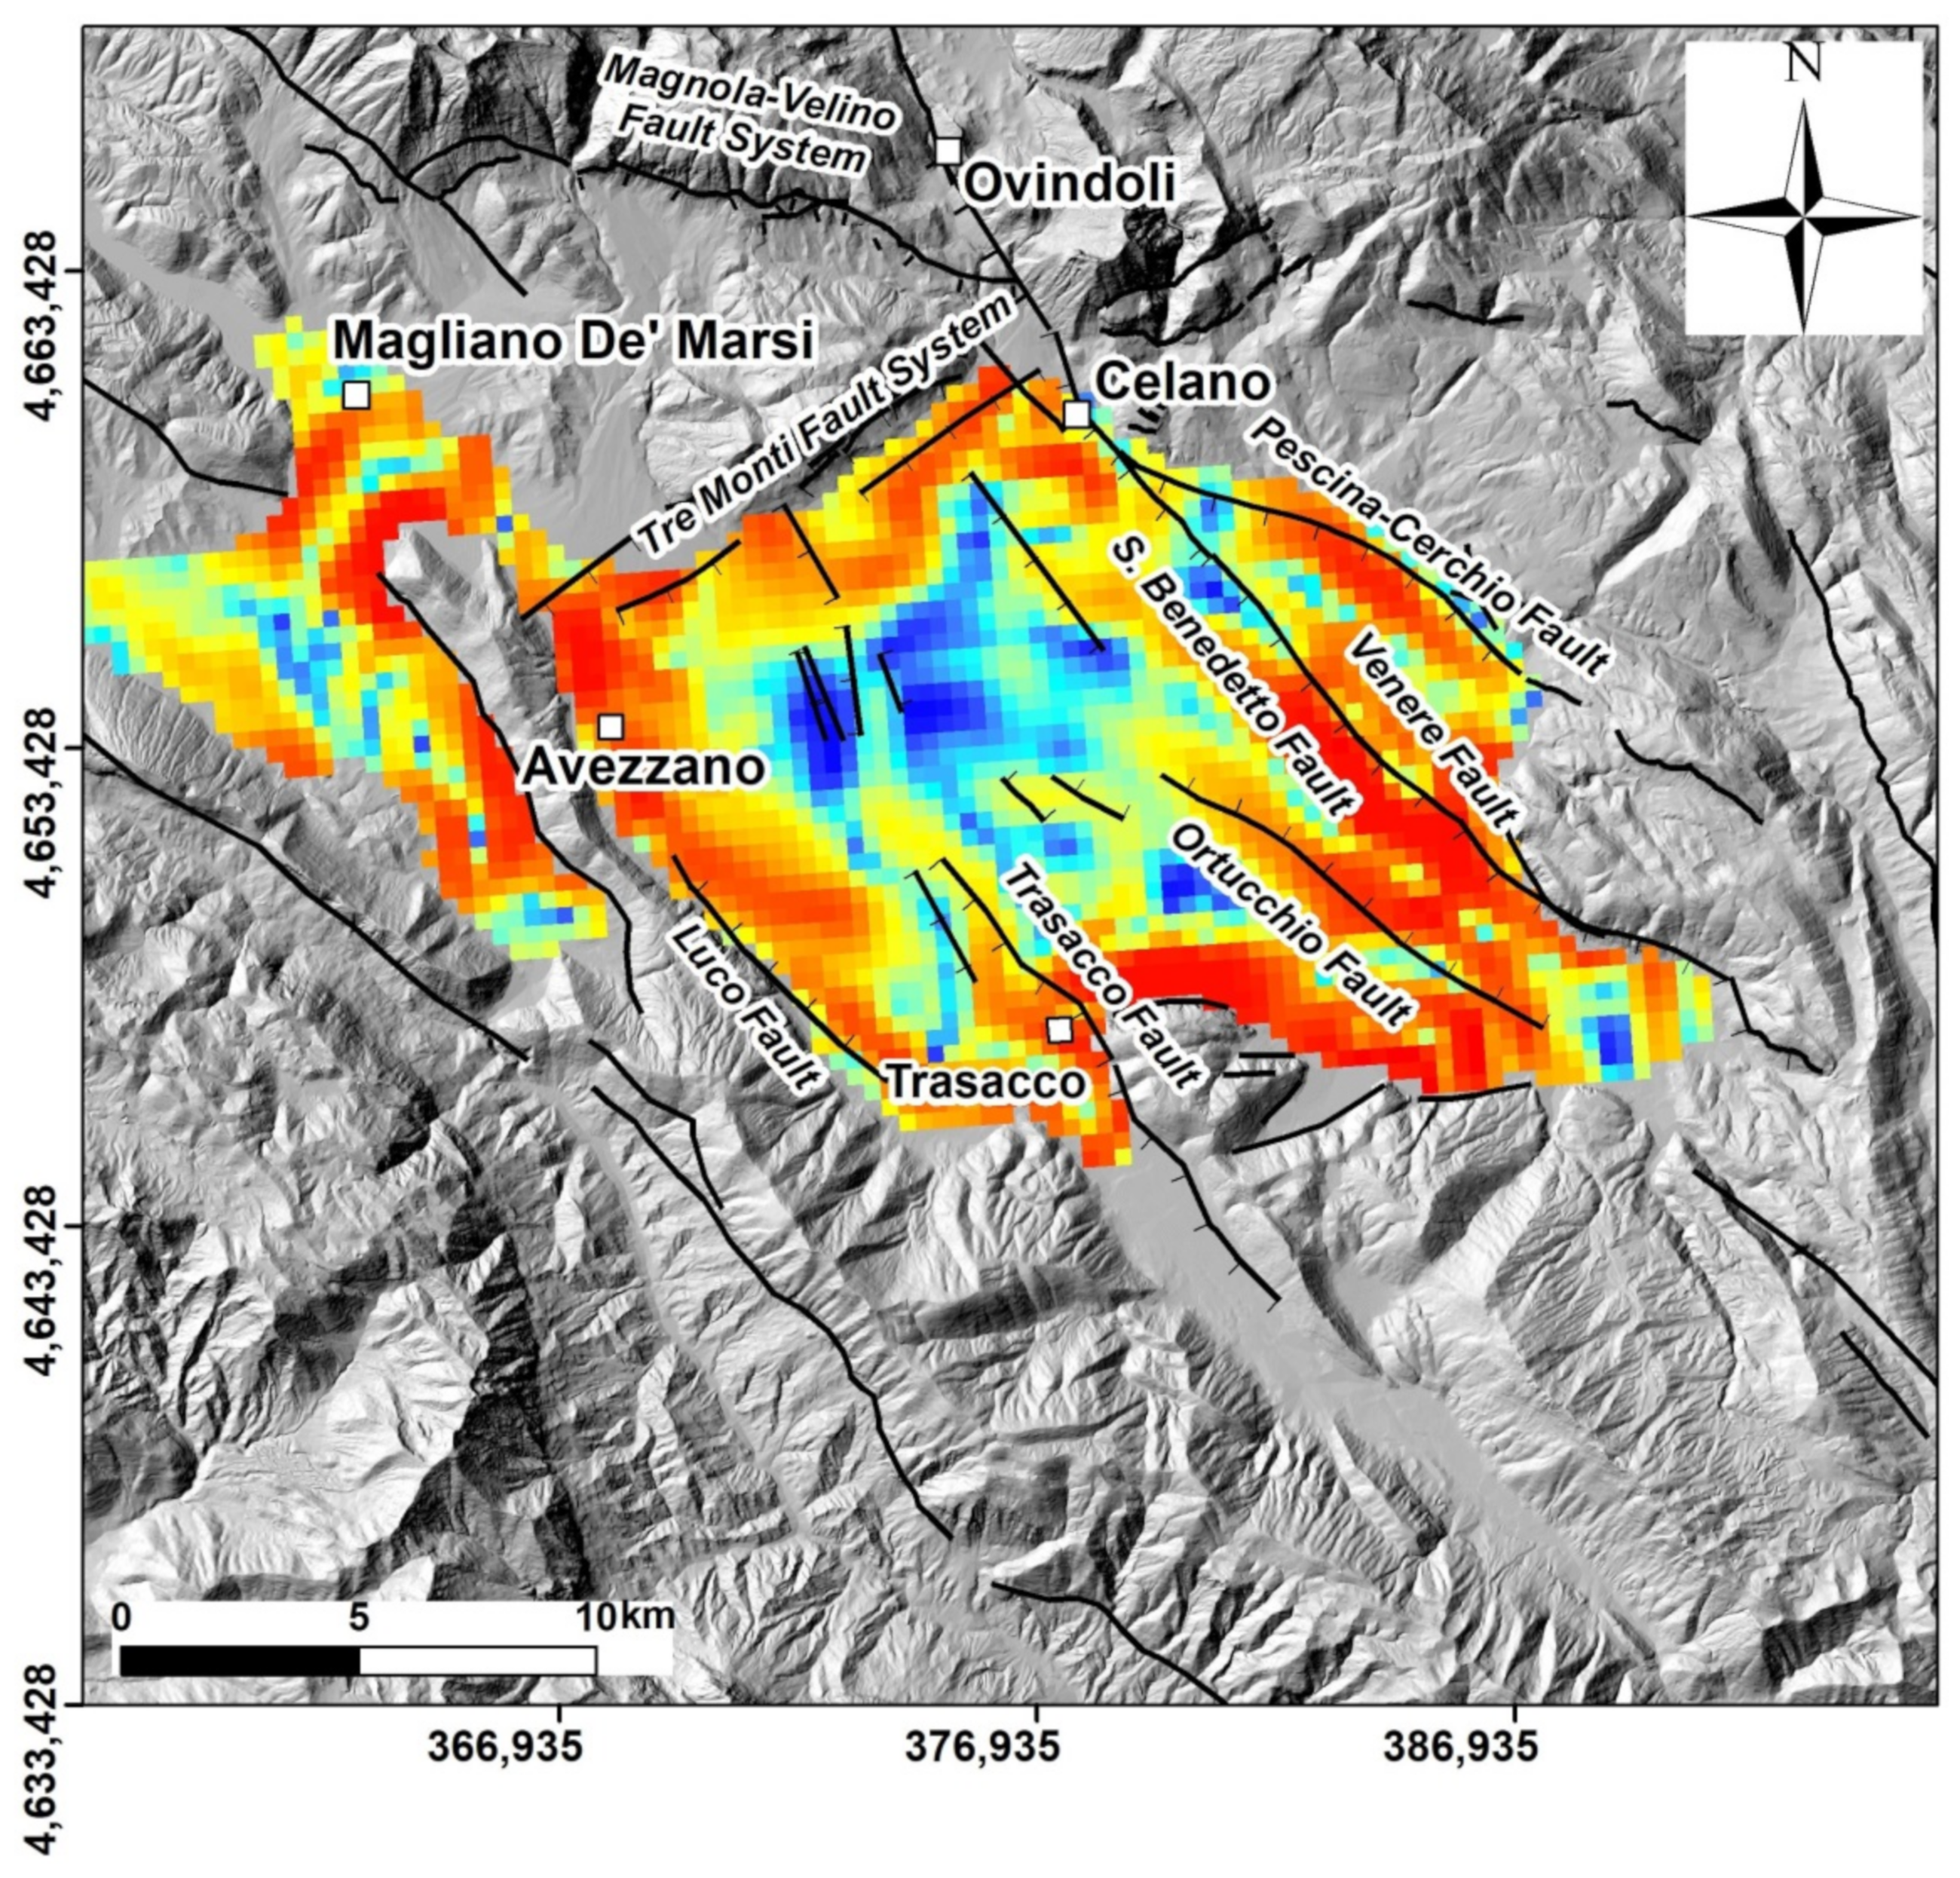
The Fucino Basin of central Italy (Figure 1) is a Quaternary intermontane normal-fault-constrained basin, formed during the extensional phase of the Apennine Chain within an earlier fold-and-thrust belt system [1]. This area was one of the largest lakes in peninsular Italy (more than 150 km2), but it was devoid of significant tributaries and completely drained by the end of the nineteenth century. The plain has an average altitude of about 670 masl and is surrounded by reliefs over 1000 m high. Seismic reflection data [2,5] showed that continental deposits are at least several hundred meters thick. Quaternary continental deposits overlay Mesozoic to middle Miocene carbonate bedrock, which outcrop in the mountains surrounding the basin. A series of Miocene siliciclastic terrigenous sediments are also mostly buried by continental Pliocene-Quaternary deposits [14], as shown in Figure 1. These are composed of alluvial and lacustrine silt and clay deposits, alternated with sand and gravel, with slope-derived breccia at the deepest levels [15].
The Fucino basin is interpreted as a half-graben [2], whose evolution occurred due to two main systems of normal faults: (1) the SW-dipping Celano-San Benedetto-Gioia dei Marsi master fault (hereafter simply called the San Benedetto fault; Figure 1); and (2) the Tre Monti fault system, found at the north-western border of the basin, dipping to the SSE. The latter of these played an important role in the early evolution of the basin [16,17]. Within the basin, well and seismic reflection data [2,5] identified the Trasacco and Luco dei Marsi faults as the synthetic and antithetic splays of the Fucino main fault system [18,19]. A recent study [10] proposed more complicated fault architecture, assigning the features of a dual polarity half-graben to the Fucino basin. The normal fault-system is active during the Quaternary and still today. The recent activity of the San Benedetto master fault is testified by the displacement and tilting of lacustrine formations and slope deposit sequences, the progressive offset of young sediments along Holocene normal fault scarps, the observations of coseismic surface faulting of the 13 January 1915, I = XI MCS Avezzano earthquake, and by trench investigations with related paleosismological studies. These data demonstrate that the SW-dipping San Benedetto master fault and its prolongation along the Magnola SSW-dipping fault are responsible for the 1915 earthquake producing a total surface rupture length of about 38 km [19,20,21,22,23,24,25,26].
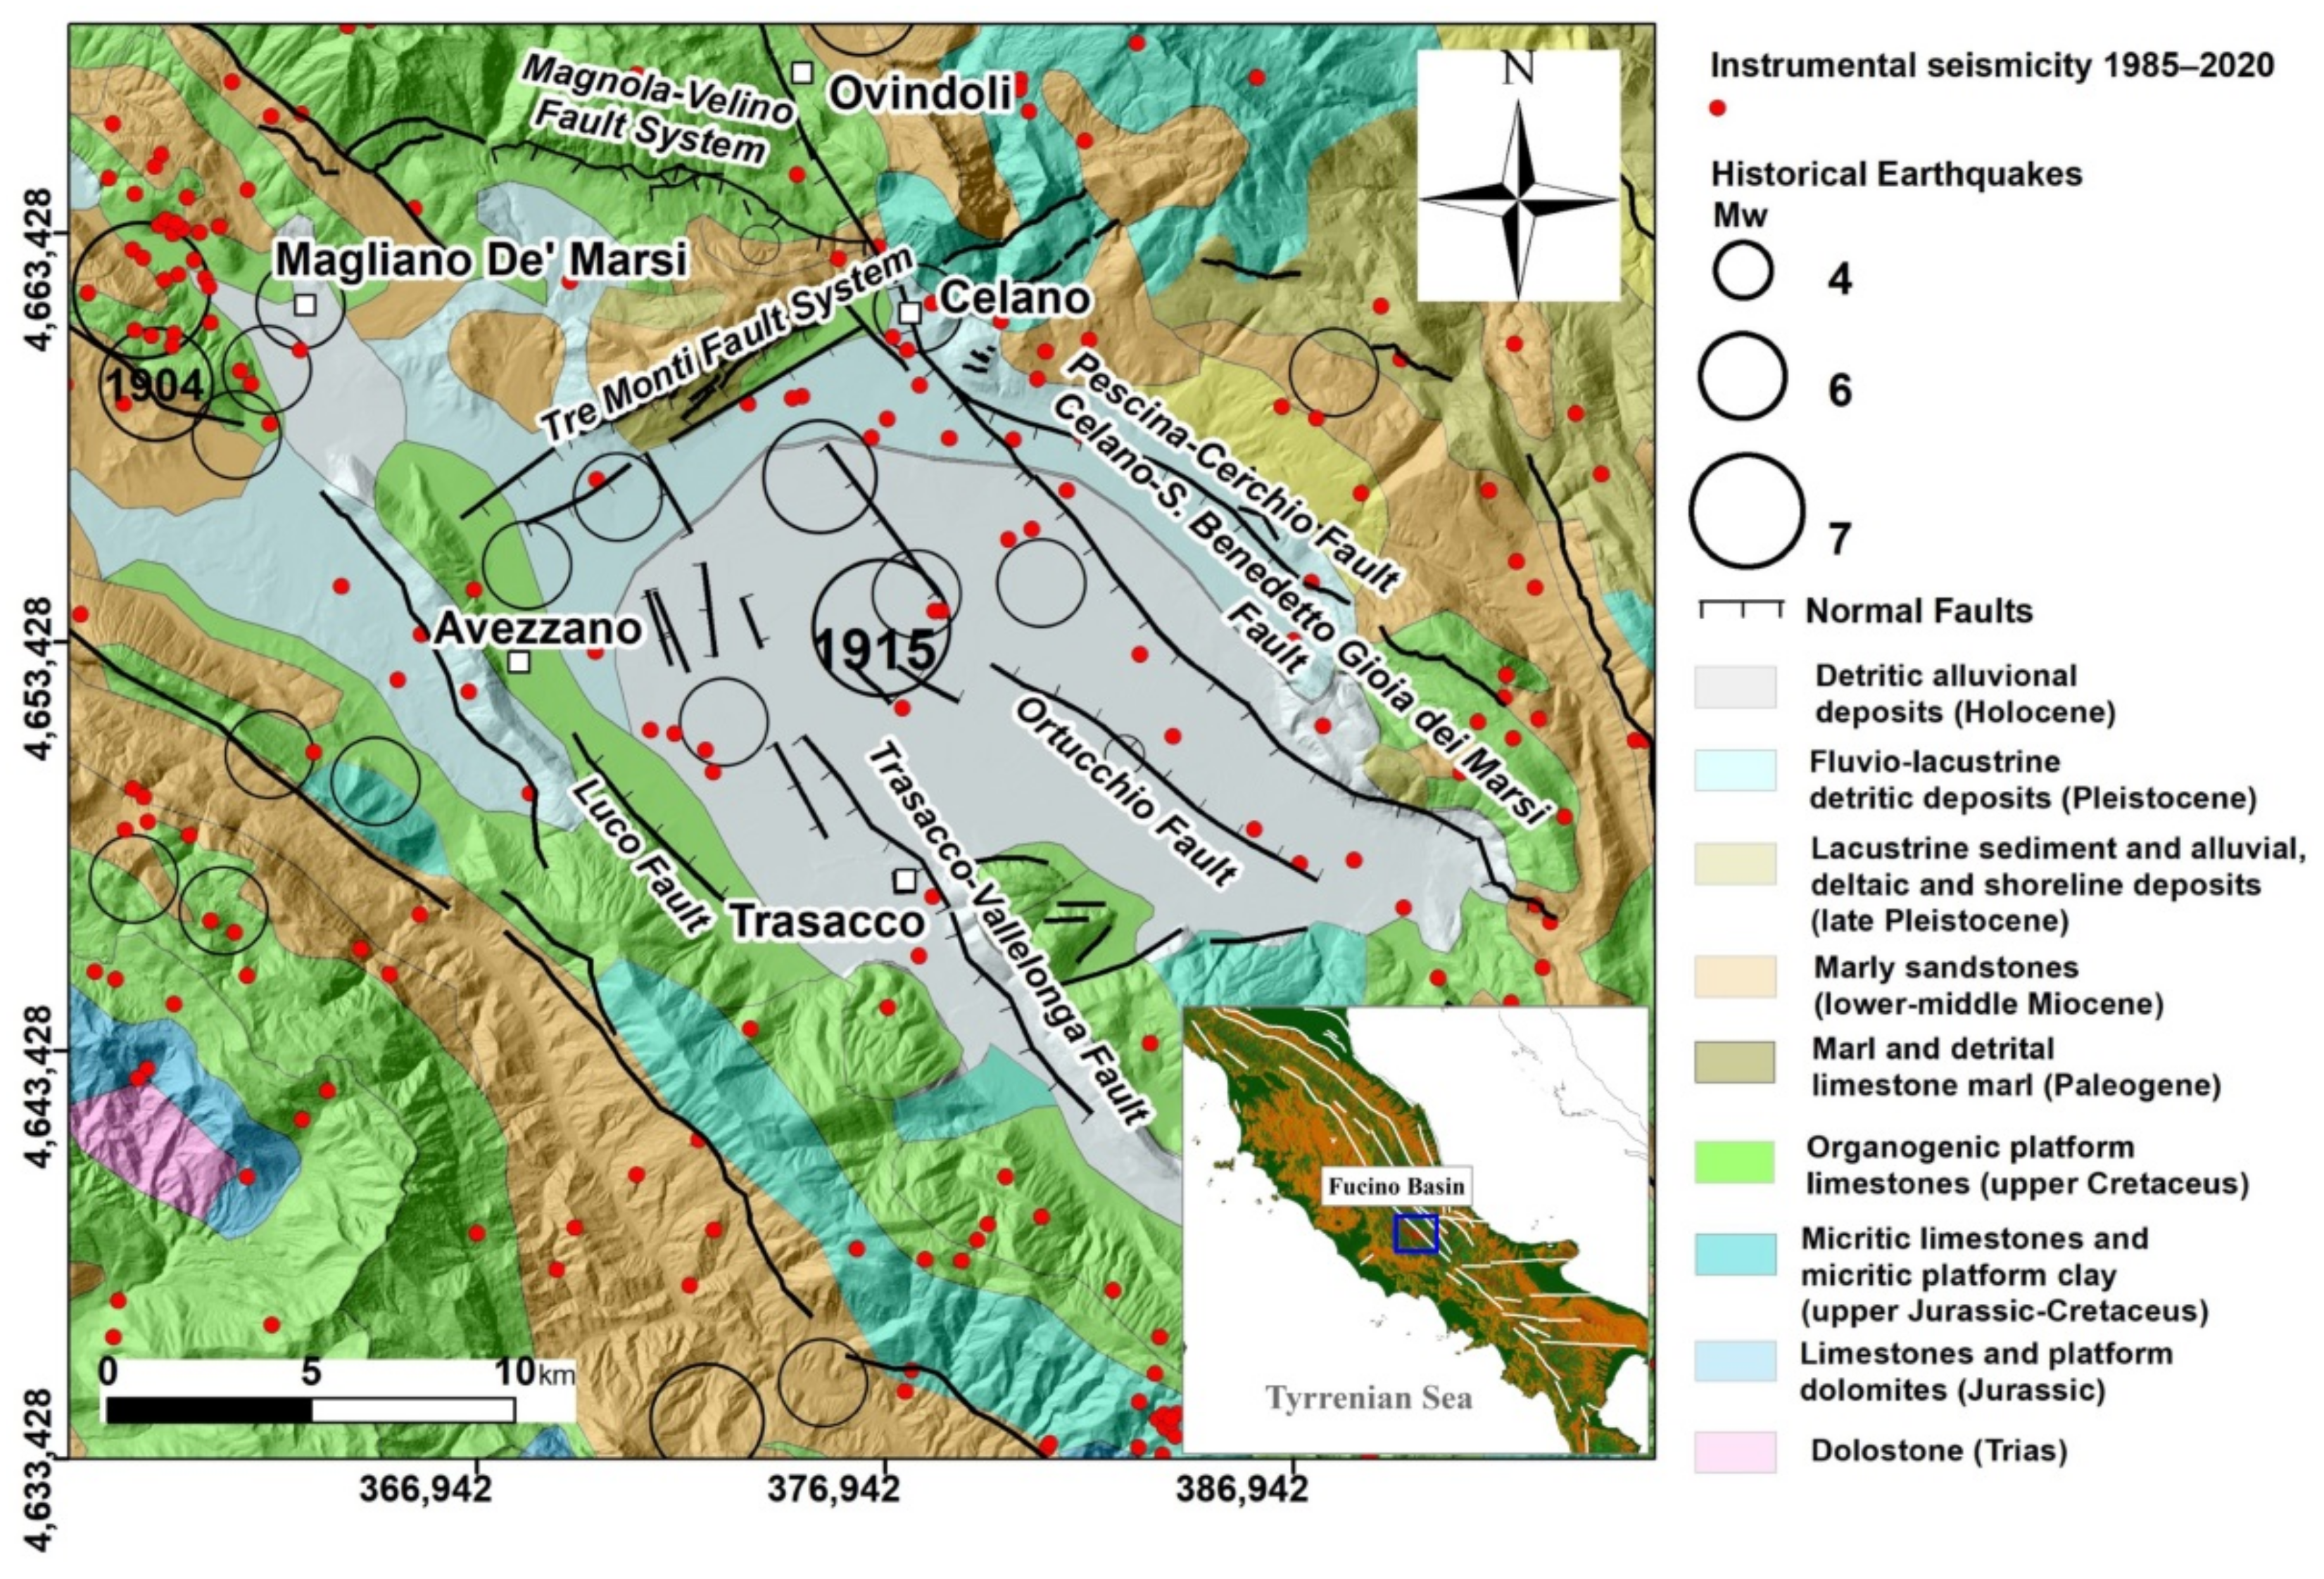
The historical seismicity of the last millennium of the Fucino area included the 24 February 1904 strong earthquake that hit the northwest of the basin ([11], Figure 1a) with I = VIII–IX MCS scale, and the 13 January 1915 strong earthquake with epicenter within the basin and I = XI MCS scale. The damage was disastrous; Avezzano and another three towns were destroyed with about 30,000 fatalities over the Fucino plain.
The instrumental seismicity [27], widespread and scarce, is characterized by low energy (Mlmax = 3.3) (Figure 1). Nevertheless, the towns of the Fucino area were strongly affected by earthquakes of the Apennines active faults in the nearby zones (30–60 km far from Fucino), such as the April 6th 2009 Mw 6.3 L’Aquila earthquake.
Figure 1. The area of our study: map of the Fucino basin. The system of normal faults is from [2]; the historical earthquakes since 1000 A.D. are from [11] (black boxes); the instrumental seismicity is from the ISIDE database [27] (red circles). Geological map (modified from [28]).
Geosciences 11 00398 g001

3. Geophysical Knowledge of the Fucino Plain

The basin was investigated in the frame of different geophysical and geological regional studies, e.g., CROP-11 [3,4,29,30]. The CROP-11 line is a deep reflection seismic profile 265 km long that cuts through the whole central Apennines from the Tyrrhenian coast to the Adriatic Coast through the Fucino Basin (Figure 1). Tiberti and Orlando [29] interpreted the Bouguer gravity data along the CROP-11 profile by a 2D density model. Di Luzio et al. [30] compared the CROP-11 geologic crustal section with seismologic data and regional Bouguer anomalies to reconstruct the trend of the crust–mantle transition. Geologic, seismologic, and gravity data along the eastern half of the CROP-11 profile evidence that the Adriatic Moho deepens toward the central Apennines from 34 km beneath the Adriatic coast to 47 km beneath the Fucino Basin.
The studies from [2,6] analyze the basin at a local scale. Cavinato et al. [2] discussed the results of some seismic profiles across the Fucino Basin showing the subsurface basin geometry; the basin has a rhomboid-shaped basin-fill geometry, with the maximum thickness of the deposits near the San Benedetto master fault (Figure 1). Based on geological surface data, borehole stratigraphy and seismic data analysis, the authors proposed a sedimentary and tectonic history of Plio–Quaternary alluvial and lacustrine deposits, starting from a fluvial stage up to a dominant lacustrine environment. Patruno and Scisciani [10] partially revised the above interpretation, suggesting a tectonic evolution of the Fucino Basin more complex than previously hypothesized. They presented an isopach map of the Plio-Pleistocene basin infill based on the stratigraphic analysis of the available seismic data, showing the existence of two separate depocenters generated by two different system faults.
Ref [6] retrieved information about site amplification effects and geometry of the Fucino basin by analyzing ambient seismic vibrations and recordings of about 150 local earthquakes related to the seismic sequence of the L’Aquila event. Their main result is the reconstruction of the depth to the base of the Plio-Quaternary deposits at several stations in the plain.

4. Gravity Data

The database used in this research is the Bouguer Gravity Anomaly Map of Italy [31], obtained by collecting different sets of measurements provided by several companies and institutions. The reference system adopted for processing the observed gravity values was the International Gravity Standardization Net 1971 (IGSN71). The station elevations were established on the base of their orthometric heights (i.e., referred to the geoid). Gravity reductions were calculated with the normal gravity predicted by the Geodetic Reference System 1980 (GRS80; [32]). Finally, a density of 2.6 g cm−3 was chosen as the most reliable value of reference for terrain corrections in the investigated area. The measurement points in the Fucino Plain are located quite regularly and their distribution allows managing gravity gridded data with a 250 m step. Assessing the error in the gravity measurements is not an easy task, as it depends on typical repeat error for a given instrument and for given environmental conditions, instrumental drift, horizontal position and elevation estimates, and all the post-acquisition processing—most of all, the terrain corrections. Given the uncertainty in estimating the impact of all these factors, we can prudentially estimate an average 0.2 mGal error on the gravity data. This value will determine the stopping criterion for our iterative modelling of the gravity anomalies, to avoid the possibility of including noise in the model.

5. Gravity Modelling

The depth to the basement in the Fucino basin is here recovered by modelling the gravity anomalies through a recently proposed interface inversion (ITRESC [12,13]). This method is based on the knowledge of the depth to the target surface in some points (i.e., constraints). For this study, this constraint is given by a set of seismic lines crossing the Fucino basin and some borehole data. In the following Section, we will describe the whole gravity modelling, from the gravity residuation to the data preparation, and to the final inversion.

5.1. Data Processing

We aim at modelling the Bouguer anomalies in terms of the morphology of a single surface corresponding to the top of the basement in the Fucino area, so that the density contrast is generated by the contact between the carbonate units and the overlying basinal Cenozoic and Plio-Quaternary sediments. The ITRESC modelling approach assumes that the Bouguer anomalies are free from the contribution of deep or far sources. Consequently, a first necessary processing step is a regional/residual separation. However, the Bouguer anomalies do not display a clear long-wavelength gravity trend across the study area. We tested different classical approaches to regional/residual separation (not shown here), such as polynomial approximation (e.g., [33]) and wavenumber domain filtering (e.g., [34]), both involving a rather subjective choice of key parameters such as the polynomial degree or the cutoff wavenumber.
We obtained convincing results by using the simple method outlined by [35], according to which the regional field in the basin area can be estimated by interpolating the data located outside the basin, after removing the data located inside the basin area. We obtained the residual gravity field by subtracting this regional field to the observed data. This kind of approach is good at removing the effect of deep sources but is also able to remove local trends generated by relatively near masses outside the basin. The only parameter to set is the boundary between the area influenced by the gravity effect of the basin and the outer data. In fact, generally, the gravity anomaly of the basin extends on a surface larger than that of the basin itself, and the gravity data should be removed in a belt around the basin before interpolation. Thus, we tested several belt widths, finally selecting a width of 1750 m. Our criterion for choosing the best width of the belt surrounding the basin boundary (and consequently the best gravity residual) considered the gravity amplitudes at the basin edges (where basement outcrops): the best residual is the one having the most similar values at these points.
The Bouguer anomaly of the Fucino Plain (Figure 2) is dominated by a pronounced minimum whose significant amplitude (~30 mGal) stands as a noticeable feature of the gravity field of Central Italy. The causative source of this gravity minimum is likely due to the foundering of the Meso-Cenozoic marine carbonates (e.g., [2]), producing a strong density contrast with the low-density sediments filling the structural depression. The gravity low is asymmetric, with much stronger horizontal gradients along its eastern side. Moreover, the gravity low is shifted eastward with respect to the geographic center of the Fucino Plain.

5.2. Preliminary Analysis of Structural Features by Enhanced Horizontal Derivative of Gravity Data

Several techniques of data processing can enhance the information contained in a map of gravity anomalies, allowing to outline lateral changes in rock density. This leads to identify in 2D plan-view both stratigraphic and structural boundaries between contiguous rock units, sometimes allowing a first, rough geological mapping (e.g., [34]). Good results are achieved when rock limits occur along vertical or sub-vertical tectonic contacts (e.g., normal faults). This provides maps in which the gravity effect at the horizontal location of the density contrasts, as in correspondence to a vertical large-throw fault, results enhanced. Hence, these techniques are ideal tools for a fast, preliminary interpretation. In our case, we used a multi-resolution boundary estimator based on the basic concept of horizontal derivative, namely the Enhanced Horizontal Derivative (EHD, [36,37]).
The Enhanced Horizontal Derivative uses a weighted summation of spatial derivatives of different orders of the gravity anomalies. Assuming the hypothesis of vertical density contrasts, its maxima values individuate the horizontal position of the causative body edges. The terms of this summation can be chosen such that the final map displays, in the clearest way, the horizontal position of density contrasts. Thus, several trials are needed to properly select the best combination of derivatives and weights. In our case, we set all the weights to unity and chose derivatives from the second to the fifth order of the original gravity field (e.g., [38,39,40]).
In the case of the Fucino Plain, EHD map analysis demonstrated its effectiveness by considering derivatives of the gravity potential from the second up to the fifth order (Figure 3). Such an optimal EHD tuning revealed trends of maxima, confirming the presence of several structural lineaments recognized or hypothesized as faults in previous studies (e.g., [2,9,18,19]. The faults bordering the Fucino Basin and, in particular, the Luco fault (western side), the Tre Monti fault (northern side), and the Pescina-Cerchio fault (eastern side) can be clearly identified (Figure 3). More interestingly, in the central area of the plain, the EHD map shows clear NW-SE oriented maxima trends (Trasacco fault, Ortucchio fault, and San Benedetto fault), roughly matching the structures shown by, e.g., [2,6]. These authors reconstructed the pattern of those structures based on the evidence on a few seismic lines and wells. In the EHD map, we can follow their trend across the whole basin. The amplitude of these trends of EHD maxima decreases northwestward, suggesting that, at the bedrock, the morphological footprint of the fault displacement tends to decrease in that direction.
Moreover, other trends are visible within the basin, proving the presence of other smaller structural discontinuities, still unidentified. As an example, a smaller linear trend runs between the Pescina-Cerchio and the San Benedetto faults (here called “Venere fault”). In particular, the Tre Monti fault is located just along the northern edge of the EHD map, but it seems to develop southwestward in a complex way. It shows a small, half-ring-shaped trend whose western side seems to be well correlated with a small normal fault N-S running between S. Pelino and Paterno individuated by [2] and with downward displacement on the western side. Thus, it could play a role some more complex than that of a typical release fault bordering a half-graben. Previous studies do not mention significant faults playing the role of release faults bordering the southern side of the Fucino half-graben, whereas a strong trend of maxima is shown in the EHD map just along this side of the basin.

5.2.1. 3D Modelling: The ITRESC Method

The ITerative RESCaling (ITRESC) method is fully presented in [12,13]; consequently, only the general modelling strategy will be outlined here, referring the reader to the previously mentioned papers for further details.
The method is based on the relationship existing between the residual gravity amplitude and the depth to basement. This relationship is simply approximately linear in the case of a homogeneous basin (i.e., when the density contrast between the basement and the filling sediments is constant). In this case, it can be described by a concave-downwards low-degree polynomial when the density contrast decreases with depth. A polynomial function is fitted to the depth–gravity relationship, with a degree chosen based on the parsimony principle (using tools such as the Akaike’s Information Criterion, AIC, or the Analysis of Variance, ANOVA [13]). This polynomial function, evaluated on the full gravity anomaly range, provides a one-to-one conversion rule between the gravity values and depth to basement. Thus, having a set of constraints to the basement depth in a basin, a plot of the depth–gravity relationship can be used to easily convert the gravity anomalies into a surface. Such a surface describes the depth to basement in a very simple way, without any knowledge or assumptions about the density contrast. The model obtained (called “first-approximation” model) is a good, albeit smooth, representation of the true basement. The first phase of the ITRESC method involves the estimate of the density contrast, exploiting the linear relationship between this parameter and the gravity data. In case of a homogeneous basin, a plot of the observed gravity vs. the gravity computed from the first-approximation model using a unit density is well described by a line, its slope being an estimate of the density contrast [41]. In more common situations, when the density contrast varies with the depth, this plot is fitted by a polynomial function, which is simplified in several linear segments by the Douglas and Peucker (1973) automatic method [42]. The slope of these segments represents an estimate of the density contrast in a depth interval determined by inserting the observed gravity values of the endpoints of the segments in the depth–gravity relationship plot. In this way, a stepped density function can be estimated. Finally, an iterative process is set up, wherein the misfit between the observed gravity and the gravity field predicted by the model using the estimated density function is evaluated. This misfit is rescaled into depths by multiplying it by a constant representing the step size of the iteration. Then, it is summed to the current model, until some convergence criterion is met. This convergence criterion is generally set up by considering the error on the data, including measurement errors as well as errors in the computation of the Bouguer anomalies.
The key points of the ITRESC method are the following:
(a)
no information on the density contrast is needed in the modelling of the basement depth, contrarily to what is currently needed by almost all algorithms devoted to this task (e.g., [43,44,45]);
(b)
the ITRESC method incorporates the information on the basement depth given by the available constraints in the definition of a general rescaling law to convert the gravity data into depths, which is valid in all of the basin area;
(c)
the density contrast, or its variation with the depth in the entire area, is estimated by a data-driven procedure, combining gravity data and available constraints on the depth to basement;
(d)
as with almost all algorithms for the estimation of the basement depth from gravity data, the ITRESC method assumes the absence of any lateral variation in the density contrast.

5.2.2. 3D Modelling: Constraints to Gravity Modelling

As mentioned above, ITRESC needs some reliable constraints to the basement depth for modelling the residual gravity. In the case of the Fucino Plain, several seismic lines, along with a number of shallow drillings, provided a set of information that were carefully examined in this study as possible constraints.
A large number of water wells were drilled in the Fucino Plain, but only a few of them intercept the bedrock. We selected as valid constraints only the wells for which reliable borehole data are available, concerning the lithology of the top of the detected carbonate basement with related depths (Table 1).
However, most constraints come from the interpretation of seismic surveys carried out in the area in the last decades (e.g., [5]).
It must be observed that most of the research carried out in the last two decades about the structural and stratigraphic setting of the Fucino Basin [1,6,48,49] all make reference to the Plio-Quaternary base depth model proposed by [2], starting from the analysis of several commercial seismic lines and the regional CROP11 line ([50,51]). Such a model consists in an isochron contour map of the alluvial and lacustrine deposits of the base of the Plio-Pleistocene sedimentary sequences showing a maximum of 900 ms TWT (two-way time) in the central-eastern part of the basin to the west of the San Benedetto fault. Cavinato et al. [2], assuming a Vp constant value of about 1850 m/s, estimated a depth of 850 m for this depocenter.
On the other hand, the interpretation of seismic sections [2,4] would also allow the reconstruction of a deeper reflector, related to the top of the marine carbonate basement of Meso-Cenozoic age. This interface shows a more articulated morphology than the shallower Plio-Pleistocene base, better reflecting the results of the fault displacements driving the tectonic evolution of the basin.
We remark that special attention is needed when selecting constraints to the gravity modelling, as these will have a direct impact on the estimated depths. In fact, interpretation seismic data for this area could suffer from uncertainties related to: (1) the sometimes-unclear recognition of the reflectors, and (2) the simplistic time/depth conversion procedure adopted in previous studies. Concerning point 1, weak or noisy signals within the mentioned seismic sections often made long stretches of reflective interfaces too faint and uncertain to be correctly individuated and reliably interpreted, so we decided to assume as constraints only the most clear and unquestionable ones. Regarding point 2, we assigned realistic velocity values to the stratigraphic sequence of the basin infill for a correct time/depth conversion by means of a critical assessment of information discussed in more detail in Appendix A.
Our conclusion is that the wide range of velocities estimated in Apennine intermontane basins cannot be successfully approximated by a single average value, unless accepting to make gross errors in the reconstruction of the depth to reflective interfaces.
Considering the above issues, we considered it necessary to ensure the reliability of the seismic information chosen as a constraint for the gravity modelling by making an independent analysis of each seismic line.
To achieve this, we selected only the reflective segments whose evidence is unquestionable, neglecting all the reflectors affected by interpretative ambiguity or consisting in uncertain or faint signals. We focused our attention on six seismic lines carried out by an Elf-Agip joint venture from 1980 to 1982. Four of these lines are a reprocessed version of the lines 1, 2, 3, and 4 interpreted by [2] and were released since 2009 within the ViDEPI Project ([50]). After selection, only data from three seismic lines (1-82-AZ-03, 1-82-AZ-05 and 1-80-AZ-03) were chosen as reliable constraints for our modelling, given the overall poor data quality as recognized by [2] and in the original report of the dealer-oil company ([5]).
Taking into account the results of the time/depth conversion based on the local velocity variation patterns described in the Appendix A, we build a set of constraints to the gravity modelling by sampling the depth to these reflectors along the seismic lines, each 250 m, to ensure a resolution similar to that of the gravity data.
As better explained in the previous section, our gravity inversion approach does not require assuming a function describing the variation of the density contrast with the depth, which is instead estimated during the modelling. However, it may be useful to assess the available information (see Appendix A) about the densities of the Mesozoic-Cenozoic carbonate units (namely the bedrock) and of the overlying Plio-Quaternary alluvial/lacustrine sediments. These data will allow a comparison with the density contrasts estimated during the gravity modelling and a critical discussion of the modelling results.
From the density information discussed in the Appendix A, we can expect an average density contrast between marine carbonate bedrock and infilling alluvial/lacustrine formations of about 0.5–0.6 g/cm3, with values increasing up to 0.8–0.9 g/cm3 for shallower and younger sediments and decreasing to 0.4–0.3 g/cm3 for the basal and flysch sediments.
In principle, both the strong reflectors seen on the seismic reflection profiles (related to the top of the Meso-Cenozoic carbonates and to the base of the Plio-Quaternary deposits) could represent a density boundary, with the density increasing with depth. However, we expect a significant compaction of the Plio-Quaternary lacustrine sediments subject to burial in the Fucino basin and a consequent increase of their density, from very low values (<2.0 g/cm3) at the surface to densities progressively higher, up to becoming similar to that of the clayous/marnous flysch lithologies (about 2.2–2.3 g/cm3). This scheme should imply the presence of a relatively small vertical density contrast at the base of the Plio-Quaternary sediments. A major density contrast of 0.3–0.4 g/cm3 should instead characterize the deeper surface separating the Cenozoic flysch (density of 2.2 to 2.3 g/cm3) and the Meso-Cenozoic carbonates (average density of 2.6 g/cm3).
Based on the above reasoning, we can assume that the residual gravity anomalies are essentially shaped by the oscillations of the top of the Meso-Cenozoic carbonates, so that we will primarily use the constraints coming from the depth to this specific surface as constraints to the gravity modelling. However, to verify the correctness of this choice, in the next section, we will test the constraints related to the shallowest reflector, related to the base of the Plio-Quaternary sediments.

5.2.3. 3D Modelling: ITRESC Application to the Fucino Gravity Anomaly Field

As discussed above, our gravity modelling aims at recovering the shape of the top of the Meso-Cenozoic basements, considered as the geological discontinuity at which the strongest lateral density contrast occurs. Consequently, we assume that the residual gravity anomalies are mostly responding to the undulations of this surface.
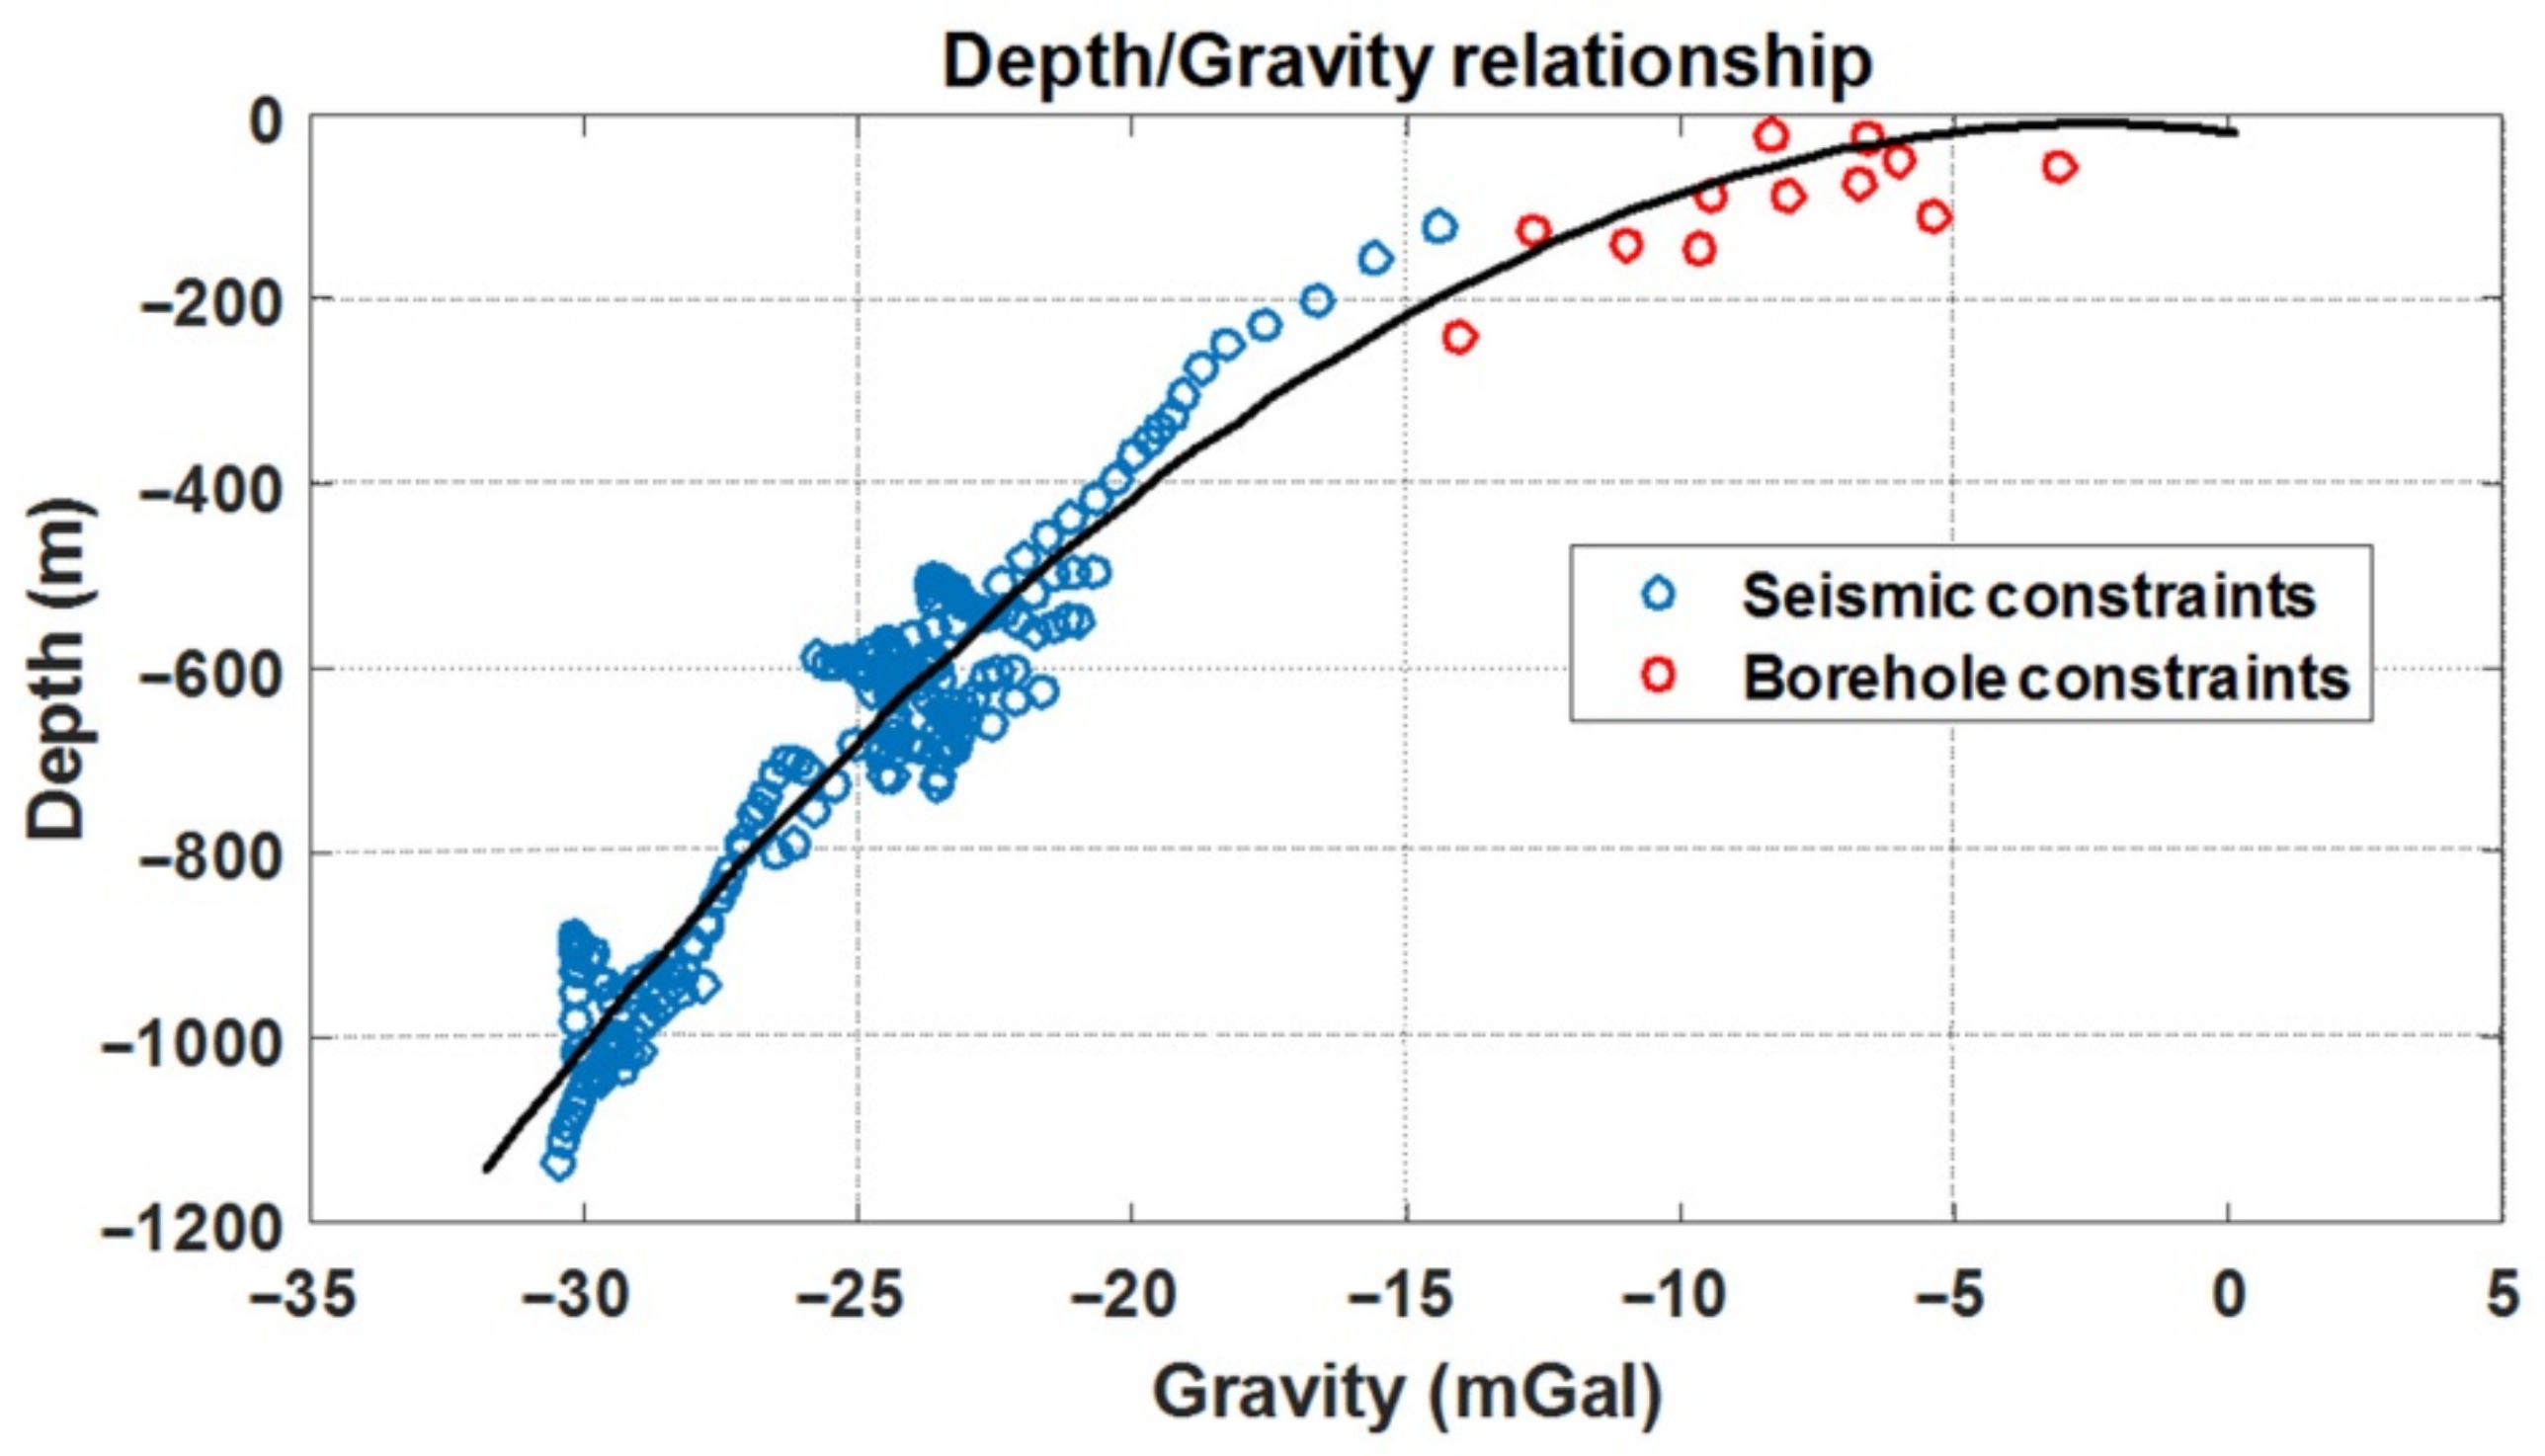
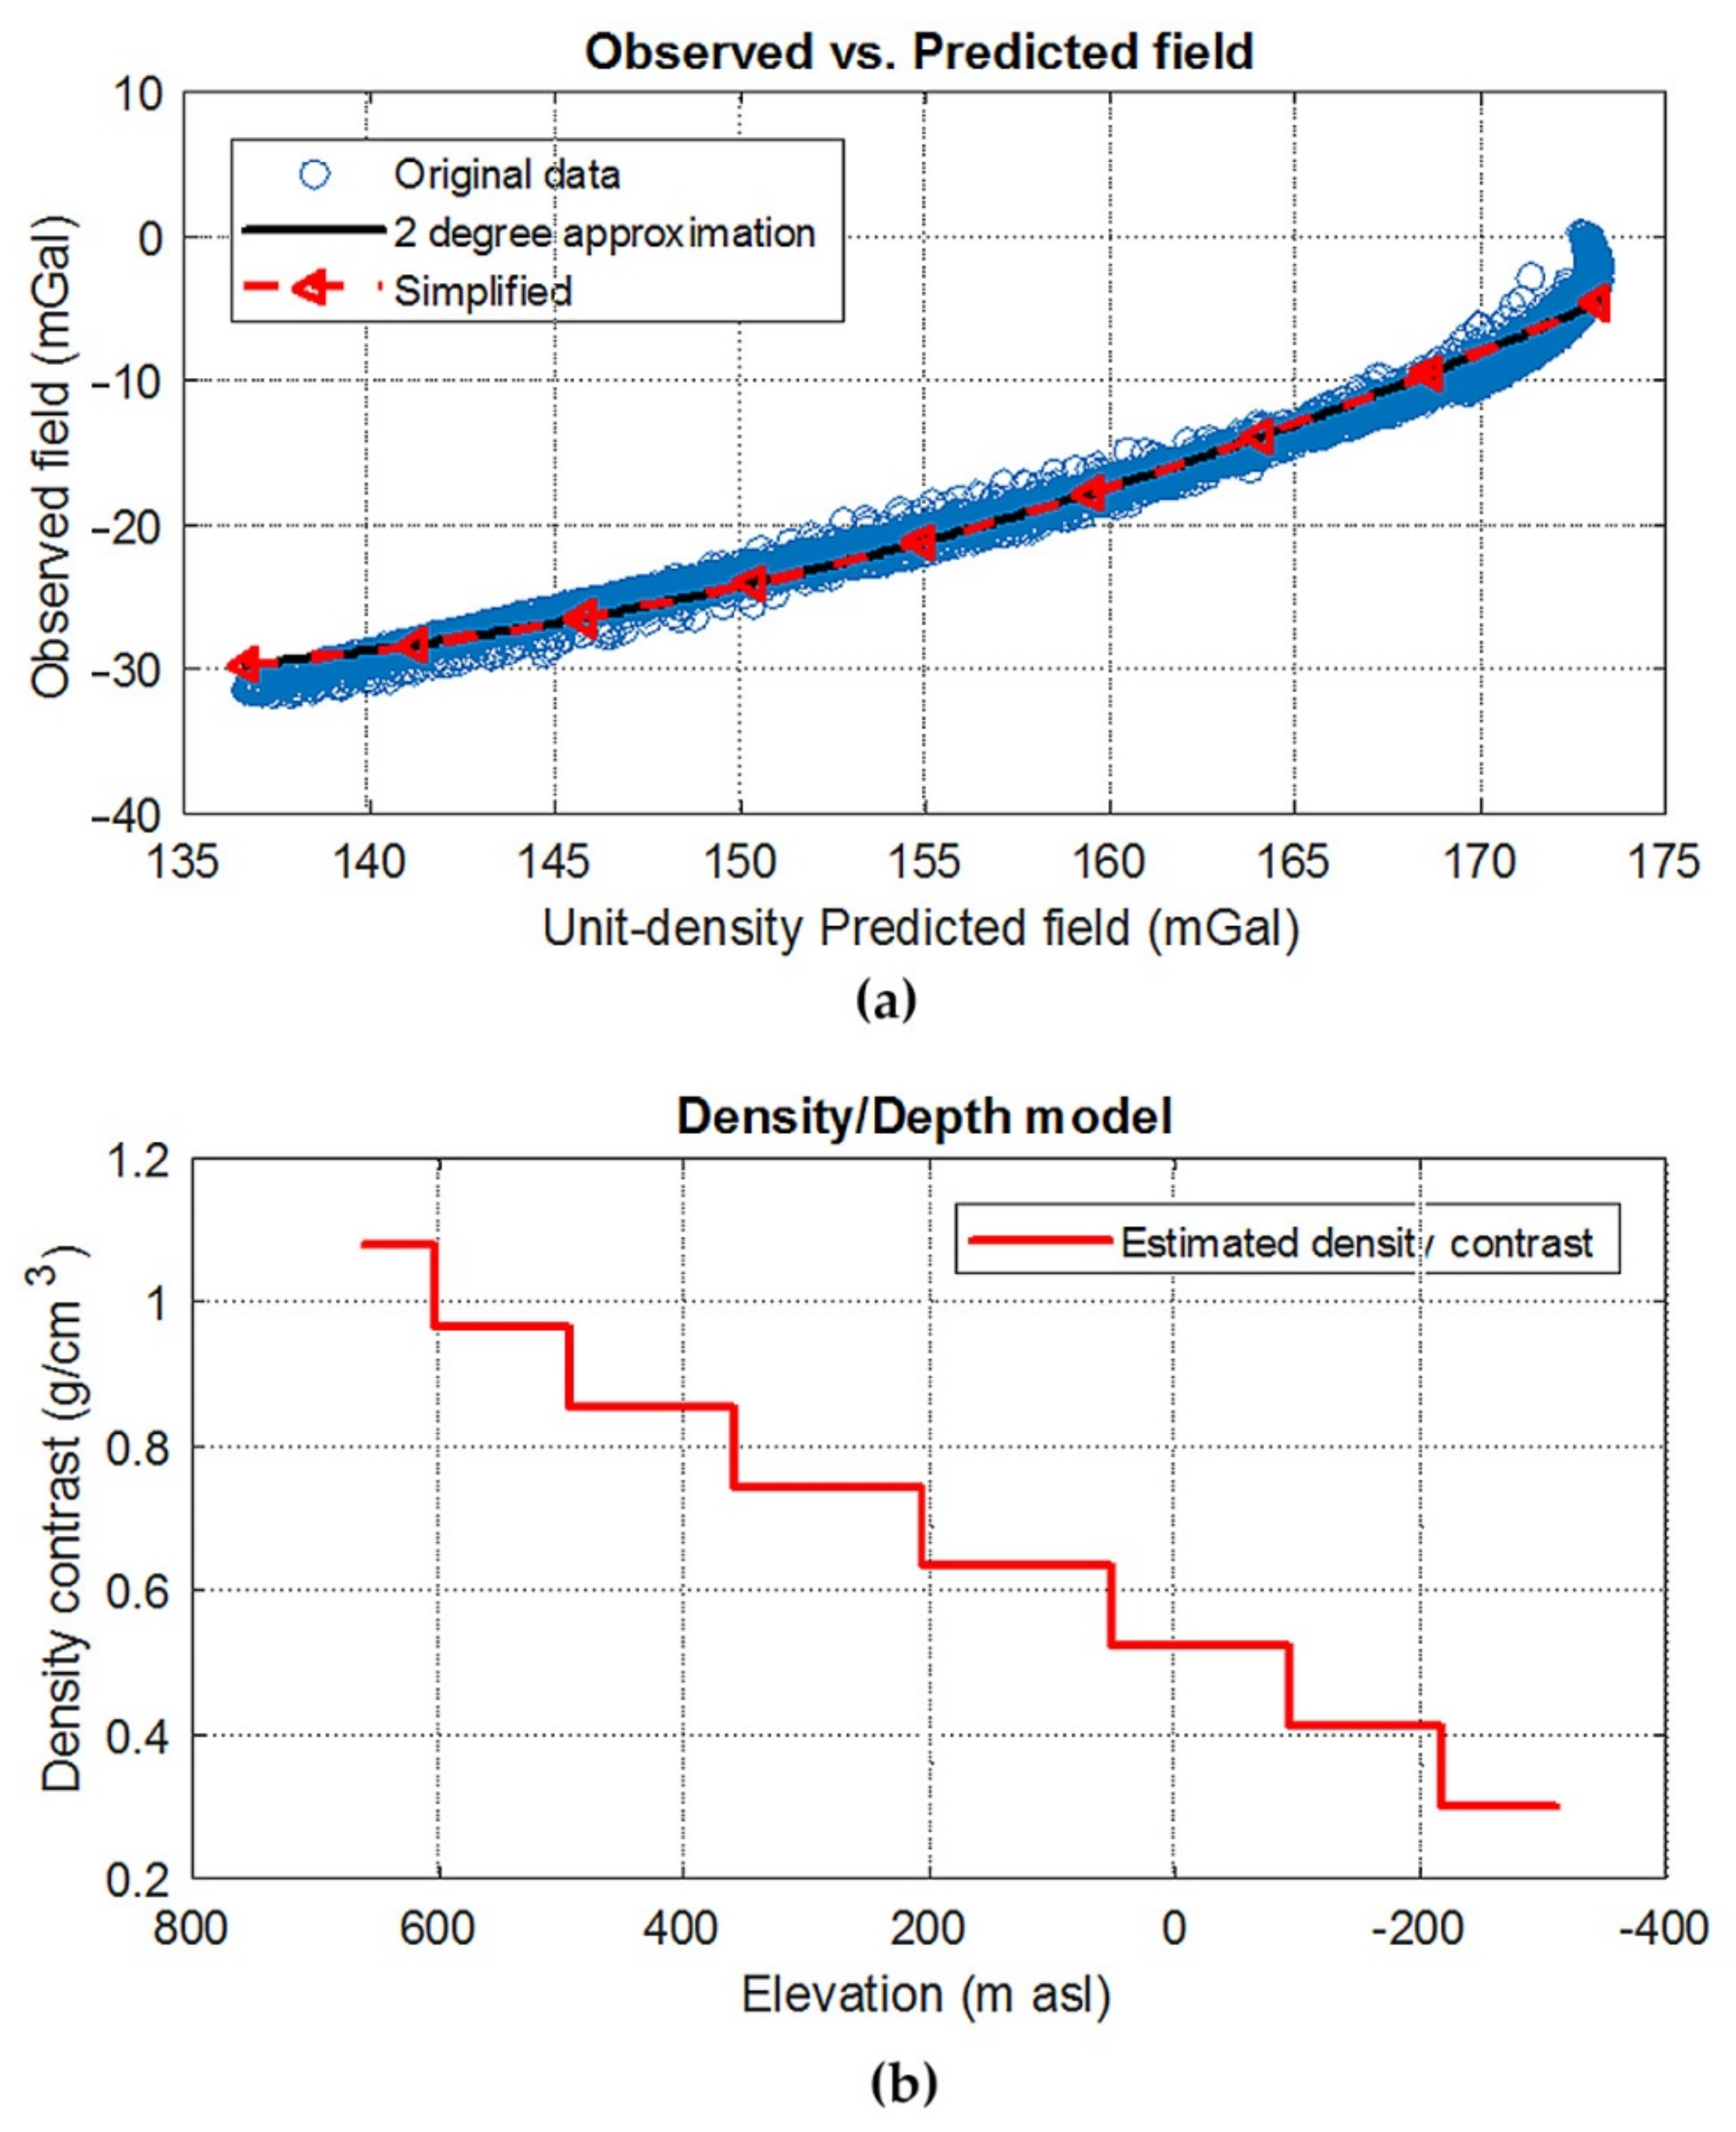
As the topography of the Fucino plain is almost flat, we considered a single constant average altitude of 677 m asl (the standard deviation from this average is as small as 27 m). The first step of the ITRESC modelling is the building of the depth–gravity plot. The residual gravity amplitude is interpolated at the locations of the seismic and borehole constraints. The plot shows a distribution of points well approximated by a second-degree polynomial, as suggested by both ANOVA and AIC criteria (Figure 4). We use this polynomial as a rescaling rule, valid across all of the Fucino basin area, to convert the gravity values into basement depths. This rescaling produces a first-approximation model of the top of the basement, with a procedure that is completely independent from the density contrast. We then use this model to obtain a depth-density function and refine the estimated basement surface. This procedure starts by computing the unit-density gravity field generated by the first-approximation model and comparing it with the residual gravity data (Figure 5a). The points cloud is again approximated using a second-degree polynomial curve. The slope in each point of this curve gives an estimate of the density at each depth within the basin infilling. However, the ITRESC method does not run with a continuous density variation but needs a discrete density model consisting in a finite number of intervals, each of which having a constant density.
For this reason, the polynomial curve in Figure 5a was simplified in a set of linear segments (eight in our case) using the Douglas and Peucker (1973) method [42] and representing a good approximation of that.
Each of these segments shows a slope related to the density expected within the depth range identified in Figure 4 by the observed gravity endpoints of the considered segment shown in Figure 5a. Each depth range identifies a layer so that a depth-density function can be established ([11], Figure 5b).
The estimated depth-density function shows an almost linear decrease of the density contrast with depth, from values slightly less than 1.08 g/cm3 to about 0.30 g/cm3 in the deepest portions of the basin. Assuming a carbonate bedrock density of 2.6 g/cm3, the estimated density contrasts would lead to densities of 1.52 g/cm3 at surface and up to the first 80 m depth, and of 2.30 g/cm3 in the deepest parts of the basin (for depths greater than 900 m from the ground surface). The surficial density is rather low, but it is consistent with peat layers or loose young sediments, and similar values are sometimes measured at the shallowest layers of sediments, as reported in [52].
However, we have also tested the shallowest reflector (interpreted in the original reports [5] as relative to the base of the Plio-Quaternary sediments) as a possible constraint, following the same procedure as above. In this case, the shallow depths indicated by the reflector, combined with the strong amplitude variation of the residual gravity anomalies, implied an estimated depth-density function with unrealistically high-density contrasts, with a maximum at the surface of about 1.8 g/cm3 and values greater than 1 g/cm3 up to 300 m below ground. This test allowed excluding the hypothesis that the most significant density contrast, shaping the residual gravity anomalies, be that relative to the base of the Plio-quaternary sediments (the shallowest reflector). Thus, we support the hypothesis that from the point of view of the gravity modelling the deepest reflective surface clearly visible in the seismic sections mentioned above can be safely identified with the Meso-Cenozoic carbonate rocks.
The estimated depth-density function (Figure 5b) is then used to compute the gravity field generated by the first-approximation model. This field is subtracted to the observed gravity to obtain a misfit field. An iterative phase is then started, where the misfit gravity field is rescaled using a constant (the iteration step size, having dimensions of m/mGal) and the obtained depth correction is summed to the current model. The process is repeated until the rms of the gravity misfit falls under the error associated to the gravity data (0.20 mGal). The iteration step size can be arbitrarily set, as it has only the function to rule the speed of the convergence [53].
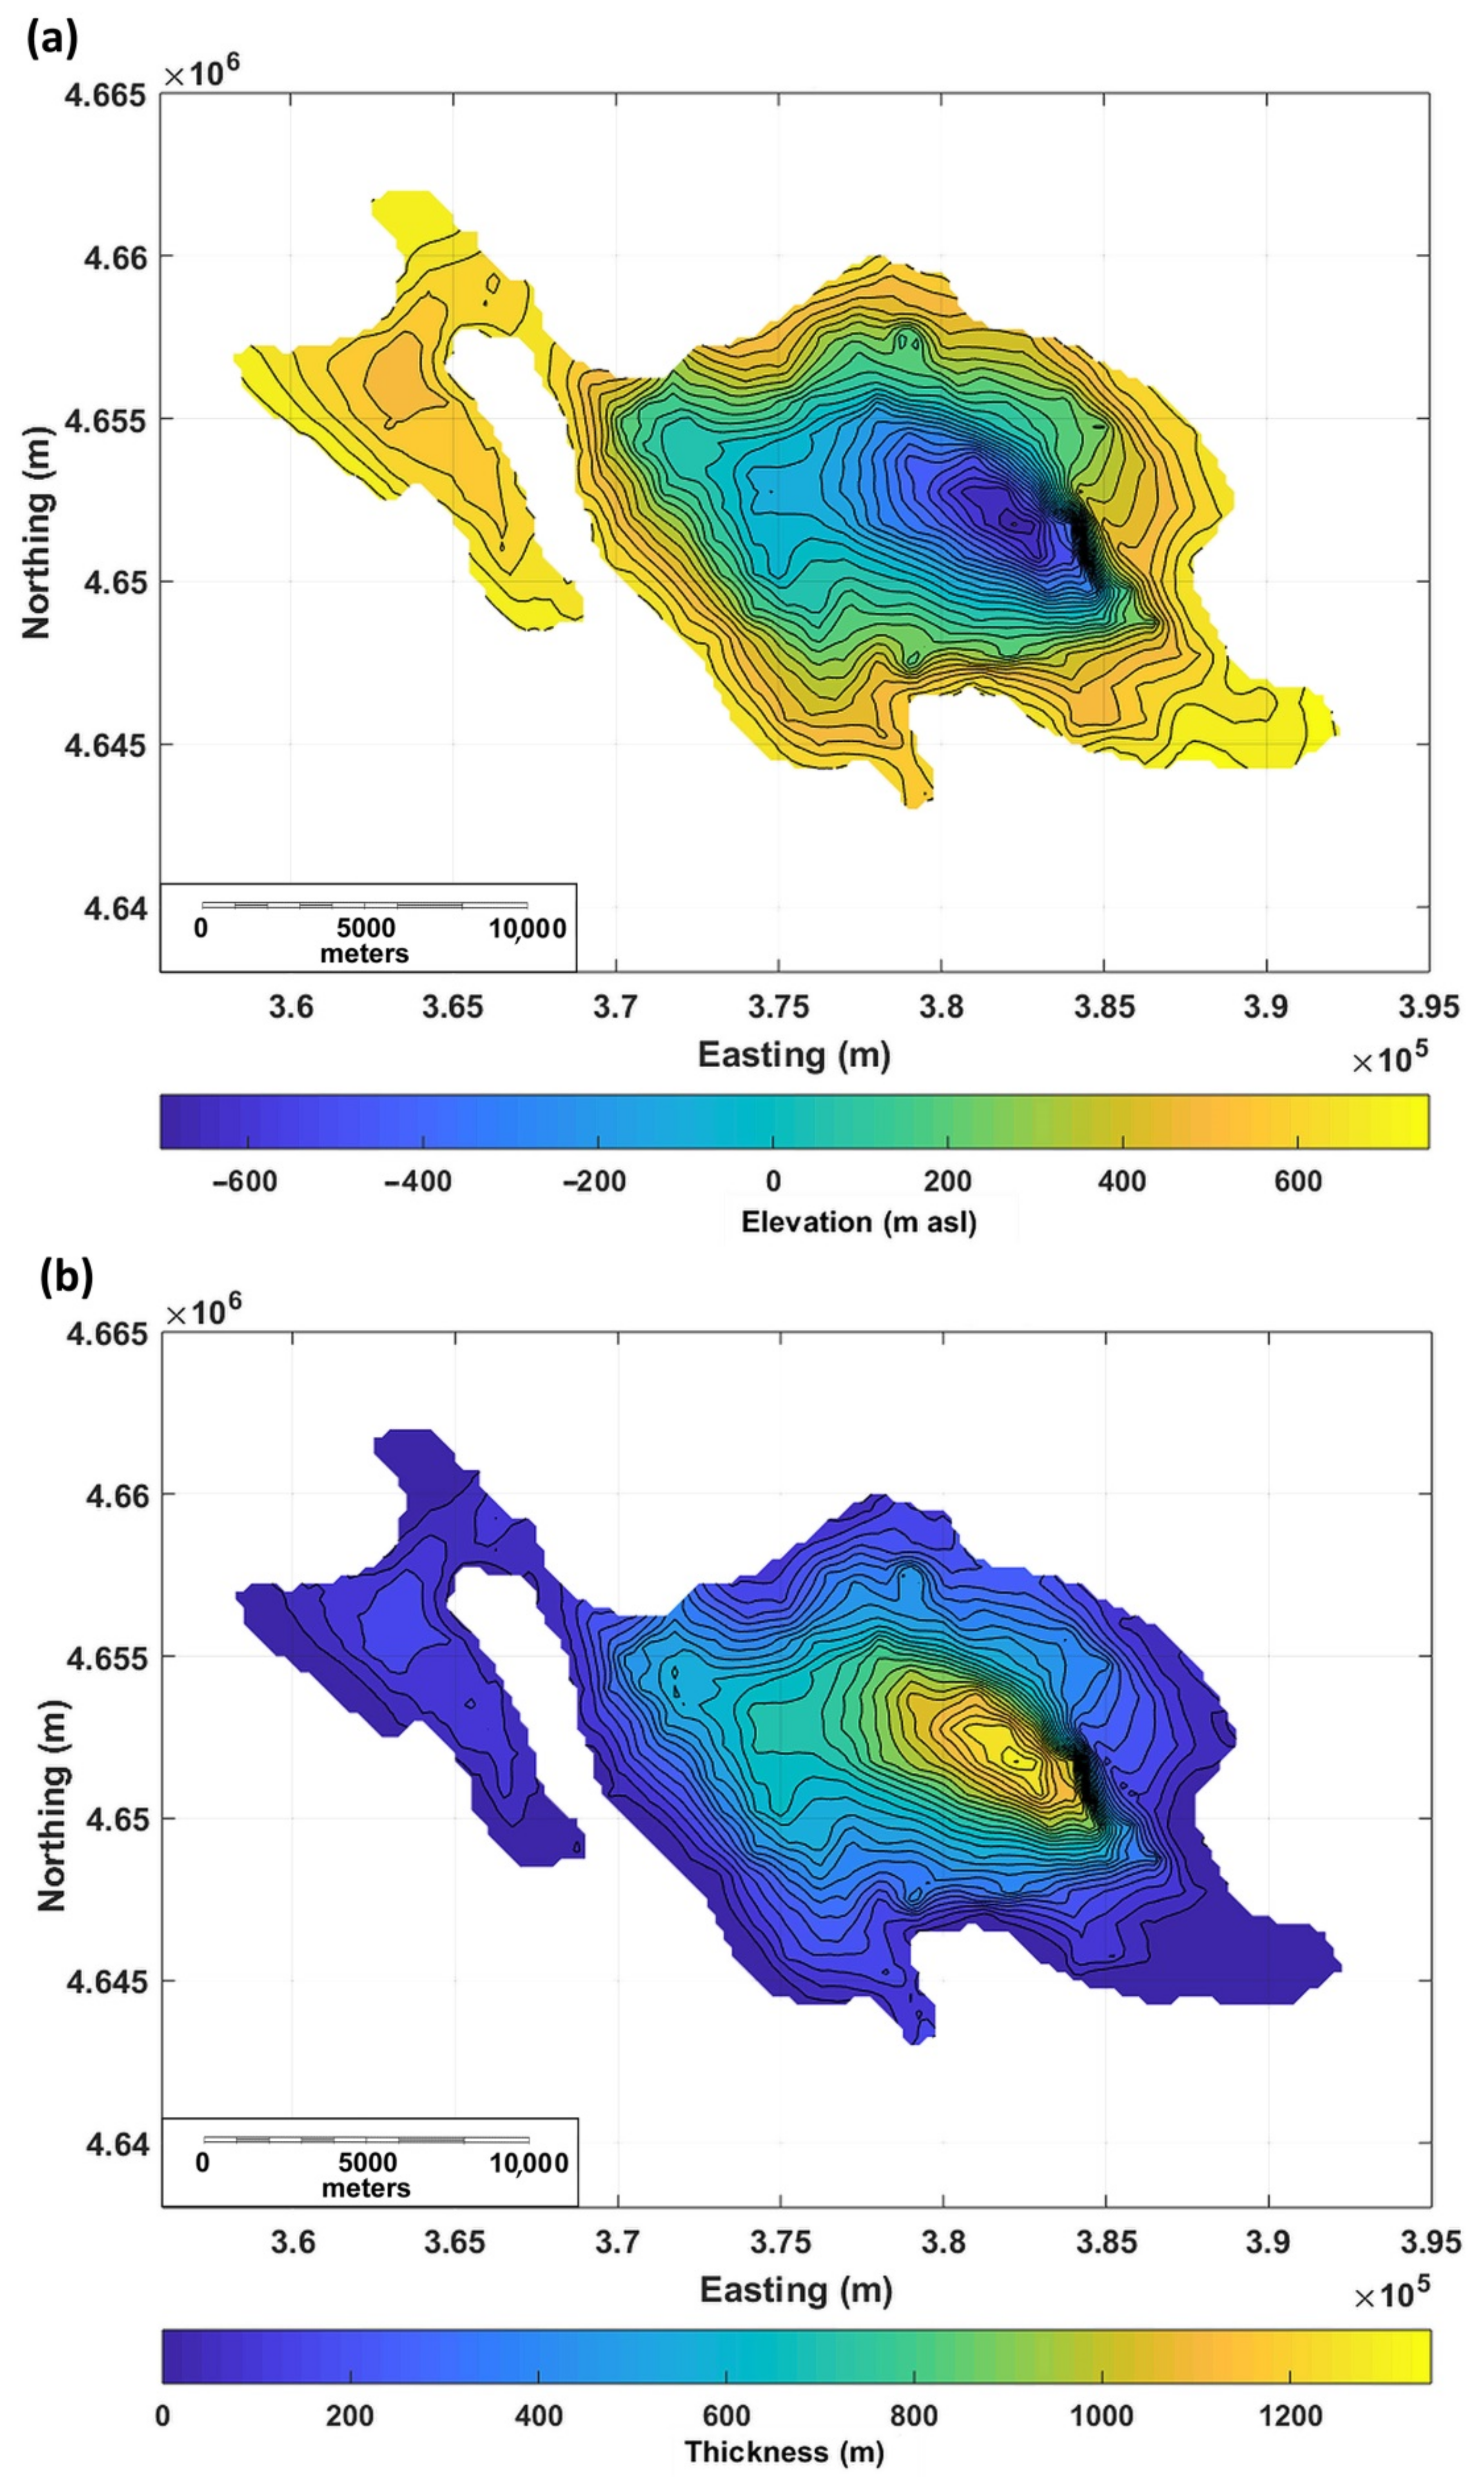
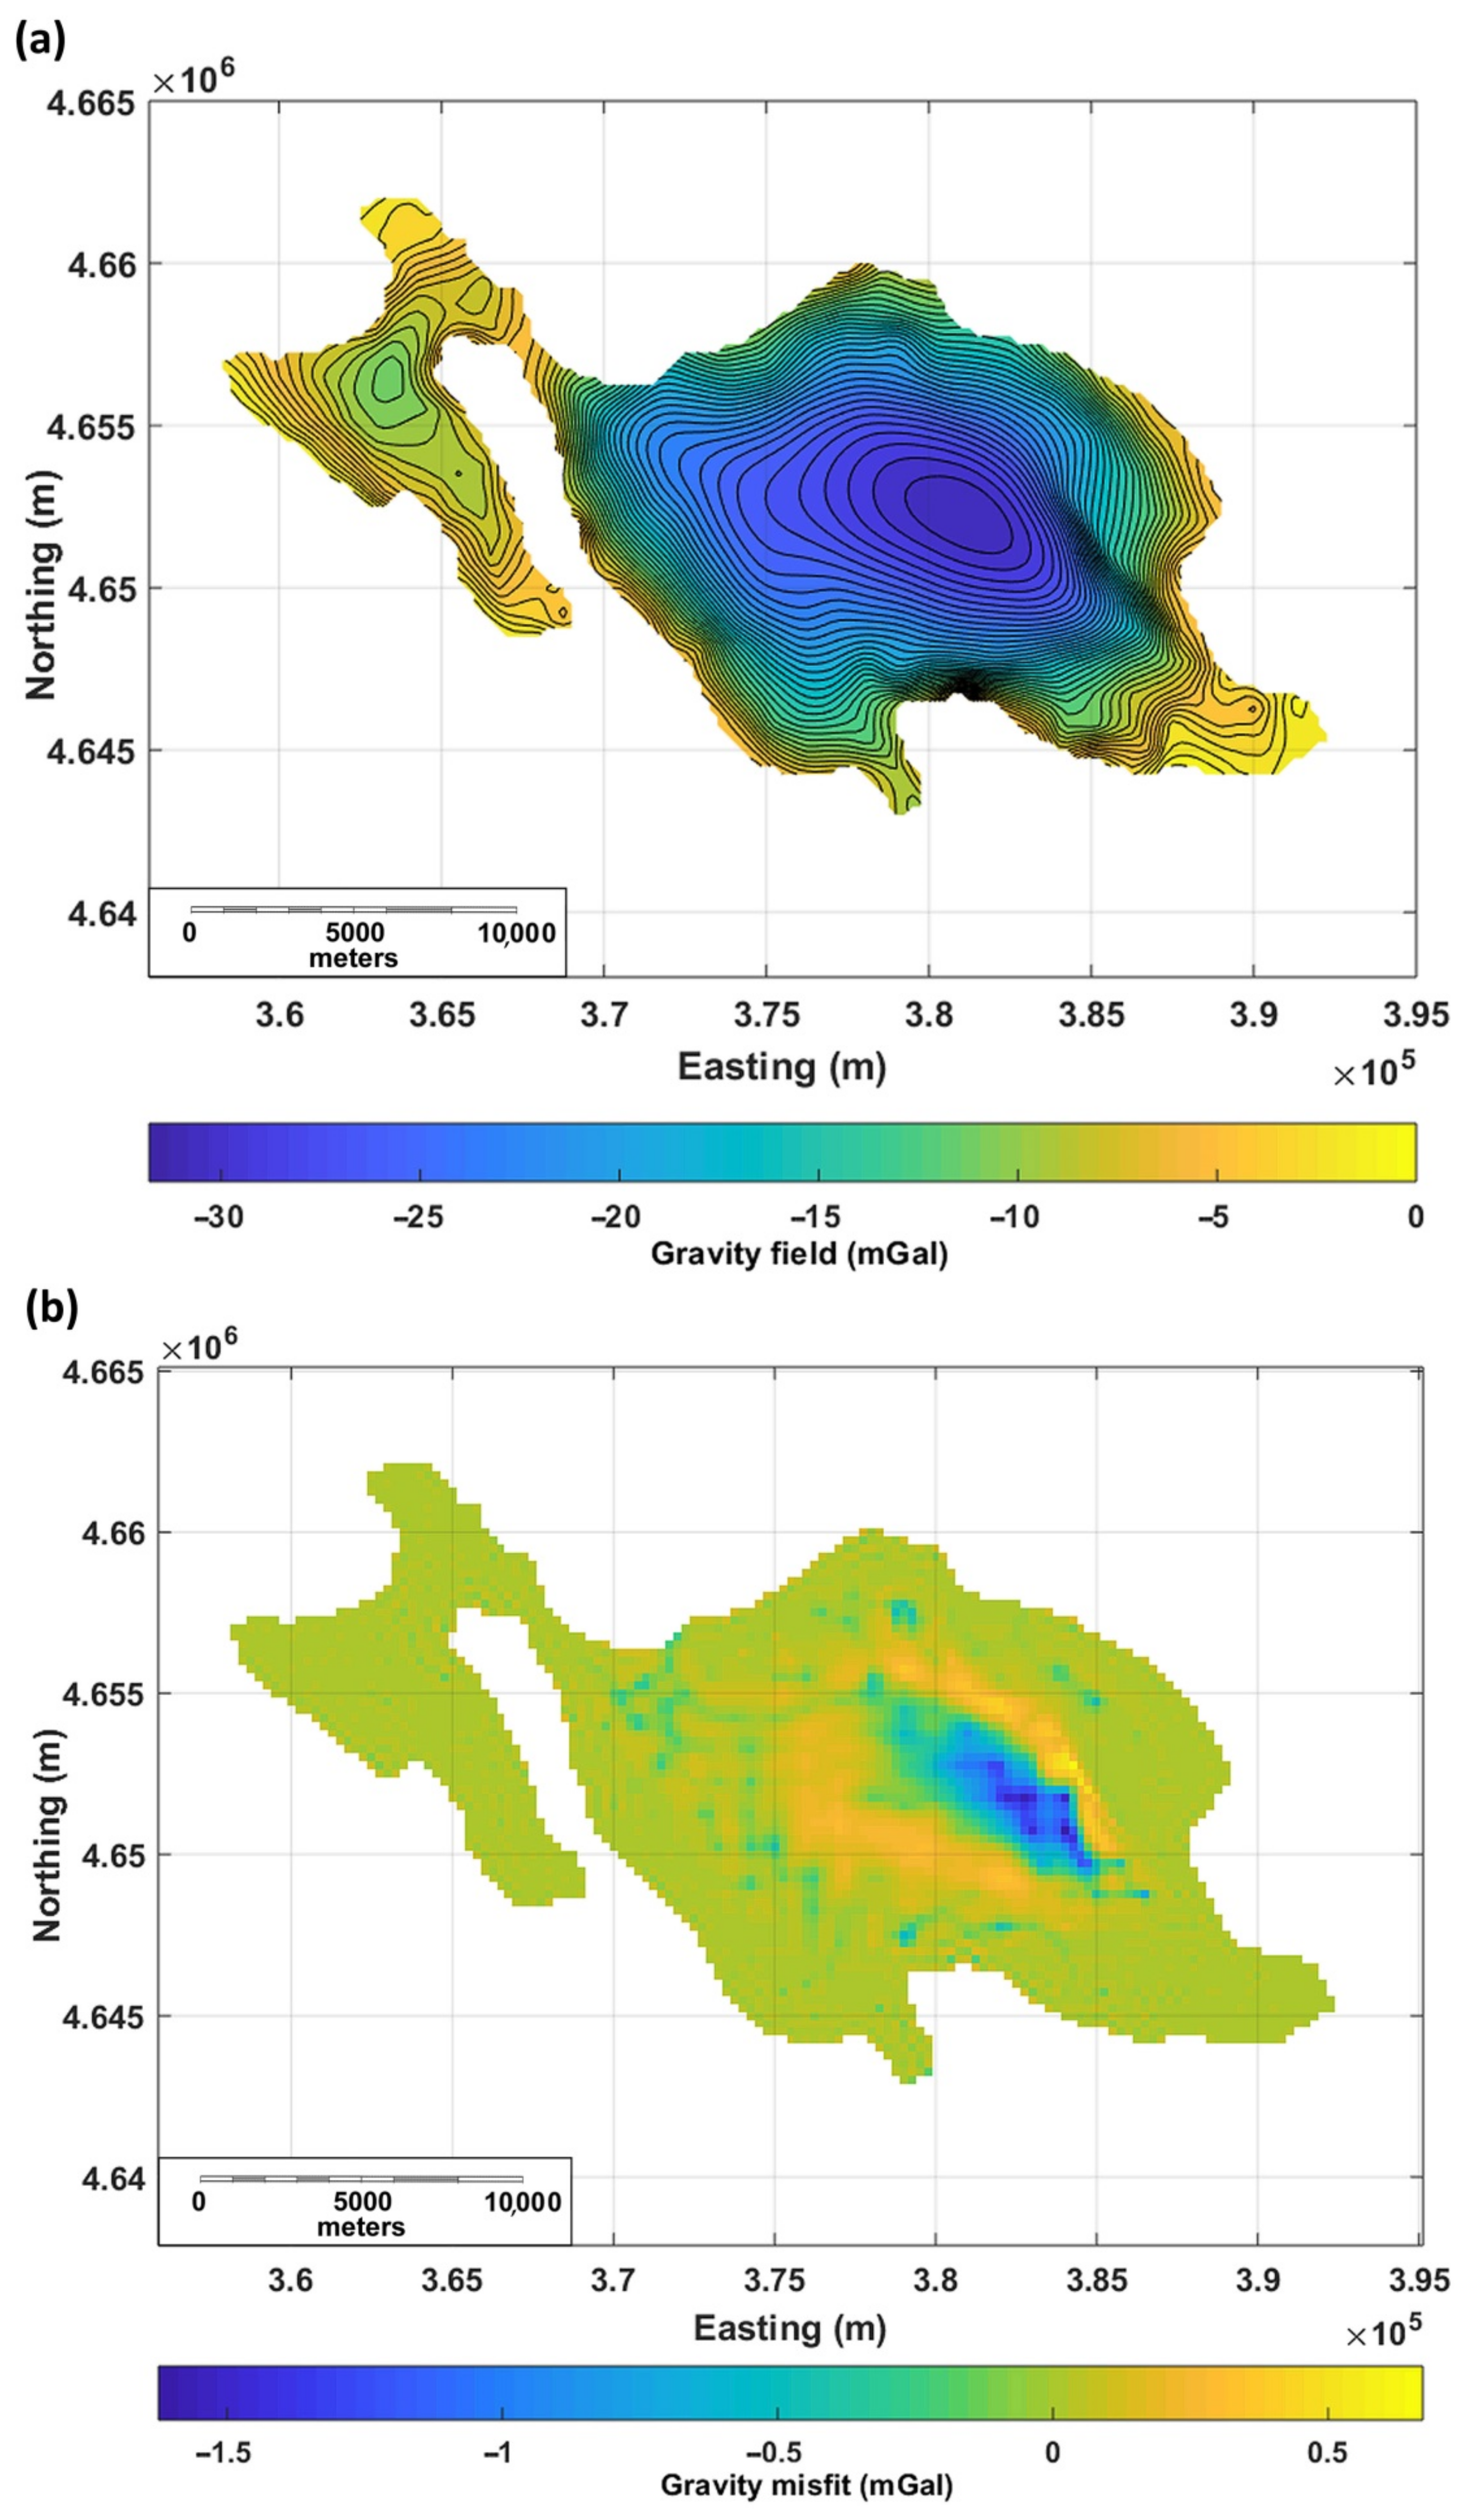
Using a step size of 10 m/mGal, after eight iterations, the process converges to a model (Figure 6) predicting a gravity field with an rms of the misfit of 0.2 mGal (Figure 7).
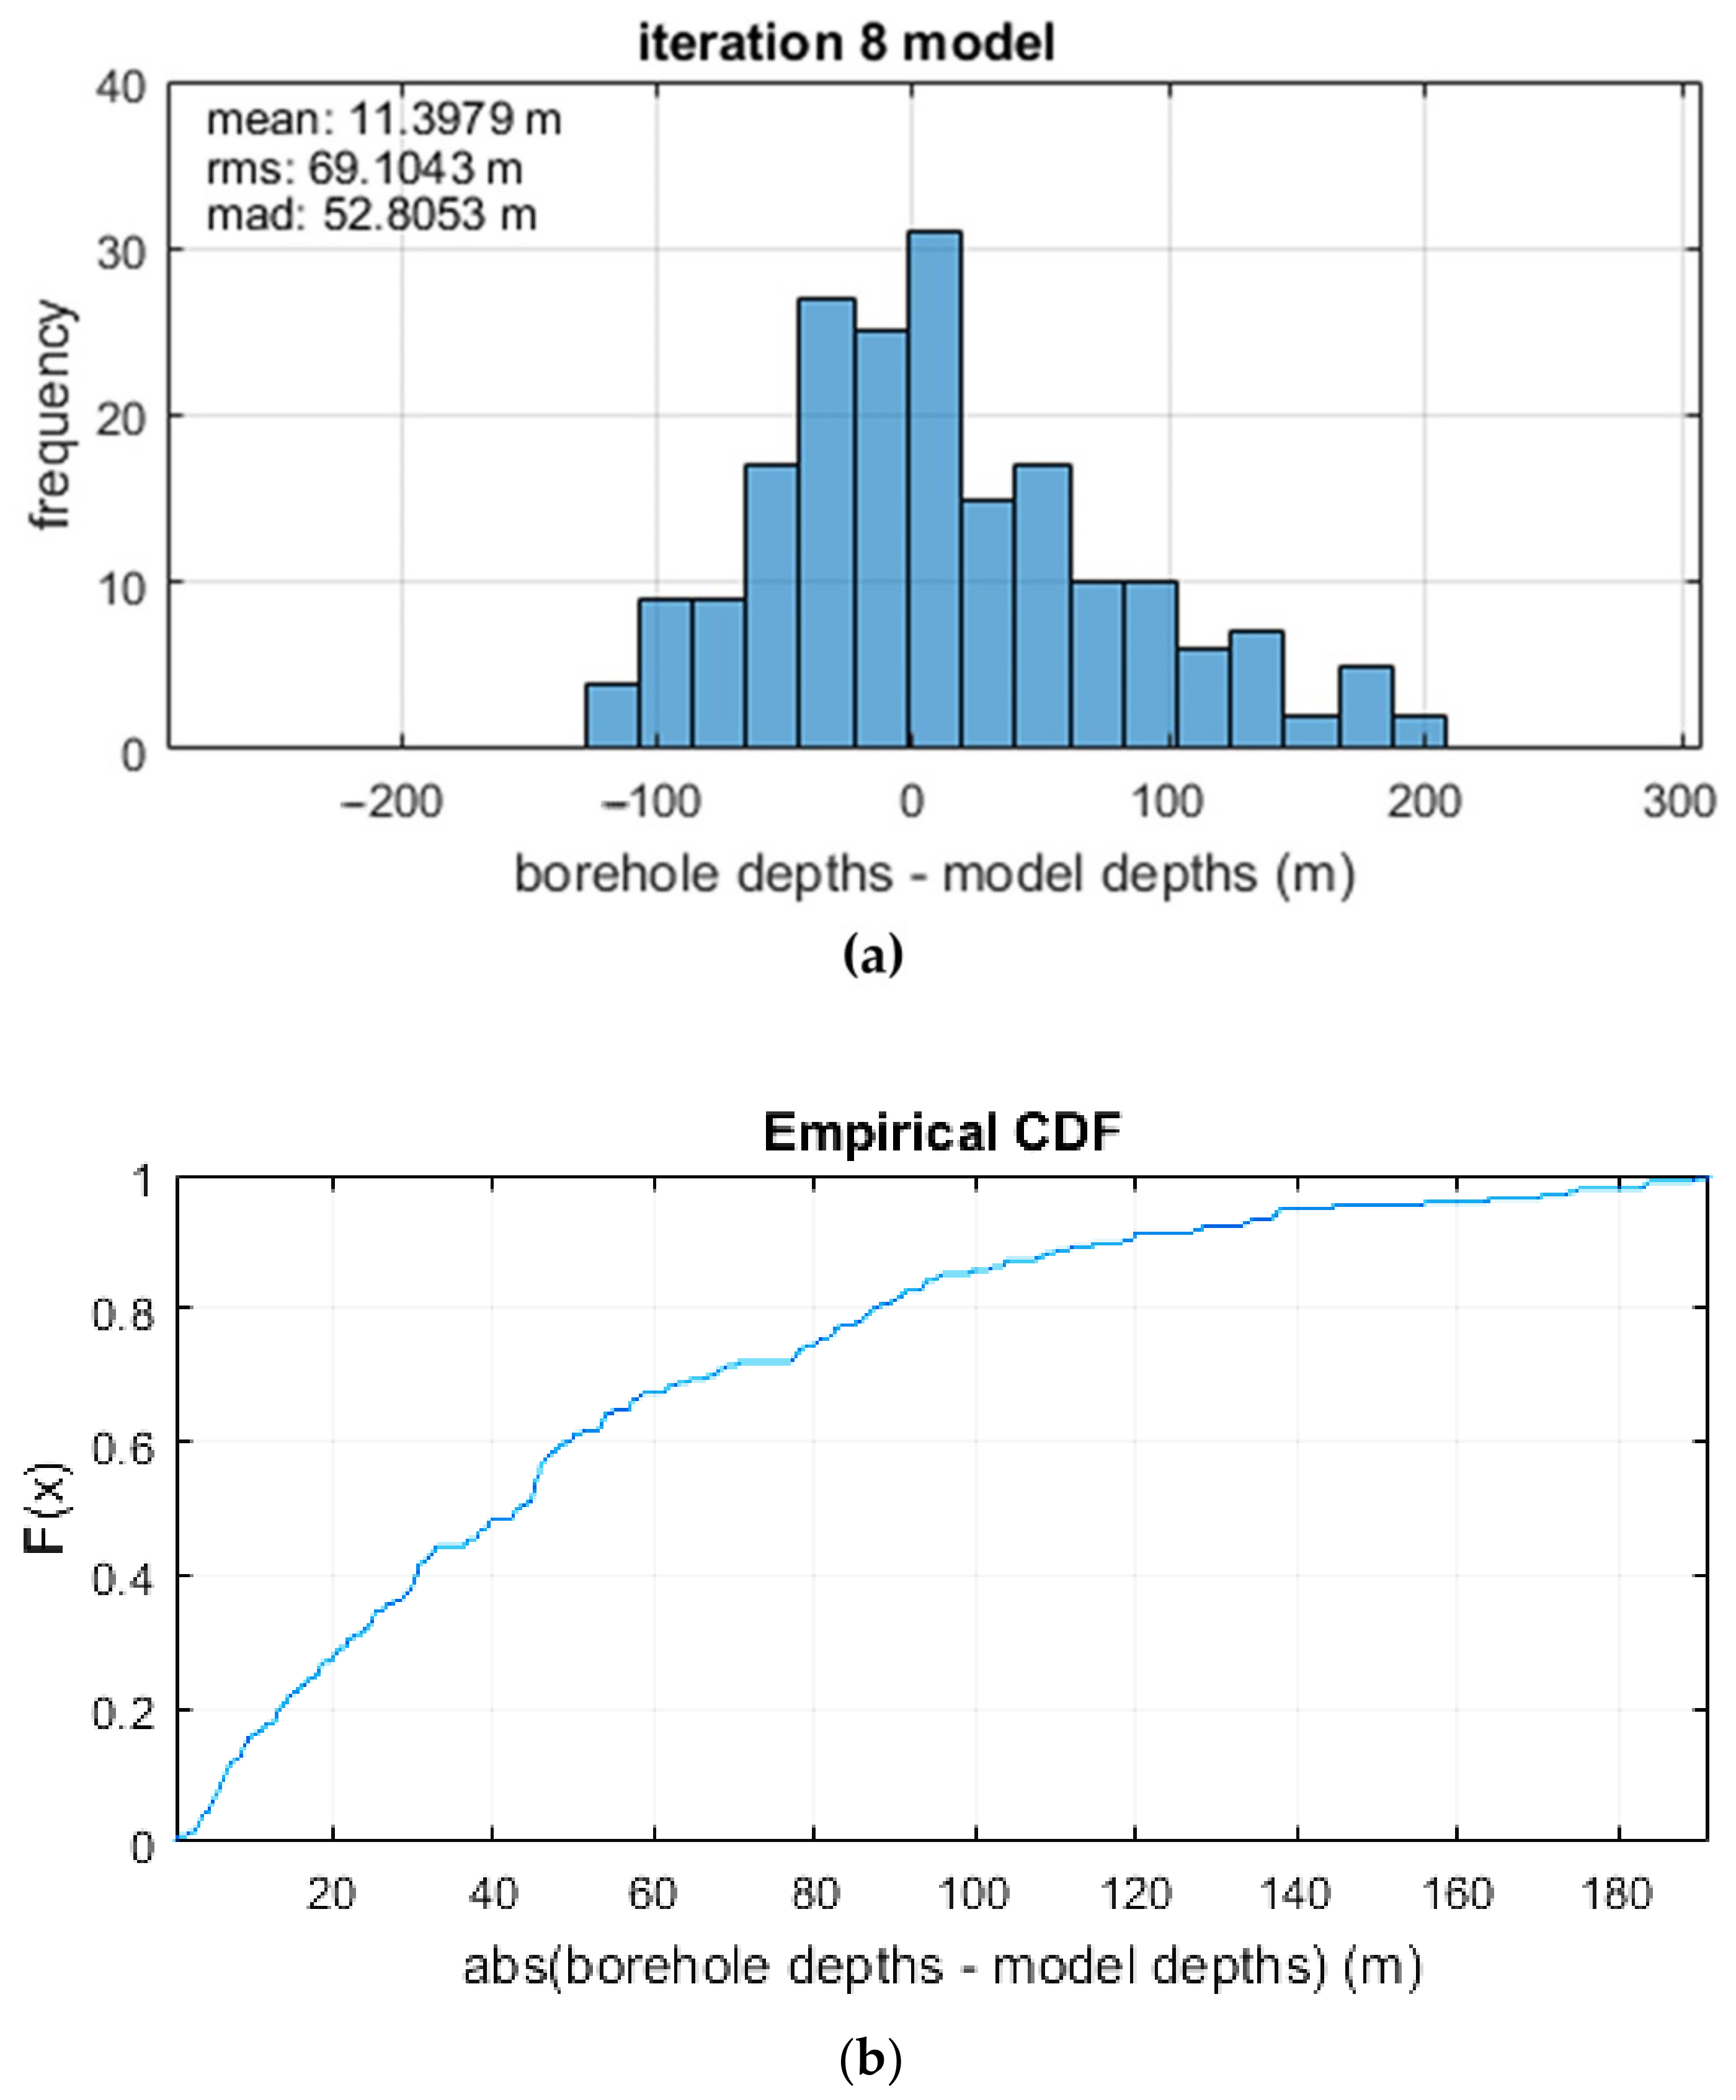
We can assess the reliability of the obtained basement model by computing the difference between the depth to constraints and the modelled basement depth at the same locations (Figure 8). The error ranges between −128 m and 191 m, with 80% of the control points having an error smaller than 87 m and with an average error of about 69 m.

6. Discussion

Our model in Figure 6 represents the first map of the depth to the carbonate bedrock in the Fucino plain. In fact, our modelling considered that the gravity anomalies are mainly produced by the undulation of the interface between the Meso-Cenozoic carbonate rocks and the overlying flysch and Plio-Quaternary sediments. In Section 5, we tested the possibility that the main density contrast be relative to the base of the Plio-Quaternary sediments, but we rejected this hypothesis based on the extremely high-density contrast that would be needed to fit the gravity anomalies.
Overall, the modeled basin is rhomboid-shaped, with two sides oriented as the Apennine main tectonic structures (NW-SE) and the other two oriented in a roughly W-E direction.
The model predicts the foundering of the carbonate bedrock down to about 1400 m in the central-eastern area, this depocenter being eastwardly shifted from the geographic basin center, and shifted about 2.5 km south-westward with respect to the Plio-Quaternary depocenter shown by [2]. A possible reason for such a displacement could be related to the tectonic evolution of the basin (e.g., a gradual north-eastward shift of the basin depocenter since the Late Miocene until the Plio-Pleistocene).
Patruno and Scisciani [10] produced a basin model based on the same seismic data used in our analysis. However, their interpretation of the seismic horizons is different from that proposed by previous studies and adopted in the present paper. In fact, the deepest reflector is interpreted as the base of the upper Pliocene sediments, instead of the top of the Meso-Cenozoic carbonatic sequence. Geometrically, in contrast with our model and previous interpretations, the model presents two depocenters. The southern one is in correspondence to a short-length fault having a very high throw, about 2 km west of the main San Benedetto fault. The northern one do not corresponds to any gravity low, so that it appears incompatible with the gravity data.
The gravity data misfit (Figure 7b) is evenly distributed across the area with 89% of the gravity grid having absolute errors lesser than 0.2 mGal and 97% lesser than 0.5 mGal. Higher errors are present in the central-eastern area, in correspondence with the main gravity low, where the misfit reach its maximum absolute value of about 1.6 mGal. This area is characterized by a rapid variation of the basement depth in correspondence with the main San Benedetto fault. Here, the gravity model shows that the basement is vertically displaced for more than 1100 m (Figure 6). Thus, near this basement dislocation, the amplitude and shape of the misfit may be an indicator of a model still too smooth. Florio [8] analyzed the gravity anomalies of a synthetic basement model (the “Bishop” model [54]) created to verify the performances of processing and modeling techniques of potential fields. This model contains numerous fault scarps with varying throws and orientations, analogous to basement fault structures within major sedimentary basins. In this case, an ITRESC model of the basin generated a gravity misfit pattern similar to that found for the Fucino gravity data, localized in correspondence to steep faults and associated to a recovered model smoother than the true basement.
An important assumption of the ITRESC method that may have some impact on the model reliability regards the lateral homogeneity of the basement and basin filling materials. While for the Plio-Quaternary sediments, the lateral homogeneity may turn out as an acceptable approximation, for the Cenozoic flysch (clay, marl and sand) formations, this may be a gross simplification of the geological truth. At the interface between the Cenozoic flysch formations and the Plio-Quaternary sediments a density contrast is expected, so that part of the gravity signal may be produced there, if this interface is not horizontal. This may represent a source of modelling error, as we interpreted the residual gravity as if it originated uniquely from the density contrast between the carbonate basement and overlying sediments. However, seismic reflection profiles (e.g., [5]) show that the thickness of the Cenozoic flysch formations tend to increase where the basement is deeper, so that their top surface tends to be sub-horizontal. This would significantly reduce the amplitude of the gravity signal generated by the lateral density contrast with the Plio-Quaternary sediments. In fact, a gravity anomaly arises from lateral density contrasts, absent in the case of horizontal layers with different densities. Thus, we can conclude that the assumption about the lateral homogeneity of the basin filling materials should not very strongly affect the overall result of the gravity modelling.
The modelling of the top of the Meso-Cenozoic carbonates is helpful for properly characterizing the behavior of the whole basin infill under seismic loading conditions. In this regard, available information about the mechanical properties of the Miocene terrigenous sediments in Apennine chain are still scarce and sometimes ambiguous as far as quantitative measurements and classification criteria are concerned. The European Standard Specifications [55] assign to the physical properties (i.e., vs,30, NSPT, and cu) of the flysch values closer to those of lithotypes representative of continental alluvial/lacustrine sediments (e.g., the Plio-Quaternary series infilling the Fucino Basin), rather than to those consisting in compact rocks (e.g., Meso-Cenozoic marine carbonate units).
Therefore, the terrigenous units, including alternate sands, marls, and clays forming the Miocene flysch units, could also play a crucial role for the determination of the ground-motion amplification and peak frequencies. Therefore, it is important to estimate the thickness of the entire non-rigid sediment series overlying the bedrock for outlining a reliable scenario of the Fucino Plain seismic hazard based on local site-response effects.
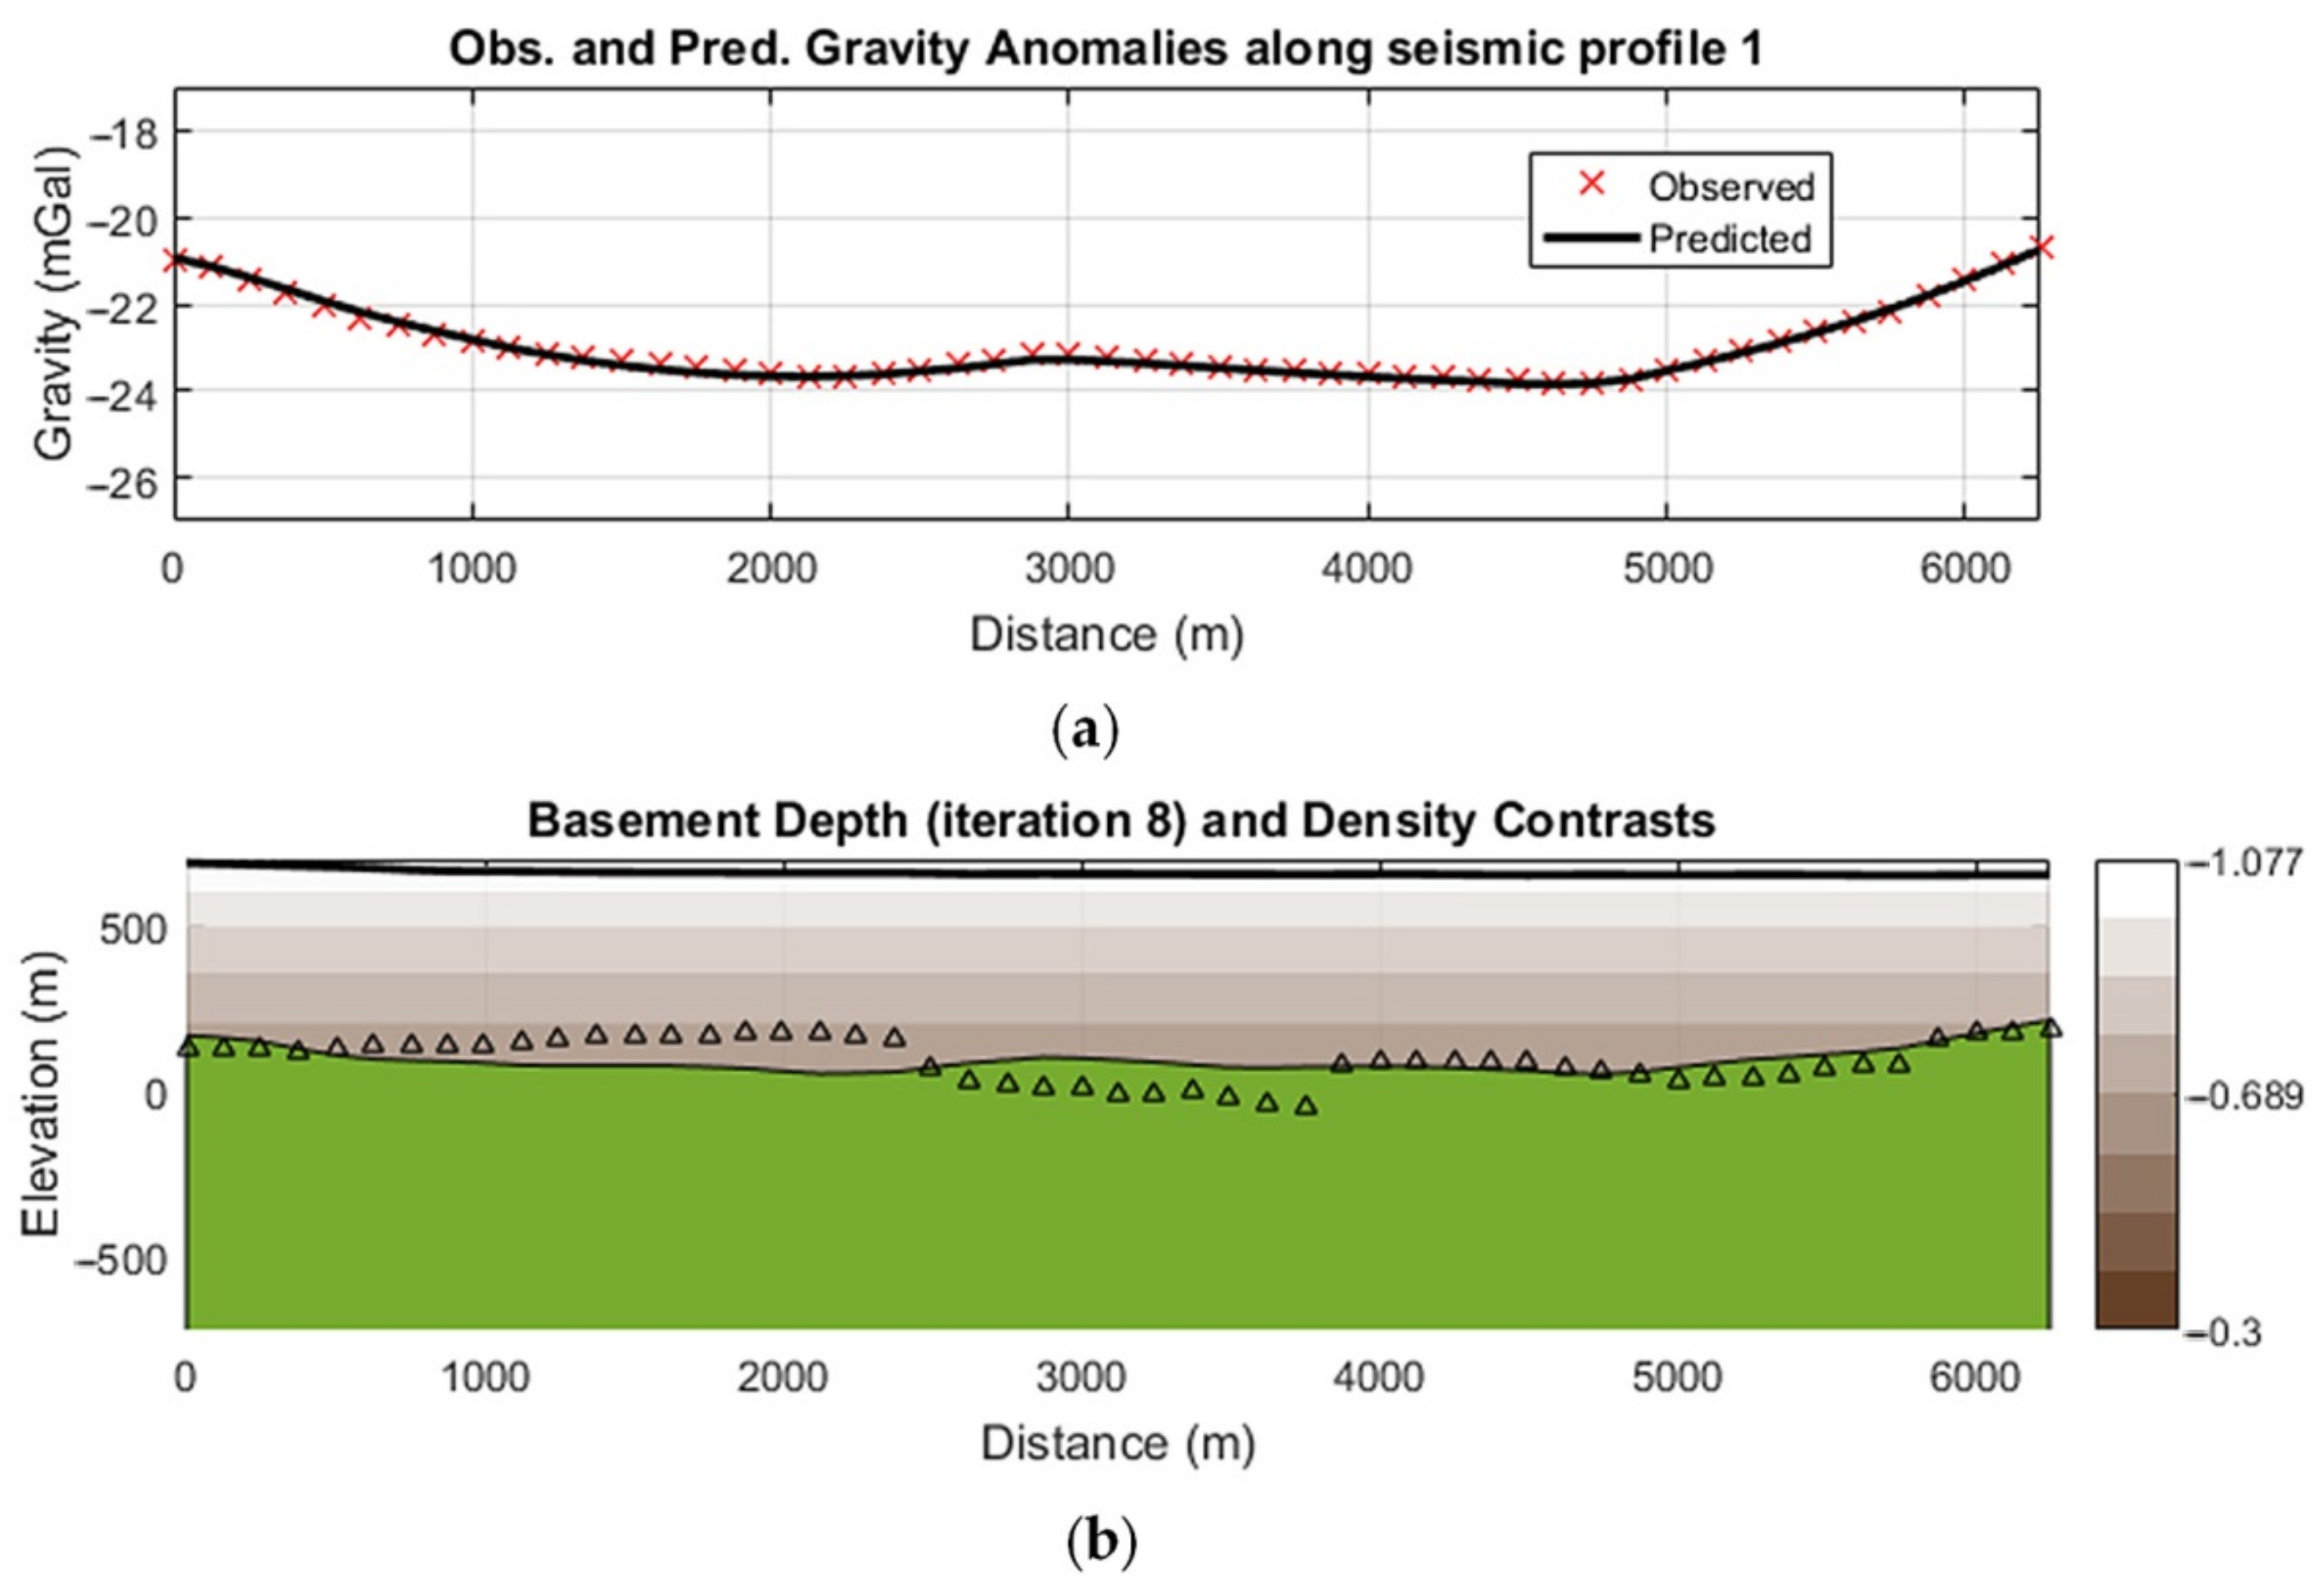
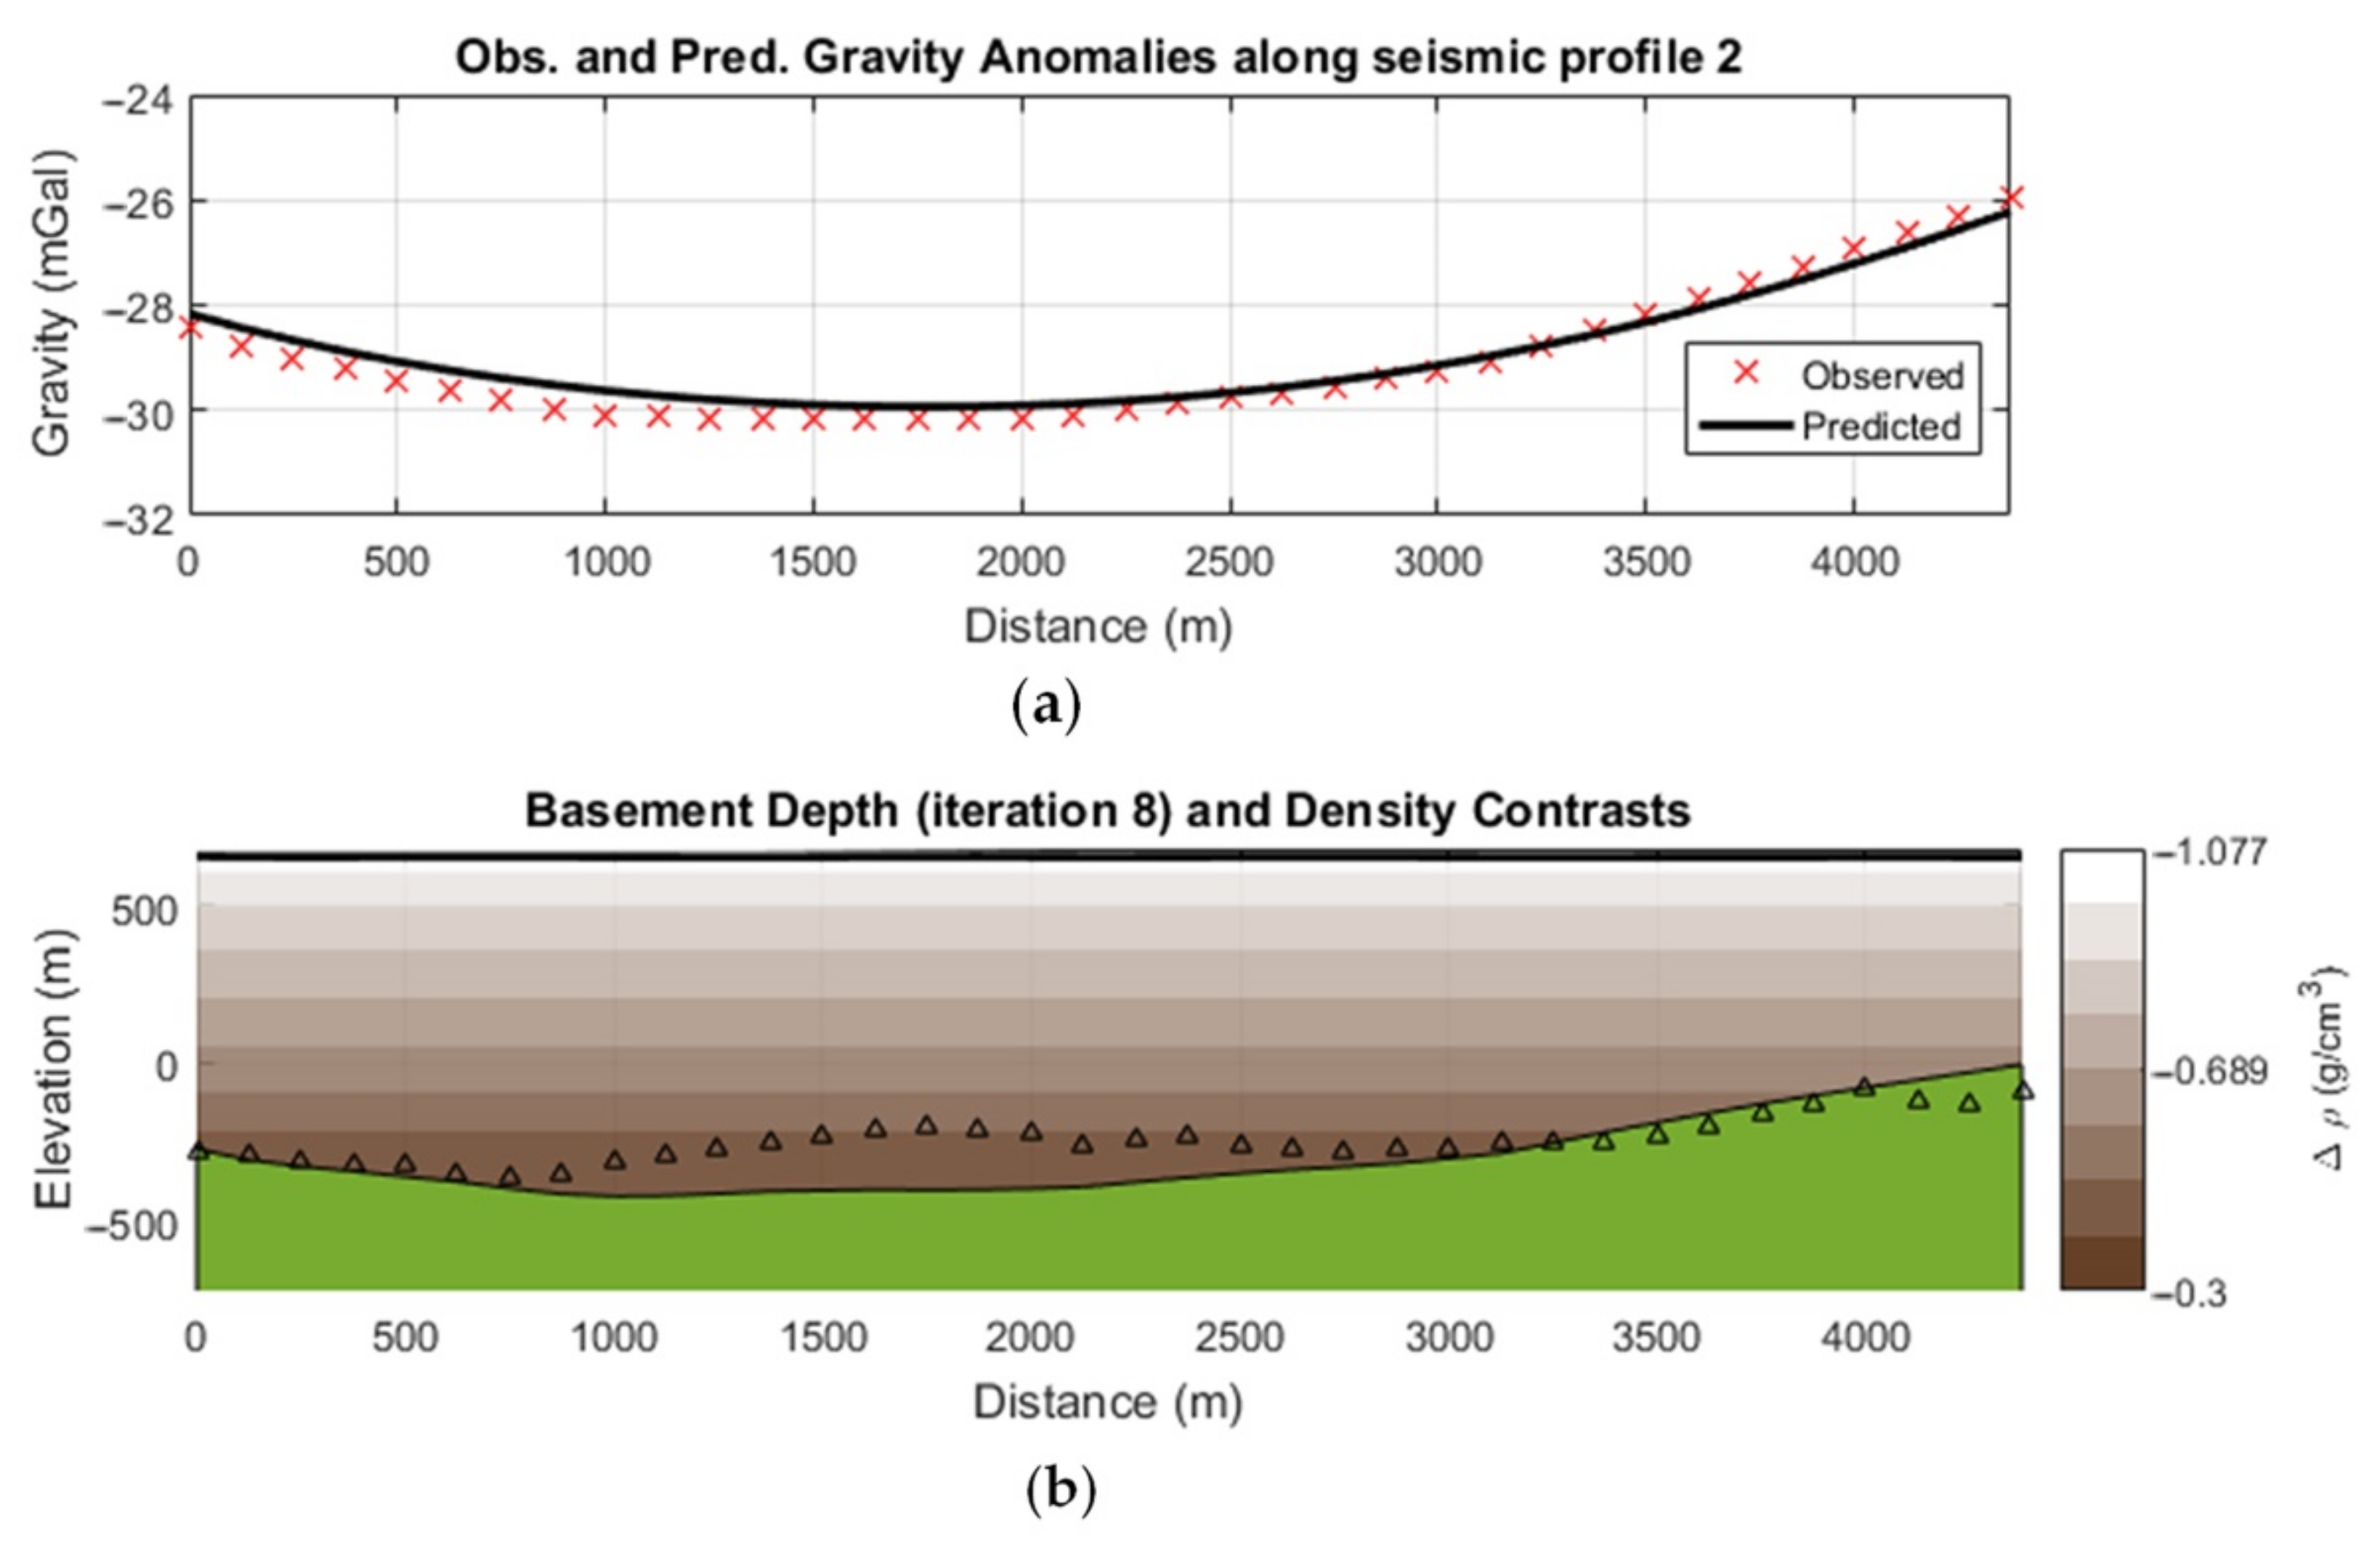
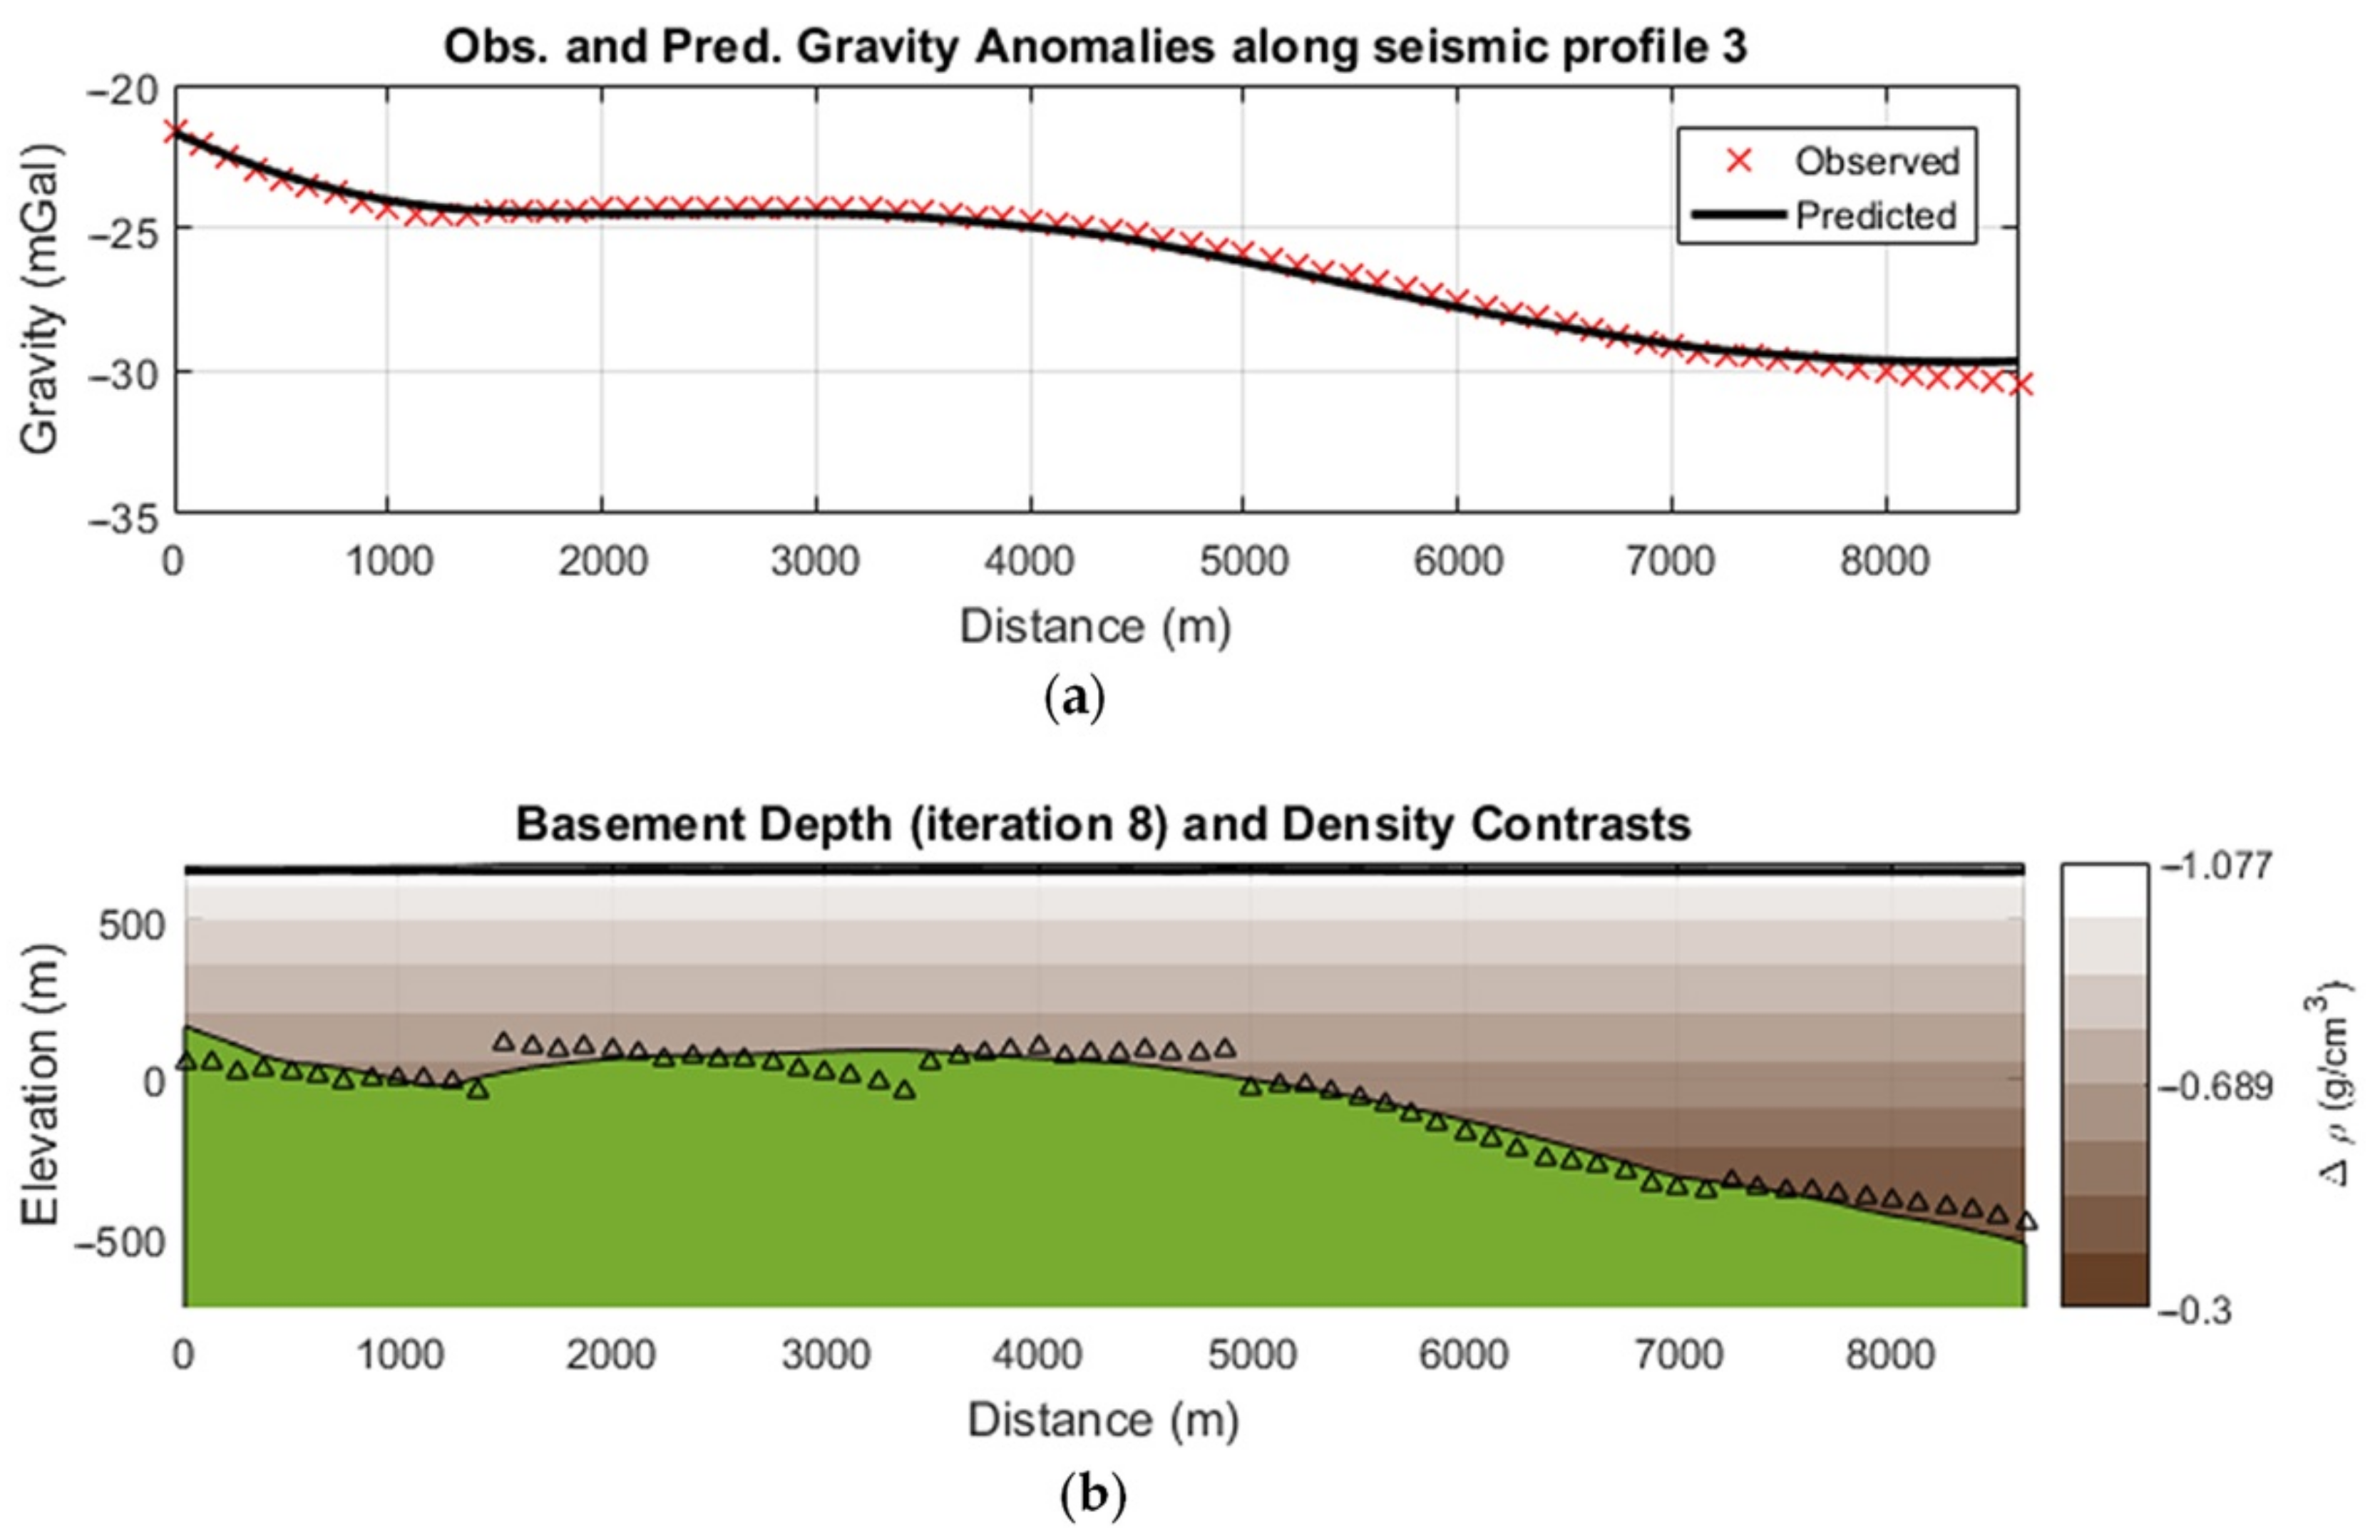
As mentioned above, a direct check of the quality of the ITRESC model of the basement can be made by comparing the depth to the seismic reflector interpreted as the top of the carbonate rocks, used as a constraint for the gravity modelling, and the modelled gravity basement along the same seismic profiles. This comparison (Figure 9, Figure 10 and Figure 11) shows an overall good agreement between the two surfaces, especially along the W-E trending profile (Profile 3 in Figure 2; Figure 11). Along this profile, the jumps seen in the seismic reflector in correspondence with fault scarps having offsets of about 100 m are smoothed out in the gravity model, which is in a very good agreement with the general trend of the seismic surface. A good general agreement is seen also along the westernmost N-S seismic profile (Profile 1 in Figure 2; Figure 9), although in its central part, in correspondence to a slight gravity high, the seismic reflector deepens as the effect of two normal faults. Thus, the resulting discrepancy between the gravity and seismic basement depths (about 100 m) derives directly from the different geophysical data rather than from modelling errors. The same could be said for the other N-S profile to the east of the Fucino Plain (Profile 2 in Figure 2; Figure 10). Here, the gravity and seismic basement depths are generally similar, but the seismic reflector becomes shallower in the central part of the profile in correspondence to a gravity low, causing a misfit of almost 200 m.
When assessing the error of the gravity model comparing it to depths derived from seismic interpretation, one should also consider that the seismic interpretation has its own associated error, which, unfortunately, is only rarely estimated. Sometimes, the reflector depth error, deriving from uncertainties in the estimated body-wave velocity, is quantified in about the 10% of the reflector depth ([56]).
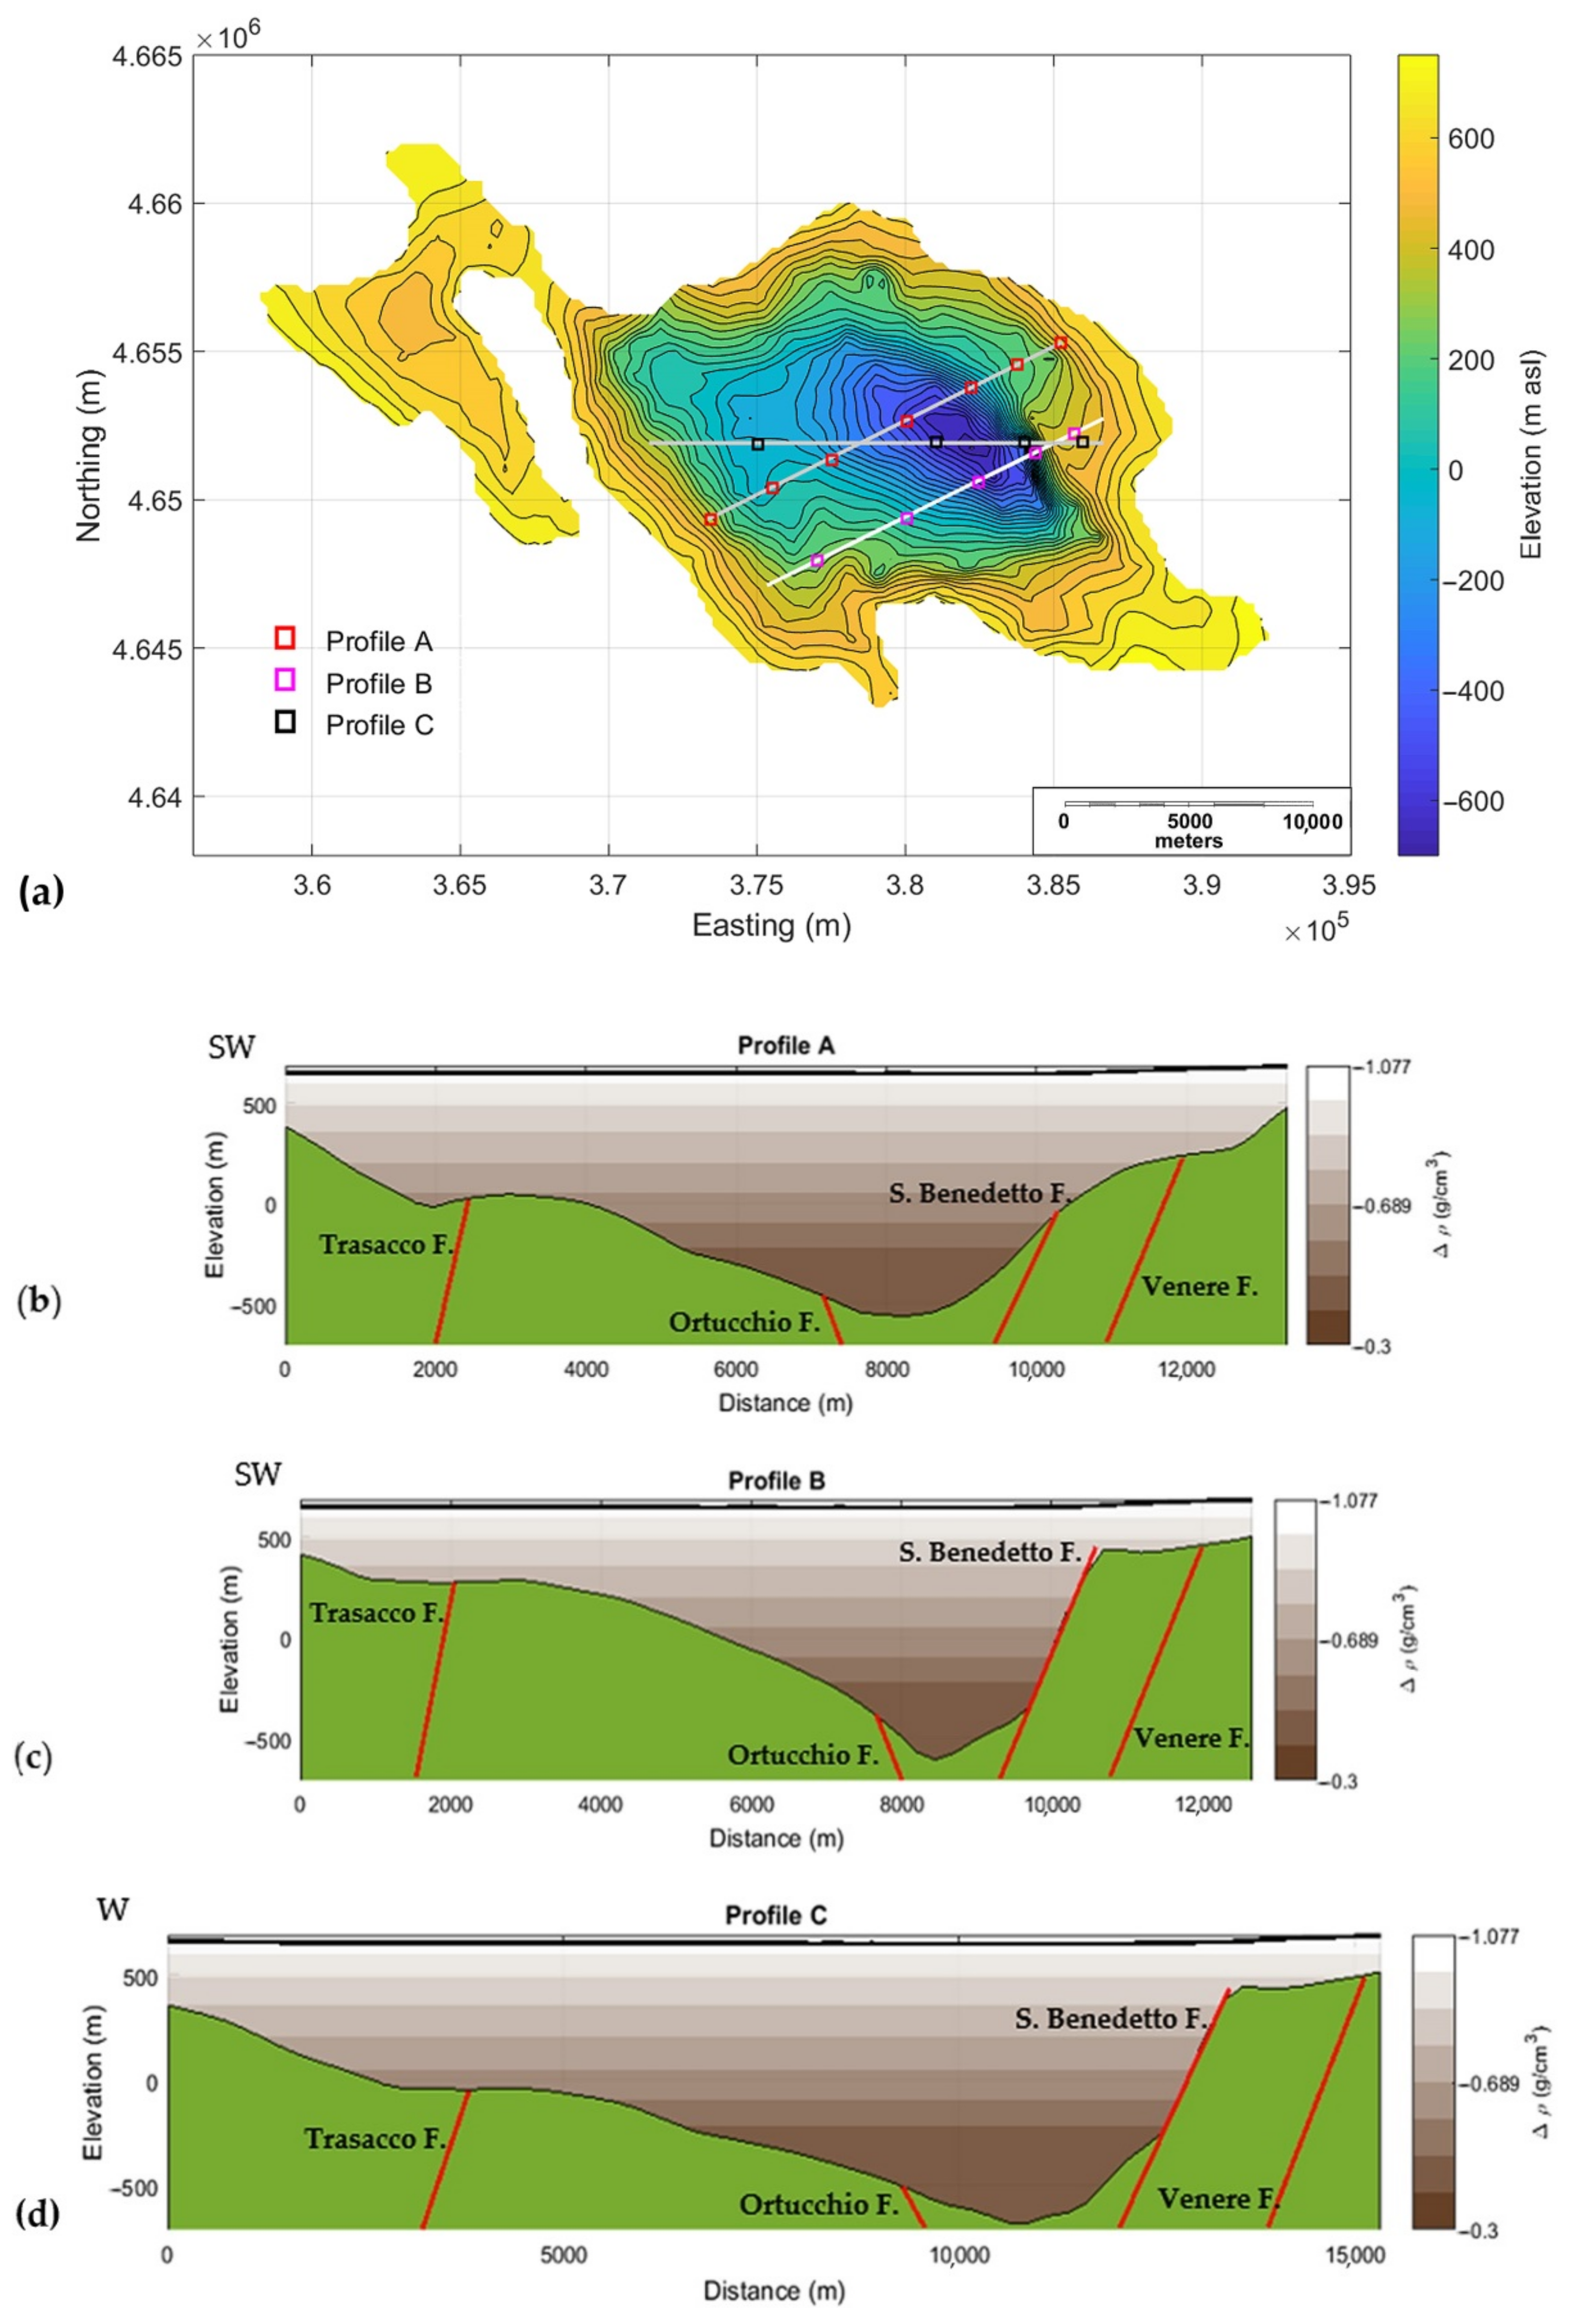
In order to describe in more detail, the carbonate basement morphology, we visualized the ITRESC basement model along three sections (Figure 12).
In Figure 12, the position of the main faults inferred from EHD trends is also shown in relation to the morphology of the modelled bedrock. As described in Section 5.2, the main faults crossing the Fucino Plain, recognized in some studies [2,8,9], are individuated by EHD with good precision. We point out that, in some cases, EHD also allows outlining tectonic lineaments where their presence on previous maps is uncertain (e.g., the northernmost portions of the Trasacco and Ortucchio Faults). Moreover, a structure not previously known is clearly associated to a maxima trend in the EHD map, NE of the San Benedetto fault, here referred to as Venere fault.
The EHD maxima are mostly related to morphological features of the bedrock shape retrieved by ITRESC modeling. In some cases (namely, in the presence of large fault throws), such features consist in straight, high-angle dipping segments of the bedrock profile, clearly indicating the position of fault scarps (e.g., San Benedetto fault). In other cases (e.g., when minor faults with smaller throw occur), the tectonic structure can be anyway inferred by the presence of some slope change in the bedrock profile as in the case of the Ortucchio antithetic fault and of the Trasacco fault.
The basement modeled by ITRESC shows the presence of a second, minor depocenter on the western side of the basin, also reported by [2]. It corresponds to a small downward displacement of the hanging wall occurring on the western side of the Trasacco fault. This fault extends outside the southern rim of the Fucino Plain, striking more than 15 km in the SSE direction and individuating a narrow valley. Given the small amplitude of the local gravity minimum related to this structural low, ITRESC modelling retrieved a relatively thin depocenter, limited within a depth range of only ~100 m.
The three sections in Figure 12 clearly show the overall asymmetry along the SW–NE direction of the bedrock shape modelled by ITRESC, thus confirming for the Fucino Basin the typical features of a half-graben as hypothesized by most studies.
Moreover, the hanging wall of the San Benedetto fault shows a bedrock with an eastward increasing dip angle, toward the depocenter, interpretable as a rollover anticline, a typical feature related to low-angle normal faults. This could support the hypothesis that the San Benedetto-Gioia dei Marsi tectonic line, driving the evolution of the Fucino half-graben, could be a listric fault, contrary to what has been assumed in some previous studies [57]. Consistent with this interpretation, the large parts of the cover sediments above the carbonate basement should be syntectonic deposits with increasing thickness towards the San Benedetto fault.
Finally, along the northern side of the basin, the ITRESC model and the EHD trends show, in partial agreement with previous studies ([2]), a certain complexity of the Tre Monti fault system individuating a minor basement high.
The outcome of our study is compatible with a half-graben model such as the simplified one shown in Figure 13.

7. Conclusions

Gravity data analysis can be very useful for the spatial reconstruction of the morphology of the bedrock and the tectonic setting of a region. In the Fucino basin case, 3D seismic models of the sedimentary body are based on detailed information of the depth to a reflector only along a few seismic lines. This implies that large areas of the model, far from seismic lines, can be reconstructed only by interpolation, thus resulting in poor detail. Gravity data, regularly distributed throughout the entire basin, can instead represent a valid constraint to build reliable 3D models, even in these areas.
We applied the ITRESC method for a 3D modelling of the basement and the EHD tool to horizontally locating lateral density contrasts in the Fucino basin. These approaches to the modelling of gravity data reduce to a minimum the a priori assumptions needed to counteract the interpretation ambiguity associated to this geophysical kind of data. The ITRESC method does not need assumptions about the density contrast, while other approaches must assume it with a consequent direct impact on the depth recovered. Instead, it integrates previous knowledge about the depth to the basement. In the case of the gravity modeling of the Fucino plain, these constraints consisted in a few shallow boreholes and in estimates of depth to the carbonate bedrock as obtained from an analysis of some seismic profiles.
Our results represent the first model of the depth to the carbonate bedrock for this area. They confirm the large foundering of the bedrock to almost 1400 m as the result of the action of the San Benedetto normal fault. The fact that this depocenter appears south-westward shifted from the Plio-Quaternary depocenter shown by [2] may highlight the effects of the tectonic evolution acting since the Late Miocene until the Plio-Pleistocene. Another minor depocenter is present on the western side of the basin, whose evolution seems to be linked to the action of the Trasacco fault.
We have provided additional constraints on the position of several faults, which were already known and mapped based on the local information obtained along the few seismic profiles available in the Fucino plain. In contrast, the areal distribution of gravity data allowed a continuous spatial positioning of these faults, which in some cases were recognized even over their known ends. Moreover, the analysis of the gravity data allowed the identification of a previously unknown fault (Venere fault).
Our model provides new information useful for tectonic and structural studies and represents base knowledge useful for seismic site characterization in an intermontane Apennine basin characterized by a high seismic hazard.

Author Contributions

Conceptualization, F.C., R.N., V.P. and G.F.; methodology, G.F.; software, F.C. and G.F.; validation, F.C. and G.F.; formal analysis, F.C. and G.F.; investigation, F.C., R.N., V.P. and G.F.; data curation, F.C.; writing—review and editing, F.C., R.N., V.P. and G.F. All authors have read and agreed to the published version of the manuscript.

Funding

This research received no external funding.

Institutional Review Board Statement

Not applicable.

Informed Consent Statement

Not applicable.

Data Availability Statement

Part of the data used in this study are publicly available: ViDEPI Project (https://www.videpi.com/videpi/videpi.asp). Images employed for the study will be available online for readers.

Aknowledgments

The authors thank the ViDEPI Project team for the useful geophysical data made available on the ViDEPI website.

Conflicts of Interest

The authors declare no conflict of interest.

Appendix A

Seismic velocities. Here, we discuss the most reliable seismic velocity values to be assigned for the time/depth conversion necessary for using seismic sections as constraints for the ITRESC modelling. Previous studies assumed a single Vp value of 1850 ms−1 [2] or of 2000 ms−1 [6,8] as representative for the whole sedimentary cover overlaying the top of the Meso-Cenozoic carbonate rocks. The problem is whether or not this value allows a reliable depth positioning of the reflective interfaces. In previous studies, different authors find variable Vp values for the sediments filling intermontane Apennine basins. Barchi and Ciaccio [7] consider Vp = 3500 ms−1 and Vp = 2000 ms−1 for pre-Pliocene terrigenous units and overlying continental sediments, respectively. Differently, other authors do not indicate single Vp value as representative of the whole Plio-Quaternaty units. Chiarabba et al. [59] indicate P-wave velocities ranging between 2000 and 3000 ms−1 for Plio-Quaternary basin filling sediments, and 3400 to 4000 ms−1 for syn-orogenic sedimentary and flysch (foredeep and thrust-top basins). A seismic tomography study carried out in an intermontane basin close the Fucino Plain (Mid Aterno Valley, [60]) indicated wide ranges for P-wave velocities (from 1000 to 3000 ms−1, with peaks of 3500 ms−1 for the deepest sediments). Finally, a more recent high-resolution seismic investigation [61] carried out on the 600 m thick Plio-Quaternary sequence in the same area confirmed the presence of many different seismic facies in this succession, with Vp varying from 1500 ms−1 to 2250 ms−1.
Time/Depth conversion. To perform an accurate time/depth conversion, we used the analysis of the velocity variation patterns reported for specific points along these seismic lines, which were used as input to obtain a velocity model by polynomial fitting of various degrees in x (distance along the line) and y (TWT—two-way time). Such a time/depth conversion procedure provides differences in terms of reflectors depth and geometry with respect to the simple assumption of a constant velocity value of Vp = 1850 ms−1 or 2000 ms−1 (as assumed in [2,6]). These depth differences can be as great as 200 m in the case of the reflector related to the top of the Meso-Cenozoic carbonates.
Density contrasts. Here, we discuss the most realistic density values to be assigned to the Mesozoic-Cenozoic carbonate units (namely, the bedrock) and to the overlying Plio-Quaternary alluvial/lacustrine sediments (namely, the basin infill) for a comparison with the density contrasts resulting from gravity modelling. In earlier studies, several authors assigned an average density of 2.3 g/cm3 to Plio-Quaternary sediments filling the intermontane valleys and the extensional basins along the Tyrrhenian side of the Apennine Chain [62,63,64,65]. However, more recent and detailed investigations support smaller values. D’Aringoli et al. [66] assign an average density of 2.1 g/cm3 to the fine-grained sedimentary cover of quaternary age, with a density as low as 1.5 g/cm3 for the shallowest peat deposits. The same authors confirm a density of 2.6 g/cm3 for the calcareous basement rocks, in agreement with literature data (e.g., [67]). Studies focused on intermontane basins close to the Fucino Plain (e.g., [68]) confirm densities ranging from 1.99 g/cm3 and 2.14 g/cm3 (average value: 2.07 g/cm3) for pleistocenic silts, sands, and clays. Finally, geotechnical analyses confirm densities ranging from 2.05 g/cm3 to 2.07 g/cm3 for Plio-Pleistocene palustrine and alluvial deposits of intermontane basins in Central Italy [69].

References

  1. Patacca, E.; Scandone, P. Geology of the Southern Apennines. Boll. Soc. Geol. Ital. 2007, 7, 75–112. [Google Scholar]
  2. Cavinato, G.P.; Carusi, C.; Dall’Asta, M.; Miccadei, E.; Piacentini, T. Sedimentary and tectonic evolution of Plio–Pleistocene alluvial and lacustrine deposits of Fucino Basin (central Italy). Sediment. Geol. 2002, 148, 29–59. [Google Scholar] [CrossRef]
  3. Finetti, I.R. CROP Project. In Deep Seismic Exploration of the Central Mediterranean and Italy, 1st ed.; Elsevier: Amsterdam, The Netherlands, 2005; Volume 1, p. 794. [Google Scholar]
  4. Patacca, E.; Scandone, P.; Di Luzio, E.; Cavinato, G.P.; Parotto, M. Structural architecture of the central Apennines: Interpretation of the CROP 11 seismic profile from the Adriatic coast to the orographic divide. Tectonics 2008, 27, TC3006. [Google Scholar] [CrossRef]
  5. Compagnia Mediterranea Idrocarburi, Permesso di Ricerca per Idrocarburi “Cerchio”. In Rapporto Interpretazione Sismica 1982 Riprocessata; 1999; p. 24. (In Italian)
  6. Cara, F.; Di Giulio, G.; Cavinato, G.P.; Famiani, D.; Milana, G. Seismic characterization and monitoring of Fucino Basin (Central Italy). Bull. Earthq. Eng. 2011, 9, 1961–1985. [Google Scholar] [CrossRef]
  7. Barchi, M.R.; Ciaccio, M.G. Seismic images of an extensional basin, generated at the hangingwall of a low-angle normal fault: The case of the Sansepolcro basin (Central Italy). Tectonophysics 2009, 479, 285–293. [Google Scholar] [CrossRef]
  8. Di Naccio, D.; Famiani, D.; Liberi, F.; Boncio, P.; Cara, F.; De Santis, A.; Di Giulio, G.; Galadini, F.; Milana, G.; Rosatelli, G.; et al. Site effects and widespread susceptibility to permanent coseismic deformation in the Avezzano town (Fucino basin, Central Italy): Constraints from detailed geological study. Eng. Geol. 2020, 270, 105583. [Google Scholar] [CrossRef]
  9. Lanari, R.; Faccenna, C.; Benedetti, L.; Sembroni, A.; Bellier, O.; Menichelli, I.; Primerano, P.; Molin, P. Formation and Persistence of Extensional Internally Drained Basins: The Case of the Fucino Basin (Central Apennines, Italy). Tectonics 2021, 40, e2020TC006442. [Google Scholar] [CrossRef]
  10. Patruno, S.; Scisciani, V. Testing normal fault growth models by seismic stratigraphic architecture: The case of the Pliocene-Quaternary Fucino Basin (Central Apennines, Italy). Basin Res. 2021, 33, 2118–2156. [Google Scholar] [CrossRef]
  11. Rovida, A.; Locati, M.; Camassi, R.; Lolli, B.; Gasperini, P. (Eds.) CPTI15, The 2015 Version of the Parametric Catalogue of Italian Earthquakes; Istituto Nazionale di Geofisica e Vulcanologia: Rome, Italy, 2016; Available online: http://emidius.mi.ingv.it/CPTI15-DBMI15/index_en.htm (accessed on 15 March 2021). [CrossRef]
  12. Florio, G. Mapping the Depth to Basement by Iterative Rescaling of Gravity or Magnetic Data. J. Geophys. Res. Solid Earth 2018, 123, 9101–9120. [Google Scholar] [CrossRef]
  13. Florio, G. The Estimation of Depth to Basement under Sedimentary Basins from Gravity Data: Review of Approaches and the ITRESC Method, with an Application to the Yucca Flat Basin (Nevada). Surv. Geophys. 2020, 41, 935–961. [Google Scholar] [CrossRef]
  14. Compagnoni, B.; Galluzzo, F.; Bonomo, R.; Capotorti, F.; D’Ambrogi, C.; Di Stefano, R.; Graziano, R.; Martarelli, L.; Pampaloni, M.L.; Pantaloni, M.; et al. Carta Geologica d’Italia, 1:1.000.000 Servizio Geologico d’Italia; ISPRA, SELCA: Firenze, Italy, 2011. (In Italian) [Google Scholar]
  15. Centamore, E.; Crescenti, U.; Dramis, F. Note Illustrative della Carta Geologica d’Italia alla Scala 1:50.000, Foglio 368 “Avezzano”; APAT—Servizio Geologico d’Italia e Regione Abruzzo—Servizio Difesa del Suolo, S.EL.CA.: Firenze, Italy, 2006. (In Italian) [Google Scholar]
  16. Galadini, F.; Messina, P. Plio–Quaternary tectonics of the Fucino basin and surroundings areas (central Italy). G. Geol. 1994, 56, 73–99. [Google Scholar]
  17. Ghisetti, F.; Vezzani, L. Interfering paths of deformation and development of arcs in the fold-and-thrust belt of central Apennines (Italy). Tectonics 1997, 16, 523–536. [Google Scholar] [CrossRef]
  18. Giraudi, C. Evoluzione geologica della piana del Fucino (Abruzzo) negli ultimi 30.000 anni. Il. Quaternario 1988, 1, 131–159. (In Italian) [Google Scholar]
  19. Boncio, P.; Milana, G.; Cara, F.; Di Giulio, G.; Di Naccio, D.; Famiani, D.; Liberi, F.; Galadini, F.; Rosatelli, G.; Vassallo, M. Shallow subsurface geology and seismic microzonation in a deep continental basin. The Avezzano Town, Fucino basin (central Italy). Nat. Hazards Earth Syst. Sci. Discuss. 2016, 1–27. [Google Scholar] [CrossRef] [Green Version]
  20. Oddone, E. Gli elementi fisici del grande terremoto Marsicano-Fucense del 13 gennaio 1915. Boll. Soc. Sismol. Ital. 1915, 19, 71–291. (In Italian) [Google Scholar]
  21. Serva, L.; Blumetti, A.M.; Michetti, A.M. Gli Effetti Sul Terreno Del Terremoto Del Fucino (13 Gennaio 1915); Tentativo di Interpretazione dell’evoluzione Tettonica Recente di Alcune Strutture. Mem. Soc. Geol. It. 1988, 35, 893–907. (In Italian) [Google Scholar]
  22. Galadini, F.; Galli, P.; Giraudi, C.; Molin, D. Il terremoto del 1915 e la sismicità della Piana del Fucino (Italia centrale). Ital. J. Geosci. 1995, 114, 635–663. (In Italian) [Google Scholar]
  23. Michetti, A.M.; Brunamonte, F.; Serva, L.; Vittori, E. Trench investigations of the 1915 Fucino earthquake fault scarps (Abruzzo, Central Italy): Geological evidence of large historical events. J. Geophys. Res. 1996, 101, 5921–5936. [Google Scholar] [CrossRef]
  24. Galadini, F.; Galli, P.; Giraudi, C. Geological investigations of Italian earthquakes: New paleoseismological data from the fucino plain (Central Italy). J. Geodyn. 1997, 24, 87–103. [Google Scholar] [CrossRef]
  25. Galadini, F.; Galli, P. The Holocene paleoearthquakes on the 1915 Avezzano earthquake faults (central Italy): Implications for active tectonics in the central Apennines. Tectonophysics 1999, 308, 143–170. [Google Scholar] [CrossRef]
  26. Galli, P.; Messina, P.; Giaccio, B.; Peronace, E.; Quadrio, B. Early Pleistocene to late Holocene activity of the Magnola fault (Fucino fault system, central Italy). Boll. Geofis. Teor. Ed. Appl. 2012, 53. [Google Scholar] [CrossRef]
  27. ISIDeWorking Group INGV. Italian Seismological Instrumental and Parametric Database. 2021. Available online: http://terremoti.ingv.it/ (accessed on 9 September 2021).
  28. Geological Map of Italy, Avezzano, Sheet 368. Available online: https://www.isprambiente.gov.it/Media/carg/368_AVEZZANO/Foglio.html (accessed on 9 September 2021).
  29. Tiberti, M.M.; Orlando, L. 2D gravity modeling along the CROP11 seismic profile, Boll. Geofis. Teor. Appl. 2006, 47, 447–454. [Google Scholar]
  30. Di Luzio, E.; Mele, G.; Tiberti, M.M.; Cavinato, G.P.; Parotto, M. Moho deepening and shallow upper crustal delamination beneath the central Apennines. Earth Planet. Sci. Lett. 2009, 280, 1–12. [Google Scholar] [CrossRef]
  31. Carrozzo, M.T.; Chirenti, A.; Luzio, D.; Margiotta, C.; Quarta, T. Carta gravimetrica d’Italia. In Acts of 5 Congress GNGTS; CNR: Rome, Italy, 1986; Volume 2, pp. 913–918. [Google Scholar]
  32. Vanicek, P.; Krakiwsky, E. Geodesy: The Concepts; North-Holland Publishing: Amsterdam, The Netherlands, 1982. [Google Scholar]
  33. Agocs, W.B. Least Squares Residual Anomaly Determination. Geophysics 1951, 16, 686–696. [Google Scholar] [CrossRef]
  34. Dobrin, M.B.; Savit, C.H. Introduction to Geophysical Prospecting; McGraw-Hill: New York, NY, USA, 1960; Volume 4. [Google Scholar]
  35. Mickus, K.L.; Aiken, C.L.V.; Kennedy, W.D. Regional-Residual Gravity Anomaly Separation Using the Minimum-Curvature Technique. Geophysics 1991, 56, 279–283. [Google Scholar] [CrossRef]
  36. Fedi, M.; Cella, F.; Florio, G.; Rapolla, A. Multiscale Derivative Analysis of the Gravity and Magnetic Fields of the Southern Apennines (Italy). In CROP PROJECT: Deep Seismic Exploration of the Central Mediterranean and Italy; Finetti, R.I., Ed.; Elsevier: Amsterdam, The Netherlands, 2005; pp. 281–318. [Google Scholar]
  37. Fedi, M.; Florio, G. Detection of Potential fields source boundaries by Enhanced Horizontal Derivative method. Geophys. Prospect. 2001, 49, 40–58. [Google Scholar] [CrossRef]
  38. Cella, F.; Fedi, M.; Florio, G. Toward a full multiscale approach to interpret potential fields. Geophys. Prospect. 2009, 57, 543–557. [Google Scholar] [CrossRef]
  39. Luiso, P.; Paoletti, V.; Nappi, R.; Manna, M.; Cella, F.; Gaudiosi, G.; Fedi, M.; Iorio, M. A multidisciplinary approach to characterize the geometry of active faults: The example of Mt. Massico, Southern Italy. Geophys. J. Int. 2018, 213, 1673–1681. [Google Scholar] [CrossRef]
  40. Luiso, P.; Paoletti, V.; Gaudiosi, G.; Nappi, R.; Cella, F.; Fedi, M. Testing the value of a multi-scale gravimetric analysis in characterizing active fault geometry at hypocentral depths: The 2016-2017 Central Italy seismic sequence. Ann. Geophys. 2018, 61, DA558. [Google Scholar] [CrossRef]
  41. Fedi, M. Estimation of Density, Magnetization, and Depth to Source: A Nonlinear and Noniterative 3-D Potential-Field Method. Geophysics 1997, 62, 814–830. [Google Scholar] [CrossRef]
  42. Douglas, D.H.; Peucker, T.K. Algorithms for the Reduction of the Number of Points Required to Represent a Digitized Line or Its Caricature. Can. Cartogr. 1973, 10, 112–122. [Google Scholar] [CrossRef] [Green Version]
  43. Bott, M.H.P. The Use of Rapid Digital Computing Methods for Direct Gravity Interpretation of Sedimentary Basins. Geophys. J. Int. 1960, 3, 63–67. [Google Scholar] [CrossRef] [Green Version]
  44. Oldenburg, D.W. The inversion and interpretation of gravity anomalies. Geophysics 1974, 39, 526–536. [Google Scholar] [CrossRef]
  45. Roy, L.; Sen, M.K.; Blankenship, D.D.; Stoffa, P.L.; Richter, T.G. Inversion and Uncertainty Estimation of Gravity Data Using Simulated Annealing: An Application over Lake Vostok, East Antarctica. Geophysics 2005, 70, J1–J12. [Google Scholar] [CrossRef]
  46. Dipartamento Per Il Servizio Geologico D’Italia—ISPRA. Archivio Nazionale delle Indagini nel Sottosuolo (Legge 464/1984). Available online: http://sgi2.isprambiente.it/indagini/ (accessed on 9 September 2021). (In Italian)
  47. De Caterini, G.; Blumetti, A.M.; Coen, G.; Della Ventura, G.; Eulilli, V.; Ferri, F.; Guerrieri, L.; Leoni, G.; Lucci, F.; Mariani, M.; et al. New preliminary data on the Late Quaternary evolution of Magliano dei Marsi area (Abruzzo, Central Italy). In Proceedings of the 6th International INQUA Meeting on Paleoseismology, Active Tectonics and Archaeoseismology, Pescina, Italy, 19–24 April 2015; INQUA: Pescina, Italy, 2015; pp. 108–111. [Google Scholar]
  48. Gori, S.; Falcucci, E.; Ladina, C.; Marzorati, S.; Galadini, F. Active faulting, 3-D geological architecture and Plio-Quaternary structural evolution of extensional basins in the central Apennine chain, Italy. Solid Earth 2017, 8, 319–337. [Google Scholar] [CrossRef] [Green Version]
  49. Giaccio, B.; Leicher, N.; Mannella, G.; Monaco, L.; Regattieri, E.; Wagner, B.; Zanchetta, G.; Gaeta, M.; Marra, F.; Nomade, S.; et al. Extending the tephra and palaeoenvironmental record of the central Mediterranean back to 430 ka: A new core from Fucino Basin, central Italy. Quat. Sci. Rev. 2019, 225, 106003. [Google Scholar] [CrossRef]
  50. Progetto Videpi. Available online: https://www.videpi.com (accessed on 6 September 2021).
  51. Parotto, M.; Cavinato, G.P.; Miccadei, E.; Tozzi, M. Line CROP 11: Central Apennines. La linea CROP 11: Appennino Centrale. Mem. Descr. Carta Geol. d’It. 2003, 62, 145–154. [Google Scholar]
  52. Grauch, V.J.S.; Cordell, L. Short Note—Limitations of determining density or magnetic boundaries from the horizontal gradient of gravity or pseudogravity data. Geophysics 1987, 52, 118–121. [Google Scholar] [CrossRef]
  53. Silva, J.B.C.; Santos, D.F.; Gomes, K.P. Fast Gravity Inversion of Basement Relief. Geophysics 2014, 79, G79–G91. [Google Scholar] [CrossRef]
  54. Bishop Model. Available online: https://wiki.seg.org/wiki/Bishop_Model (accessed on 6 September 2021).
  55. European Committee for Standardization (CEN). Design of Structures for Earthquake Resistance. Part 1: General Rules, Seismic Actions and Rules for Buildings; The European Union: Bruxelles, Belgium, 2003. [Google Scholar]
  56. Sheriff, R.E.; Geldart, L.P. Exploration Seismology; Cambridge University Press: Cambridge, UK, 1995. [Google Scholar]
  57. Ciotoli, G.; Guerra, M.; Lombardi, S.; Vittori, E. Soil gass urvey for tracing seismogenic faults: A case study in the Fucino basin, Central Italy. J. Geophys. Res. 1998, 103, 23781–23794. [Google Scholar] [CrossRef]
  58. Destro, N. Release fault: A variety of cross fault in linked extensional fault systems, in the Sergipe-Alagoas Basin, NE Brazil. J. Struct. Geol. 1995, 17, 615–629. [Google Scholar] [CrossRef]
  59. Chiarabba, C.; Bagh, S.; Bianchi, I.; De Gori, P.; Barchi, M. Deep structural heterogeneities and the tectonic evolution of the Abruzzi region (Central Apennines, Italy) revealed by microseismicity, seismic tomography, and teleseismic receiver functions. Earth Planet. Sci. Lett. 2010, 295, 462–476. [Google Scholar] [CrossRef]
  60. Villani, F.; Improta, L.; Pucci, S.; Civico, R.; Bruno, P.; Pantosti, D. Investigating the architecture of the Paganica Fault (2009 Mw 6.1 earthquake, central Italy) by integrating high-resolution multi-scale refraction tomography and detailed geological mapping. Geophys. J. Int. 2017, 208, 403–423. [Google Scholar] [CrossRef]
  61. Tallini, M.; Spadi, M.; Cosentino, D.; Nocentini, M.; Cavuoto, G.; Di Fiore, V. High-resolution seismic reflection exploration for evaluating the seismic hazard in a Plio-Quaternary intermontane basin (L’Aquila downtown, central Italy). Quat. Int. 2019, 532, 34–47. [Google Scholar] [CrossRef]
  62. Luongo, G.; Ferri, M.; Cubellis, E.; Grimaldi, M.; Obrizzo, F. Struttura superficiale della Piana Campana: Interpretazione del profilo Garigliano Campi Flegrei. In Proceedings of the Atti 7 Convegno Annuale GNGTS, Roma, Italy, November 1988; pp. 1121–1128. [Google Scholar]
  63. Mostardini, F.; Merlini, S. Appennino centro-meridionale. Sezioni Geologiche e Proposta di Modello Strutturale. Mem. Soc. Geol. It. 1986, 35, 177–202. (In Italian) [Google Scholar]
  64. Carrozzo, M.T.; Nicolich, R. Quantitative interpretation of gravity and magnetic data. Boll. Geof. Teor. Appl. 1977, 19, 236–248. [Google Scholar]
  65. Gualteri, L.; Valenti, L.; Cassinis, R. Modelling gravimetrico e magnetico nella regione di transizione tra la Liguria orientale e la Toscana. In Studi Geol. Camerti Spec.Vol. 1992/2: “Studi Preliminari All’acquisizione Dati del Profilo CROP 1-1A La Spezia-Alpi Orientali”; Springer: Berlin/Heidelberg, Germany, 1992; Volume 2, pp. 107–114. (In Italian) [Google Scholar]
  66. D’Aringoli, D.; Cavitolo, P.; Farabollini, P.; Galindo-Zaldivar, J.; Gentili, B.; Giano, S.I.; Lòpez-Garrido, A.C.; Materazzi, M.; Nibbi, L.; Pedrera, A.; et al. Morphotectonic characterization of the quaternary intermontane basins of the Umbria-Marche Apennine (Italy). Rend. Lincei. Sci. Fis. Nat. 2014, 25, 111–128. [Google Scholar] [CrossRef]
  67. Telford, W.M.; Geldart, L.P.; Sheriff, R.E. Applied Geophysics; Cambridge University Press: Cambridge, UK, 1990; p. 770. [Google Scholar]
  68. D’orefice, M.; Graciotti, R.; Chiessi, V.; Censi Neri, P.; Morri, A.; Roma, M.; Falcetti, S. The Oricola-Carsoli (AQ) intermontane basin: Geological, geomorphological and applicative aspects. Mem. Descr. Carta Geol. d’It. 2014, 111, 7–114. [Google Scholar]
  69. Coli, M.; Guerri, L.; Rubellini, P. Geotechnical characterization of the Florence (Italy) soils. Jpn. Geotech. Soc. Spec. Publ. 2015, 2, 2648–2653. [Google Scholar] [CrossRef]
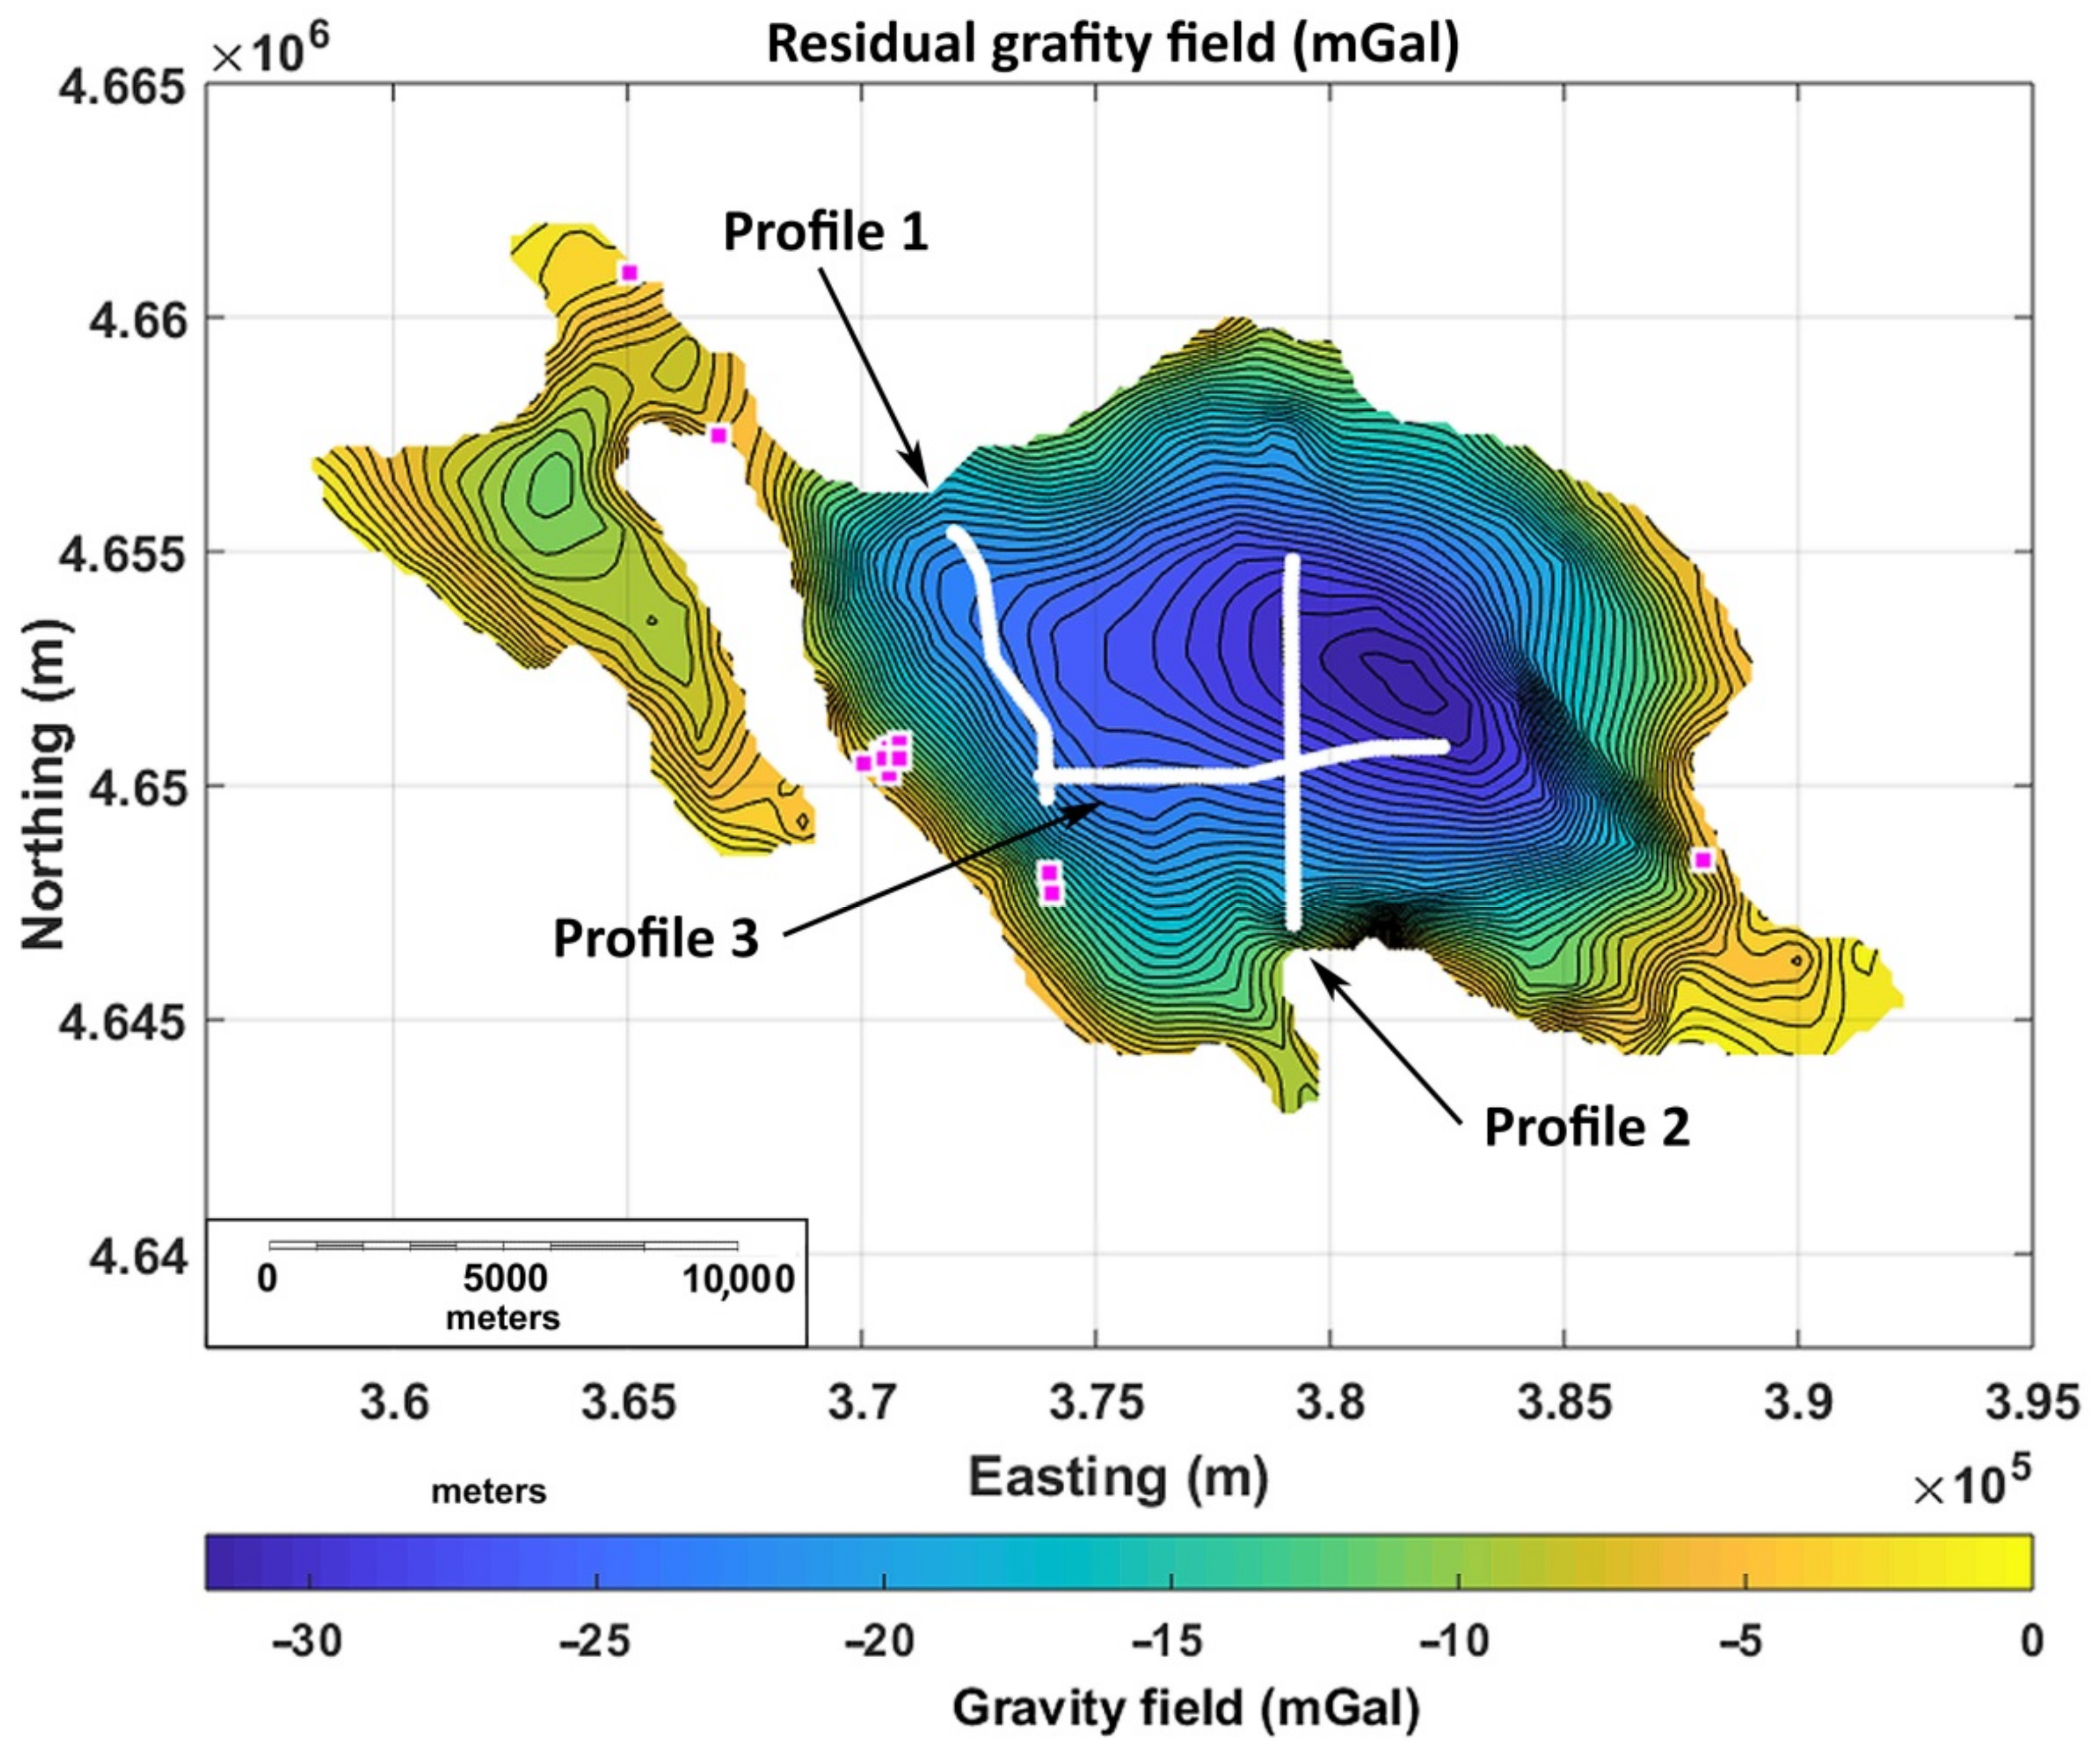
Figure 2. Residual gravity field of the Fucino plain used for modelling the basement depth. White points and magenta squares indicate the position of seismic and borehole data, respectively, used as constraints to the basement depth in the gravity modelling. Contour interval: 0.75 mGal.
Geosciences 11 00398 g002
Figure 3. Enhanced horizontal derivative map of the residual gravity field of Figure 2. The maxima (hotter colors) of the signal, expressed in normalized units, show to the position of density contrasts (likely faults). Known faults (black solid lines) from [2]. The Venere Fault was inferred in this paper by EHD analysis (see Section 5.2).
Geosciences 11 00398 g003
Figure 4. Depth–gravity plot obtained using a constraint set relative to the top of the Meso-Cenozoic carbonate rocks, including the deeper seismic horizon and borehole data. The black line is a second-degree polynomial curve approximating the distribution of the constraint points.
Geosciences 11 00398 g004
Figure 5. Estimation of the depth-density function for the Fucino basin. (a) Unit-density gravity field generated by the first-approximation model vs. the residual gravity data. The points cloud is approximated using a second-degree polynomial and simplified in a set of 8 linear segments using the Douglas and Peucker (1973) method [42]. (b) The depth-density function estimated by using the slope of each segment in a) and the observed gravity relative to their endpoints following the procedure [12]. In this plot, an average elevation of 677 m asl is considered for the Fucino plain.
Geosciences 11 00398 g005
Figure 6. ITRESC basement model. (a) Elevation map of the top of the Meso-Cenozoic carbonate basement; contour lines interval: 50 m. (b) Map of the thickness of the sediments overlying the carbonate basement; contour lines interval: 50 m.
Geosciences 11 00398 g006
Figure 7. ITRESC basement model. (a) Model-predicted gravity field (compared with the residual gravity of Figure 2); contour lines interval: 1 mGal. (b) Gravity misfit (difference between residual and predicted field).
Geosciences 11 00398 g007
Figure 8. ITRESC basement model. (a) Histogram of the difference between the depth to constraints and the ITRESC basement depth at the same locations. (b) Empirical cumulative distribution function of the modulus of the difference between the constraints’ depth and model depth.
Geosciences 11 00398 g008
Figure 9. Comparison of the depth to the seismic reflector interpreted as the top of the carbonatic rocks, and the gravity basement along the seismic profile 1 (see Figure 2). (a) Observed and model-predicted gravity; (b) gravity basement (green) and seismic reflector (triangles). Brown shading represents the density contrast variation with depth estimated in the ITRESC modelling.
Geosciences 11 00398 g009
Figure 10. Comparison of the depth to the seismic reflector interpreted as the top of the carbonatic rocks, and the gravity basement along the seismic profile 2 (see Figure 2). (a) Observed and model-predicted gravity; (b) gravity basement (green) and seismic reflector (triangles). Brown shading represents the density contrast variation with depth estimated in the ITRESC modelling.
Geosciences 11 00398 g010
Figure 11. Comparison of the depth to the seismic reflector interpreted as the top of the carbonatic rocks, and the gravity basement along the seismic profile 3 (see Figure 2). (a) Observed and model-predicted gravity; (b) gravity basement (green) and seismic reflector (triangles). Brown shading represents the density contrast variation with depth estimated in the ITRESC modelling.
Geosciences 11 00398 g011
Figure 12. Sections through the basement model. (a) Basement map with the location of the sections (white lines) and of the maxima of the EHD as identified in Figure 3 (colored squares); (b) Profile A; (c) Profile B; (d) Profile C. Red lines are the inferred faults located on the base of the EHD analysis (Figure 3). Brown shading represents the density contrast variation with depth estimated in the ITRESC modelling.
Geosciences 11 00398 g012
Figure 13. 3D conceptual sketch of the structural scheme of the Fucino half-graben (eastern side) as achieved from our study (figure not to scale). Modified from [58].
Geosciences 11 00398 g013
Table 1. Boreholes used to constrain the gravity modelling.
BoreholeDepth to the Meso-Cenozoic
Carbonate Basement
(m. Below Ground Level)
Data Source
Avezzano (code 164216)−80[46]
Avezzano (code 164110)−80[46]
Avezzano (code 164243)−40[46]
Pescina (code 165016)−50[46]
Celano (code 164250)−6[46]
ISMES19−22.5[19]
ISMES18−88[19]
ISMES17−140.4[19]
S1−25[2]
S2−88[2]
S3−145[2]
Magliano dei Marsi−56 m[47]
Publisher’s Note: MDPI stays neutral with regard to jurisdictional claims in published maps and institutional affiliations.