Abstract
Anthropogenic litter (i.e., trash, AL) on beaches has negative ecological and economic impacts. Beach AL is likely moved together with coarse particulate organic matter (CPOM, algae, leaves), but no previous studies have assessed AL and CPOM co-distribution. We measured AL and CPOM on four urban beaches in Chicago, Illinois, USA, along two transect types (pier-adjacent, non-pier adjacent) in which each has three habitats (upland, beach, strand line). As expected, AL and CPOM density were positively related across all transects. AL and CPOM were significantly higher adjacent to piers, and variable among habitats. Wood, leaves, and smoking-related AL were most abundant in beach and upland zones while glass and algal detritus were abundant at the strandline. Overall, AL and CPOM show ‘patchy’ distribution attributed to wind and wave movement toward accumulation sites. Beach CPOM is a hot spot of biological activity (e.g., microbes, invertebrates, birds). Therefore, mixing of AL and CPOM suggests organisms may be more likely to encounter AL in mixed accumulations. Efforts to reduce the abundance and biological impacts of beach AL will benefit from emphasizing organic matter accumulation sites.
1. Introduction
The accumulation of anthropogenic litter (AL, trash) is increasing in marine and freshwater ecosystems worldwide [,,]. Beach habitats have been a focus of research on AL, as they provide important ecosystem services and AL is conspicuous to visitors [,]. Common types of beach AL include cigarette butts, food packaging, fishing debris, and plastic fragments [,,]. Beach AL can pose a threat to wildlife (e.g., birds, marine mammals, and fish) via ingestion, entanglement, or leeching of chemical contaminants or additives [,,]. For humans, beach AL poses a physical danger (e.g., broken glass, fishing debris) and may have negative economic impacts if left unmitigated. Communities at risk of economic losses due to AL pollution implement beach clean-up and maintenance strategies [,]. Therefore, understanding the sources, movement, and biological interactions of AL on beaches is critical to develop efficient prevention and removal strategies that will help sustain positive economic outcomes and ecosystem integrity [,].
While much research on beach AL occurs in marine settings, freshwater ecosystems, including beaches of the Laurentian Great Lakes, have significant AL accumulations and are the subject of a new wave of AL research [,,,]. The Great Lakes serve as a major reservoir of freshwater at a global scale and as an important commercial resource for neighboring metropolitan areas. Therefore, the impacts of AL on water and habitat quality may have detrimental economic and ecological impacts []. For example, an estimated 9887 metric tons of plastic pollution enters the Great Lakes annually [], and plastic litter may be retained in the sediment, incorporated into the food web, exported downstream (i.e., St Lawrence River), or stranded on the coastlines [,,].
Initial studies of AL on Great Lakes beaches have offered insight into its sources and composition. Hoellein et al. [] showed most AL likely originates directly from beach visitors rather than litter from offshore activities including fishing, shipping, and dumping, which are common on marine beaches. These types are minor contributors to beach litter due to lower offshore activities in the Great Lakes relative to the oceans. In particular, the high relative abundance of smoking-related and food-related AL points to beach visitors as the primary source [,,]. Lastly, the positive correlation between population density and AL density support the local origins of AL on Great Lakes beaches []. However, the distribution of AL within Great Lakes beaches is rarely examined.
Stranded AL can be moved through wind and wave action, which may contribute to the “patchy” spatial attribution of AL on beaches. For example, on Colombian beaches in the Caribbean, waves from the northwest drive AL accumulations to predictable locations []. Similarly, Zbyszewski et al. [] attributed the accumulation of small plastic AL at predictable sites on Great Lakes beaches via storms. At smaller scales, Vincent et al. [] found greater abundance of AL near beach piers than elsewhere (near an urban beach in Chicago), and concluded the sources were littering by beach-goers and the pier acting as an AL retention site. Together, these data illustrate that natural processes and human behavior drive AL accumulations on beaches, and the spatial and temporal variation in abundance of AL is a dynamic component of beach ecosystems.
Naturally occurring coarse particulate organic matter (CPOM) such as macrophytes, algae, grass, leaves, and wood are an important component of beach ecosystems. CPOM accumulations on beaches are biogeochemical ‘hot spots’, which have high metabolic rates (e.g., carbon fluxes) compared to surrounding habitats such as sand []. Beaches are key sites for the exchange of organic matter between terrestrial and aquatic ecosystems, and decomposition of organic matter supports beach food webs, including invertebrates and birds []. However, CPOM accumulations are not distributed evenly across a beach, as CPOM is moved by wind and waves to retention sites prior to biological breakdown, burial, or interaction with beach biota. Due to its mobility, AL is likely to move together with CPOM. The potential co-accumulation of AL and CPOM also suggests that AL may impact important biological processes that occur on beaches (e.g., organic matter decomposition, ingestion by organisms), but interactions between AL and CPOM on beaches have not previously been measured.
The purpose of this study was to assess the spatial distribution and composition of AL and CPOM accumulations on urban beaches. We predicted that (1) the greatest accumulation of AL and organic matter would occur near piers (i.e., retention sites), (2) AL accumulation would be greater at the strand-line compared to the open beach and upland habitats, and (3) AL and organic matter would accumulate together. Data generated from this study will inform our understanding of AL ecology on beaches, its potential interactions with beach biota, and improve AL removal efficiency.
2. Materials and Methods
2.1. Study Sites
Data collection was completed at four Lake Michigan beaches in the Rogers Park neighborhood of Chicago, IL, USA (Figure 1). Study beaches were selected as they were the subject of previous research on AL abundance [,], and are in urban locations with high visitation during the summer. The Chicago Parks Department uses grooming tractors to collect litter at dawn every day throughout the summer (Figure A1), which, in 2018, was May 28 (US holiday of Memorial Day) to September 3 (US holiday of Labor Day). Signs prohibiting smoking and alcohol use are posted at all beaches in Chicago. Waste and recycle bins for visitor use are available and maintained by the Chicago Park District. Beaches are open daily from 6:00 a.m. to 11:00 p.m. with free admission.
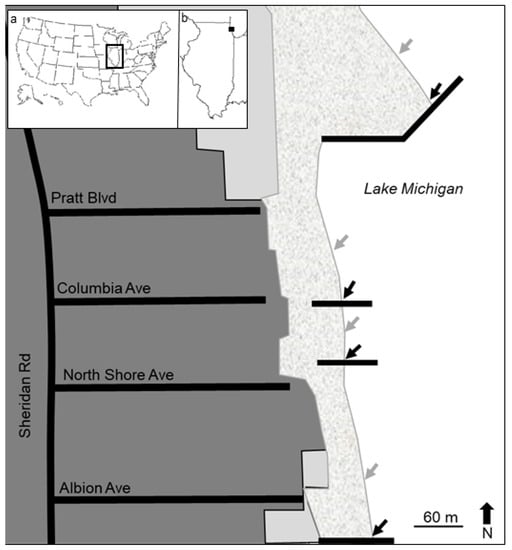
Figure 1.
Map of study sites. Dark gray = city blocks, light gray = city parks, stippled = sandy beach, and white = Lake Michigan. Sites are named according to intersecting streets, and pier locations are marked in black. Arrows show location of pier adjacent (black) and non-pier adjacent (gray) transects. Insets: (a) the state of Illinois in context of the United States, and (b) location of the study beaches within Illinois.
Collection took place on 3 October 2018, which was four weeks after the end of municipal litter maintenance. We selected this date because previous research indicated it was during this time of year when AL is highest on Chicago-area beaches, due to continued visitation and the lack of maintenance in the autumn [,]. Our expectation was that this period of high AL density would facilitate the analysis of AL and organic matter co-accumulation.
2.2. Litter and Organic Matter Collection
Organic matter and AL density were measured at four study beaches (Table 1, Figure 1). At each beach, we established two sampling locations: one directly adjacent to a pier and another 20–80 m away from the pier (i.e., non-pier, depending on the width of the beach). Non-pier habitats were located north of the pier habitats, as water currents generally move from north to south along the southwest coast of Lake Michigan []. Because the piers at the North Shore and Columbia beaches are close together, the distance between the pier and non-pier locations was reduced (Figure 1).

Table 1.
Characteristics of study sites and transects.
We collected AL and organic matter at each sampling location using a transect-based approach []. Measurement of each transect started at the water line, ran perpendicular from the water line toward the upland vegetation or concrete (i.e., west, Figure 1), and ended 1 m into the upland vegetation or concrete. Each transect was separated into three habitats. The ’strand line’ habitat began at the water line and consisted of the region with evidence of recent flooding (i.e., high water and stranded material). The ’beach’ habitat was situated above the strand line and extended away from the water to the end of the beach, which was indicated by vegetation or concrete. Lastly, the ’upland’ habitat consisted of concrete or vegetation. We collected all organic matter and AL within 1 m on each side of the transect tape. Organic matter and AL from each transect (i.e., pier and non-pier) were collected separately according to habitat (i.e., strand, beach, and upland). For each transect, the collection was repeated two times by different researchers. Material was collected by visual inspection. Therefore, while the minimum size of material may vary among individual researchers, the smallest items were approximately 5 mm [,].
All material was returned to the lab and kept at room temperature to dry until sorting. For AL, we categorized, counted, and weighed each item according to usage category and material type (Figure A2). Categories of AL included: fragments (0.5–2.5 cm), smoking-related, food-related, medical and personal hygiene, waterway activities (e.g., flotation devices, ropes, buoys, and materials for boating), dumping, and ‘other.’ Usage category and material type were based on previous assessments of AL from citizen science datasheets [,,]. Organic matter was separated and categorized by material type (e.g., wood, macrophyte/algae, leaves, shell, and ‘other’) and weighed.
2.3. Data Analysis and Availability
We used parametric and non-parametric statistics to determine differences in AL and organic matter, according to habitat and pier proximity. Data were assessed to meet the assumptions of ANOVA using the Kolmogorov-Smirnoff test for normal distribution. We used log or natural log transformation when needed, which was followed by a two-way ANOVA test by habitat and pier proximity. If data could not be transformed to fit ANOVA assumptions, the aligned rank transformation (ART) non-parametric test for factorial analysis was used [] to examine patterns among habitats and pier proximity. We repeated all tests for total AL and organic matter as well as for all categories of each material type. Lastly, we used simple linear regression to quantify the relationship between total AL (in units of g/m2 and No/m2) and organic matter (g/m2). We also conducted simple linear regression between the density of AL fragments and organic matter. All statistics were completed using SYSTAT (SYSTAT 13, Chicago, IL, USA) and SigmaPlot (SigmaPlot 10.0, Chicago, IL, USA), except the non-parametric ART test, which was completed using the ARTool package in R []. All data are publicly available at the following website: https://data.mendeley.com/datasets/ww3pf4763g/1 [].
3. Results
3.1. Organic Matter and AL Abundance: Influence of Pier and Habitat
Organic matter and AL showed different patterns according to habitat type and pier proximity. Organic matter density was not significantly different among habitats (ART-test p = 0.070), but was higher in pier-adjacent relative to non-pier transects (ART-test p = 0.042, Figure 2a). Similarly, we observed no significant difference in AL density (No/m2) among habitats (two-way ANOVA p = 0.084, Figure 2b), but AL density was significantly higher when adjacent to piers relative to non-pier locations (two-way ANOVA p = 0.036, Figure 2b). Lastly, total AL by mass (g/m2) showed no significant differences among habitats (two-way ANOVA p = 0.354) or according to pier proximity (two-way ANOVA p = 0.074, Figure 2c).
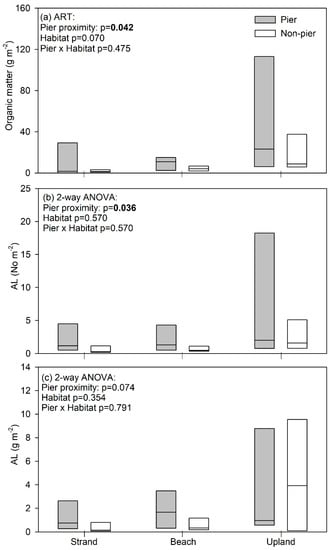
Figure 2.
Median (center line) and 25th and 75th percentile (box edges) for (a) organic matter density, (b) anthropogenic litter (AL) density by number, and (c) AL density by mass.
We compared the abundance of each of the AL and organic matter categories across habitat types and according to pier proximity using the ART-test or two-way ANOVA (Table 2). Only smoking-related AL, waterway activity-related AL, wood, and leaves showed significant variation across the three habitats (Table 2). Smoking-related litter was highest on the beach, lowest on the strand line, and the upland zone was intermediate (No/m2 ART-test p = 0.021, and g/m2 ART-test p = 0.025, Table 2). The same pattern in smoking related AL was observed whether expressed as density (No/m2, Figure 3a) or mass (g/m2, Figure 3b). Litter from waterway activities was also highest on the beach habitat whether expressed as density (No/m2 ART-test, p = 0.046) or mass (g/m2 ART-test p = 0.042, Table 2, Figure 3c,d). Wood was highest on the upland habitat and lowest at the strand line (ART-test, p = 0.020, Table 2, Figure 3f). Leaf litter was also highest at the upland habitat relative to elsewhere (two-way ANOVA, p < 0.001, Table 2, Figure 3e). Lastly, several litter types were higher at piers relative to non-pier transects including smoking-related (No/m2, ART-test p = 0.005), medical/personal/hygiene (No/m2, ART-test, p = 0.003), dumping (g/m2, ART-test, p = 0.008), leaves (ART-test p = 0.013), algae (ART-test p = 0.023), shell (ART-test p = 0.045), and ‘other’ (ART-test p = 0.029; Table 2, Figure 3). The only exception was waterway activities, which was higher at non-pier locations (No/m2, ART-test, p = 0.023, g/m2, ART-test p = 0.026, Table 2, Figure 3c,d).

Table 2.
Anthropogenic litter (AL) and organic matter density were compared according to pier proximity and habitat using the aligned rank tool (ART) approach. The only exception was leaf litter (*) results, which are from two-way ANOVA. Bold indicates p ≤ 0.05.
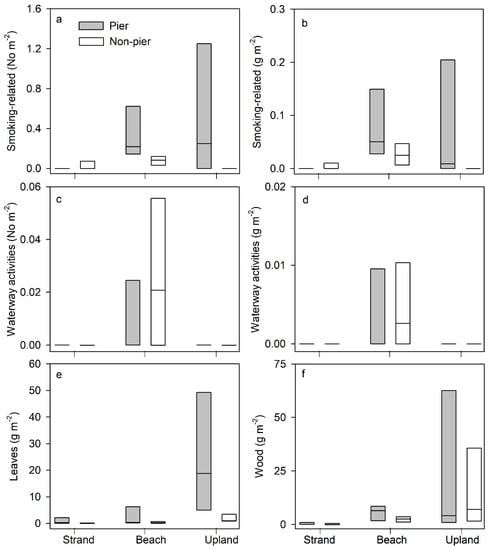
Figure 3.
Median (center line) and 25th and 75th percentile (box edges) for density of litter categories at strand, beach, and upland habitats, according to pier proximity. (a,b) smoking-related litter, (c,d) litter from waterway activities, (e) leaves, (f) wood.
We also examined the relative proportion of AL categories by pier proximity and habitat. Across all study sites, fragments (i.e., particles 0.5–2.5 cm) were the most abundant component of AL (66–81% of total litter types) with strandline habitats showing the greatest abundance of fragments compared to beach and upland areas (Figure 4a). Food-related AL ranged from 7–21% (Figure 4a) with no consistent pattern among habitats or pier proximity. Smoking-related litter showed distinct patterns among habitats where the material was approximately 17% of the total AL in the beach habitat (Figure 4a) but was uncommon elsewhere. Lastly, litter from waterway activities, dumping, and personal and medical hygiene were the least abundant across all habitats (Figure 4a).
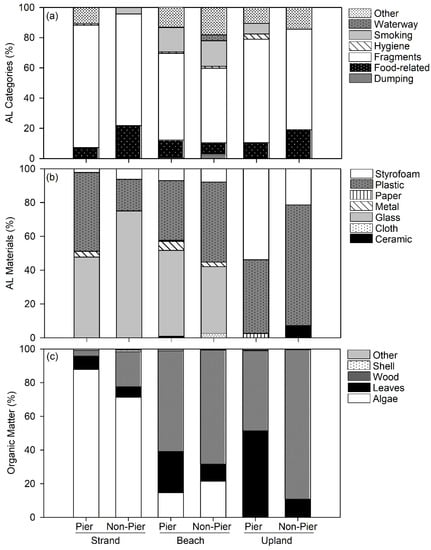
Figure 4.
(a) Relative abundance (%) of anthropogenic litter (AL) according to category, and (b) material type by habitat type and pier proximity. (c) Relative abundance (%) of coarse particulate organic matter (CPOM) by habitat type and pier proximity.
With respect to material types, plastic and foamed polystyrene (i.e., Stryofoam) were ubiquitous across all sampling locations, at 18–71% and 2–53%, respectively (Figure 4b). Glass was abundant at the strand and beach habitats (39–75% of all AL), but uncommon in the upland habitats (0%) (Figure 4b). Paper and cardboard, ceramic, cloth, and metal composed <10% of total AL in the habitats that followed no spatial pattern (Figure 4b).
We also compared the relative abundance of organic matter categories among habitats. Algae showed the greatest relative abundance at the strand line (71–87%) when compared to other habitats (Figure 4c). Leaves had the greatest relative abundance at the upland habitat and at pier-adjacent sites. Lastly, wood was more abundant at the upland and beach habitats relative to the strand line (Figure 4c).
3.2. Relationship between Organic Matter and AL Abundance
We used simple linear regression to compare abundance and mass of AL and organic matter across habitats, according to pier proximity. Total AL (No/m2, log transformed) and organic matter (g/m2, log transformed) showed a significant positive relationship suggesting the co-accumulation of AL and organic matter (R2 = 0.665, p < 0.001, Figure 5a). There was also a significant positive relationship when considering total AL by mass (g/m2, log transformed) and organic matter (g/m2, log transformed). However, the relationship explained less variation (R2 = 0.299, p < 0.006, Figure 5b). A simple linear regression between AL fragments (No/m2) and total organic matter also showed a significant positive relationship (R2 = 0.434, Figure 5c), while there was not a significant relationship between the mass of AL fragments (log + 1 transformed, g/m2) and organic matter (log transformed, g/m2) (R2 = 0.129, p = 0.085, data not shown).
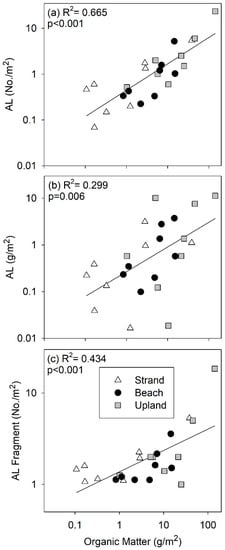
Figure 5.
Simple linear regression between organic matter standing stock and (a) anthropogenic litter (AL) density by number, (b) AL density by mass, and (c) AL fragment density by number.
4. Discussion
Our assessment of AL and CPOM abundance spanned a variety of beach conditions and showed (1) significant spatial variation and (2) positive correlations between total AL and CPOM, which suggests similar mechanisms may determine the ‘patchy’ distribution of litter on the beaches. It is likely that wind and wave action redistributes AL and CPOM to the same accumulation sites at pier and upland zones. Co-accumulation sites should take priority in future studies, to document biological interactions between AL and CPOM on beaches, and in the refinement of AL removal and management protocols.
4.1. Accumulation of Litter at Piers and Upland Zones
The results supported our prediction that litter accumulation would occur closer to piers, which can retain litter transported by wind and water. Sandy beaches in the Great Lakes typically form as longshore bars for tens of kilometers, and are persistent over many years []. Along the southwestern shoreline of Lake Michigan, water currents move from north to south []. Accordingly, when viewed using satellite imagery, the longshore sandy beaches are larger along the north side relative to the south side of piers throughout Chicago and neighboring communities, as sediment and sand transported by currents is deposited in accumulation zones along beaches. In addition, wind is also a likely explanation for litter accumulation on piers. The piers in our study were elevated 0.2–1.5 m above the beach surface (Table 1), which generated a leeward and windward eddy. Therefore, the pier structure or other similar obstacles, which retain litter where the pier and beach surface meet, is crucial to incorporate in discussions of factors that influence AL and CPOM distribution. We only infer the influence of wind and current dynamics since we did not measure either in this study. Follow-up research will benefit from collection of AL on the upstream and downstream side of piers relative to prevailing longshore water currents, which will facilitate a careful test of the role of currents on AL redistribution.
Other studies on beach AL have suggested wind and water as a major driver of spatial distribution. Vincent and Hoellein [] examined spatial distribution on AL on a Chicago beach to show that pier-adjacent locations had the highest AL density compared to vegetation and open beach habitats. Patterns were attributed to accumulation by wind, waves, and direct littering from visitors walking on the pier. In a meta-analysis, Browne et al. [] reviewed 105 publications on marine debris and found many instances where marine AL accumulates in relation to wind. This analysis concludes that wind and water currents are one driver of litter accumulation. However, accumulation varied according to the debris type. For example, low density plastic was strongly affected by wind because it represents a greater relative abundance of total macroplastic in locations further downwind, while more dense plastic was not []. In our study, beach AL consisted of many lightweight materials (e.g., plastic bags, food packaging), so wind was likely impacting accumulation of those items. However, we did not separate plastic litter by mass in our analysis for this study. Lastly, Williams and Tudor [] measured the influence of wind on AL for a beach in South Wales, UK. All litter was removed, marked, and recorded every two weeks for a period of three months. The two-week intervals with the ‘newest’ AL coincided with periods of higher wind speeds [].
While wind and wave action can transport litter to accumulation sites on beaches, these processes may also reduce beach CPOM and AL abundance via burial or transport offshore [,]. Therefore, a single storm event may act as both a sink and a source of AL and CPOM to beach habitats. The net effect on litter accumulations may vary, according to the physical properties of the study site and the nature of the storm. For example, Williams and Tudor [] demonstrated periods of high wave action were associated with increased appearance of new (i.e., unmarked) anthropogenic litter on a rocky beach in the UK, which showed a deposition of litter from the ocean and exposure of buried litter during high wave periods. Thus, careful documentation of wind and wave action, as well as tracking of litter items, are likely to be fruitful in pursuit of the role of natural and anthropogenic factors, which drive AL on Great Lakes beaches as well.
Contrary to our expectations, we found the least amount of AL near the water suggesting that the strandline habitat is subject to distinct factors, which drive AL abundance compared to the beach and upland habitats, including deposition, burial, and erosion. This requires additional study. Vincent and Hoellein [] examined distribution of AL on a Chicago beach and found that AL accumulation was greatest in transects close to a pier compared to vegetated and open beach habitats. However, that study did not include the strandline in the habitat comparison, and, therefore, there were no previous measurements of what might ‘wash up’ on the strandline in comparison to the rest of the beach. In general, other studies of litter composition on Great Lakes beaches focus on variation among different beaches [,,] rather than spatial distribution of litter within a site, as we have done here. We acknowledge that our assessment is a relatively narrow ‘snapshot’ of AL abundance at the strandline. More studies are needed to examine the influence of lake dynamics on the spatial distribution of litter and would benefit from repeated assessments of litter at the strandline, and the tracking of marked litter items to measure net input and loss of AL with respect to the lake [].
4.2. Distribution of Litter by Material Type
The spatial variation in CPOM across the strandline, beach, and upland zone habitats showed distinct patterns by material type, which offers some insight into the source and fate of naturally occurring organic litter. Algal detritus was in high abundance at the strandline, which indicates deposition from wave action. Little to no algae was found in the beach and upland habitats, respectively. We noted greater algal density adjacent to the pier relative to non-pier habitats. This pattern suggests that detached algae is moved by waves to accumulation sites at the pier, near the water. In contrast, wood accumulation was greatest in the upland habitat, which is logical since there are trees in the parks adjacent to the upland zone (Figure 1). Low abundance of wood in the beach and strandline habitats indicates that wood is not washed up from the lake or moved out of the upland zone. The lack of a relationship between wood and pier proximity reinforces our conclusion that wood found at our study sites is not coming from offshore and is not redistributed by wind. Lastly, the spatial distribution of leaf litter was similar to that of wood. However, leaves were significantly more abundant when adjacent to piers. The lower mass of leaf litter relative to wood explains why wind could transport leaves to the piers, while wood remained in place. This pattern is analogous to the redistribution of lightweight plastic litter by wind, when compared to heavier plastic litter [].
Spatial patterns of AL among habitats were, overall, less consistent than CPOM, but the distribution of smoking-related AL (~17% of total AL) offered insights into its sources and movement. Smoking-related AL was very low at the strandline, which suggests beach visitors are the most likely source, rather than wind or waves driving smoking litter from the lake onto the beach. While smoking is prohibited by law on Chicago beaches, previous studies measuring AL on beaches in Chicago and elsewhere on the Great Lakes found smoking-related to be among the most abundant litter types [,,]. Kataržytė et al. [] compared beaches across a gradient of visitor density and found the same pattern, which suggests beach-goers as the primary source of cigarette AL, rather than offshore sources.
Because of their vast global abundance, understanding the sources, fate, and biological interactions of littered cigarette butts is a major objective in this field of research [,,]. Cigarette butts consist of burned and unburned tobacco, ash, paper, and a filter (in most cases) []. Filters are made of cellulose acetate, which is a synthetic polymer derived from cellulose and plasticizers, with a high fiber density that slows biodegradation []. Littered cigarette butts contain a variety of chemicals (e.g., nicotine, tar) and can absorb heavy metals from runoff. Thus, as cigarette butts degrade, they can be sources of chemicals to the environment, and, if ingested (e.g., birds and fish), can induce toxicity, reduce motility, and cause mutations [,]. To our knowledge, the degradation rate of cigarettes on beaches has not been studied, but cigarette butts can persist in the environment for several years. For example, in grasslands and sand dunes, only 20–30% of the initial mass of cigarette butts was lost after two years, and 30–40% of initial mass remained after 5 years [].
In the long-term, prevention of cigarette AL requires proper disposal. Anecdotally, we witnessed the direct littering of cigarette AL by beach visitors, and in adjacent parks and sidewalks near study beaches. Prevention of cigarette AL is confounded by a common misconception that cigarette butts are biodegradable []. Innovations to prevent cigarette butt litter on beaches include reuse of butts for insecticide, new labelling emphasizing environmental impacts, creative design of ashtrays, and waste taxes on cigarette sales [,]. To our knowledge, these approaches have not been tested on Great Lakes beaches, but the existing data sets on cigarette butt AL in this study and others [,,] are well positioned to serve as “before” metrics if any novel prevention strategies are initiated.
Overall, AL from leisure or recreational beach activities by visitors (i.e., eating, drinking, and smoking) suggested sources from beach-goers predominate, relative to sources from waterway-, dumping-, and personal hygiene AL [,]. In addition to smoking-related AL, waterway-related AL, which includes flotation devices, ropes, and materials for boating activity, was the only other litter type to show significant spatial variation across habitats. Waterway-related AL was found only at the beach habitat. However, it was a minor component of total AL, 0–4.2%, and, therefore, the pattern is not informative in explaining total AL density. Dumping-related AL was also found in low abundance and included items such as large metal pieces and wiring.
Fragments were the most abundant AL category (20–80%), and determining their source and movement presents a challenge. Plastic and glass fragments were the most common material types at 19–71% and 0–75%, respectively. We did not identify the plastic polymer type, and, given the amorphous shape of fragments, we cannot identify the larger plastic items from which they originated. However, much of the larger plastic and glass items found on the beaches were in food-related and smoking-related categories, so it is logical to infer that the plastic and glass fragments most likely originated from these prominent AL categories. However, fragments, especially of lightweight plastic and foamed polystyrene, could more easily be moved greater distances by wind and water than heavier or larger AL items. This comparison has yet to be empirically assessed but will ultimately be helpful for modeling abundance and movement of AL at larger spatial scales.
4.3. Co-Accumulation of Organic Matter with AL: Management Implications
In accordance with our hypothesis, organic matter and AL accumulate together when comparing data from all transects. Total AL density, as well as fragment AL density, were each positively related to total CPOM abundance. Even though AL and CPOM have distinct sources (e.g., littering vs. detached plants and algae), we conclude from this pattern that similar factors drive the locations at which AL and CPOM accumulate on the beach. Understanding where litter accumulates on beaches and understanding the factors that drive accumulation patterns is critical to improve beach litter removal efforts.
Municipal litter removal on Chicago beaches includes use of tractors, which have a trailer attached to rake the sand and collect litter items (Figure A1). Beach maintenance has the capacity to significantly reduce on AL abundance during the summer [,]. Given the size of the tractors, however, we have observed room for improvement in litter collection, especially around beach margins. For example, a distance of up to 1-2 meters away from obstacles (i.e., sidewalks, piers, and the water line) is needed for drivers to safely operate the machinery (Figure A1B,C). Therefore, some beach habitats with abundant AL (e.g., upland zone, pier-adjacent habitats) may not be included in tractor-based litter removal. Revisions to tractor protocols or new methods to target litter removal close to the upland and pier zones of high litter density might improve efficiency.
Economic losses associated with ‘trashy’ beaches [] are mitigated in part through municipal clean-ups (e.g., tractors), anti-littering campaigns, policy changes (e.g., taxes or bans on common AL), and volunteer clean-ups []. Assessing the ecological and economic impact of litter removal shows promise in evaluating their contribution, but require long-term analyses. A twelve-year study on marine beaches in Wales found a significant reduction in the number of plastic bags after a 2011 tax on plastic bags []. A similar plastic bag tax was put into effect in Chicago in February 2017. However, a reduction in the number of plastic bags littered on Chicago beaches has yet to be measured. Lastly, continuing community-science based beach clean-ups are an important component of educating the public on beach litter [,]. Overall, careful analysis of the source and movement of AL will best inform future prevention and management strategies that will sustain economic and environmental health of beach ecosystems.
Author Contributions
Conceptualization, T.J.H. and A.E.S.V. Methodology, T.J.H. and A.E.S.V. Software, R.F.L. Validation, T.J.H. and R.F.L. Formal analysis, R.F.L., A.E.S.V., and T.J.H. Investigation, R.F.L. and A.E.S.V. Resources, T.J.H. Data curation, R.F.L. Writing—original draft preparation, R.F.L. Writing—review and editing, R.F.L., A.E.S.V., and T.J.H. Visualization, R.F.L. Supervision, T.J.H. Project administration, T.J.H. Funding acquisition, T.J.H. All authors have read and agreed to the published version of the manuscript.
Funding
The National Science Foundation (grant number 1552825 to T. Hoellein) funded this research. Awards from the Loyola University Chicago Undergraduate Research Opportunities Program (LUROP) supported the participation of R. Lazcano.
Acknowledgments
We thank the Loyola University Chicago 2018 Limnology students for their help in data collection and processing. We appreciate support from the Biology Department at Loyola University Chicago. We thank two anonymous reviewers for constructive insights to improve the data analysis and composition.
Conflicts of Interest
The authors declare no conflict of interest. The funders had no role in the design of the study, in the collection, analyses, or interpretation of data, in the writing of the manuscript, or in the decision to publish the results.
Appendix A
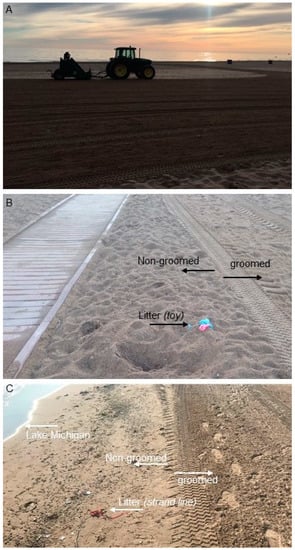
Figure A1.
Municipal litter maintenance for Lake Michigan beaches in Chicago. (A) A grooming tractor and trailer collects litter at dawn every day during the summer. (B) A sidewalk facilitating handicap access to the lake shows the distance maintained by grooming tractors from obstacles. (C) Shoreline litter missed by grooming tractors.
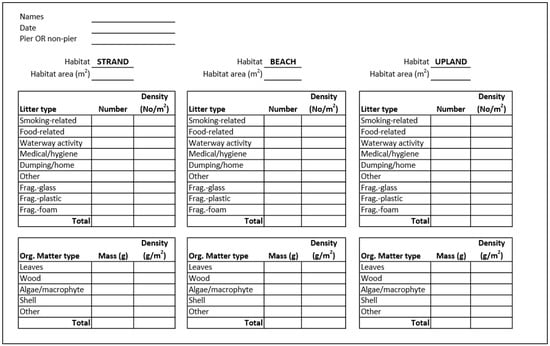
Figure A2.
Datasheet for collection of anthropogenic litter (AL) and coarse particulate organic matter (CPOM). Frag. = fragment.
References
- Asensio-Montesinos, F.; Anfuso, G.; Williams, A. Beach litter distribution along the western Mediterranean coast of Spain. Mar. Pollut. Bull. 2019, 141, 119–126. [Google Scholar] [CrossRef]
- Browne, M.A.; Chapman, M.G.; Thompson, R.C.; Amaral-Zettler, L.A.; Jambeck, J.; Mallos, N.J. Spatial and temporal patterns of stranded intertidal marine debris: Is there a picture of global change? Environ. Sci. Technol. 2015, 49, 7082–7094. [Google Scholar] [CrossRef]
- Nelms, S.; Coombes, C.; Foster, L.; Galloway, T.; Godley, B.; Lindeque, P.; Witt, M.; Nelms, S.E. Marine anthropogenic litter on British beaches: A 10-year nationwide assessment using citizen science data. Sci. Total. Environ. 2017, 579, 1399–1409. [Google Scholar] [CrossRef]
- Barbier, E.B.; Hacker, S.D.; Kennedy, C.; Koch, E.W.; Stier, A.C.; Silliman, B.R. The value of estuarine and coastal ecosystem services. Ecol. Monogr. 2011, 81, 169–193. [Google Scholar] [CrossRef]
- Defeo, O.; McLachlan, A.; Schoeman, D.S.; Schlacher, T.A.; Dugan, J.; Jones, A.; Lastra, M.; Scapini, F. Threats to sandy beach ecosystems: A review. Estuarine Coast. Shelf Sci. 2009, 81, 1–12. [Google Scholar] [CrossRef]
- Williams, A.; Randerson, P.F.; Alharbi, O. From a millennium base line to 2012: Beach litter changes in Wales. Mar. Pollut. Bull. 2014, 84, 17–26. [Google Scholar] [CrossRef] [PubMed]
- Hoellein, T.J.; Westhoven, M.; Lyandres, O.; Cross, J. Abundance and environmental drivers of anthropogenic litter on 5 Lake Michigan beaches: A study facilitated by citizen science data collection. J. Great Lakes Res. 2015, 41, 78–86. [Google Scholar] [CrossRef]
- Gregory, M.R. Environmental implications of plastic debris in marine settings—Entanglement, ingestion, smothering, hangers-on, hitch-hiking and alien invasions. Philos. Trans. R. Soc. B Biol. Sci. 2009, 364, 2013–2025. [Google Scholar] [CrossRef] [PubMed]
- Nakashima, E.; Isobe, A.; Kako, S.; Itai, T.; Takahashi, S.; Guo, X. The potential of oceanic transport and onshore leaching of additive-derived lead by marine macro-plastic debris. Mar. Pollut. Bull. 2016, 107, 333–339. [Google Scholar] [CrossRef]
- Azzarello, M.; Van Vleet, E. Marine birds and plastic pollution. Mar. Ecol. Prog. Ser. 1987, 37, 295–303. [Google Scholar] [CrossRef]
- Santos, I.R.; Friedrich, A.C.; Wallner-Kersanach, M.; Fillmann, G. Influence of socio-economic characteristics of beach users on litter generation. Ocean. Coast. Manag. 2005, 48, 742–752. [Google Scholar] [CrossRef]
- Ballance, A.; Ryan, P.G.; Turpie, J.K. How much is a clean beach worth? The impact of litter on beach users in the Cape Peninsula, South Africa. S. Afr. J. Sci. 2000, 96, 210–230. [Google Scholar]
- Bravo, M.; Gallardo, M.D.L. Ángeles; Luna-Jorquera, G.; Núñez, P.; Vasquez, N.; Thiel, M. Anthropogenic debris on beaches in the SE Pacific (Chile): Results from a national survey supported by volunteers. Mar. Pollut. Bull. 2009, 58, 1718–1726. [Google Scholar] [CrossRef] [PubMed]
- Maximenko, N.; Corradi, P.; Law, K.L.; Van Sebille, E.; Garaba, S.P.; Lampitt, R.S.; Galgani, F.; Martinez-Vicente, V.; Goddijn-Murphy, L.; Veiga, J.M.; et al. Toward the Integrated Marine Debris Observing System. Front. Mar. Sci. 2019, 6, 447. [Google Scholar] [CrossRef]
- Zbyszewski, M.; Corcoran, P.L.; Hockin, A. Comparison of the distribution and degradation of plastic debris along shorelines of the Great Lakes, North America. J. Great Lakes Res. 2014, 40, 288–299. [Google Scholar] [CrossRef]
- Mayoma, B.S.; Mjumira, I.S.; Efudala, A.; Syberg, K.; Khan, F.R. Collection of anthropogenic litter from the shores of Lake Malawi: Characterization of plastic debris and the implications of public involvement in the African Great Lakes. Toxics 2019, 7, 64. [Google Scholar] [CrossRef]
- Winton, D.J.; Anderson, L.G.; Rocliffe, S.; Loiselle, S. Macroplastic pollution in freshwater environments: Focusing public and policy action. Sci. Total. Environ. 2020, 704, 135242. [Google Scholar] [CrossRef]
- Rech, S.; Macaya-Caquilpán, V.; Pantoja, J.F.; Rivadeneira, M.; Madariaga, D.J.; Thiel, M. Rivers as a source of marine litter—A study from the SE Pacific. Mar. Pollut. Bull. 2014, 82, 66–75. [Google Scholar] [CrossRef]
- Helm, P.A. Occurrence, Sources, Transport, and Fate of Microplastics in the Great Lakes–St. Lawrence River Basin; Springer: Berlin/Heidelberg, Germany, 2020. [Google Scholar] [CrossRef]
- Hoffman, M.J.; Hittinger, E. Inventory and transport of plastic debris in the Laurentian Great Lakes. Mar. Pollut. Bull. 2017, 115, 273–281. [Google Scholar] [CrossRef]
- Driedger, A.G.; Dürr, H.H.; Mitchell, K.; Van Cappellen, P. Plastic debris in the Laurentian Great Lakes: A review. J. Great Lakes Res. 2015, 41, 9–19. [Google Scholar] [CrossRef]
- Vincent, A.E.; Hoellein, T.J. Anthropogenic litter abundance and accumulation rates point to seasonal litter sources on a Great Lakes Beach. J. Contemp. Water Res. Educ. 2017, 160, 72–84. [Google Scholar] [CrossRef]
- Vincent, A.; Drag, N.; Lyandres, O.; Neville, S.; Hoellein, T. Citizen science datasets reveal drivers of spatial and temporal variation for anthropogenic litter on Great Lakes beaches. Sci. Total. Environ. 2017, 577, 105–112. [Google Scholar] [CrossRef] [PubMed]
- Rangel-Buitrago, N.; Velez-Mendoza, A.; Garcia, A.; Neal, W.J. The impact of anthropogenic litter on Colombia’s central Caribbean beaches. Mar. Pollut. Bull. 2020, 152, 110909. [Google Scholar] [CrossRef] [PubMed]
- Coupland, G.T.; Duarte, C.M.; Walker, D.I. High metabolic rates in beach cast communities. Ecosyst. 2007, 10, 1341–1350. [Google Scholar] [CrossRef]
- Colombini, I.; Chelazzi, L.; Gibson, R.N.; Atkinson, R.J.A. Influence of marine allochthonous input on sandy beach communities. Oceanogr. Mar. Biol. Annu. Rev. 2003, 41, 115–159. [Google Scholar]
- Beletsky, D.; Saylor, J.H.; Schwab, D.J. Mean circulation in the Great Lakes. J. Great Lakes Res. 1999, 25, 78–93. [Google Scholar] [CrossRef]
- Feys, J. Nonparametric tests for the interaction in two-way factorial designs using R. R J. 2016, 8, 367–378. [Google Scholar] [CrossRef]
- Kay, M.; Wobbrock, J. ARTool: Aligned Rank Transform for Nonparametric Factorial ANOVAs. Available online: https://github.com/mjskay/ARTool (accessed on 18 August 2020).
- Lazcano, R.; Vincent, A.E.S.; Hoellein, T.J. Anthropogenic Litter on Chicago Beaches. Available online: https://data.mendeley.com/datasets/ww3pf4763g/1 (accessed on 10 June 2020).
- Hands, E.B. The Great Lakes as a Test Model for Profile Response to Sea Level Changes; Coastal Engineering Research Center, Department of the Army (US): Washington, DC, USA, 1984. [Google Scholar]
- Williams, A.T.; Tudor, D.T. Litter burial and exhumation: Spatial and temporal distribution on a cobble pocket beach. Mar. Pollut. Bull. 2001, 42, 1031–1039. [Google Scholar] [CrossRef]
- Zbyszewski, M.; Corcoran, P.L. Distribution and degradation of fresh water plastic particles along the beaches of Lake Huron, Canada. Water Air Soil Pollut. 2011, 220, 365–372. [Google Scholar] [CrossRef]
- Kataržytė, M.; Balčiūnas, A.; Haseler, M.; Sabaliauskaitė, V.; Lauciūtė, L.; Stepanova, K.; Nazzari, C.; Schernewski, G. Cigarette butts on Baltic Sea beaches: Monitoring, pollution and mitigation measures. Mar. Pollut. Bull. 2020, 156, 111248. [Google Scholar] [CrossRef]
- Araújo, M.C.B.; Costa, M.F. A critical review of the issue of cigarette butt pollution in coastal environments. Environ. Res. 2019, 172, 137–149. [Google Scholar] [CrossRef] [PubMed]
- Torkashvand, J.; Farzadkia, M.; Sobhi, H.R.; Esrafili, A. Littered cigarette butt as a well-known hazardous waste: A comprehensive systematic review. J. Hazard. Mater. 2019, 383, 121242. [Google Scholar] [CrossRef] [PubMed]
- Suárez-Rodríguez, M.; López-Rull, I.; Garcia, C.M. Incorporation of cigarette butts into nests reduces nest ectoparasite load in urban birds: New ingredients for an old recipe? Biol. Lett. 2012, 9, 20120931. [Google Scholar] [CrossRef] [PubMed]
- Bonanomi, G.; Maisto, G.; De Marco, A.; Cesarano, G.; Zotti, M.; Mazzei, P.; Libralato, G.; Staropoli, A.; Siciliano, A.; De Filippis, F.; et al. The fate of cigarette butts in different environments: Decay rate, chemical changes and ecotoxicity revealed by a 5-years decomposition experiment. Environ. Pollut. 2020, 261, 114108. [Google Scholar] [CrossRef] [PubMed]
- Hoellein, T.J.; Rojas, M.; Pink, A.; Gasior, J.; Kelly, J.J. Anthropogenic litter in urban freshwater ecosystems: Distribution and microbial interactions. PLoS ONE 2014, 9, e98485. [Google Scholar] [CrossRef] [PubMed]
- Krelling, A.P.; Williams, A.T.; Turra, A. Differences in perception and reaction of tourist groups to beach marine debris that can influence a loss of tourism revenue in coastal areas. Mar. Policy 2017, 85, 87–99. [Google Scholar] [CrossRef]
- Widmer, W.M.; Reis, R.A. An experimental evaluation of the effectiveness of beach ashtrays in preventing marine contamination. Braz. Arch. Biol. Technol. 2010, 53, 1205–1216. [Google Scholar] [CrossRef]
© 2020 by the authors. Licensee MDPI, Basel, Switzerland. This article is an open access article distributed under the terms and conditions of the Creative Commons Attribution (CC BY) license (http://creativecommons.org/licenses/by/4.0/).