Abstract
The state-of-the-art methods for verifying the correctness of ground improvement performed using the DSM (Deep Soil Mixing) technology are largely focused on the selection of adequate factors impacting the achievement of a correct compressive strength fc [MPa] of the column core, which ensures the transfer of stress from the designed structures to the subsoil. In view of the operation of each of the columns, it is equally significant to ensure that their bases are located in load-bearing soil at the entire area of the improvement, without the need to perform many costly subsoil surveys. Based on the complementary soil investigation results and parameters obtained during deep soil mixing from an automatic logger installed on the drilling machine, a method of comparing the rotary drive pressure (working pressure) PKDK [bar] and the cone resistance qc [MPa] of the CPTU static probe (Cone Penetration Test Unit with Pore Pressure Measurement) was developed along with the method to interpret the results in the context of the correctness of the ground improvement on the construction site analyzed in this paper.
1. Introduction
In situ Soil Mixing (SM) is a versatile ground improvement method. It can be used to stabilize a wide range of soils, including soft clays, silts, and fine-grained sands. Stabilization of organic soils such as gyttja (sedimentary organic soil), peat, and sludges is also possible, but is more difficult and requires carefully tailored binders and execution procedures. However, the engineering properties of the stabilized soil will not only depend on the characteristics of the binder. They will also depend, to a large extent, on the inherent characteristics of each soil and the way it has been deposited, as well as on mixing and curing conditions at a particular worksite. Deep Soil Mixing (DSM) is used for stabilization of the soil to a minimum depth of 3 m (a limit depth introduced by EN 14679). The binders are injected into the soil in dry (Dry Deep Soil Mixing) or slurry (Wet Deep Soil Mixing) form through hollow mixing shafts tipped with various cutting tools and equipped with auger flights, mixing blades or paddles to increase the efficiency of the mixing process. The shafts, mounted in single or multiple arrangements, rotate about the vertical axis and produce individual or overlapping soil-mix columns [1,2,3,4].
By overlapping the different soil mix elements, a continuous soil mix wall is built. The soil mix wall is then horizontally stabilized by shoring or anchoring. During execution, steel beams are installed into the fresh soil mix material to resist the shear forces and bending moments due to the earth water pressure applying on the retaining wall. The soil mix material transmits the stresses due to this earth-water pressure to the steel beams by way of an arching effect developing in the soil mix material due to the difference of stiffness between the steel and the soil mix material [5,6,7,8,9,10].
In practice, the implementation of ground improvement using DSM proceeds in three stages. The first stage encompasses the acquisition and analysis of the input data, the second stage is the process of geotechnical design, and the third consists of the performance of works and quality control [11,12,13,14].
The assurance of a high quality of work is fundamental. As the soil mixing is conducted in situ, the equipment and the documentation of the works using advanced production parameters recording systems play a very significant role. Depending on the number and type of sensors mounted on the device, we can get several values describing the process of penetration of the agitator into the ground. Such a procedure allows for large possibilities pertaining to current analysis and interpretation of the works, especially in correlation with the available and complementary soil investigations, particularly with the use of static probes (Figure 1) [9,15]. Current extensive systems allow the registration of parameters such as operating pressure, rotational speed, torque, pressure force, feed speed, or penetration resistance as well as their correlation as a function of depth (Figure 2). The requirements in that respect, listed in the designs and technical specifications, should correspond to good practice standards, which require tracking the development of technologies and cooperation with DSM works contractors. Especially in projects of major importance, it is a good practice to inspect the equipment and the methods as well as perform the registration of the columns on the testing grounds before performing the basic range of works [16].
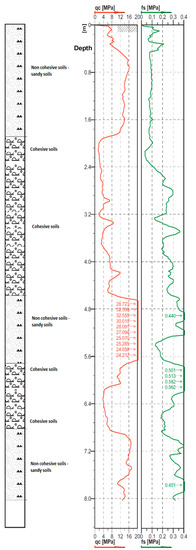
Figure 1.
Example of qc and fs resistance values obtained based on the test conducted using the Cone Penetration Test Unit (CPTU) probe.
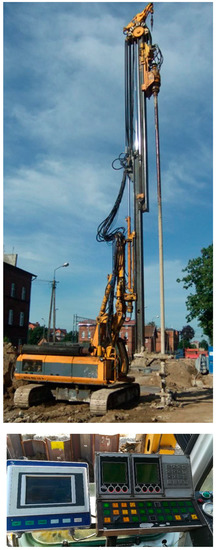
Figure 2.
The machine used for performing Deep Soil Mixing (DSM) columns including the production parameter logging system.
Thanks to measurements made with CPT (Cone Penetration Test) and CPTU (Cone Penetration Test Unit) probes (in-situ measurement), we can get the following parameters: sleeve friction fs [MPa] and cone resistance qc [MPa]. The values are registered each 1 cm of the probe advancement, in each of the geotechnical layers present in the analyzed soil profile. The values of the resistances referred to above precisely reflect the way the column will work at a given depth. From the historical point of view, the problem of estimation of the bearing capacity of a single press-in pile was one of the inspirations to develop static probing. In fact, static probing as an idea may be considered a continuous loading of a testing pile with direct measurement of resistance at the cone and the measurement of the friction of the side surface of the friction sleeve. The problem of scale remains, however, significant [17,18,19,20,21,22].
Comparison of registered values of operating parameters with the resistance under the base of the probe cone qc [MPa] allows for ongoing control and adjustment of the length of columns to the prevailing ground conditions and appropriate depression of the column base in load-bearing soils, under the condition that the design assumptions do not provide otherwise.
This discussion presents the local relationships between the oil pressure of the PKDK rotary head [bar] and the value of the probe cone, as well as the method of interpretation and verification in the context of properly made soil reinforcement. It should be noted, however, that in the assessment of the correct performance of the reinforcement in the analyzed technology, other production parameters, i.e., rotational speed, clamping force, or agitator sink speed, are also relevant. The omission of the aforementioned parameters in an example other than the one presented below may cause an erroneous interpretation of the PKDK agitator working pressure jumps [bar]. The analysis was carried out based on data obtained in the design and implementation of one of the cubature objects in the southern part of Poland, and thanks to the cooperation with a specialist company implementing the scope of reinforcement.
2. Materials and Methods—Analysis of DSM Columns Formation Parameters and of the Results Obtained Using CPTU Static Probes
2.1. Reasons for Ground Improvement
While considering the geological and engineering documentation, the range of the zone of adverse soil conditions for the direct foundation of the building has been established. The weak soil was comprised of made grounds unfit for construction, sandy loams (IIIa and IIIb layer) with a liquidity index of IL 0.60 and silty loams with a liquidity index of IL 0.30–0.80, improved by Deep Soil Mixing. The columns were designed in the location of the load-bearing pillars of the building, in such a way that besides the transfer of the loads caused by the pillars, the columns would also partially transfer the loads caused by the weight of the floor and the service loads for a given category of the structure.
The exact placement of columns under the foundation slab has been adopted based on a soil resistance map from the calculation model of the building structure made in the Autodesk Robot Structural Analysis program and geological and engineering documentation. The maximum load per single column included in individual column groups did not exceed 540 kN. Next, the minimum cement ground compressive strength fc [MPa] that could be obtained after mixing the native soil with cement paste was determined. Assuming an fc value of 2.5 MPa and a column base depression of 1 m in load-bearing layers of clay with an IL degree of 0.00 or sand with a density of ID 0.60, columns with a diameter of Ø = 900 mm meet the ultimate limit condition of load-bearing and usage.
2.2. Circumstances of the Analysis of the Primary Solution
The depth of the conducted improvement was estimated based on geological cross-sections and the interpolation of the strata of the load-bearing soils.
In terms of the design, there were no contraindications to start the works referred to above. A problem was, however, found given the execution of the works. The spacing of the geological boreholes available at that time was approximately 30 m (Figure 3). The depth of geological (profile) holes was reaching 17.5 m p.p.t. The interpolation of the formation of the roof of the load-bearing soils at such a great distance and considering their high variability causes the risk of different local conditions. A decision was thus made to conduct an additional survey using geological boreholes and CPTU probes, which were to allow for obtaining a more detailed mesh of boreholes previously made in that area. Based on the obtained results, a revision of the design of the improvement was planned. Simultaneously, the working parameters of drilling at which the condition of driving the columns in the load-bearing grounds will be fulfilled as provided in the design were established.
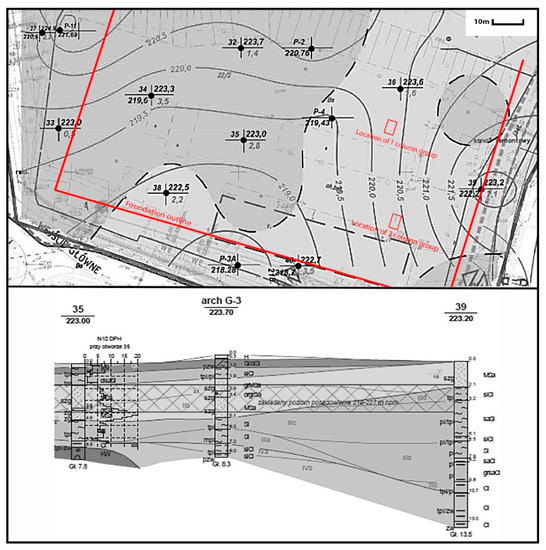
Figure 3.
A fragment of a documentary map with the location of geological boreholes, location of foundation and location of column group No. 1 and 2.
This paper focuses on a selected fragment of the investment area and provides an analysis of the complementary surveys performed using CPTU-probe 8 and CPTU-probe 10 (Figure 4 and Figure 5) performed between the previous boreholes. According to the PN-B-04452-2002 standard, the dependence between the level of plasticity and the resistance at the cone for cohesive and non-cohesive grounds is expressed by simple approximations of measurement results, allowing for a quick determination of the values of IL and ID of the soils at a given depth [4,17,23,24,25,26,27,28].
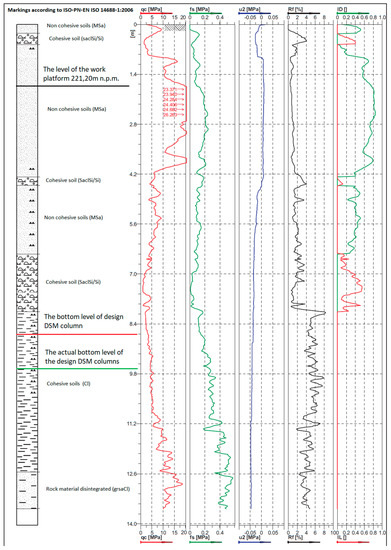
Figure 4.
Results of the complementary CPTU survey—probe No. 8.
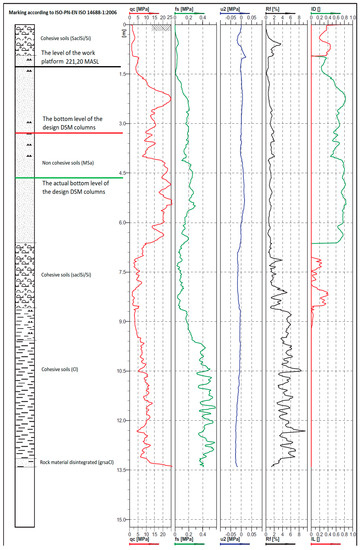
Figure 5.
Results of the complementary CPTU survey—probe No. 10.
Polish Standard does not specify if any or which method should be used for averaging the results of CPT(U) measurements in a single soil stratum.
It needs to be emphasized, that the proper recognition of the subsoil for design purposes can never omit boreholes or at least the macroscopic description of sampled material. After soil classification, it is possible to calculate the parameters of the density and consistency of soils in particular strata.
2.3. Verification Method
The logs of the automatic logger for representative columns as well as the complementary soil survey constituted the basis for the verification of the assumed improvement method and especially of the length of the DSM columns. Based on the analysis, the theoretical datum of the insertion depth of the mixer in the clay stratum with the IL 0.00 liquidity index and the value of the working pressure that should be registered with the device when the soil with such parameters is reached were determined. To determine the base pressure value column No. 454 (Figure 6) was selected for the CPTU-8 probe and column No. 714 (Figure 7) was selected for the CPTU-10 probe.
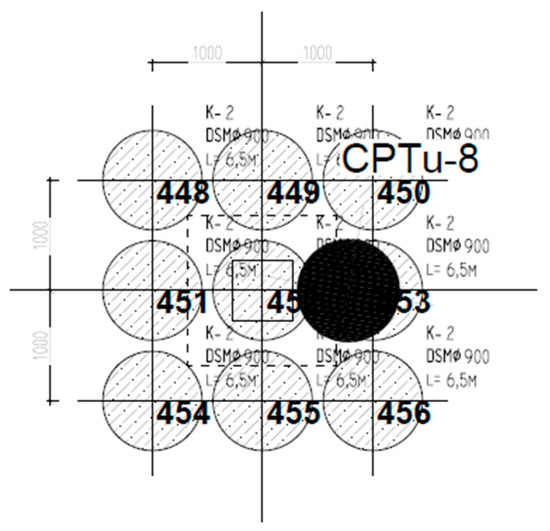
Figure 6.
Group No. 1—made based on the representative column No. 454 and the results of the CPTU-8 probing.
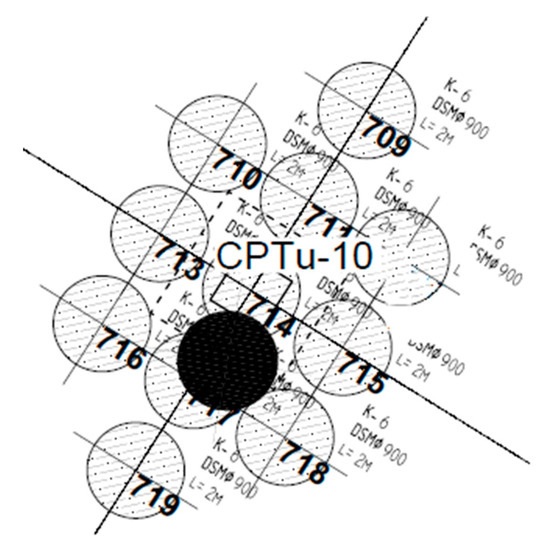
Figure 7.
Group No. 2—made based on the representative column No. 714 and the results of the CPTU-10 probing.
Polish Standard presents a correlative dependence between density index ID of non-cohesive soils and CPT(U) tip resistance qc. The logarithmic relation is
For cohesive soils, we have three different correlations between soil liquidity index IL and tip resistance qc. Soil clay fraction percentage needs to be determined to choose a proper logarithmic function (where fi is clay fraction percentage):
IL = 0.242 − 0.427 log (qc) for fi > 30%
IL = 0.518 − 0.653 log (qc) for 10% < fi < 30%
IL = 0.729 − 0.736 log (qc) for fi < 10%
Based on the equations presented above and laboratory tests carried out, the plasticity level of cohesive soils present in the profile beneath the level of the designed foundation plate was established. It has been found that the resistance value of 6 MPa of the cone of the qc probe would mean that the proper depth for the base of the DSM columns has been reached.
The above served as a basis to develop a method to verify the correct placement of columns in the load-bearing grounds specified in the design.
3. Results and Discussion
The results of the study for two groups of columns with different methods of placing their bases into the load-bearing soil depending on the local soil conditions at the site have been presented below. The first group of columns was designed in such a way that their base was recessed 1.0 m in semi-compact grounds. The columns were to strengthen and transfer loads below the plastic and loose soil lying between 4 and 8 m deep. The columns included in the second group of columns were to be made suspended with the base support in a layer of non-coherent soils, a minimum 2 m, on weak soil (if such was present in the lithological profile). The columns of this group were primarily to unify the settlement of the building without the need to strengthen deep-lying layers of low-bearing soils and appropriate redistribution of loads to the ground.
3.1. Group No. 1—Inserted to the Depth of 1.0 m in the Load-Bearing Soil
In each group of columns, one representative column was made to determine the depth at which the load-bearing soil is located and thus obtain the datum of the pile base. Considering the resistance cone qc, obtained using the CPTU-8 probe (Figure 4) in the first group of columns, their length was assumed to be 7.1 m in relation to the working platform located at 221.20 MASL. At the insertion depth of the columns referred to above, their base would be located in semi-solid clays with a liquidity index of IL 0.05 (qc—5 MPa). Subsequently, the formation of column No. 454 was commenced (Figure 8) while registering the working pressure at a range of depths oscillating around 8 m below the surface. While analyzing the results obtained by the CPTU-8 probe, one may note that at the depth of 8.0 m (6.6 m below the platform level), there is a transition from the stratum of silty loams with a low bearing capacity to the stratum of clays. Thus, a distinct increase in the pressure at that depth could be assumed.
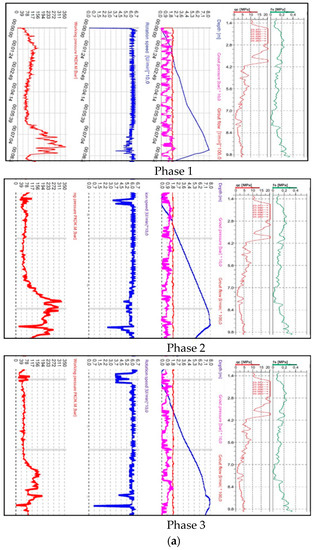
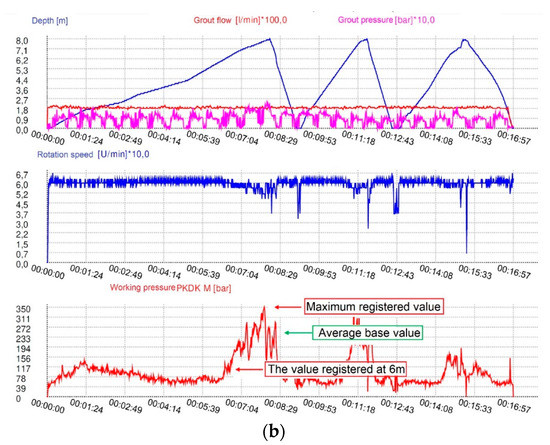
Figure 8.
(a) Dependence of probe resistance (fs and qc) was presented from the level of the working platform to the level of the depression of the column base in the bearing ground broken down into three phases of mixer penetration; (b) Parameters registered by the device during the formation of the 454 representative columns (correlation of qc, fs, and DSM probe working pressure).
As it may be noted in the log of the column No. 454 (Figure 8), a significant surge of pressure occurred with a simultaneous decrease in rotational speed at the mentioned depth of 6 m, which exhibits that the clay stratum was reached. Subsequently, the pressure rises by nearly 290 bar. 270 bar and 55 RPM was thus assumed as the mean base value exhibiting that the load-bearing soil is reached. Further columns of that group were formed in such a manner to achieve the minimal value of the above pressure. Examples of logs of neighboring 448 and 456 columns have been presented in Figure 9 and Figure 10 and present plots of soil penetration depth, rotational speed, and working pressure values expressed as a function of time. It can be seen that for both the 448 and 456 columns, a decrease in rotational speed and a marked increase in operating pressure were recorded at a depth of ca. 6.1 m. From that moment, as the mixing progressed, the rotational speed constantly decreased and the pressure increased, reaching values > 270 bar at a depth of over 7 m, which, in correlation with the results of geological tests, also indicates in this case that the supporting layer has been reached.
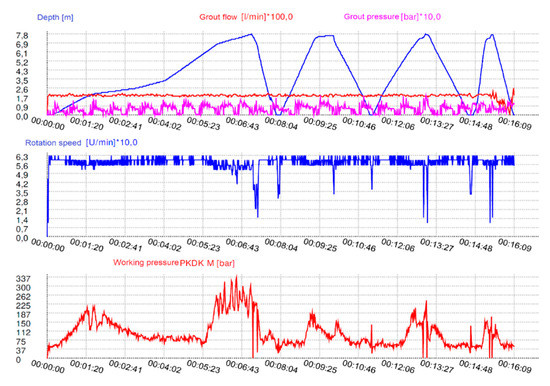
Figure 9.
Parameters registered by the device during the formation of the 448 representative column.
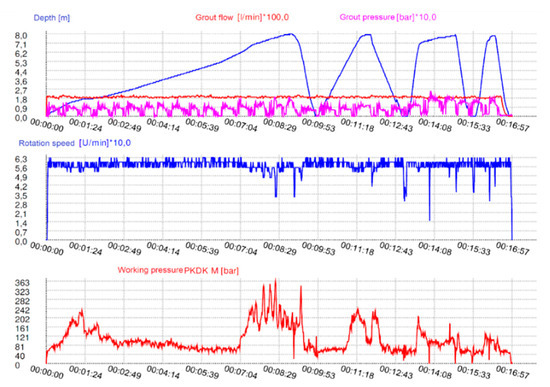
Figure 10.
Parameters registered by the device during the formation of the 456 representative columns.
Moreover, all groups of columns in the near vicinity of the analyzed column were made based on the same guidelines.
3.2. Group No. 2—“Suspended” Columns with Bases Resting on the Load-Bearing Soil at Least 2.0 m above the Weak Soil
The survey conducted using the CPTU-10 probe (Figure 5), confirmed the presence of weak soil at a depth higher than 5.0 m below the surface. Such a configuration of strata allowed us to perform the works in line with the second scheme presented in the technological design of the improvement.
The fulfillment of the assumptions as for the “suspended” columns required a slightly different approach. In line with the designer’s guidelines, the base of the columns should be formed in the load-bearing soil, that is, in non-cohesive soil ID 0.6 or cohesive soil IL 0.00 and should end at least 2 m over the weak soil. Based on this information and the results obtained from the CPTU-10 probe (Figure 5), the initial length of the columns amounting to 2.6 m in relation to the working platform was assumed. At the depth mentioned above, the resistance of the CPTU-10 cone base (Figure 5) amounted to 12 MPa, which exhibited the presence of non-cohesive medium-dense soils with a density level of ID 0.6. The density value was obtained by applying formulas for non-cohesive grounds in line with [5], in the same manner as in the case of group 1 columns.
Subsequently, the representative column No. 714 (Figure 11) was made to determine the working pressure that should be registered using the device while driving the mixer into the stratum. While observing the graph produced by the automatic logger, one may not analogies to the qc resistance values registered while probing this location before. The surge of rotary drive pressure PKDK by a value reaching 162 bar at a depth of approximately 1 m exhibits the passage through the stratum of medium sand in which the qc value registered by the CPTU-10 probe amounted to 20 MPa. After passing through that stratum, a slight drop in the pressure follows the drop in the value of resistance at the cone, and subsequently, a rapid surge to 320 bar occurs at the depth of 3.23 m, which was also accompanied by a decrease in rotational speed. The noted working pressure surge was related to the fact that the mixer reached the medium sand with the density of ID 0.8 (qc—25 MPa) and it was assumed that the mean base pressure value should amount to at least 240 bar while achieving a rotation speed of 60 RPM, which would evidence the sufficient depth of insertion of the column in further considerations.
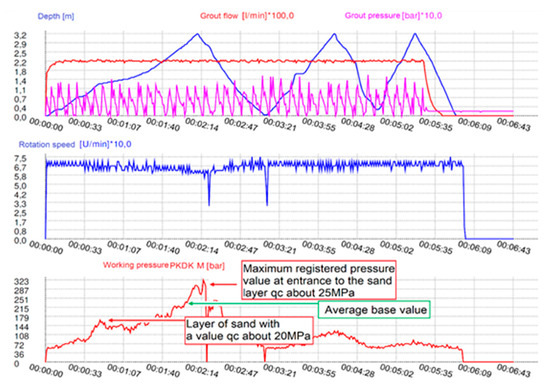
Figure 11.
Parameters registered by the device during the formation of the 714 representative columns.
The log of column No. 719 (Figure 12) formed in one group with the 714 (Figure 11) calibration column presented in the further part of this work, as well as the log of the neighboring column No. 709 (Figure 13) prove the correctness of the assumed method for verifying the depth of base formation. In the graphs of the columns referred to above, pressure surges analogous to those of the test column may be noted, especially in the characteristic points exhibiting the change of the non-cohesive soil density along with the increase of the depth.
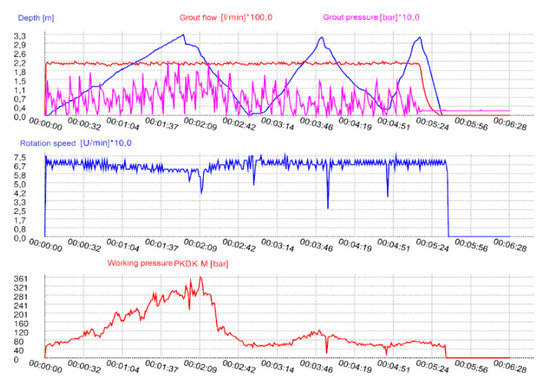
Figure 12.
Parameters registered by the device during the formation of the 719 representative columns.
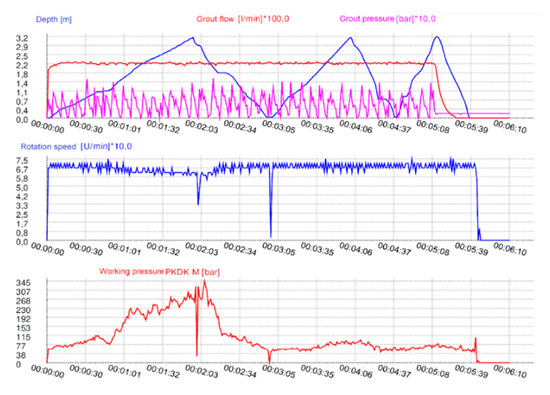
Figure 13.
Parameters registered by the device during the formation of the 709 representative columns.
The above procedure for both cases shown in Figure 9 and Figure 10 and Figure 12 and Figure 13 allows to assume simple dependencies between the PKDK working pressure [bar] value and the qc resistance [MPa], expressed by the following formulas and Figures S1 and S2 (in Supplementary Materials):
For non-cohesive soils:
For cohesive soils:
In addition, in Figure 8a, to directly compare the holes, CPTU parameters, and DSM processing parameters, individual phases are presented over the creation of an example column 454. The figure below it allows also, to evaluate the evolution of the treatment parameters with the number of adopted phases.
It is mentioned that the number of penetration phases and exits as well as the other parameters of the BRN (Blade Rotation Number) mixing index were selected in such a way (applies to all cases analyzed in this article) to ensure the designed compressive strength of the column stem. The most important phase in the context of comparing the operating parameters with the results of the CPTU probe is the first phase of penetration, illustrating the mixing resistance that is left intact by any soil interference.
4. Conclusions
The presented approach to the verification of ground improvement based on the results obtained by the CPTU static probe and the logs of the automatic logger of the boring machine allows to formulate the following conclusions:
- A dependence exists between the resistance of the qc CPTU cone and the value of the working pressure registered by the drilling machine. The value of the pressure and its surges along with an increase in depth, and strictly reflects the type of soil and its parameters.
- As presented in the examples, it may be assumed that non-cohesive dense grounds exhibiting a resistance at the cone of probe amounting to approximately 25 MPa (ID—0.8) and cohesive solid and semi-solid grounds characterized by the qc resistance with a value of approximately 5 MPa generates a surge in the working pressure in the range from 240 to 360 bar. In the case of medium-dense non-cohesive grounds, where the resistance at the cone amounts to approximately 12 MPa (ID—0.6), the value of the working pressure fits within the range of 130 to 170 bar.
- The analysis of the presented results allows us to assume that all the registered values of working pressure below 80 bar may exhibit a high probability of the presence of weak soils in that area.
- The method provided in the paper allows us to verify the correctness of the performed ground improvement and allows for immediate correction of the assumed column formation parameters, shall any irregularities be found. This way, the financial losses of the Contractor and the Investor may be reduced to a minimum.
For both wet as well as dry Deep Soil Mixing, quality control during execution is important to ensure the uniform improvement of the soil and to ascertain the required amount of binder has been mixed uniformly over the entire depth of treatment. For this purpose, the mixing units are equipped with automated computerized recording devices to measure the real-time operating parameters such as depth of mixing tool, volume or weight of binder used, the flow rate of grout, rotation speed, and rate of penetration and withdrawal.
From the above, the best method is always to consider the specific needs of a project and contact specialist contractors to evaluate the needs of the project. Although this evaluation stage may bring additional costs, proper preparation, be it through undertaking trials or field and laboratory testing and intense performance monitoring, will ultimately be recovered in the heightened efficiency with which the ground is secured. A well-managed soil improvement system appropriate to the site will enhance the prospects of on-time and safe project delivery.
Despite the considerable knowledge about basic reaction mechanisms identified for soils stabilized with lime or cement, it is still not possible to predict the strength of in situ mixed soil with a sufficient level of confidence. As a consequence of this fundamental deficiency, which we are challenged to overcome, the development of DSM is to a large extent progressing along a practical path and is therefore dependent on lessons learned and evaluation of observed performance.
Supplementary Materials
The following are available online at https://www.mdpi.com/2076-3263/10/6/216/s1, Figure S1: PKDK dependence on qc on the last 2 m section of the 454, 448, and 456 column cavities in cohesive soils along; Figure S2: PKDK dependence on qc on the last 2 m section of the 709, 714, and 719 column cavities in cohesive soils along.
Author Contributions
Conceptualization, R.J., A.S., G.P., and P.P.; methodology, R.J., A.S., G.P., and P.P.; validation, R.J., A.S., G.P., and P.P.; investigation, R.J., A.S., G.P., and P.P.; writing—original draft preparation, R.J. and A.S.; writing—review and editing, R.J., A.S., G.P., and P.P. All authors have read and agreed to the published version of the manuscript.
Funding
This research received no external funding.
Acknowledgments
The completion of this paper has been helped by the Department of Engineering Works Henryk Chrobok and Hubert Chrobok Sp. J.
Conflicts of Interest
The authors declare no conflict of interest.
| List of Symbolsand Definitions and Main Values Measured from CPTU: qc Cone resistance—qc = Qc/Ac [MPa]. Where the ratio of measured resistance at the end of the cone (Qc) is divided by the projected area of the cone (Ac). fs Sleeve friction—fs = Fs/As [MPa]. Where the frictional force acting on the friction sleeve (Fs) is divided by its surface area (As). Derived Values from CPTU: Friction ratio: Rf = (fs/qt) × 100% Corrected cone resistance: qt = qc + u2 (1 − a) Net cone resistance: qn = qt − δvo Excess pore pressure: Δu = u2 − u0 Pore pressure ratio: Bq = Δu/qn Normalized excess pore pressure U = (ut − u0)/(ui − u0) where: ut is the pore pressure at time t in a dissipation test, and ui is the initial pore pressure at the start of the dissipation test. Other Symbols: PKDK: Rotary drive pressure (working pressure) [bar] fc Design compressive strength [MPa] ID Density index of non-cohesive soils IL Liquidity index of cohesive soils CPTU Cone penetration test with pore pressure measurement—piezocone test Cone: The part of the cone penetrometer on which the cone resistance is measured Cone penetrometer—The assembly containing the cone, friction sleeve, and any other sensors and measuring systems, as well as the connections to the pushrods. |
References
- Topolnicki, M. General overview and advances in Deep Soil Mixing. In Proceedings of the XXIV Geotechnical Conference of Torino Design, Italy, Construction and Controls of Soil Improvement Systems, Torino, Italy, 25–26 February 2016. [Google Scholar]
- Madej, J.S. Ground improvement: Terminology and methods classification. Mari. Eng. Geotechni. 2015, 3, 525–528. [Google Scholar]
- Wojtasik, A.; Łęcki, P.; Troć, M.; Dojcz, P. Geotechnical Conditions and Soil Improvement Techniques Applied in Construction of the A2 Motorway in Poland. In Proceedings of the 2nd International Conference on Problematic Soils, Petaling Jaya, Malaysia, 3–5 December 2006. [Google Scholar]
- Rzeźniczak, J. Reinforcement of weak subsoil. Geoengin. RoadsBridgesTunn. 2007, 1, 34–42. [Google Scholar]
- Wiłun, Z. Outline of Geotechnics; Communications and Connection Publisher Sp. z o.o.: Warszawa, Poland, 1976. [Google Scholar]
- Livingstone, S.J.; Piotrowski, J.A.; Bateman, M.D.; Ely, J.C.; Clark, C.D. Discriminating between subglacial and proglaciallake sediments: An example from the Dänischer Wohld Peninsula, nor-thern Germany. Quat. Sci. Rev. 2015, 112, 86–108. [Google Scholar] [CrossRef]
- Long, M.; Boylan, N. In situ testing of peat—A review andupdate on recent developments. Geotech. Engin. J. Seags Agssea 2012, 43, 41–55. [Google Scholar]
- Robertson, P.K. Interpretation of cone penetration tests—A unified approach. Can. Geotech. J. 2009, 46, 1337–1355. [Google Scholar] [CrossRef]
- Tanaka, H. Sample quality of cohesive soils: Lesson from three sites, Ariake, Bothkennar and Drammen. Soils Found. 2002, 40, 57–74. [Google Scholar] [CrossRef]
- Topolnicki, M. Ground improvement instead of piling—Effective design solutions for heavily loaded structures. In Proceedings of the International Conference on Deep Foundations and Ground Improvement, Rome, Italy, 5–7 June 2018. [Google Scholar]
- Nowacki, P.; Łęcki, P. DSM columns as a palisade protecting the excavation. Geoeng Roads Bridges Tunn. 2006, 2, 54–56. [Google Scholar]
- Nowacki, P.; Łęcki, P. DSM columns as a palisade protecting the excavation for the concert hall of the Music Academy in Poznań. Eng. Constr. 2005, 9, 511–512. [Google Scholar]
- Ellen, M.C.; Berg, R.R.; Collin, J.G.; Filz, G.M.; Terashi, M.; Yang, D.S. Federal Highway Administration Design Manual: Deep Mixing for Embankment and Foundation Support; Research, Development, and Technology Turner-Fairbank Highway Research Center: Georgetown Pike McLean, VA, USA, 2013.
- EN 14679 Execution of special geotechnical works—Deep mixing; British Standards Institution: London, UK, 2003.
- Gwizdała, K. Pile Foundations, Technologies and Calculations; Scientific Publisher PWN: Warszawa, Poland, 2010. [Google Scholar]
- Topolnicki, M. Good application and design practice of wet Deep Soil Mixing (DSM). In Proceedings of the XXXII Nationwide Workshop of a Construction Designer; Polish Standardization Committee: Wisła, Poland, 2017. [Google Scholar]
- Sikora, Z. Static Probing, Methods and Application in Geoengineering; Scientific and Technical Publisher: Warszawa, Poland, 2006. [Google Scholar]
- Kłosiński, B.; Bażyński, J.; Frankowski, Z.; Kaczyński, R.; Wierzbicki, S. Instructions for Testing the Subsoil of Road and Bridge Constructons, Part I; Institutional Report; General Directorate of Public Roads: Warszawa, Poland, 1998. [Google Scholar]
- Wahl, D.A.J. Variable Penetration Rate Cone Testing for Characte-Rization of Intermediate. In Soils Geotechnical and Geophysical Site Characterization 4; Taylor & Francis Group: London, UK, 2013; pp. 25–42. ISBN 978-0-415-62136-6. [Google Scholar]
- Krage, C.P.; Albin, B.M.; Dejong, J.T.; Degroot, D.J. The influence of in-situ effective stress on sample quality for intermediate soils. In Proceedings of the 5th International Conference on Geotechnical and Geophysical Site Characterisation, Gold Coast, Australia, 5–9 September 2016; Australian Geomechanics Society: Sydney, Australia, 2016; Volume 1, pp. 565–570, ISBN 978-0-9946261-1-0. [Google Scholar]
- Lunne, T.; Berre, T.; Andersen, K.H.; Strandvik, S.; Sjursen, M. Effects of sample disturbance and consolidationprocedures on measured shear strength of soft marine Norwegian clays. Can. Geotech. J. 2005, 42, 1–50. [Google Scholar]
- Mayne, P.W. Interrelationships of DMT and CPT Readings in soft clays. In Proceedings of the Second International Flat Dilatometer Conference, Washington, DC, USA, 2–5 April 2006; Civil & Environmental Engineering, Georgia Institute of Technology: Washington, DC, USA, 2006; pp. 231–236. [Google Scholar]
- Robertson, P.K. Interpretation of In-Situ Tests Some Insight. In Geotechnical and Geophysical Site Characterization 4; Taylor & Francis Group: Boca Raton, Florida, FL, USA, 2012; Volume 1, pp. 3–24. [Google Scholar]
- PN-B-04452:2002—Geotechnical Field Research; Polish Standardization Committee: Warsaw, Poland.
- Evans, D.J.A.; Philips, E.R.; Hiemstra, J.F.; Auton, C.A. Subglacial till: Formation, sedimentary characteristics and classification. Earth-Sci. Rev. 2006, 78, 115–176. [Google Scholar] [CrossRef]
- Stefaniak, K. Assessment of shear strength in silty soils. Studia Geotechnica Mechanica. 2015, 37, 51–55. [Google Scholar] [CrossRef]
- Tanaka, H.; Nishida, K. Suction and shear wave velocity measurements for assessment of sample quality. Stud. Geotech. Mech. 2007, 29, 163–175. [Google Scholar]
- Czado, B.; Wrana, B. Bearing capacity of pile foundations based on CPT results in accordance to Polish Standards and Eurocode 7. Agh J. Min. Geoengin. 2012, 36, 2. [Google Scholar]
© 2020 by the authors. Licensee MDPI, Basel, Switzerland. This article is an open access article distributed under the terms and conditions of the Creative Commons Attribution (CC BY) license (http://creativecommons.org/licenses/by/4.0/).