Article

Assessment of Infrastructure Vulnerability to Tsunamis upon the Coastal Zone of Oman Using GIS

by
Mohamed E. Hereher
1,2
1
Geography Department, College of Arts and Social Sciences, Sultan Qaboos University, 123 Muscat, Oman
2
Department of Environmental Sciences, Faculty of Science, Damietta University, 34517 New Damietta, Egypt
Geosciences 2020, 10(5), 175; https://doi.org/10.3390/geosciences10050175
Submission received: 4 April 2020 / Revised: 7 May 2020 / Accepted: 8 May 2020 / Published: 10 May 2020
(This article belongs to the Section Natural Hazards)

Abstract

:
The coastal zones of Oman are frequently exposed to tropical cyclones and are expected to be overwhelmed by tsunami waves that originate from marine earthquakes in the Indian Ocean. Inundation of low-lying coastal lands is, hence, inevitable. This study aims to provide a spatial database of the major infrastructure of Oman in relation to their vulnerability to the sea-level rise by tsunamis. This investigation relied on high-resolution elevation data obtained from the Advanced Spaceborne Thermal Emission and Reflection Radiometer-Global Digital Elevation Model (ASTER GDEM) and eleven infrastructure variables acquired from the Oman National Spatial Data Infrastructure. These variables include: schools, hospitals, banks, mosques, fuel stations, police centers, shopping centers, archeological sites, vegetation cover, roads and built-up areas. A Geographical Information System (GIS) analysis was carried out to delineate and quantify the features along the coast with elevation ranges between 1 and 10 m above the current sea-level. Four tsunami scenarios were investigated depending on historical and expected estimations of tsunami heights of 2, 5, 8 and 10 m at the shoreline from previous studies. Results provide spatial vulnerability maps and databases that could be of the utmost importance to planners and developers. Al-Batinah coastal plain of northern Oman is the most vulnerable location to tsunami hazards due to its low-elevated coastal plain and high concentration of population, infrastructure and services. The study asserts the benefits of GIS as a geospatial analysis tool for risk assessment.

1. Introduction

Risk assessment of natural hazards is a key element in order to perform long-term management for risk reduction along coastal regions. The coastal zone is, typically, the region that extends to 100 km from the coastline or that lies between the coastline and the contour line of 50 m above sea-level [1]. About 60% of the world population lives along coasts [2], and a wide range of socio-economic activities, such as urbanization, recreation, tourism, trade, energy production, and industrial activities, occur at or near coasts [3]. There are many reasons for the rise in the sea-level; some of them are slow and the others are sudden. Slow changes include the eustatic movements of the sea-level by melting of ice, tectonic adjustments, steric changes by thermal expansion, and by the global warming from excess emissions of greenhouse gases [4]. Unfortunately, data for the slow rise in the sea-level along the coasts of Oman are scant, however, this change is inferred from global estimates. According to [5], the sea-level rose only 16–21 cm between 1900 and 2016 and it is expected that the sea-level will continue rising until the end of this century by about 70 cm [6]. This slow change could cause flooding along coastal low-lands below 1 m level. For example, [7] reported that the rise of the sea-level by 1 m could overwhelm an area of 6165 km2 along the Nile Delta coast of Egypt, which occurs below 1 m level. [8] also found that 980 km2 occurs below the 1 m level along the Red Sea coast of Saudi Arabia. The coastal elevation, hence, plays the most crucial rule in the exposure to the sea level rise. Tsunami and tropical cyclones are considered catastrophic natural hazards, where their potential threat on population, buildings and infrastructures of the coastal areas cannot be overlooked [9]. Tsunami waves are one of the most violent natural hazards accountable for the big loss of life and the massive destruction of property throughout history [10]. One deadly example of these disasters is the Sumatra tsunami in December 2004, which caused more than 200,000 causalities from 14 countries in the Indian Ocean within a few hours [11]. On the other hand, the 2011 tsunami in Japan resulted in more than 15,000 deaths and damaged buildings, dams, nuclear power stations and many other infrastructures. World Bank estimates of the economic cost due to the 2011 tsunami in Japan was US$ 235 billion, making it the costliest natural disaster in world history [12].

1.1. Tsunamis in the Sea of Oman and the Arabian Sea
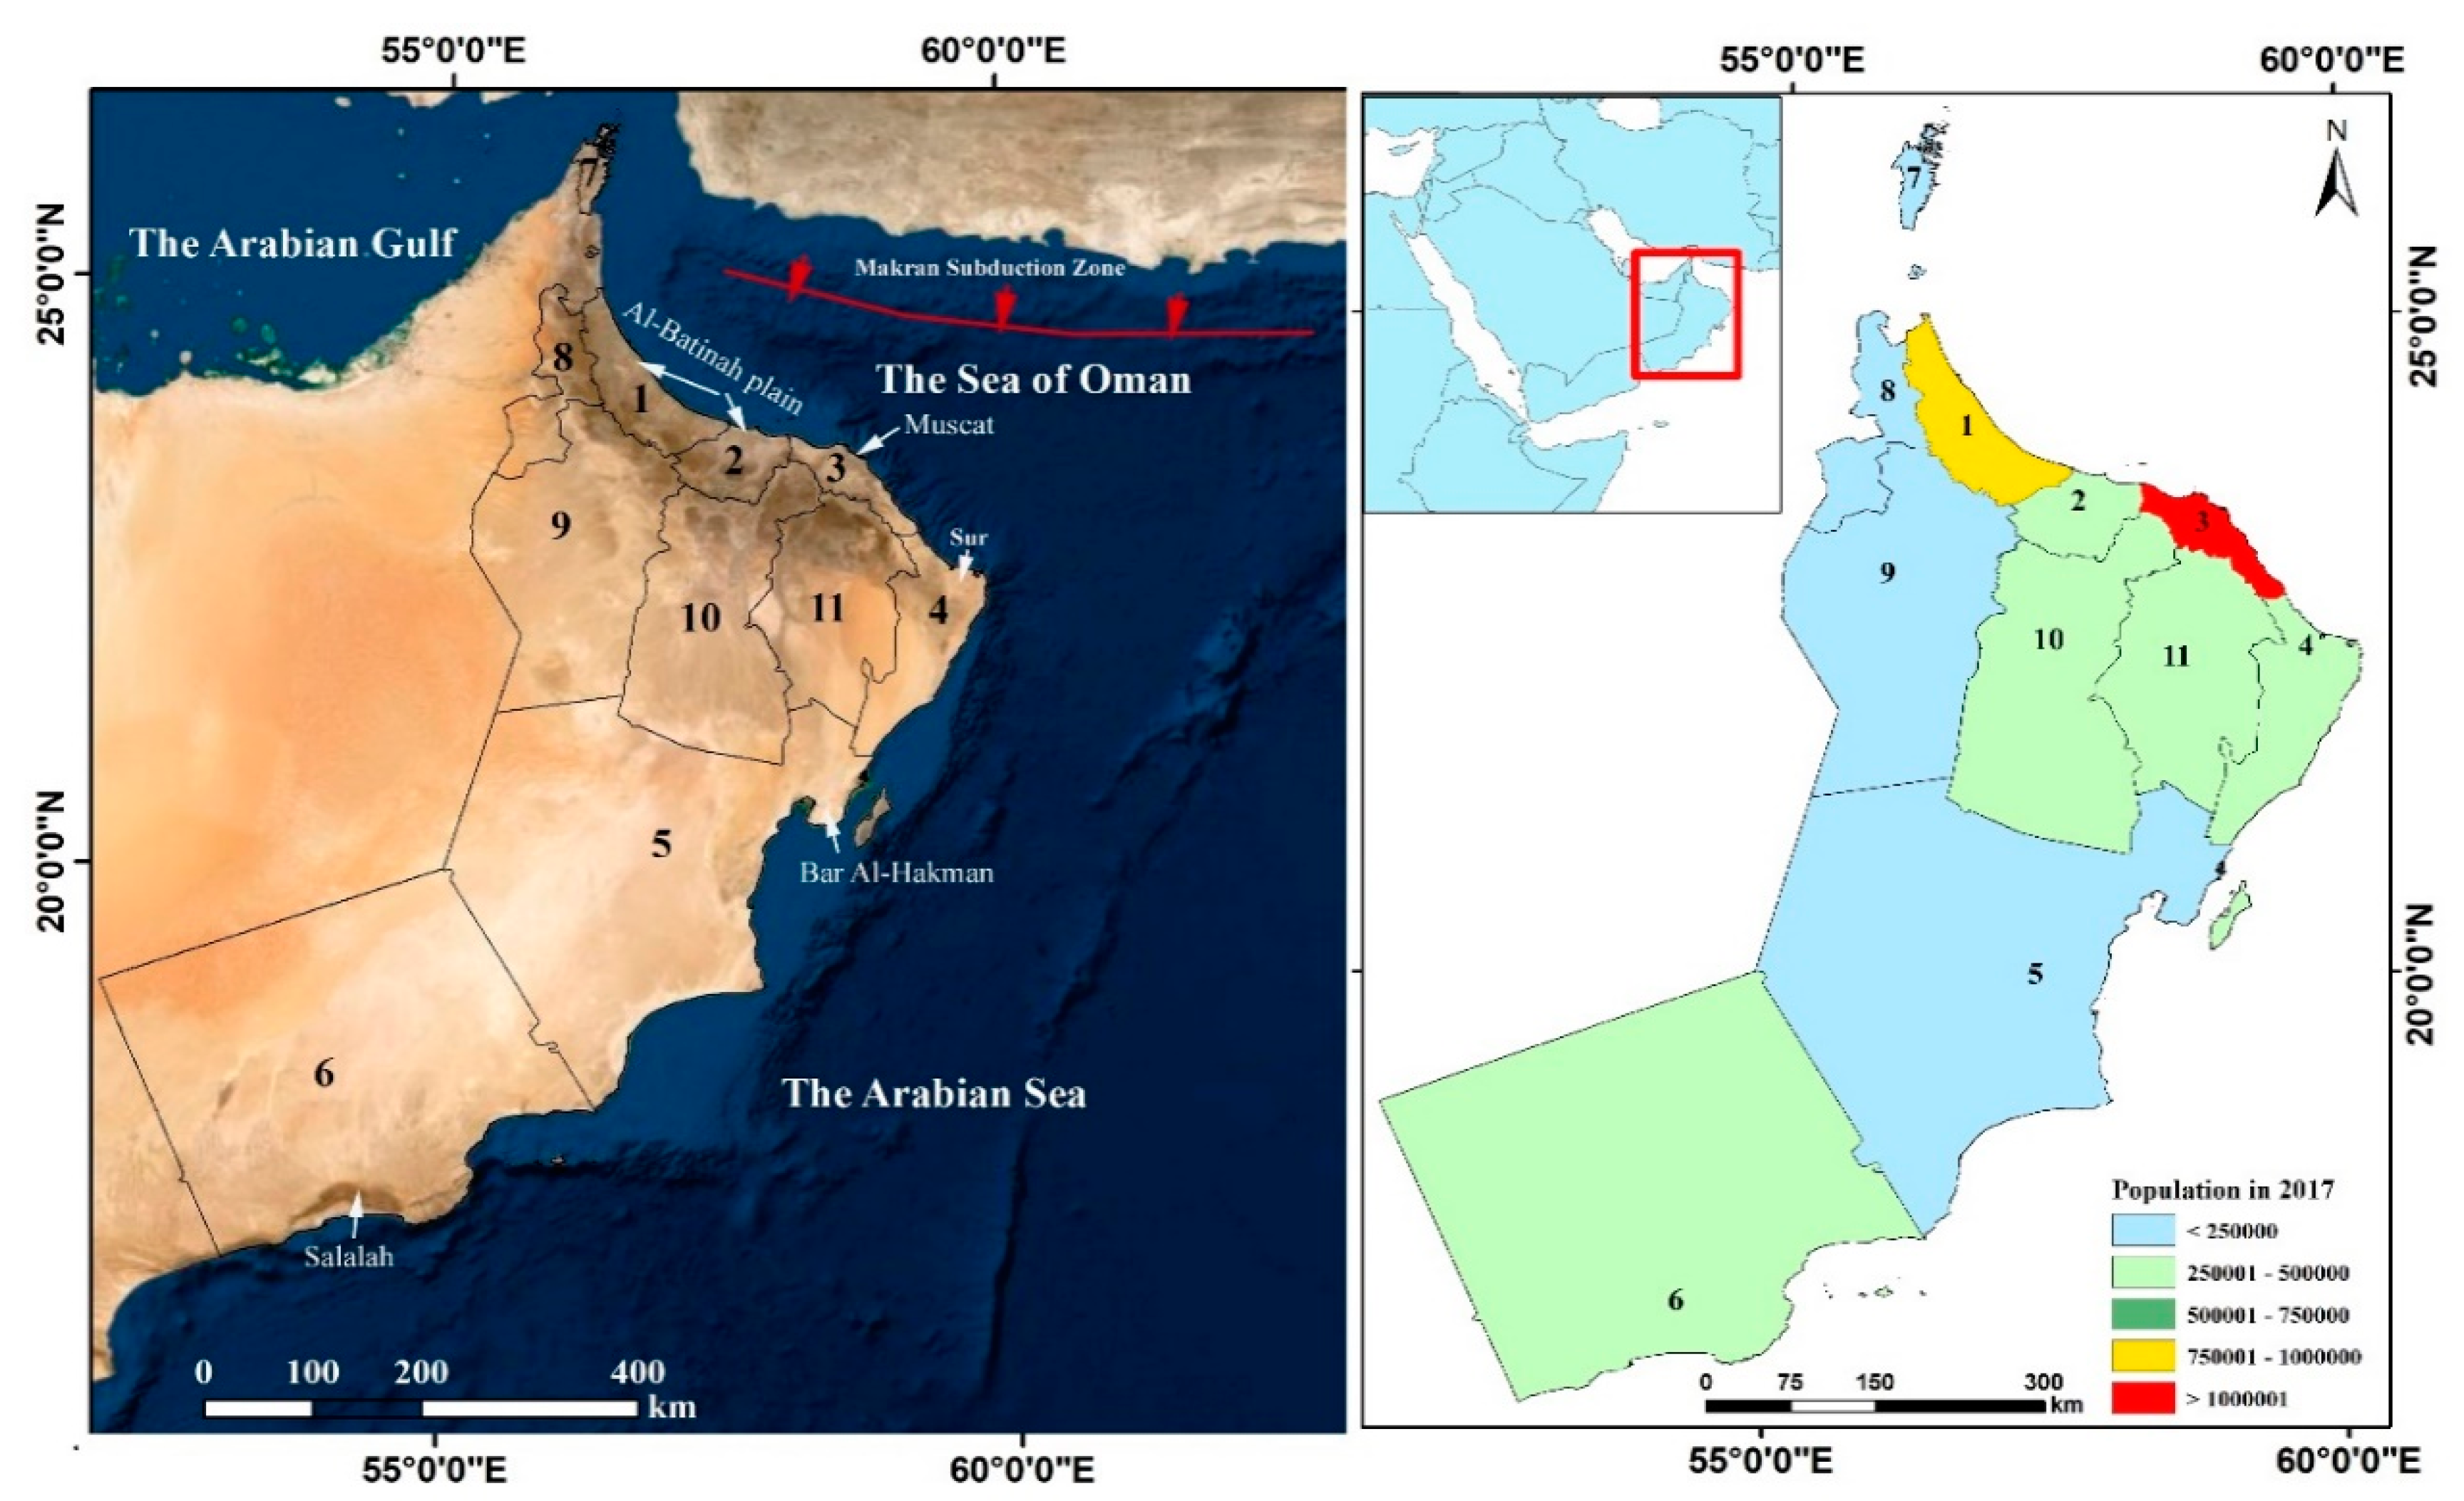
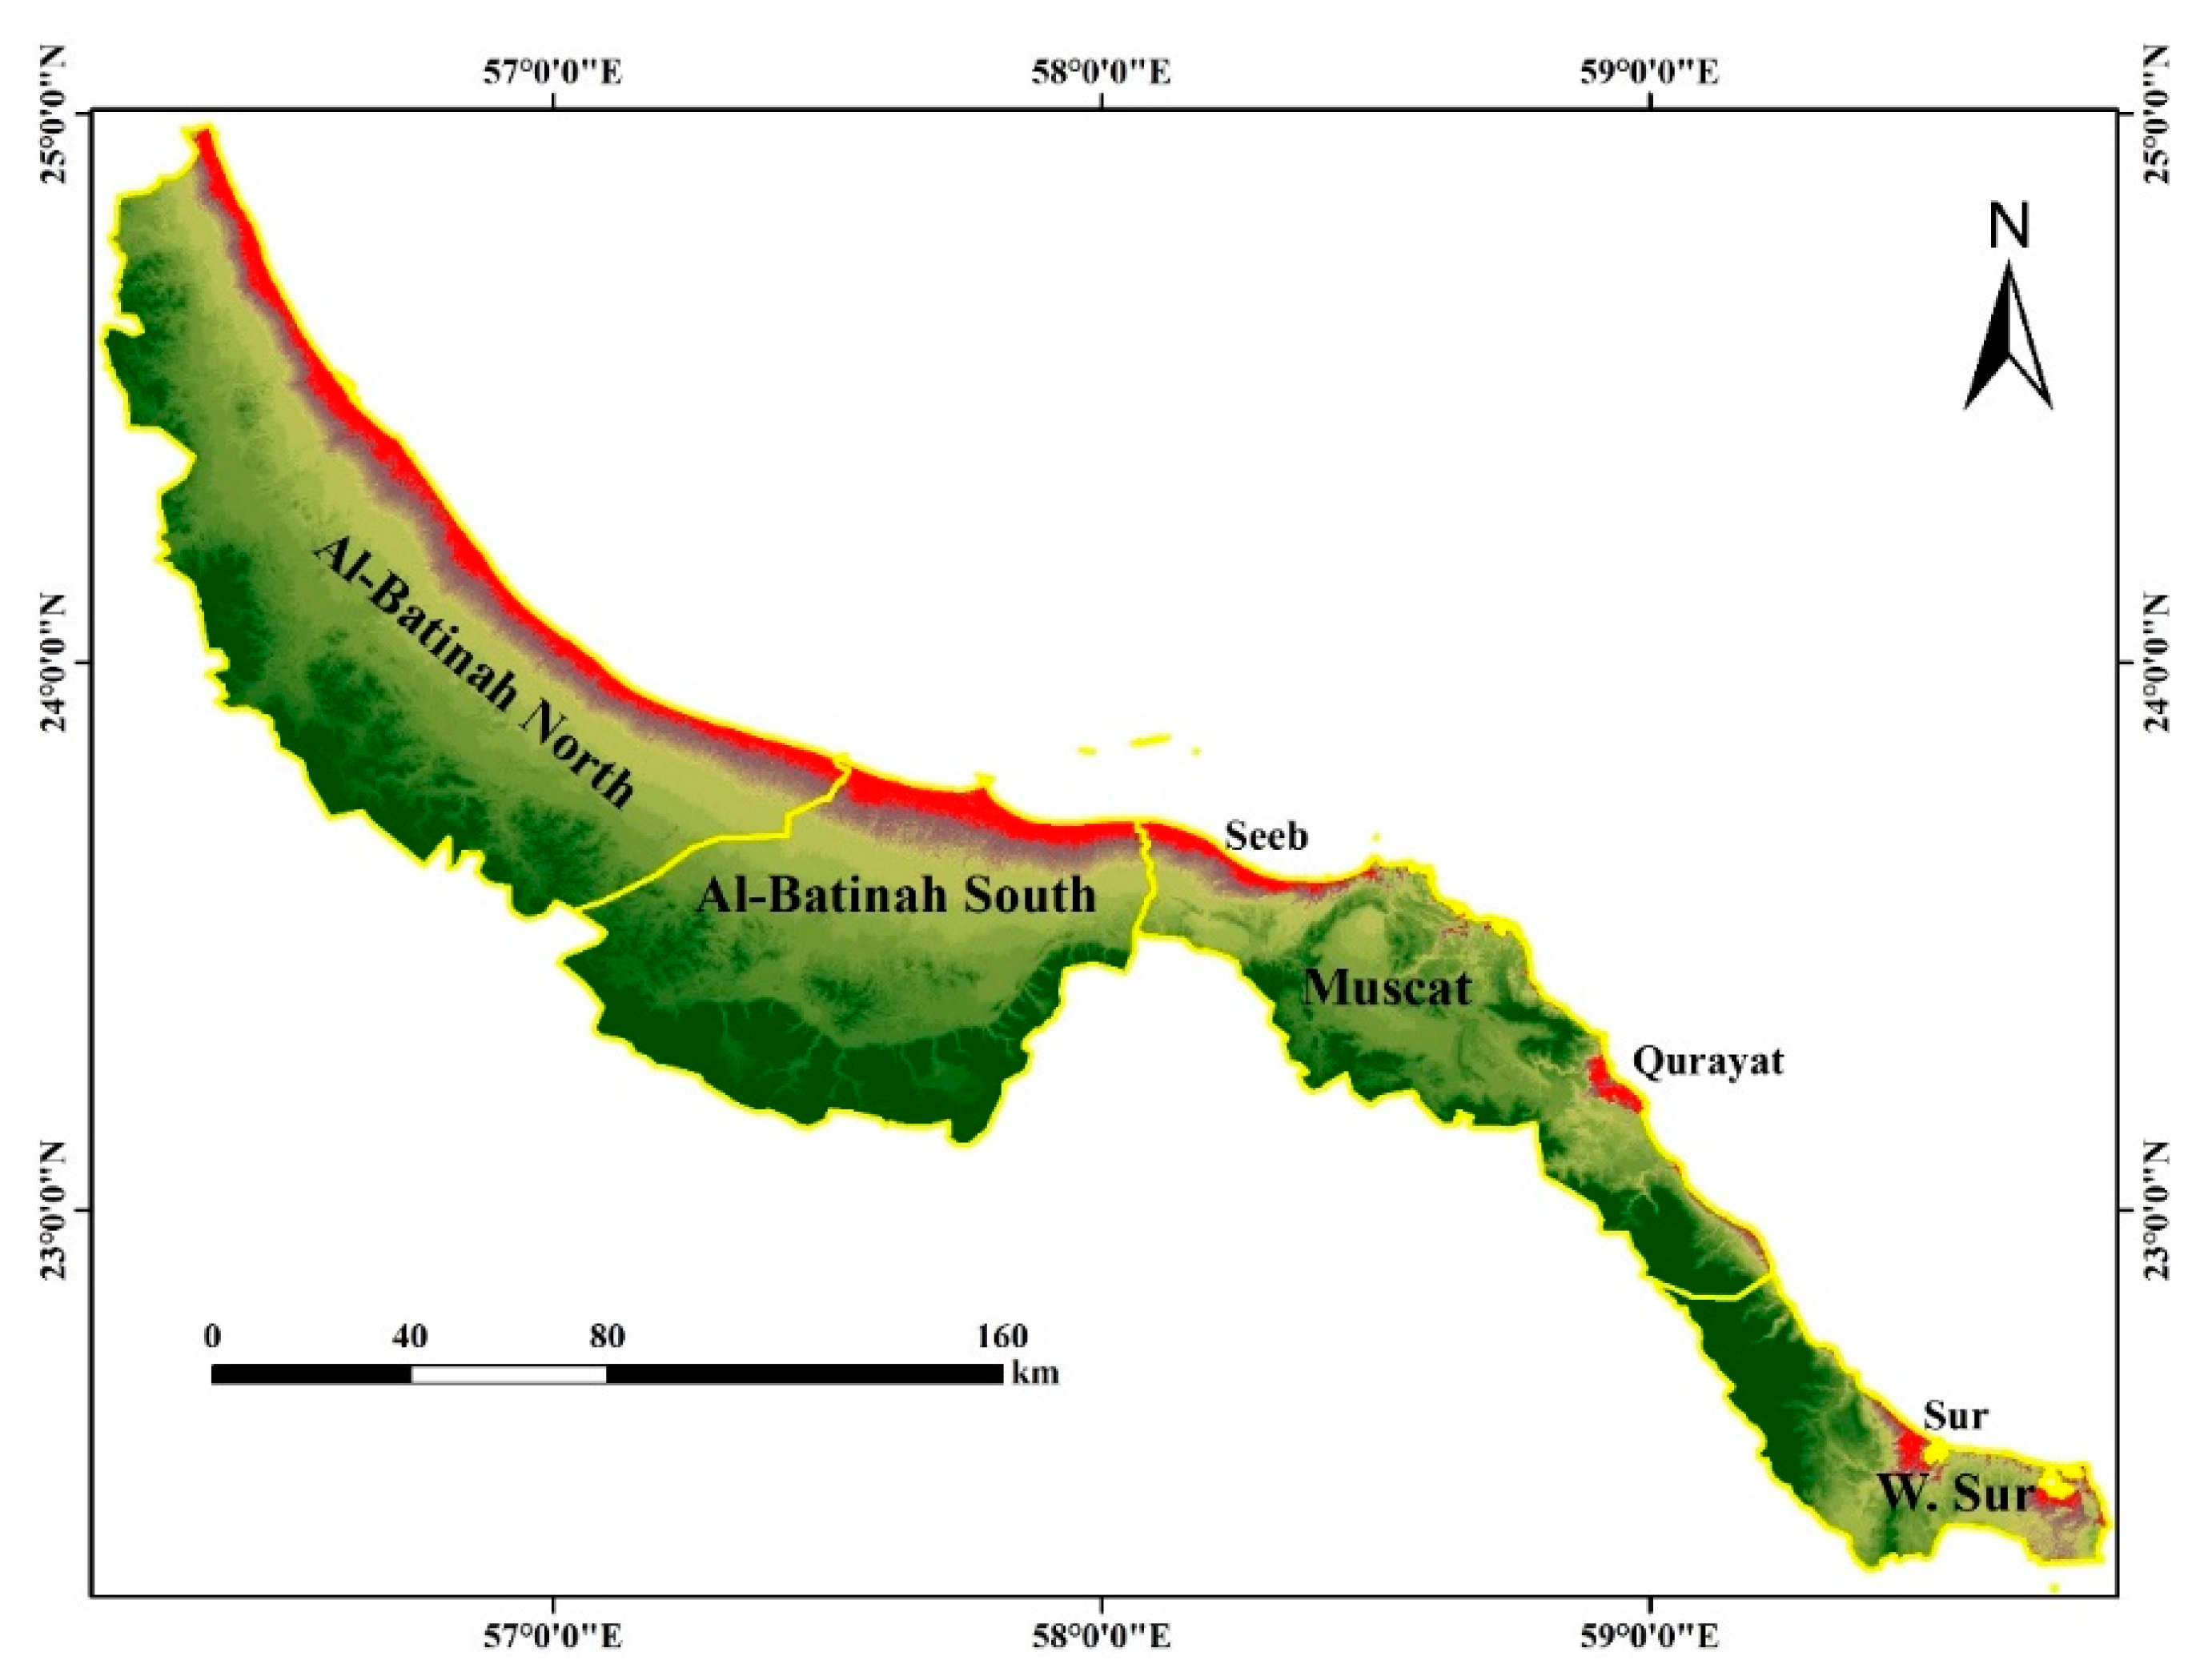
Historically, the shores of Oman were repeatedly hit by tsunamis [13]. The Makran Subduction Zone (MSZ) in the Sea of Oman and the Sunda/Sumatra Subduction Zone are the hot spot locations susceptible to marine earthquakes in the Indian Ocean [14,15]. The largest recorded tsunami in the Sea of Oman occurred after a big earthquake (Mw 8.1) along the MSZ on the 27th of November 1945 [16]. The death toll of this tsunami approached 4000 fatalities and the waves raised to 5–12 m along the countries surrounding the Sea of Oman, particularly in Pakistan [17]. Most assessment of tsunami hazards in the world is based upon a previous tsunami record, which is called the direct statistical tsunami hazard assessment (DSTHA) [18]. Since there is no much record of paleo-tsunamis in the Arabian Sea region, the assessment of tsunami hazards depends on the probabilistic approach using a database of seismic events. This approach is referred to the probabilistic tsunami hazard assessment (PTHA) [19,20]. Hence, from a hazard perspective, most of the scenarios of tsunami waves are built upon hypothetical assumptions related to different magnitudes of the presumable earthquake along the MSZ [18].
In the literature, different scenarios of marine earthquakes originating in the Indian Ocean anticipate the arrival of high tsunami waves into the coastal zone of Oman within a short period of time from the onset of the earthquake [12,21,22,23]. Two important concepts should be observed when talking about tsunami hazards: The tsunami wave height and the tsunami run-up height. The first refers to the absolute height of the wave above the sea-level in the sea, but the run-up height denotes the tsunami vertical height above the sea-level at its inland furthest point [21]. In the study of [23] to estimate the probabilistic assessment of an earthquake of 8.8 Mw along the eastern side of MSZ, they predicted tsunami waves arriving on the northeast coast of Oman at about 2 m height. In the study of [14] using the numerical modeling and simulation of the 1945 tsunami, they suggested that a similar earthquake (Mw = 8.1) occurs along MSZ will produce tsunami waves of 5 m height along the coasts of Oman. Reference [18] assumed a different scenario that an earthquake of Mw > 8 occurring in the Sea of Oman along the southwest coast of Pakistan could initiate tsunami waves at northern Oman coast with a run up height of 7.8 m. The worst-case scenario was suggested by [24] with a possible Mw > 9 earthquakes in the MSZ resulting from the full rupture of the plate boundary. This devastating tsunami will be associated with run-up heights of up to 10 m along nearly all of the coastal areas in the Sea of Oman region. In all previous cases, it is obvious that large earthquakes occur along the MSZ should be accompanied by tsunami waves that will impact the coasts of Oman. Moreover, these studies point out to the Sea of Oman coasts as susceptible to tsunamis.
Tropical cyclones, on the other hand, are also frequent natural hazards occurring in the Arabian Sea [25,26,27]. Recently, the Cyclone Gonu; the strongest cyclone that occurred in the Arabian Sea [25] hit the coast of Muscat and the eastern coast of Oman in June 2007. There were 49 causalities and about US$ 4 billion damages in the infrastructure [26]. Another strong tropical cyclone; i.e., Phet hit the coast of Oman in June 2010 leaving 40 causalities and about US$ 1 billion [26]. This was the second-largest tropical cyclone in the Arabian Sea. In May 2018, the Cyclone Mekunu struck the southern coast of Oman at the Dhofar region. Although there were damages in the infrastructure, the alarming programs and government plans succeeded to significantly minimize the number of causalities. These cyclones are not only associated with the high waves along coastal areas but they are also accompanied by high flooding in streams and highlands from intense precipitation [27].
Coastal elevation is usually obtained from digital elevation models. For local studies, very high-resolution Digital Elevation Models (DEMs) can be produced by airborne-based Light Detection and Ranging (LiDAR) systems. Yet, these DEMs are expensive to derive and are, hence not widely available at regional and global scales [28,29]. The Shuttle Radar Topography Mission (SRTM) is another platform providing elevations at reasonable spatial resolution (90 m and 1000 m). Nevertheless, there are concerns about the accuracy, which leads to problems in local or regional analyses [30]. In some cases, the vertical accuracy is lowered by 5–9 m in rugged and sloping terrains [31]. The ASTER GDEM is the finest available dataset of elevation on regional and global scales using multiple stereo-pairs imaging. ASTER is a complex optical remote sensing unit onboard Terra satellite and is composed of three sub-systems; visible and near-infrared (VNIR), shortwave infrared, and thermal-infrared radiometers [32]. With precise ancillary measurements, stereo-image pairs from both nadir and backward views are used to generate highly accurate DEM without ground control points [33,34]. ASTER GDEM data were, therefore, utilized in numerous elevation studies with high confident results [35,36]. GIS is a powerful tool to process and analyze spatial information (raster and vector). It allows users to create interactive queries and produce spatial results from all logical operations [37]. GIS was used in previous studies to assess socio-economic vulnerability to coastal hazards [38,39,40].
The present study aims to utilize GIS tools in order to extract the coastal zones of Oman ranging from 1 to 10 m above the sea-level from the GDEM and to perform spatial analysis to delineate the type and quantity of each infrastructure feature upon each elevation level. Since the heights of tropical cyclone waves vary in place and time depending on the meteorological behavior of cyclone itself, it is difficult to predict the wave heights for future cyclones. However, for tsunamis in the Sea of Oman, as the tsunamigenesis source has been investigated with different scenarios based on historic and probabilistic assessments, this study is exclusive to study the vulnerability of Oman coastal zone to tsunamis. Four different scenarios of tsunami heights at the shoreline from previous studies were investigated to estimate the inundation area and consequently, the vulnerability of the infrastructure damages are assessed. These scenarios were implemented depending on the heights of either historical tsunamis, such as the 1945 earthquake, or upon the predictions reported in the literature. These scenarios are the 2 m [23], the 5 m [14], the 7.8 m [18] and 10 m [24]. As the DEM has a vertical resolution of 1 m, the 7.8 m scenario was rounded to 8 m. The study assumes that for any of the previous scenarios, there are associated run-up heights of 2, 4, 8 and 10 m and each run-up height is constant along the entire coast of Oman for that scenario. This investigation is of utmost importance to developers and decision-makers for coastal zone management.

1.2. The Study Area

The Sultanate of Oman occurs along the southeastern corner of the Arabian Peninsula with a total area of 309 thousand km2. The country occurs within the subtropical region between latitudes 16° and 28° N and longitudes 52° and 60° E and overlooks three water bodies: The Arabian Sea in the south and east, the Sea of Oman in the north and the Arabian Gulf in the northwest (Figure 1). The Arabian Gulf is a shallow sea, whereas both the Sea of Oman and the Arabian Sea are deep oceanic basins. Oman possesses shorelines extending for more than 3000 km from the Strait of Hurmuz in the north to the Yemen borders in the south. The coastal zone of Oman is characterized by different inherent topography, geomorphology and land use. The coastal zone is relatively narrow (~50 km) at the northern coast along the Sea of Oman as the Al-Hajar Mountain series run parallel to the shoreline. A coastal plain known as Al-Batinah plain, which hosts the major population communities and agriculture in Oman, occurs between the mountains and the Sea of Oman. On the other hand, the eastern coast of the country is generally rocky except for some sandy beaches and sabkha flats. Major human settlements along the eastern side occur in the south along the foot of the Dhofar mountains. This eastern coast is annually exposed to the SW monsoon winds from June to September and bring abundant vegetation to the Dhofar province [41]. The remaining country is a hot and arid desert of annual precipitation less than 100 m and annual temperatures approach 45 °C in summer and fall to 15 °C in winter [42].
The coasts of Oman host important ecosystems, such as coral reefs and mangroves. Major mangrove patches occur along the northern coast [43]. This vegetation is associated with the outlets of the main streams along the Sea of Oman. On the other hand, coral reefs cover a total area of 530 km2 along the maritime region of the country [44]. The eastern coast of Oman also holds a sand sea of a coastal front of 170 km along the Arabian Sea. Oman is divided into 11 administrative units called governorates with the capital Muscat along the Sea of Oman. These governorates are; in the same order as in Figure 1: 1—Al-Batinah North; 2—Al-Batinah South; 3—Muscat; 4—Ash Sharqiya South; 5—Al-Wusta; 6—Dhofar; and 7—Musandam; 8—Al-Burayimi; 9—Adh Dhahirah; 10—Dakhiliya; and 11—Ash Sharqiya North. According to the National Center of Statistics and Information [45], population of Oman, which exceeded 4 million in 2017, mostly occurs along the northern coast. Al-Batinah plain of north Oman, which includes Al-Batinah North and Al-Batinah South governorates, is the major region of agriculture in the country. Water resources rely on the groundwater aquifers of the region. Among the 11 governorates of Oman, seven have coastal fronts (1—Al-Batinah North; 2—Al-Batinah South;, 3—Muscat; 4—Ash Sharqiya South; 5—Al-Wusta; 6—Dhofar; and 7—Musandam). Each governorate consists of many administrative units called Willayat (district). For example, Muscat Governorate consists of six Willayat with the largest in area is called Qurayat. Among the total 61 Willayat in Oman, there are 41 Willayat within the coastal seven governorates. There is a dense road network covering the entire country. Three levels of roads are used in Oman: 1—Speedways, which are inter-governorate roads connecting the northern region with Dhofar and running mostly in the middle of the country; 2—Highways, which are the second level and predominates in the eastern governorates; and 3—Streets, which spread in all governorates and connect towns and neighborhoods together. These streets are the most dominant all over the country. Oman has undergone extensive development projects along the coast due to the oil and gas discoveries. Thousands of kilometers of paved roads, projects, services and urban lands were built in the country, particularly along the coast.

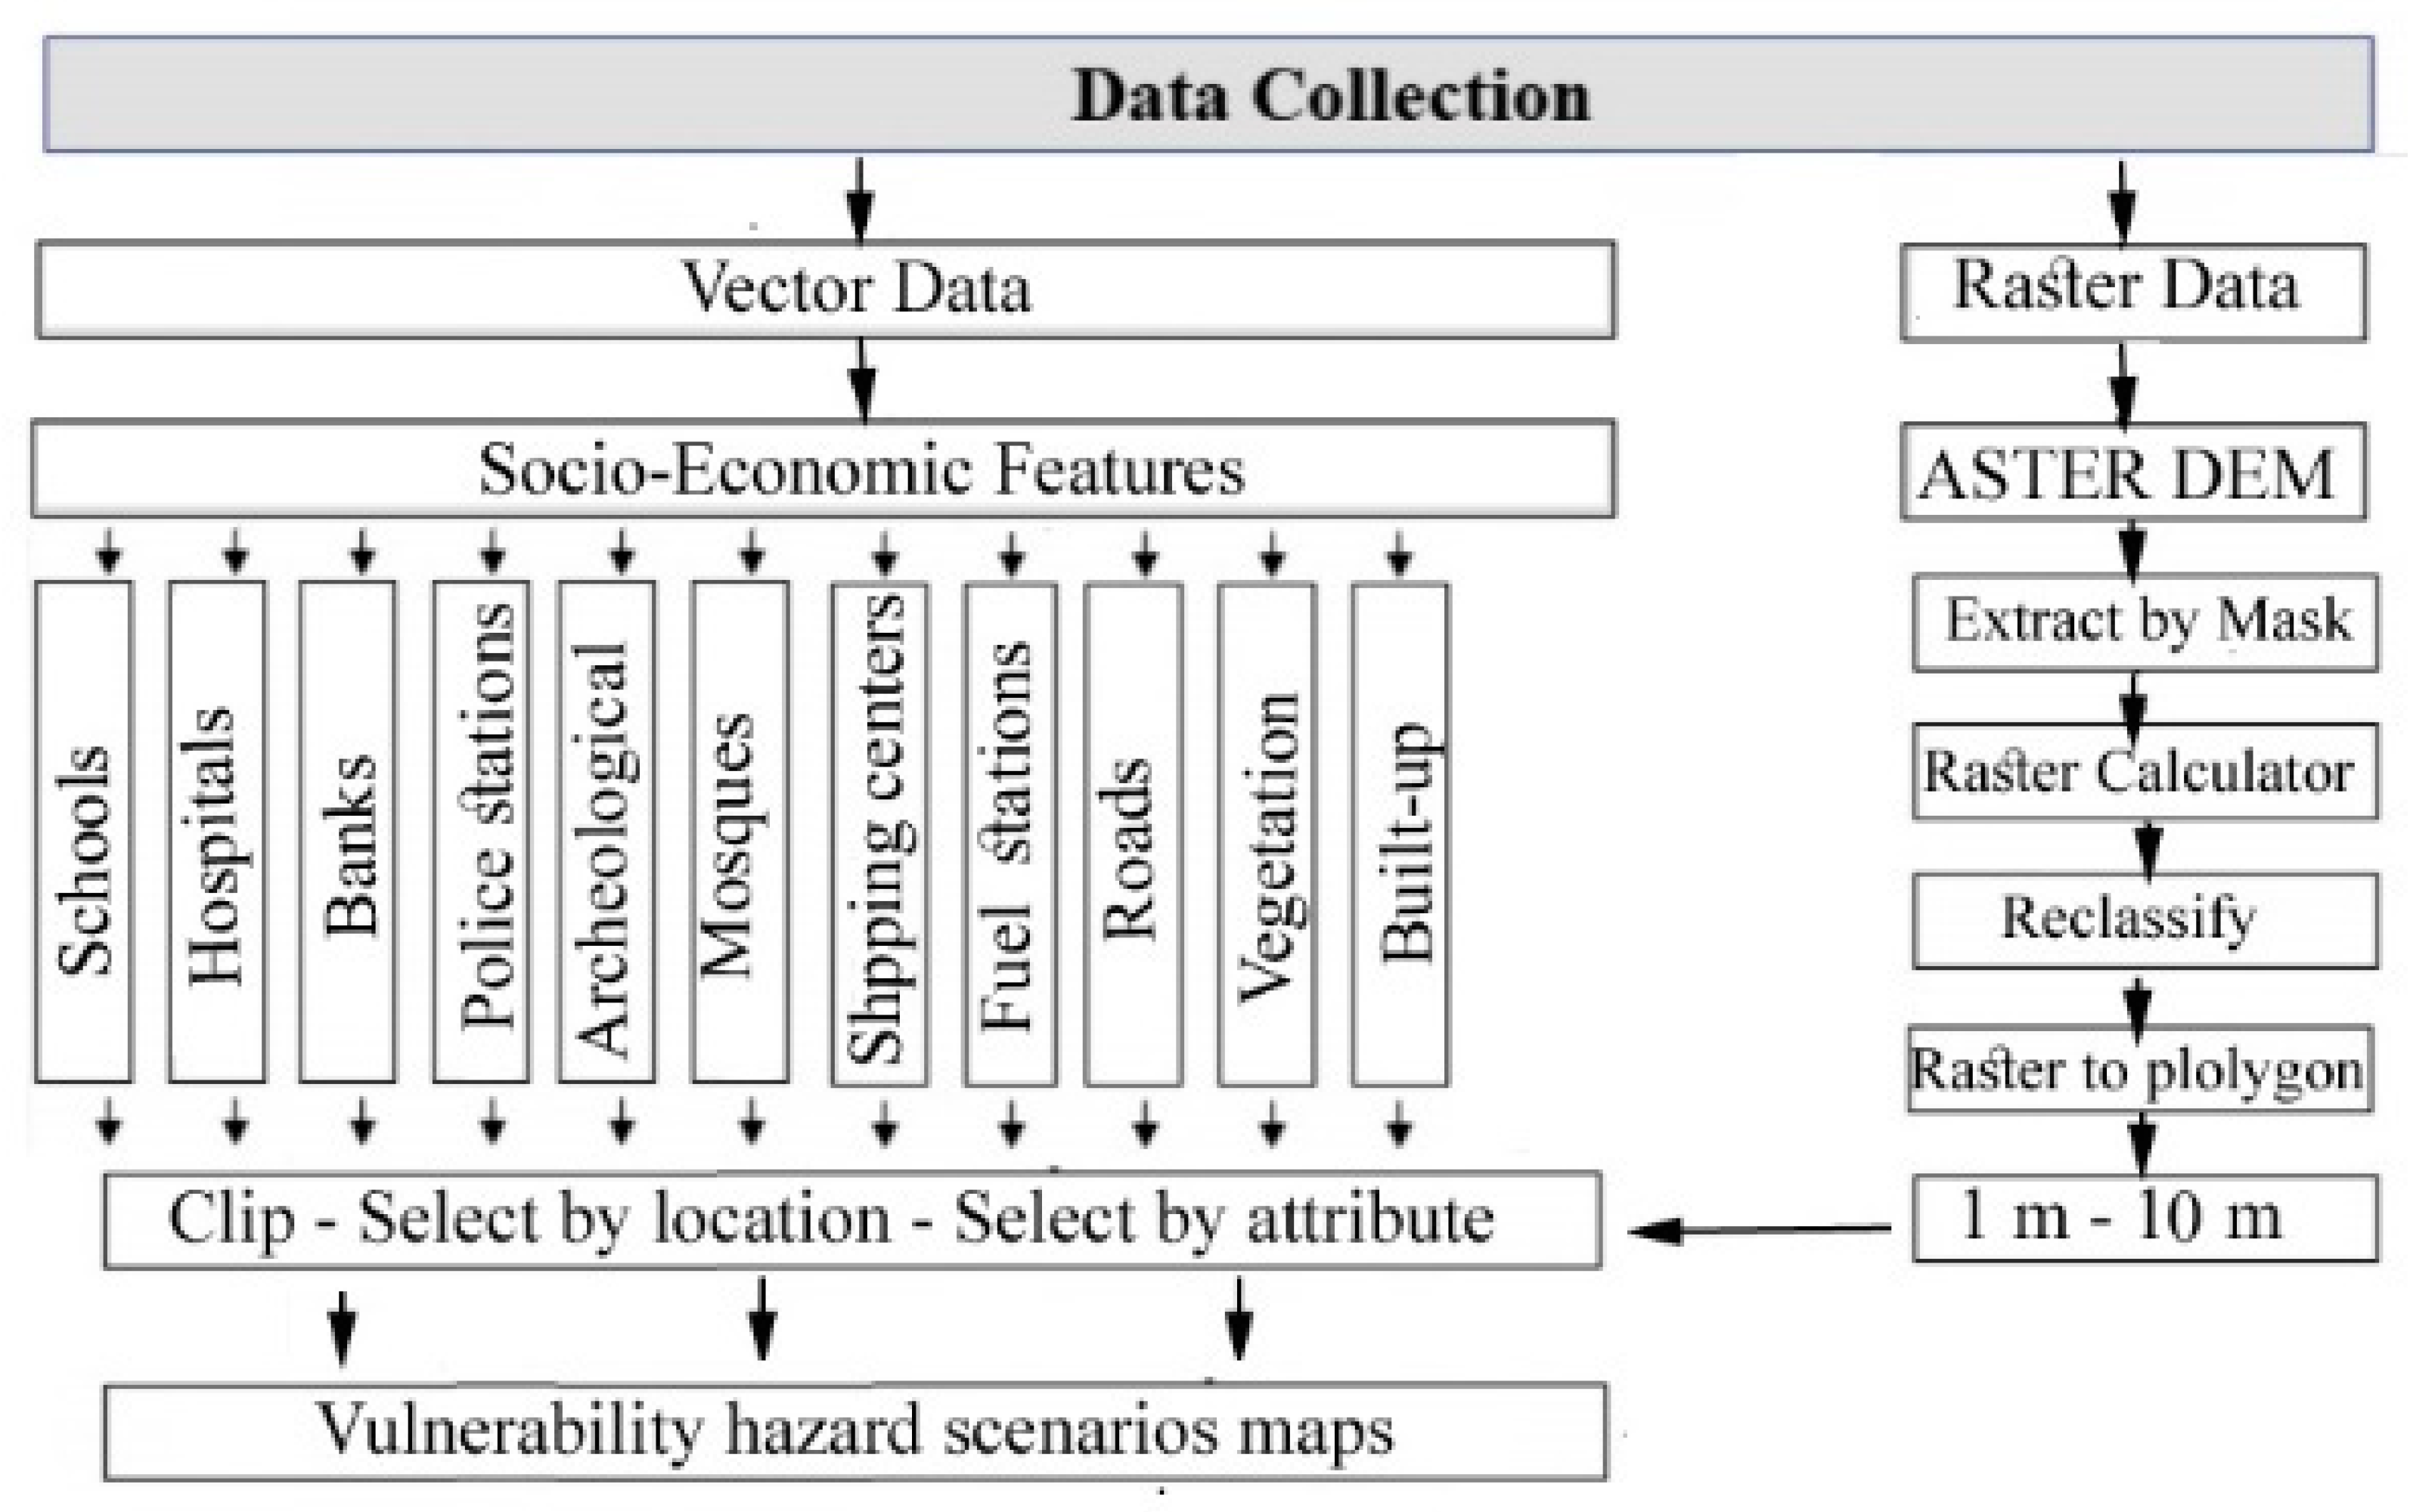
2. Materials and Methods
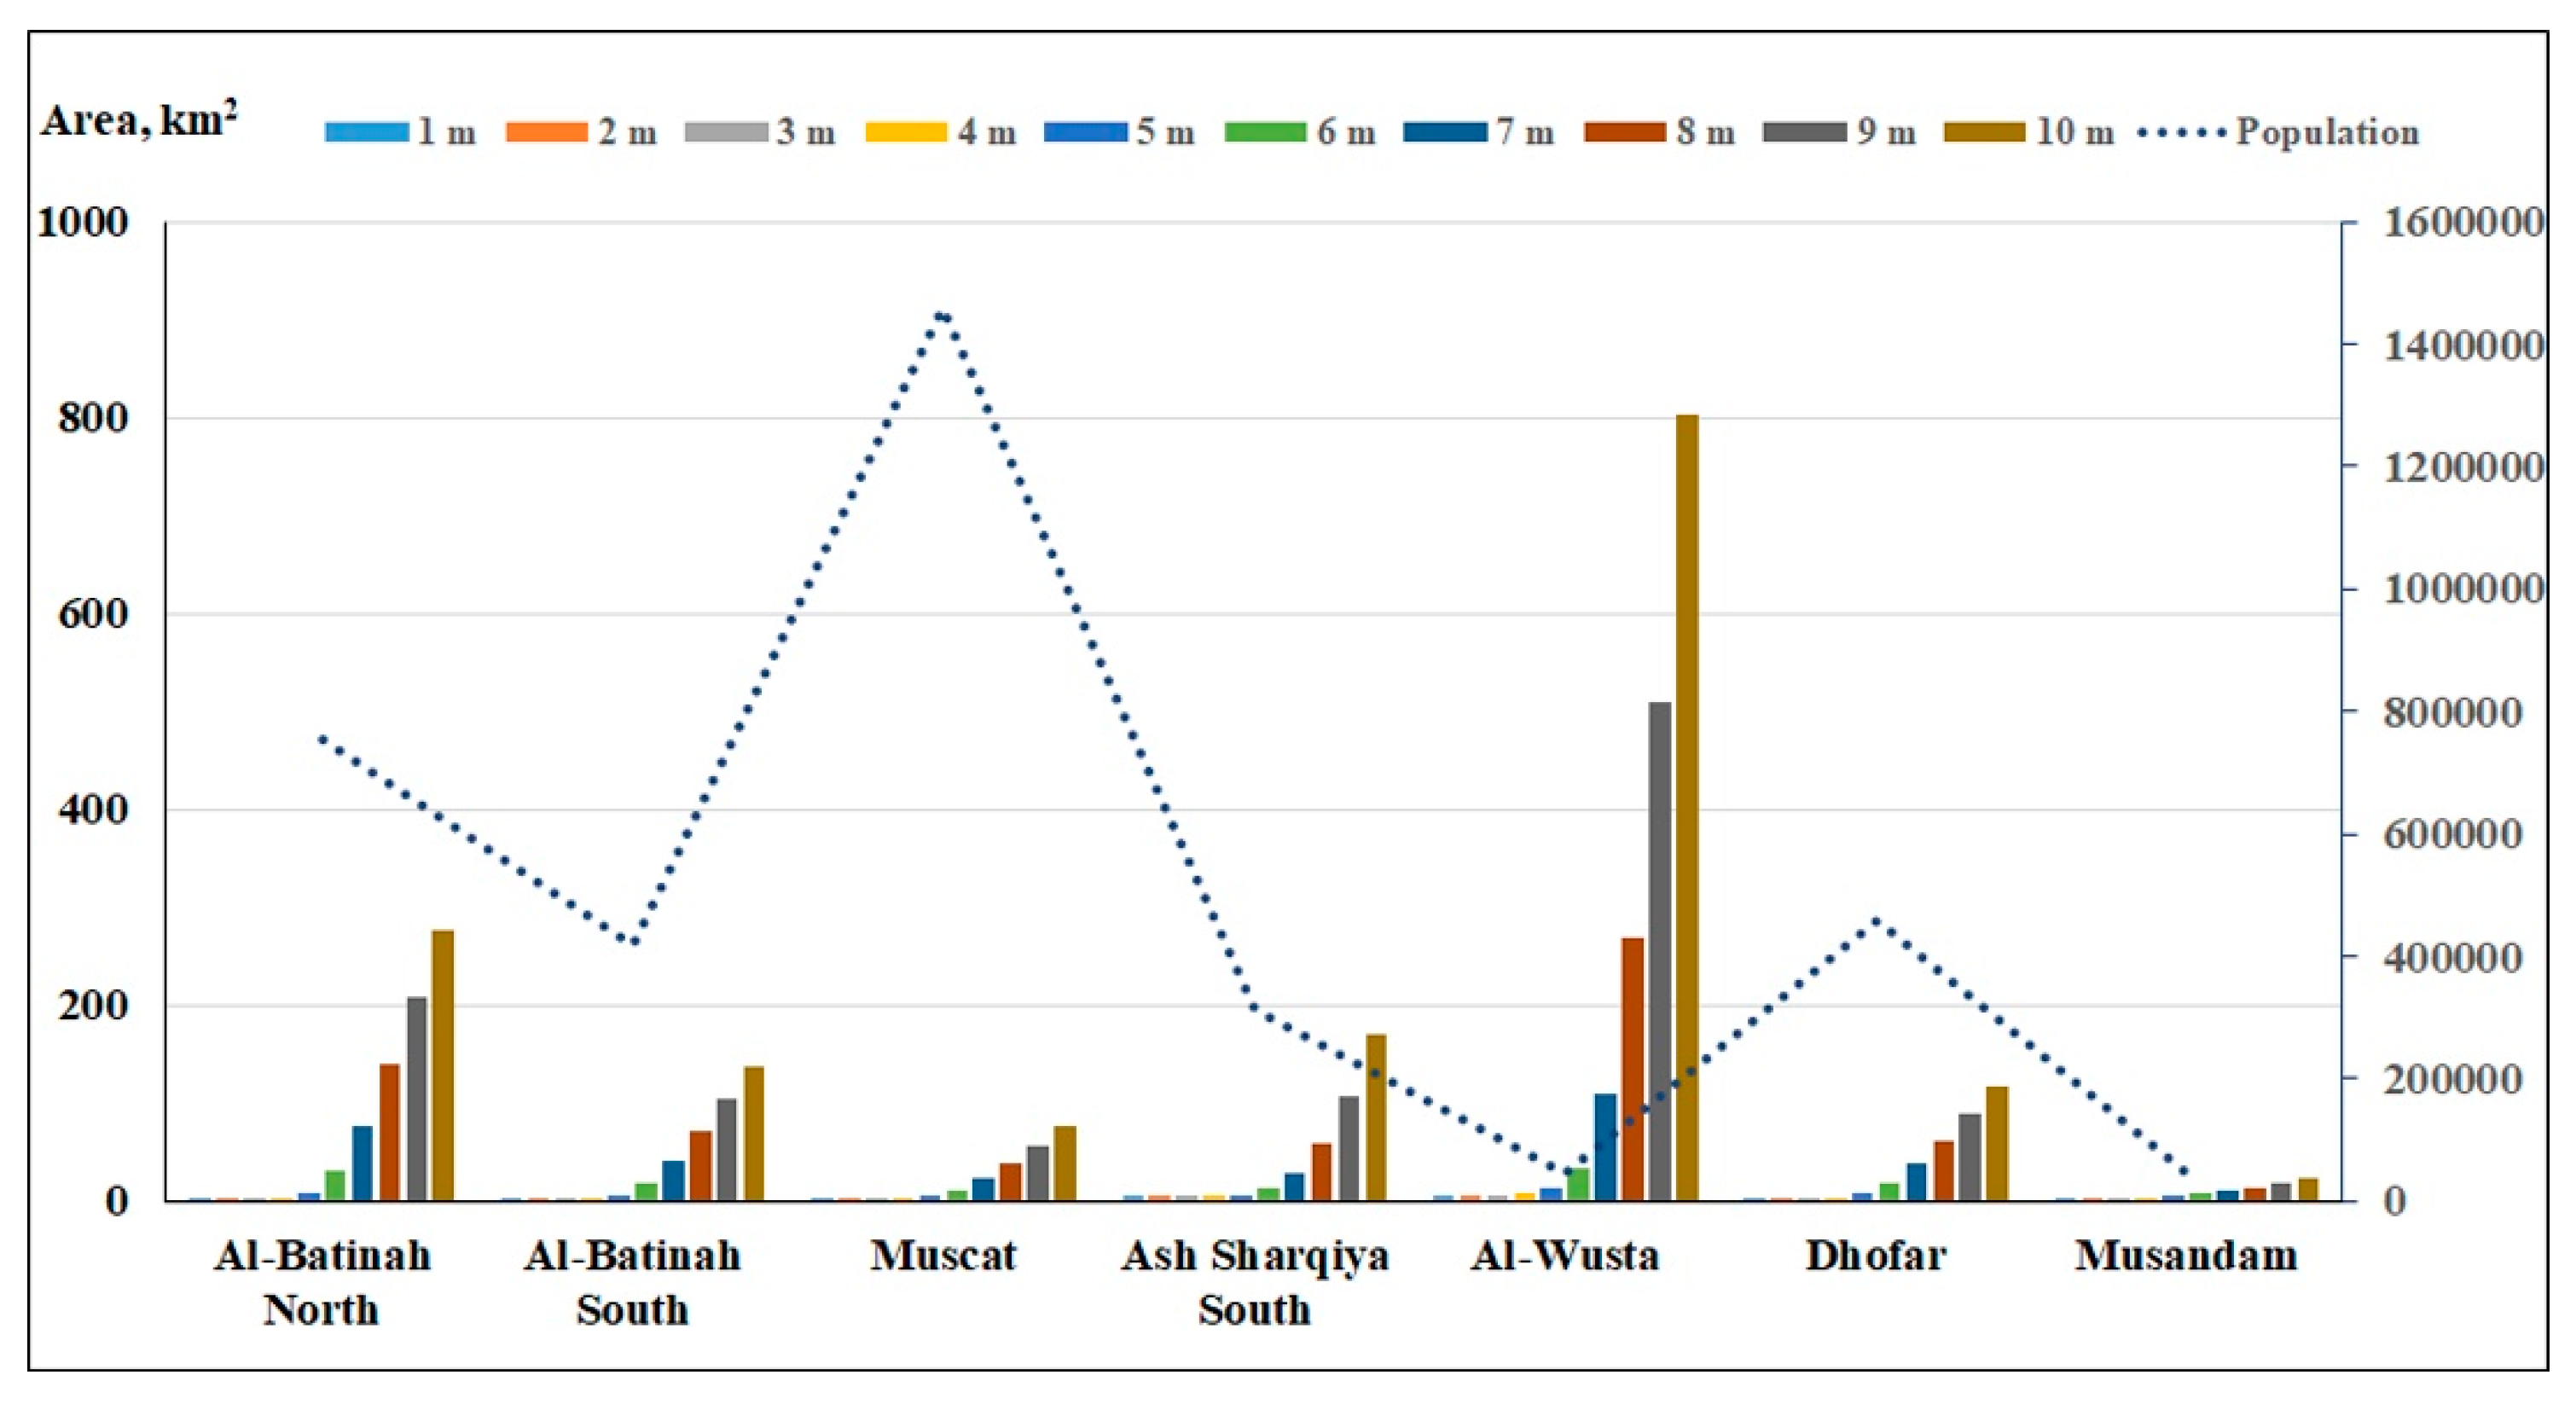
The data operated in this study were obtained from both raster and vector sources. Digital elevation models are raster dataset provided by the ASTER GDEM, which was released by the U.S. National Aeronautics and Space Administration (NASA) and Japan’s Ministry of Economy, Trade, and Industry (METI). The first version of GDEM data was released on 2009 and the second on 2011. Data presented for this study were downloaded from version 3, which has many improvements above the previous versions. The ASTER GDEM is distributed in geographic tagged image file format (GeoTiff) files with geographic lat/long coordinates and can be freely accessed from https://earthexplorer.usgs.gov/. This GDEM was provided in 30 m horizontal spatial resolutions and 1 m vertical resolution. Vector data were downloaded from the Oman National Spatial Data Infrastructure gateway (http://nsdig2gapps.ncsi.gov.om/nsdiportal/). These data are shapefiles representing the infrastructure variables in the form of points (e.g., schools), lines (e.g., roads) and polygons (e.g., built-up). The concept of the National Spatial Data Infrastructure is to share the geospatial data and information among stakeholders. The service allows users to download geospatial related data. The Oman Explorer gateway aims to provide relevant, standardized and good quality geospatial information (data and services) to support decision making and project implementation with secure data. Oman Explorer is available to institutional and public access at no coast. These data were prepared and processed by the National Center for Information and Statistics [46]. Eleven categories of vector data were downloaded from Oman Explorer gateway: Education, health, transportation, financial, religious, shopping centers, fuel stations, historical, security, croplands, and built-up. Some of these categories have multiple layers. The education category includes four layers for private and governmental schools and universities; the health category includes hospitals and health centers; the transportation category includes three layers for speedways, highways and streets; the financial category includes both governmental and private banks and the shopping category includes three layers of malls, markets and the department stores. Table 1 provides the total numbers, lengths and areas of these features of the whole Oman. In addition to these vector data, the total population data were also extracted from 2017 [45]. All the features were provided in Geographic Coordinate System (GCS), with the datum WGS84. Therefore, features of polylines and polygon shapefiles should be converted to metric units by converting the GCS to the Universal Transverse Mercator (UTM) in order to get their lengths and areas, respectively.
Data manipulation, processing and presentation were carried out using ArcGIS 10.4 Software. The raster DEM was cut by the shapefile of Oman boundary and then the ten levels of elevations (1–10 m) were obtained using the Raster Calculator, Reclassifying and Vectorization functions in the Spatial Analyst Tool to yield ten polygons that represent each level. The total area of each polygon was determined by its geometry in ArcMap in order to delineate the inundation area at each elevation level. The area of each elevation level was also calculated at the governorate level. The number, length, or area of each of these infrastructure variables that fall within the boundary of that polygon were counted and listed. Hence, a spatial database of the elevations of coastal infrastructure features was prepared with identifying the vulnerable governorate. For the four scenarios implemented in this study, the tsunami heights at the shoreline of Oman from previous studies were used to determine the inundation area. The four investigated scenarios by tsunami waves are 2 m, 5 m, 8 m and 10 m and the analyses were carried out to assess the location, type and quantity of vulnerable infrastructure features along the coast. In order to determine the flow-depth for each scenario, the elevation of tsunami waves as mentioned in previous studies was projected along the coastline. As the DEM of Oman reveals a flat coastal zone for the majority of the country, except for some protrusions of elevated lands, particularly along the east side of Muscat Governorate, the inundation distance for each tsunami scenario was calculated from the shoreline onward to the furthest pixel on land at that elevation level as extracted from the DEM. An overlay analysis was, then, performed in ArcMap using the polygon shapefile of that elevation level as extracted from the DEM for this scenario and from each infrastructure feature for the whole country. Figure 2 outlines the main processing steps performed in this study using the ArcMap Software.

3. Results

The coastal zone of Oman overlooks three water bodies: the Arabian Sea, the Sea of Oman and the Arabian Gulf (Figure 1). The digital elevation model reveals that the coastal zone of Oman is generally narrow. Table 2 presents the area of each elevation level between 1 and 10 m above the mean sea level. In other words, each level delineates the inundation area that should be flooded by water if the sea waves exceed that level. It is observed that all the low-lying lands are exclusive along the coast without any interior lowlands. In Table 2, it is also clear that the area of the coastal zone of 1 m above the sea-level equals 46 km2. This means that the sea-level rise by 1 m should inundate a total area of only 46 km2. On the other hand, the coastal zone of 2 m accounts for 48 km2, however, a tsunami run-up of 2 m should flood all the lands below 2 m, which equals 94 km2 (0.03% of Oman area). In the same manner, the total area that should be overwhelmed by a giant tsunami run-up of 10 m should flood 4552 km2 of coastal areas, which equals 1.5% of the total area of the country. Figure 3 delineates the area of each elevation (1–10 m) at the governorate level. If we consider all regions between 1 and 10 m to be low-lying areas, it is obvious that the most region with low-lands occurs in Al-Wusta Governorate along the Arabian Sea with about 820 km2 below 10 m. The second-largest low-lying region of the country is found in the Al-Batinah North Governorate (276 km2). Ash Sharqiya South Governorate along the Arabian Sea is the third governorate to have low-lying areas in the country (170 km2). The lowest low-lying land (≤10 m) is observed in the Musandam Governorate (25 km2). In the capital, Muscat Governorate, the low-lying coastal zone accounts for 77 km2. Figure 3 also shows the population of the coastal governorates as for 2017 [45], where it is certain that the majority of the population lives in Muscat, Al-Batinah North, Al-Batinah South and Dhofar governorates. This will be translated to more infrastructure and more services in these governorates. Relating the population and their services with low-lying areas (Figure 3), it is obvious that Al-Batinah North Governorate includes both significant population and low-lying lands, whereas Muscat Governorate, where more than one million of people live, has less low-lying lands (≤10 m). The distribution of the four elevation levels (2, 5, 8 and 10 m) are shown in Figure 4 with the major occurrence in the Al-Wusta and Al-Batinah plain. The inundation distance is shown to be maximal in the Al-Wusta Governorate. However, for the most populated regions, i.e., Muscat and Al-Batinah plain, the inundation distances range between a few meters to several kilometrs from the coastline for the lowest and highest tsunami scenarios, respectively. The GIS analysis for the given infrastructure features with the DEM data of the ten elevation levels are shown in Table 3. In this matrix, detailed elevation data are shown for each layer utilized in the study. For example, the schools are categorized into public and private schools, while the shopping category includes the markets, malls and department stores.

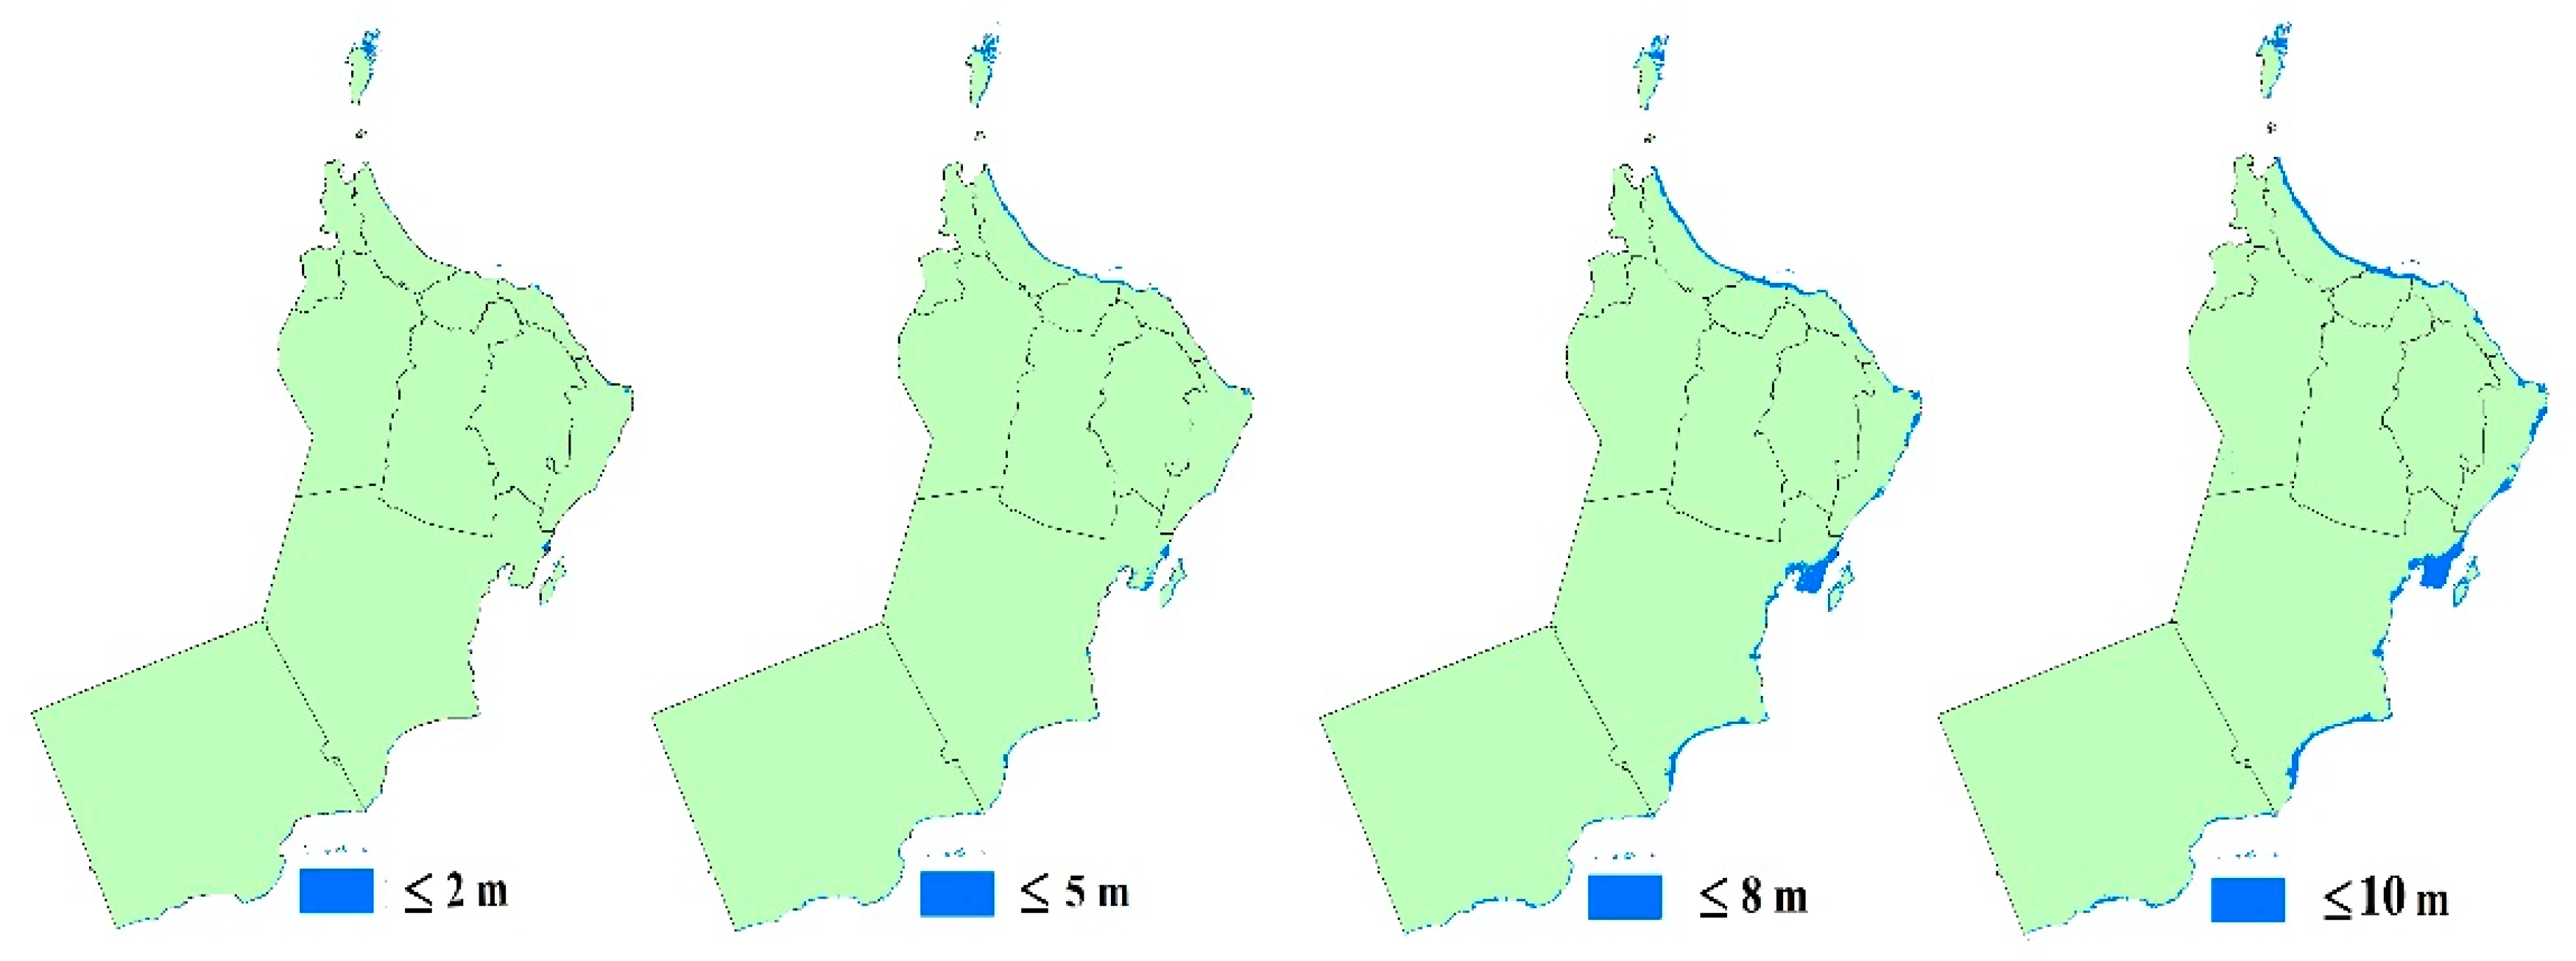
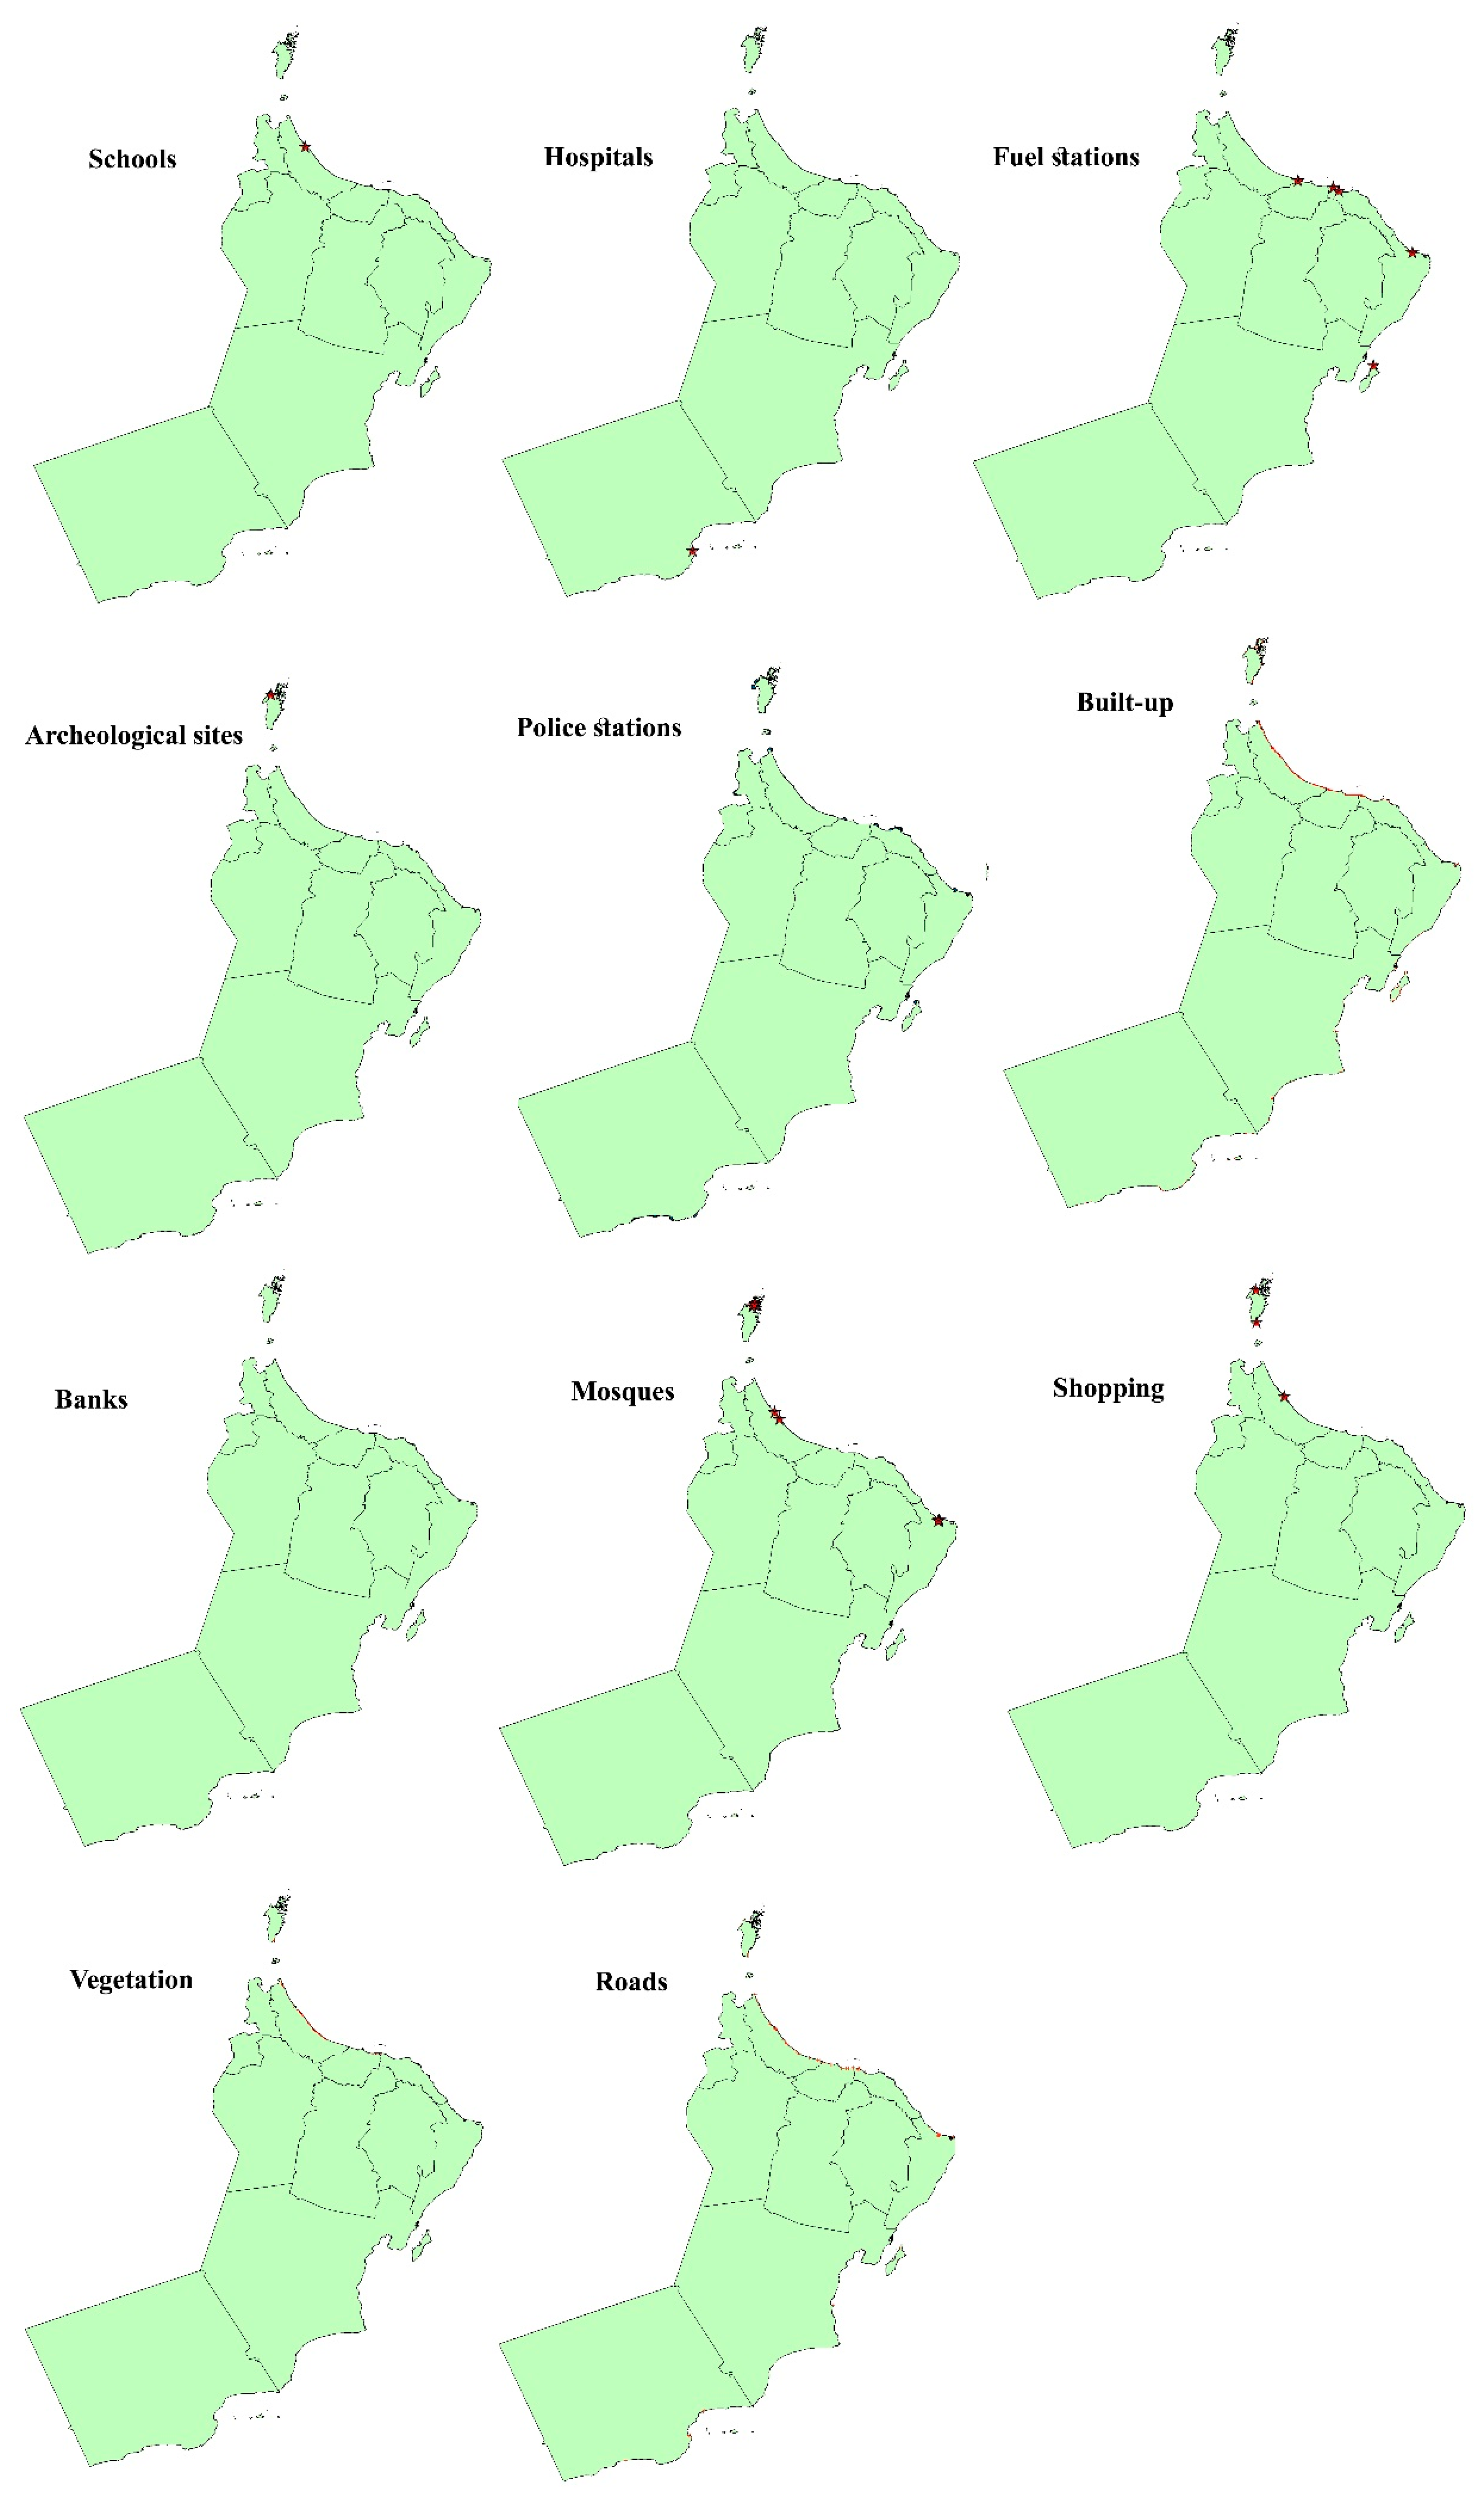
3.1. The 2 m Height Tsunami Scenario

According to [23], a probabilistic analysis assuming tsunamigenic earthquakes along MSZ could yield tsunami waves reaching the northeast corner of Oman. By this scenario, the maximum wave height arriving along the northeastern corner of Oman is about 2.5 m. Hence, all the infrastructure futures occurring at ≤2 m above the sea-level are under direct influence. The DEM reveals that the area of inundation by 2 m elevation totals 93.5 km2. As shown in Table 4, the rise of the sea-level by this scenario should have a limited impact upon infrastructure features, with a major influence upon the coastal road network, particularly along Willayat Sur coast. Built-up areas that could be inundated approach 3.2 km2 mostly at Willayat Seeb coast in the Muscat Governorate. This area includes public recreation lands and parks. The limited impacts by this scenario confirm with the findings of [21] at Seeb using a field surveying with GPS measurements.

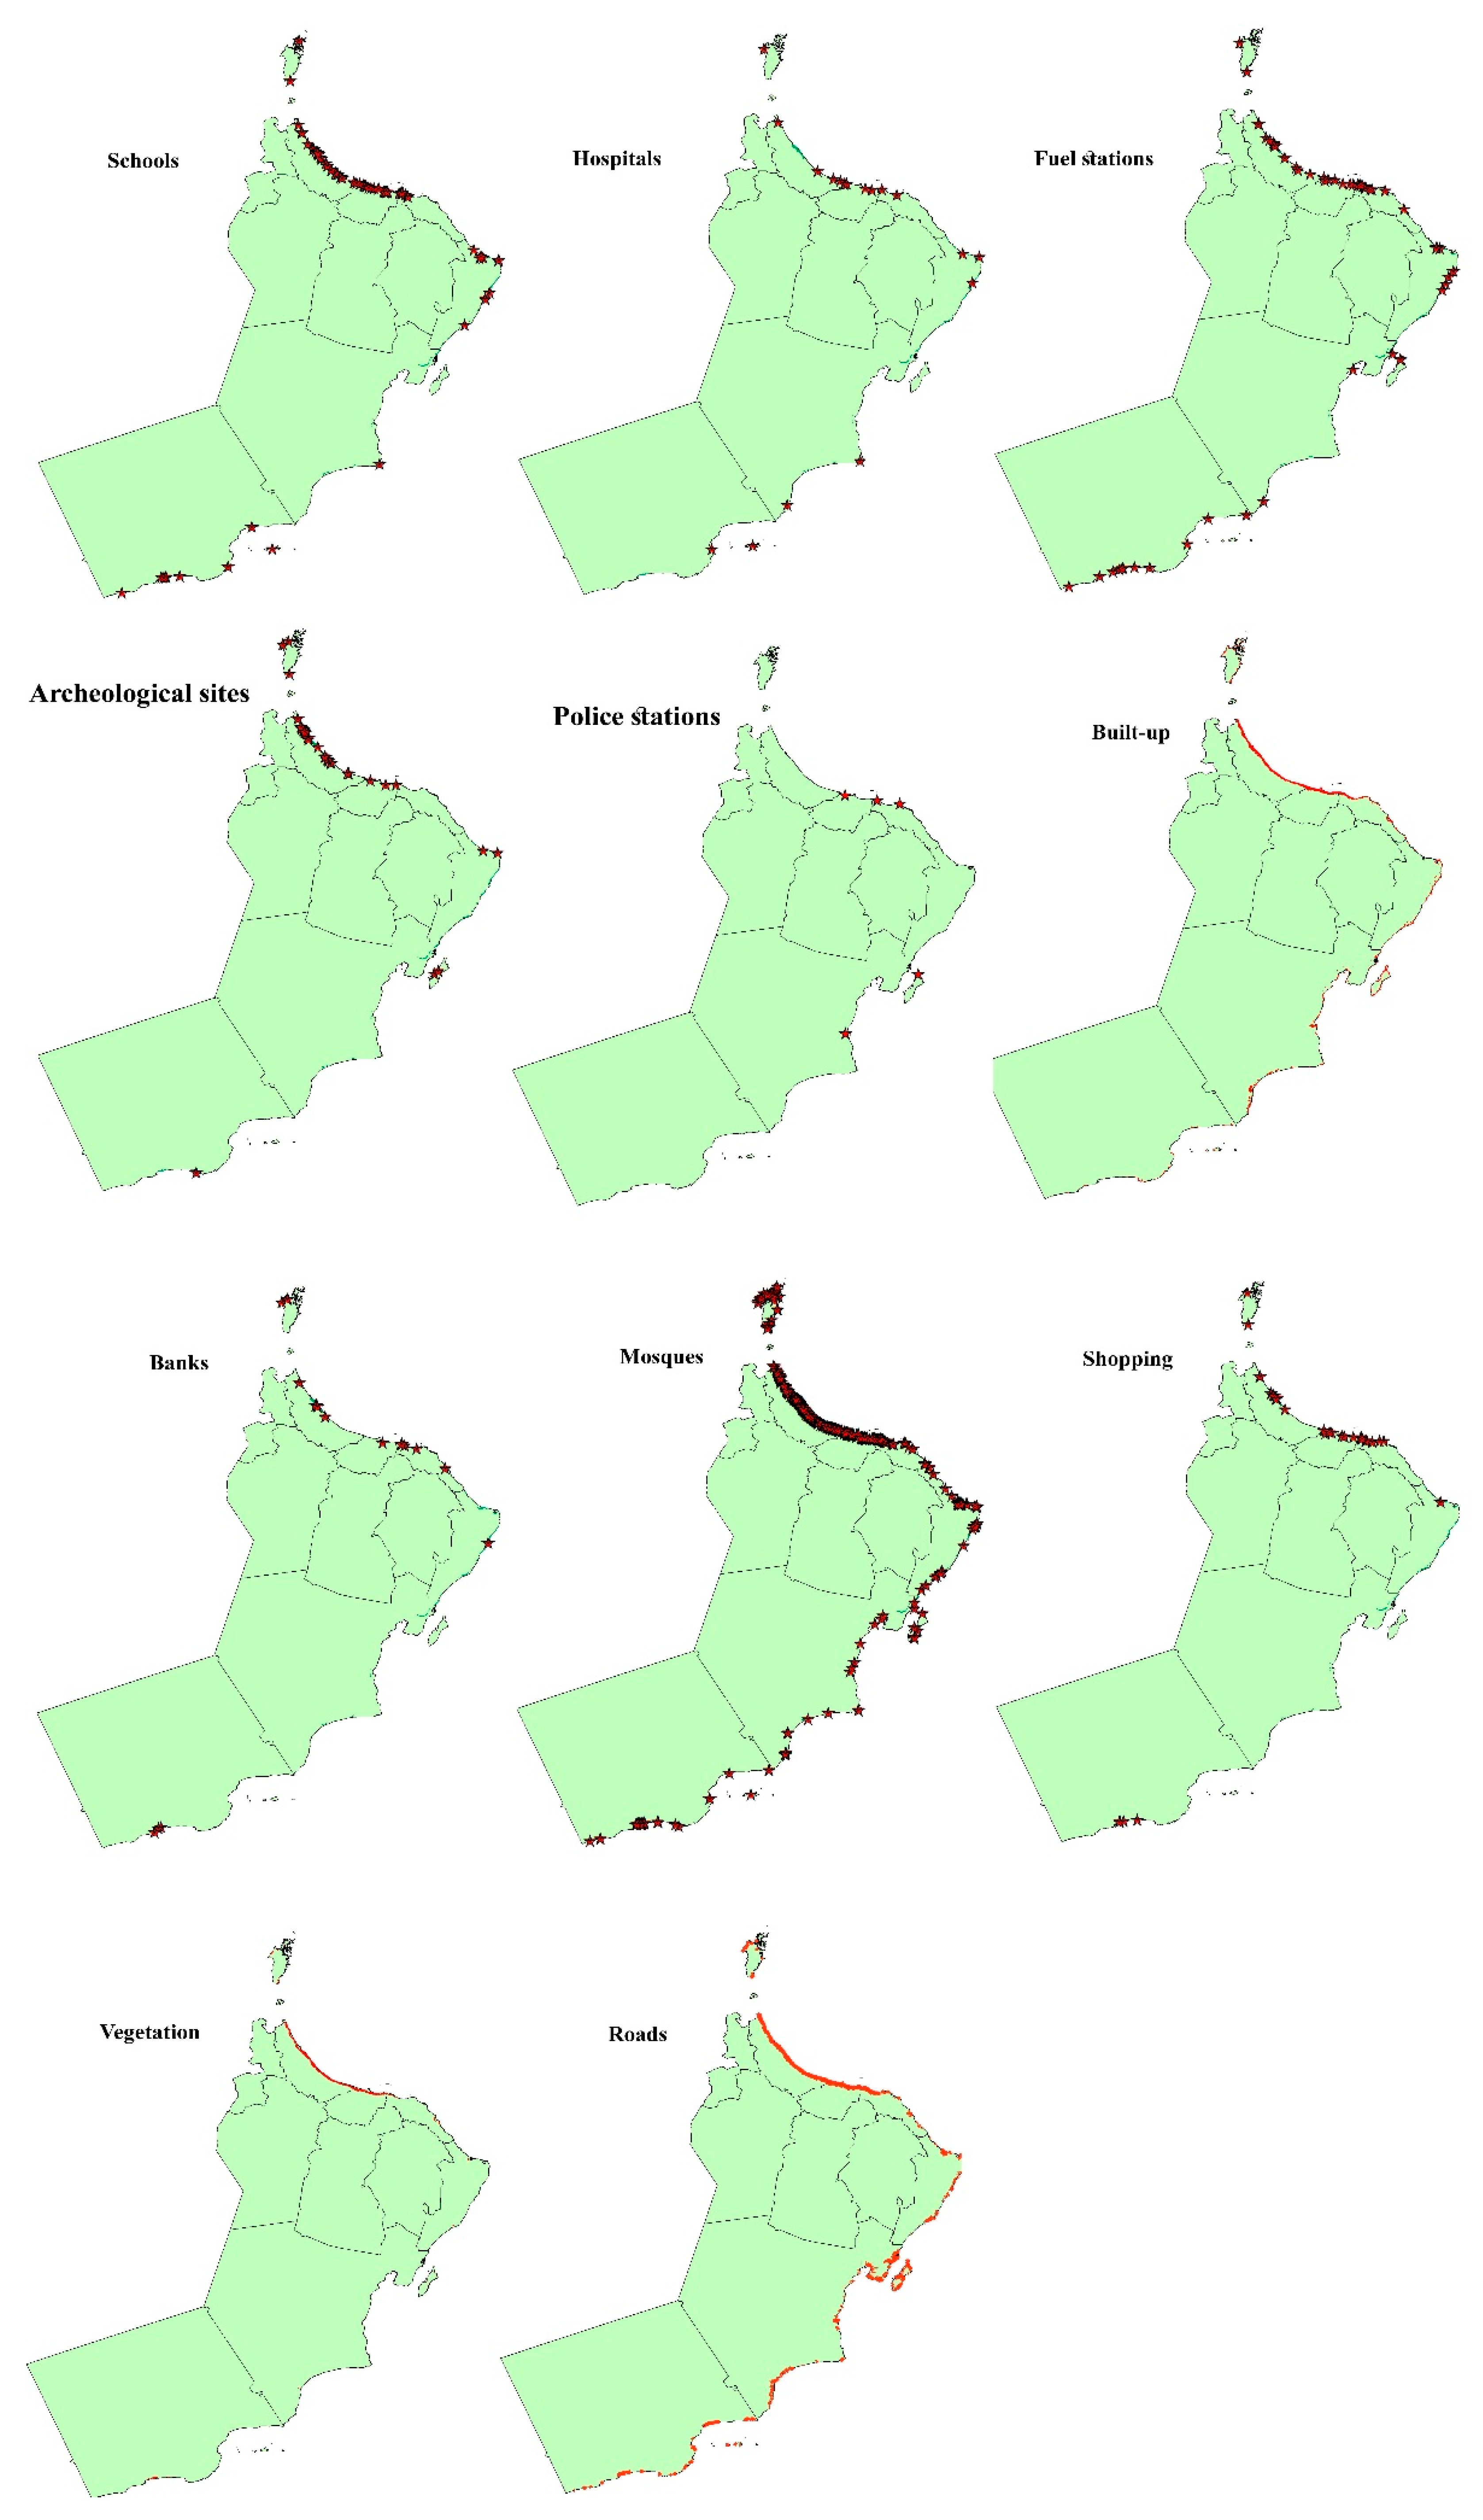
3.2. The 5-m Height Tsunami Scenario

Due to the topographic nature of the Omani coast, which is relatively elevated above the mean sea-level, the total area that extends from the sea-level to 5 m elevation approaches only 301.1 km2. This region extends along the Al-Batinah plain in the north and along the eastern coast. The occurrence of a tsunami with a run-up wave height of 5 m could be probable if a similar earthquake of 1945 (Mw 8.1) strikes along MSZ in the Sea of Oman [14]. In this circumstance, the most flooding zone should be along the northern coast of Oman. GIS analysis reveals that 22 km2 of built up area, 79 km of road network mostly at Al-Batinah plain along the northern coast of Oman are exposed. The three most governorates vulnerable to this event are Al-Batinah North, Al-Batinah South and Muscat. The impact will generally be limited and confined to beaches and valley mouths. As this scenario simulates what happened in 1945 tsunami, eyewitness observations of elder people revealed minor damages along the Omani coast [47]. Today, only 13 mosques and five fuel stations could be overwhelmed and other minor impacts are encountered for the remaining infrastructure parameters. Figure 5 shows the distribution of the infrastructure features along the low-lands of Oman that could be impacted by a 5 m tsunami. Although many other economic features were not involved in this investigation, it is very clear that all the coastal facilities for oil refining, desalination plants, electric generation and harbors are severely vulnerabile to this 5 m tsunami waves scenario. Table 5 summarizes the infrastructure damages of this scenario.

3.3. The 8-m Height Tsunami Scenario

If a tsunami produces a run-up height of 8 m crosses the coasts of Oman, the situation will be overwhelming. In this case, built-up areas of 1656 km2 should be inundated by the tsunami run-up. As [18] mentioned, an earthquake of >8 Mw is possible along the south coast of Pakistan in the Sea of Oman. This devastating earthquake should be followed by tsunami waves that arrive the coast of Oman after 48 minutes with a run-up of 7.8 m along Muscat coasts. Although [18] reported that the impact is maximum along the northern coast of Oman due to the proximity to tsunamigenic source and minimum along Salalah coast at Dhofar due to the distance from MSZ, the study assumes that the run-up is uniform along the entire coast and approaches 8 m, because it is difficult to determine the run-up variation between Muscat and Salalah and along the entire 3000 km coast as well. Table 6 and Figure 6 summarize and address the consequences of this assumed scenario. The major impact is observed to be in Al-Batinah North Governorate. Road network at the street level (1360 km) is also severely prone to tsunami waves mostly on the Al-Batinah plain. The regional geography of the Musandam Peninsula in the north and its low population are the reasons why this region has the lowest vulnerability to tsunami waves. It is worth mentioning that the western side of Musandam, where population and major services occur, is facing the Arabian Gulf and it is relatively not at direct exposure to tsunami waves from the Sea of Oman. On the other hand, although Al-Wusta Governorate has the longest coastal front in the country, it has the lowest vulnerability to tsunami. This may be attributed to the nature of the coastline, which is rocky in most of its length and also to the low population settlements and associated with infrastructure in this governorate. Nonetheless, one of the biggest harbors of Oman, i.e., Duqum, is being established along a coastal flat in this region. By this scenario, one school, one health center and 0.6 km2 of cropland will be impacted at Willayat Duqum.

3.4. The 10 m Height Tsunami Scenario

This is the most catastrophic scenario ever when a full rupture of the Arabian/Eurasian plate boundary caused by a Mw > 9 earthquake occurs in the MSZ as suggested by [24]. This destructive tsunami will be associated with run-up height of 10 m along all of the coastal areas in the Sea of Oman region. This giant tsunami will inundate about 1.5% of the Oman area (4582 km2) and will lead to tremendous impacts upon all the infrastructure stability of the coastal zone. Quantitatively, 589 km2 of the built-up area and 78 km2 of croplands will be inundated. In addition, 91 schools (private and governmental), 18 hospitals and health centers, 703 mosques, 58 fuel stations, 28 banks (governmental and private), and 47 shopping centers (malls, markets and department stores) will be overwhelmed by this scenario. Table 7 and Figure 7 give the detailed numbers, lengths and areas of the infrastructure features vulnerable to the 10-m high tsunami. The Al-Batinah North Governorate is the major region that should be impacted followed by Al-Batinah South and Muscat governorates (Figure 8). The lowest impact is estimated for the Musandam Governorate in the north with notable losses of built-up, streets and mosques.

4. Discussions and Conclusions

A tsunami is one of the most destructive coastal natural hazards. The primary source for creating tsunamis is the marine interplate earthquakes [48]. However, some tsunamis could be induced by marine landslides [49] or by human activities, such as nuclear explosions [50]. In the Indian Ocean, tsunamis are frequent along subduction zones, e.g., MSZ and Sunda/Sumatra subduction zone. Two catastrophic earthquakes occurred in the last two decades in Indonesia (2004) and Japan (2011) resulting in thousands of causalities. Seismic studies anticipate marine earthquakes in the near future along MSZ in the sea of Oman [51]. Tsunami hazard mapping is the first step in the development of effective evacuation plans for communities at risk. The coasts of Oman, which is extremely exposed to tsunami waves, faces more than 3000 km of shorelines along three water bodies. The coastal zone of Oman is generally flat and the land gradually rises landward, particularly along the Al-Batinah plain with the major population and infrastructure. This is conspicuous by the smooth and flat DEM for the majority of the coastal zone. However, in some regions, such as the eastern side of Muscat and along the eastern coast, rugged coastal terrains protrude into the shoreline (Figure 8). The coastal zone is relatively elevated compared to other regions in the Arabian Peninsula and the Middle East [8,52]. The coastal areas of 1 m above the sea extend for only 46 km2, while the areas having 1 m above the sea-level along the Arabian Gulf coast of the United Arab Emirates and along the Saudi Red Sea coast total 270 and 980 km2, respectively. It could be clear that the global sea-level rise even with its extreme value until the end of the current century (70 cm) [6] should not have any significant impact upon the coastal zone of Oman. The coasts of Oman hold the majority of the population and infrastructure of the country. The human settlements and their infrastructure services are not evenly distributed along this extended coast. The majority of the human and infrastructure features are concentrated along the Al-Batinah plain, which includes Al-Batinah North, Al-Batinah South and Muscat. Linking the different sea-levels with the elevations of the infrastructure features (Table 1 and Table 2) reveals that tsunami and tropical cyclones could be a significant threat to the coastal zone of Oman and the global sea-level rise could have limited impact.
Tsunami waves are most probable along the Sea of Oman [53] and their impacts are pronounced along the coastal zone of the entire country. The inundation scenarios obtained from the present study are limited to the coastal zones of the flat topography overlooking the shoreline without any coastal interruptions by rugged mountains or by any coastal discontinuity as lagoons or bays. Nevertheless, tsunami waves associated with 2 m run-up could impose a limited impact. The 5 m tsunami scenario will also have a low impact on the country scale because the shorelines of Oman are generally above the sea-level except for little regions. In the investigation carried out by [21] along one of these flat regions of Muscat with the use of field surveying by 2 cm resolution GPS altimeter, it is reported that 2 m tsunamis should have a minor impact and the 5 m tsunami will flood hundreds of coastal buildings and streets, which are parallel to the shoreline. The present study shows that the most significant impacts along the coastal zone are from 8 m or 10 m run-up heights, which are considered devastating tsunamis and are probably expected by previous studies [18,24]. As the present study assumes that the run-up height for each of the aforementioned scenarios is constant for each scenario along the entire coast of Oman, the damage was also assessed for the distant regions from MSZ. In some locations, such as Bar Al-Hakman, the inundation area could extend landward for 30.8 km and 40.2 km by the run-up of 8 m and 10 m, respectively. Along the Al-Batinah plain, the inundation area approaches 4.4 km and 9.9 km for the 8 m and 10 m scenarios, respectively. Although Muscat Governorate is the home for more than one million people and major infrastructures in Oman, more impact is observed along Al-Batinah North and Al-Batinah South than in Muscat Governorate. Coastal topography is the crucial player in this issue, as significant urban lands of the capital occur at elevated terrains. As shown in Figure 8, the coast of northern Oman is not accessible along the eastern side, where the Al-Hajar mountains border the Sea of Oman between Muscat Governorate and Willayat Sur with some flat coastal zones, such as Qurayat and Sur towns. On the other hand, the western side of the northern coast is relatively exposed to the Sea of Oman with the longest coastal face along with the Al-Batinah North Governorate (180 km) and Al-Batinah South Governorate (50 km). The most vulnerable locations in Muscat are along Seeb and Qurayat localities, where a run-up of 10 m could extend inland to about 3–4 km for both regions. In terms of the infrastructure damages, low impact regions are encountered at the Dhofar, Al-Wusta and Musandam Peninsula. Because cyclone wave heights are difficult to be predicted along a given coastal segment, those associated with more than 5 m heights could be of considerable damage to infrastructure features (Table 3). The study evidently asserts the importance and efficiency of GIS as a tool for extracting, manipulating and processing of spatial data (vector and raster) with providing confident results. The accuracy of the maps is dependent upon the data quality, which was imported from official resources. The maps produced by this study could be extremely important for planners and decision-makers on coastal zone management and risk reduction officers. The Government and major investors in the field of housing, tourism and resort constructions are the main beneficiaries.
Mitigation measures to alleviate the hazards of a tsunami along the coasts of Oman are disputable. Although public awareness and early warning systems are very important, particularly for regions of high vulnerability, such as flat coastal zones, hard structures are quite suitable to protect coastal resorts, roads, desalination and electricity generation plants, harbors and shorelines. However, the major challenge for constructing coastal protection measures, such as the sea walls and breakwater is the high costs. [54] estimated the costs of 1 m length of the breakwater to range between US$ 6 k to 9 k depending on the depth of water, which is very costly in a country of limited resources with a long coast of high vulnerability to a tsunami. Yet, the Ministry of Transportation and Communication [55] put a new strategy to make roads, in regions susceptible to inundation, at higher levels in order to avoid their destruction (Figure 9). The public awareness and warning systems are the most effective to alarm coastal inhabitants before the hit of the first tsunami wave. The social network communication tools could efficiently help to disseminate the warning. Coastal road network could be coded to pinpoint short and easily accessible exit terminals from the coastal zone to safer uplands. These coded road networks should be concentrated in the most vulnerable regions, such as Sohar and Seeb regions along the Sea of Oman, which are the most vulnerable regions. The private sector could contribute to significant protection measures for coastal resorts (Figure 9). The selection of promising coastal regions for investment should consider the vulnerable locations obtained in this study. Coastal ecosystems, particularly mangrove vegetation could also help to protect coastal zones from sea surges. They are also a principal defense against tsunami waves [56]. The environment of Oman coasts favors the occurrence of several patches of mangrove along the Sea of Oman and the Arabian Sea. New plantation programs were implemented in order to increase the area of mangroves along the country.

Funding

This research was funded by the Sultan Qaboos University, HM grant number: SR/ART/GEOG/17/01.

Acknowledgments

The Author deeply acknowledges the National Center of Statistics and Information (NCSI) for providing the spatial data for Oman. The Sultan Qaboos University is also acknowledged for providing facilities and financial support to carry out this research.

Conflicts of Interest

The author declares no conflict of interest.

References

  1. Small, C.; Nicholls, R.J. A global analysis of human settlement in coastal zones. J. Coast. Res. 2003, 19, 584–599. [Google Scholar]
  2. Doukakis, E. Coastal vulnerability and risk parameters. Eur. Water 2005, 11, 3–7. [Google Scholar]
  3. Hereher, M. Assessment of South Sinai Coastal Vulnerability to Climate Change. J. Coast. Res. 2015, 31, 1469–1477. [Google Scholar] [CrossRef]
  4. Bird, E. Coastal Geomorphology: An Introduction; John Wiley & Sons: New York, NY, USA, 2008. [Google Scholar]
  5. U.S. Global Change Research Program. Climate Science Special Report: Fourth National Climate Assessment; Wuebbles, D.J., Fahey, D.W., Hibbard, K.A., Dokken, D.J., Stewart, B.C., Maycock, T.K., Eds.; U.S. Global Change Research Program: Washington, DC, USA, 2017; Volume I, p. 470.
  6. IPCC. Climate Change: The Physical Science Basis. In Contribution of Working Group I to the Fifth Assessment Report of the Intergovernmental Panel on Climate Change; Stocker, T., Qin, D., Plattner, G.K., Tignor, M., Allen, S.K., Boschung, J., Nauels, A., Xia, Y., Bex, V., Midgley, P.M., Eds.; Cambridge University Press: Cambridge, UK; New York, NY, USA, 2013; p. 1535. [Google Scholar]
  7. Hereher, M. Vulnerability of the Nile Delta to sea level rise: An assessment using remote Sensing. Geomat. Nat. Hazards Risk 2010, 1, 315–321. [Google Scholar] [CrossRef]
  8. Hereher, M. Vulnerability assessment of the Saudi Arabian Red Sea coast to climate change. Environ. Earth Sci. 2016, 75, 1–13. [Google Scholar] [CrossRef]
  9. Hassan, M.H.; Frischknecht, C.; ElGabry, M.; Hussein, H.; ElWazir, M. Tsunami hazard and risk assessment for Alexandria (Egypt) based on the maximum credible earthquake. J. Afr. Earth Sci. 2020, 162, 103735. [Google Scholar] [CrossRef]
  10. Geist, E.; Titov, V.; Synolakis, C. Tsunami: Wave of change. Sci. Am. 2006, 294, 56–63. [Google Scholar] [CrossRef]
  11. National Geophysical Data Center (NGDC/WDS). Global Historical Tsunami Database. Boulder, Colorado, 2013. Available online: http://www.ngdc.noaa.gov/hazard/tsu_db.shtml (accessed on 23 March 2020).
  12. Sarker, M.A. A Review of numerical modelling of cyclones and tsunamis in the Arabian Sea by Royal HaskoningDHV. Inter. J. Hydrol. 2017, 1, 00014. [Google Scholar]
  13. Hoffmann, G.; Grützner, C.; Schneidera, B.; Preusserd, F.; Reicherter, K. Large Holocene tsunamis in the northern Arabian Sea. Mar. Geol. 2020, 419, 106068. [Google Scholar] [CrossRef]
  14. Heidarzadeh, M.; Pirooz, M.; Zaker, N.; Yalciner, A. Preliminary estimation of the tsunami hazards associated with the Makran subduction zone at the northwestern Indian Ocean. Nat. Hazards 2009, 48, 229–243. [Google Scholar] [CrossRef]
  15. Sultanpour, M. A study on the probability of tsunami attacks in the Persian Gulf and Gulf of Oman. In Handbook of Coastal Disaster Mitigation for Engineers and Planners; Elsevier: Amsterdam, The Netherlands, 2015. [Google Scholar] [CrossRef]
  16. Byrine, D.E.; Sykes, L.R.; Davis, D.M. Great thrust earthquakes and aseismic slip along the plate boundary of the Makran Subduction Zone. J. Geophys. Res. 1992, 97, 449–478. [Google Scholar] [CrossRef]
  17. Heidarzadeh, M.; Pirooz, M.D.; Zaker, N.H.; Yalciner, A.C.; Mokhtari, M.; Esmaeily, A. Historical tsunami in the Makran subduction zone off the southern coasts of Iran and Pakistan and results of numerical modeling. Ocean Eng. 2008, 35, 774–786. [Google Scholar] [CrossRef]
  18. Browning, J.; Thomas, N. An assessment of the tsunami risk in Muscat and Salalah, Oman, based on estimations of probable maximum loss. Int. J. Disas. Risk Red. 2016, 16, 75–87. [Google Scholar] [CrossRef] [Green Version]
  19. Lin, I.; Tung, C. A preliminary investigation of tsunami hazard, B Seismol. Soc. Am. 1982, 72, 2323–2337. [Google Scholar]
  20. Geist, E.; Parsons, T. Probabilistic analysis of tsunami hazards. Nat. Hazards 2006, 37, 277–314. [Google Scholar] [CrossRef]
  21. Schneider, B.; Hoffmann, G.; Reicherter, K. Scenario-based tsunami risk assessment using a static flooding approach and high-resolution digital elevation data: An example from Muscat in Oman. Glob. Planet. Chan. 2016, 139, 183–194. [Google Scholar] [CrossRef]
  22. El-Hussain, I.; Omira, R.; Deif, A.; Al-Habsi, Z.; Al-Rawas, G.; Mohamad, A.; Al-Jabri, K.; Baptista, M. Probabilistic tsunami hazard assessment along Oman coast from submarine earthquakes in the Makran subduction zone. Arab. J. Geosci. 2016, 9, 668. [Google Scholar] [CrossRef]
  23. El-Hussain, I.; Omira, R.; Al-Habsi, Z.; Baptista, M.A.; Deif, A.; Mohamed, A.M. Probabilistic and deterministic estimates of near-field tsunami hazards in northeast Oman. Geosci. Lett. 2018, 5, 30. [Google Scholar] [CrossRef] [Green Version]
  24. Heidarzadeh, M.; Pirooz, M.; Zaker, N. Modeling the near-field effects of the worstcase tsunami in the Makran subduction zone. Ocean Eng. 2009, 36, 368–376. [Google Scholar] [CrossRef]
  25. Panahi, F.; Asadollahi, R.; Asadollahi, M. Bafarani A Experience of cyclone Gonu in the Islamic Republic of Iran: Lessons learned. East. Mediterr. Health J. 2010, 16, 1290–1294. [Google Scholar] [CrossRef]
  26. Haggag, M.; Badry, H. Hydrometeorological Modeling Study of Tropical Cyclone Phet in the Arabian Sea in 2010. Atmos. Clim. Sci. 2012, 2, 174–190. [Google Scholar] [CrossRef] [Green Version]
  27. Fritz, H.M.; Blount, C.D.; Albusaidi, F.B.; Al-Harthy, A.H. Cyclone Gonu storm surge in Oman. Estuar. Coast. Shelf Sci. 2010, 86, 102–106. [Google Scholar] [CrossRef]
  28. Yan, K.; Di Baldassarre, G.; Solomatine, D.P.; Schumann, G.J.P. A review of lowcost space-borne data for flood modelling: Topography, flood extent and water level. Hydrol. Proc. 2015, 29, 3368–3387. [Google Scholar] [CrossRef]
  29. Pham, H.; Marshalla, L.; Johnsona, F.; Sharma, A.A. method for combining SRTM DEM and ASTER GDEM2 to improve topography estimation in regions without reference data. Remote Sens. Environ. 2018, 210, 229–241. [Google Scholar] [CrossRef]
  30. Jarihani, A.A.; Callow, J.N.; McVicar, T.R.; Van Niel, T.G.; Larsen, J.R. Satellite derived Digital Elevation Model (DEM) selection, preparation and correction for hydrodynamic modelling in large, low-gradient and data-sparse catchments. J. Hydrol. 2015, 524, 489–506. [Google Scholar] [CrossRef]
  31. Mukul, M.; Srivastava, V.; Jade, S.; Mukul, M. Uncertainties in the Shuttle Radar Topography Mission (SRTM) Heights: Insights from the Indian Himalaya and Peninsula. Sci. Rep. 2017, 7, 41672. [Google Scholar] [CrossRef] [Green Version]
  32. Fujisada, H. Terra ASTER instrument design and geometry. In Land Remote Sensing and Global Environmental Change; Springer: New York, NY, USA, 2010; pp. 59–82. [Google Scholar]
  33. Fujisada, H.; Urai, M.; Iwasaki, A. Technical methodology for ASTER global DEM. IEEE Trans. Geosci. Remote Sens. 2012, 50, 3725–3736. [Google Scholar] [CrossRef]
  34. Wang, X.; Holland, D.; Gudmundsson, H. Accurate coastal DEM generation by merging ASTER GDEM and ICESat/GLAS data over Mertz Glacier, Antarctica. Remote Sens. Environ. 2018, 206, 218–230. [Google Scholar] [CrossRef]
  35. Fujisada, H.; Urai, M.; Iwasaki, A. Advanced methodology for ASTER DEM generation. IEEE Trans. Geosci. Remote Sens. 2011, 49, 5080–5091. [Google Scholar] [CrossRef]
  36. Hereher, M. Capacity assessment of the Qattara Depression: Egypt as a sink for the global sea level rise. Geocarto Internat. 2015, 30, 123–131. [Google Scholar] [CrossRef]
  37. Clarke, K.C. Advances in geographic information systems. Comput. Environ. Urban Syst. 1986, 10, 175–184. [Google Scholar] [CrossRef]
  38. Szlafsztein, C.; Sterr, H. A GIS-based vulnerability assessment of coastal natural hazards, state of Pará, Brazil. J. Coast. Conserv. 2007, 11, 53–66. [Google Scholar] [CrossRef]
  39. Lichter, M.; Felsenstein, D. Assessing the costs of sea-level rise and extreme flooding at the local level: A GIS-based approach. Ocean Coast. Manag. 2012, 59, 47–62. [Google Scholar] [CrossRef]
  40. Mavromatidi, A.; Briche, E.; Claeys, C. Mapping and analyzing socio-environmental vulnerability to coastal hazards induced by climate change: An application to coastal Mediterranean cities in France. Cities 2018, 72, 189–200. [Google Scholar] [CrossRef]
  41. Kwarteng, A.Y.; Dorvlo, A.S.; Vijaya Kumar, G.T. Analysis of a 27-year rainfall data (1977–2003) in the Sultanate of Oman. Int. J. Climat. 2009, 29, 605–617. [Google Scholar] [CrossRef]
  42. Hereher, M. Estimation of monthly surface air temperatures from MODIS LST time series data: Application to the deserts in the Sultanate of Oman. Environ. Monit. Assess. 2019, 191, 592. [Google Scholar] [CrossRef]
  43. Fouda, M.; Al-Muharrami, M. Significance of the mangroves in the arid environment of the Sultanate of Oman. Agric. Sci. 1996, 1, 41–49. [Google Scholar] [CrossRef] [Green Version]
  44. Spalding, M.D.; Ravilious, C.; Green, E. World Atlas of Coral Reefs. In Prepared at the UNEP World Conservation Monitoring Centre; University of California Press: Berkeley, CA, USA, 2001. [Google Scholar]
  45. National Center of Statistics and Information (NCSI). Statistical Year Book; NCSI: Muscat, Oman, 2018.
  46. National Center of Statistics and Information (NCSI). Oman National Spatial Data Infrastructure. Available online: http://nsdig2gapps.ncsi.gov.om/oej/index.html?config=config_oe_public_en.json&locale=en (accessed on 1 May 2020).
  47. Hoffmann, G.; Rupprechter, M.; Al Balushi, N.; Grützner, C.; Reicherter, K. The impact of the 1945 Makran tsunami along the coastlines of the Arabian Sea (Northern Indian Ocean)—A review. Z. Für Geomorph. 2013, 57 (Suppl. 4), 257–277. [Google Scholar] [CrossRef]
  48. Satakea, K.; Heidarzadeh, M.; Quiroz, M.; Cienfuegos, R. History and features of trans-oceanic tsunamis and implications for paleotsunami studies. Earth Sci. Rev. 2020, 202, 103112. [Google Scholar] [CrossRef]
  49. Brink, U.S.; Chaytor, J.D.; Geist, E.L.; Brothers, D.S.; Andrews, B.D. Assessment of tsunami hazard to the U.S. Atlantic margin. Mar. Geology. 2014, 353, 31–54. [Google Scholar] [CrossRef] [Green Version]
  50. Glasstone, S.; Dolan, P. Shock effects of surface and subsurface bursts. In The Effects of Nuclear Weapons, 3rd ed.; U.S. Department of Defense; Energy Research and Development Administration: Washington, DC, USA, 1977. [Google Scholar]
  51. Sultan, M.; Ahmed, K.I. Statistical Analysis of Earthquakes and Tsunami of Makran Subduction Zone (MSZ), and Tsunami Hazard Assessment of Gwadar Coast. J. Earth Sci. Clim. Chang. 2017, 8, 9. [Google Scholar] [CrossRef] [Green Version]
  52. Hereher, M. Assessment of climate change impacts on sea surface temperatures and sea level rise—The Arabian Gulf. Climate 2020, 8, 50. [Google Scholar] [CrossRef] [Green Version]
  53. Hoffmann, G.; Reicherter, K.; Wiatr, T.; Grützner, C.; Rausch, T. Block and boulder accumulations along the coastline between Fins and Sur (Sultanate of Oman): Tsunamigenic remains? Nat. Hazards 2013, 65, 851–873. [Google Scholar] [CrossRef]
  54. Yousef, A. Addressing Stability of Shoreline around Rosetta Branch, Nile River. Ph.D. Thesis, The Egypt-Japan University of Science and Technology, Borg Al-Arab, Alexandria, 2015. [Google Scholar]
  55. Ministry of Transportation and Communication (MTAC). Highway Design Standards; The Sultanate of Oman: Muscat, Oman, 2017; Volume I.
  56. Olwig, M.F.; Sørensen, M.K.; Rasmussen, M.S.; Danielsen, F.; Selvam, V.; Hansen, L.B.; Nyborg, L.; Vestergaard, K.B.; Parish, F.; Karunagaran, V.M. Using remote sensing to assess the protective role of coastal woody vegetation against tsunami waves. Int. J. Remote Sens. 2007, 28, 3153–3169. [Google Scholar] [CrossRef]
Figure 1. The location of Oman along the three water bodies. Note the shallow continental shelf of the country. Source. Google Earth maps. The numbers refer to coastal governorates of the country: 1—Batinah North; 2—Al-Batinah South; 3—Muscat; 4—Ash Sharqiya South; 5—Al-Wusta; 6—Dhofar; 7—Musandam; 8—Al-Burayimi; 9—Adh Dhahirah; 10—Dakhiliya; and 11—Ash Sharqiya North. The Al-Batinah plain includes #1 and #2. The right map shows the the population of Oman in 2017 [45].
Geosciences 10 00175 g001
Figure 2. A flow chart diagram highlighting the outline of the data processing in this study.
Geosciences 10 00175 g002
Figure 3. Areas of the elevation levels (1–10 m) and the population of coastal governorates in 2017.
Geosciences 10 00175 g003
Figure 4. The distribution of the four elevated coastal zones in Oman as extracted from the GDEM.
Geosciences 10 00175 g004
Figure 5. The distribution of the impacted infrastructure features by a 5 m run-up height tsunami.
Geosciences 10 00175 g005
Figure 6. The distribution of the impacted infrastructure features by an 8 m run-up height tsunami.
Geosciences 10 00175 g006
Figure 7. The distribution of the impacted infrastructure by a 10 m run-up height tsunami.
Geosciences 10 00175 g007
Figure 8. The coastal topography in North Oman. Note that red color highlights low-elevated coastal zones (below 10 m). Major low-lands occur at Al-Batinah North Governorate and Al-Batinah South Governorate along the Sea of Oman. Some coastal pockets occur at Muscat Governorate (such as at Willayat Seeb and Willayat Qurayat) and at Willayat Sur.
Geosciences 10 00175 g008
Figure 9. Coastal hard structures against the sea-level rise. Note the elevated coastal highway in Al-Bainah (a) and Sur (b). Coastal protection extends to private coastal resorts (c).
Geosciences 10 00175 g009
Table 1. The infrastructure database of Oman as provided by [46].
Infrastructure FeatureLayerData TypeNumberLength,
km
Area
km2
EducationGovernment schoolsPoint1124
Private schoolsPoint551
Government universitiesPoint1
Private universitiesPoint6
HealthHealth centersPoint183
HospitalsPoint49
SecurityPolice stationsPoint67
FinancialGovernment banksPoint34
Private banksPoint617
ShoppingMallsPoint121
MarketPoint203
Department storesPoint457
ReligiousMosquesPoint12,210
AutomotiveFuel stationsPoint548
HistoricalArcheological sitesPoint499
TransportationExpresswayPolyline 3360
HighwayPolyline 4161
StreetsPolyline 54,968
UrbanBuilt-upPolygon 24,512
VegetationCropsPolygon 866
Table 2. The coastal elevations and inundation areas between 1 and 10 m along Oman coasts.
ElevationArea (km2)Inundation Area (km2)% of Oman Area
146460.01
248940.03
3511440.05
4612050.07
5973010.10
61964970.16
74089050.29
875016560.54
9120228580.93
10172445821.48
Table 3. The infrastructure/elevation matrix for Oman.
Level, m
1 m2 m3 m4 m5 m6 m7 m8 m9 m10 m
Government schools0000118183963
Private schools000000691428
Hospitals0000000001
Health centers0000135101217
Police stations0000000025
Government Banks0000000111
Priv. Banks00001115823
Market00012610131822
Malls0000122369
Stores00000006716
Mosques888101337106241467703
Fuel stations44455916284559
Archeological0000028112135
Expressway, km0001413275185136
Highways, km122238213966104
Streets, km1515152172276719136021673098
Built-up, km233362269160261439600
Vegetation, km200001616325277
Table 4. The vulnerability matrix of the 2 m run-up tsunami scenario at the governorate level.
Al-Batinah NorthAl-Batinah SouthMuscatAsh Sharqiya SouthAl-WustaDhofarMusandamTotal
Population00000000
Government schools00000000
Private schools00000000
Health centers00000000
Hospitals00000000
Government banks00000000
Private banks00000000
Police station00000000
Malls00000000
Market00000000
Department stores00000000
Expressway (km)00000000
Highway (km)00010001
Streets (km)101921216
Mosques00080008
Archeological sites00000000
Fuel stations00220004
Built-up area (km2)00211004
Croplands (km2)00000000
Table 5. The vulnerability matrix of the 5 m tsunami scenario at the governorate level.
Al-Batinah NorthAl-Batinah SouthMuscatAsh Sharqiya SouthAl-WustaDhofarMusandamTotal
Government schools10000001
Private schools00000000
Health centers00000101
Hospitals00000000
Government banks00000000
Private banks00000011
Police station00000000
Malls00000011
Market10000012
Department stores00000000
Expressway (km)40000004
Highway (km)10010002
Streets (km)181691147772
Mosques200800313
Archeological sites00000000
Fuel stations01220005
Built-up area (km2)864101020
Croplands (km2)11000013
Table 6. The vulnerability matrix of the 8 m tsunami scenario at the governorate level.
Al-Batinah NorthAl-Batinah SouthMuscatAsh Sharqiya SouthAl-WustaDhofarMusandamTotal
Government schools834111018
Private schools53100009
Health centers221112110
Hospitals00000000
Government banks10000001
Private banks31000015
Police station00000000
Malls00200013
Market912000113
Department stores33000006
Expressway (km)5000000050
Highway (km)16001344039
Streets (km)49434016587103108641360
Mosques106421920101628241
Archeological sites610200211
Fuel stations837413228
Built-up area (km2)135623381472261
Croplands (km2)2631101133
Table 7. The vulnerability matrix of the 10 m tsunami scenario at the governorate level.
Al-Batinah NorthAl-Batinah SouthMuscatAsh Sharqiya SouthAl-WustaDhofarMusandamTotal
Government schools23149617363
Private schools 1164403028
Health centers532322017
Hospitals00000011
Government banks10000001
Private banks718103323
Police station01211005
Malls01600119
Market1324101122
Department stores464002016
Expressway (km)125500060135
Highway (km)430032161092
Streets (km)11497163862372692141273098
Mosques3211226158304071703
Archeological sites2321501335
Fuel stations147119311358
Built-up area (km2)268121694468164589
Croplands (km2)60112013178

