Article

Changes in Regional Snowfall in Central North America (1961–2017): Mountain Versus Plains

1
Department of Earth System Science & Policy, University of North Dakota, Grand Forks, ND 58202, USA
2
Division of Marine Science, School of Ocean Science and Engineering, The University of Southern Mississippi, Stennis Space Center, MS 39529, USA
*
Author to whom correspondence should be addressed.
Geosciences 2020, 10(5), 157; https://doi.org/10.3390/geosciences10050157
Submission received: 2 February 2020 / Revised: 22 April 2020 / Accepted: 23 April 2020 / Published: 28 April 2020

Abstract

:
Long-term snowfall change offers insight for understanding climate change, managing water resources, and assessing climate model performance, especially at regional scales where topography plays an important role in shaping regional climate and water availability. In this study, we examined the changes of annual snowfall using observations from 1961 to 2017 in central North America, a region with high contrast in topographic complexities. There is a general, yet distinct difference in the snowfall trends demarcated approximately along the 105° W meridian. To its east, which is dominated by plains, snowfall had increased overall, except in a limited area south of 42° N, where snowfall decreased slightly. To the west of 105° W, which is dominated by the Rocky Mountains, there was a wide spread of decreasing trend, with only two pockets of area at an elevation of >2000 m exhibiting increasing snowfall trends. Multiple linear regression analysis showed that, in addition to the average annual snowfall, snowfall trends significantly correlated with elevation in the mountain region and with average snow season temperature in the plains region, suggesting different mechanisms potentially shaping snowfall trends in the two regions.

1. Introduction

Snowfall is a critical component in the global water cycle [1,2] that directly affects agricultural production and human well-being [3,4]. Snowfall is also an indicator of climate change [5,6]. Global climate models (GCMs) have predicted decreasing snowfall south of 60° N in the Northern Hemisphere in response to warming global temperature (Table 1, Study 1, 2, and 3) [2,7,8]. However, the change of snowfall at regional scales, ranging from a continent to a geographic area, is generally more complex than, and often exhibits opposite trends to, the global scale, GCMs predictions.
Several studies have investigated snowfall changes over the North American continent, yet with inconsistent findings. Both Karl et al. (Table 1, Study 4) [9] and Groisman and Easterling (Table 1, Study 5) [10] found significant increases in annual snowfall from 1950 to 1990 across the continent at latitudes north of 55° N. However, at latitudes south of 55° N, the two studies reported different patterns; Karl et al. [9] found an overall decrease, whereas Groisman and Easterling [10] found the decrease was limited only to north of 45° N and snowfall increased south of 45° N. In addition to this overall latitudinal difference, recent studies revealed a more complex distribution of snowfall trends in the United States. Kunkel et al. (Table 1, Study 6) [6] reported a decreasing trend in the west of the Rocky Mountains from 1930 to 2007 and an overall increasing trend from the eastern edge of the Rocky Mountains to the Great Plains and the Great Lakes. Both Feng and Hu (Table 1, Study 7) [11] and Kluver and Leathers (Table 1, Study 8) [4] found significant decreasing trends from the Rocky Mountains to the western coast. While the former found rather mixed snowfall trends in the rest of the country from 1949 to 2005, the latter identified an increasing trend in the northern Great Plains from 1930 to 2007.
The decrease of snowfall found in the Canadian Prairies by Akinremi et al. (Table 1, Study 9) [12] and increase in the Great Plains by Hughes and Robinson (Table 1, Study 10) [13] are consistent with the findings of Karl et al. [9], Groisman and Easterling [10], and Kunkel et al. [6] (Table 1, Study 4, 5, and 6). In the Rocky Mountains, Knowles et al. (Table 1, Study 11) [14] found a primary increasing trend of snowfall water equivalent (SFE, water equivalent of the newly fallen snow) from 1949 to 2004 in the southern Rocky Mountains in Colorado and New Mexico, which was also captured by Kunkel et al. (Table 1, Study 6) [6]. Wi et al. (Table 1, Study 12) [15] further reported an increase of SFE from 1981 to 2005 at higher elevations and a decrease of SFE at lower elevations in the Rocky Mountains between 35 and 45° N. The disparities in snowfall trends observed in the same mountain area imply that the change of snowfall also varies with elevation.
Several mechanisms have been suggested to explain the observed snowfall changes. Increasing temperature was found to be significantly correlated with decreasing snowfall in the northern Rocky Mountains and in the region to the west of them [4,14]. However, such a correlation cannot be identified in the southern Rocky Mountains and central Great Plains, where variations of snowfall were found to be more related to large-scale telecommunications [4]. Hughes and Robinson [13] and Kluver and Leathers [4] suggested that changes in the jet stream and atmospheric circulation may have caused the increasing snowfall trends observed in the northern Great Plains. In addition, the correlation between SFE and elevation identified by Wi et al. [15] indicated that topography can play a role in shaping snowfall trend patterns in the Rocky Mountains.
As summarized in Table 1, significant uncertainty in long-term snowfall changes exist in central North America, a region where water availability is dominated by melting snow and ice [1]. The objective of this study is to re-examine the historical snowfall changes in this region, in particular their spatial variations in relation to topography, that is, mountain versus plains, using an expanded dataset with recent records. Snowfall in this study is defined as the vertical measurement of snow that has fallen over a specific duration, and is related to, but different from SFE [11,14,15]. Our study focused on analyzing observed snowfall records by addressing two questions: (1) What is the spatial distribution of the snowfall trends in the region; and (2) How does the distribution vary with elevation, average annual snowfall, and average snow season temperature. The research provides insights on how snowfall changes under more recent climatic conditions in a region with high complexity in topography. Considering the importance of water resources to agricultural and human activities in this region under the changing climate [16,17], our study, which included more recent observations of snowfall in the region, will be useful in guiding future water management.

2. Data and Methods

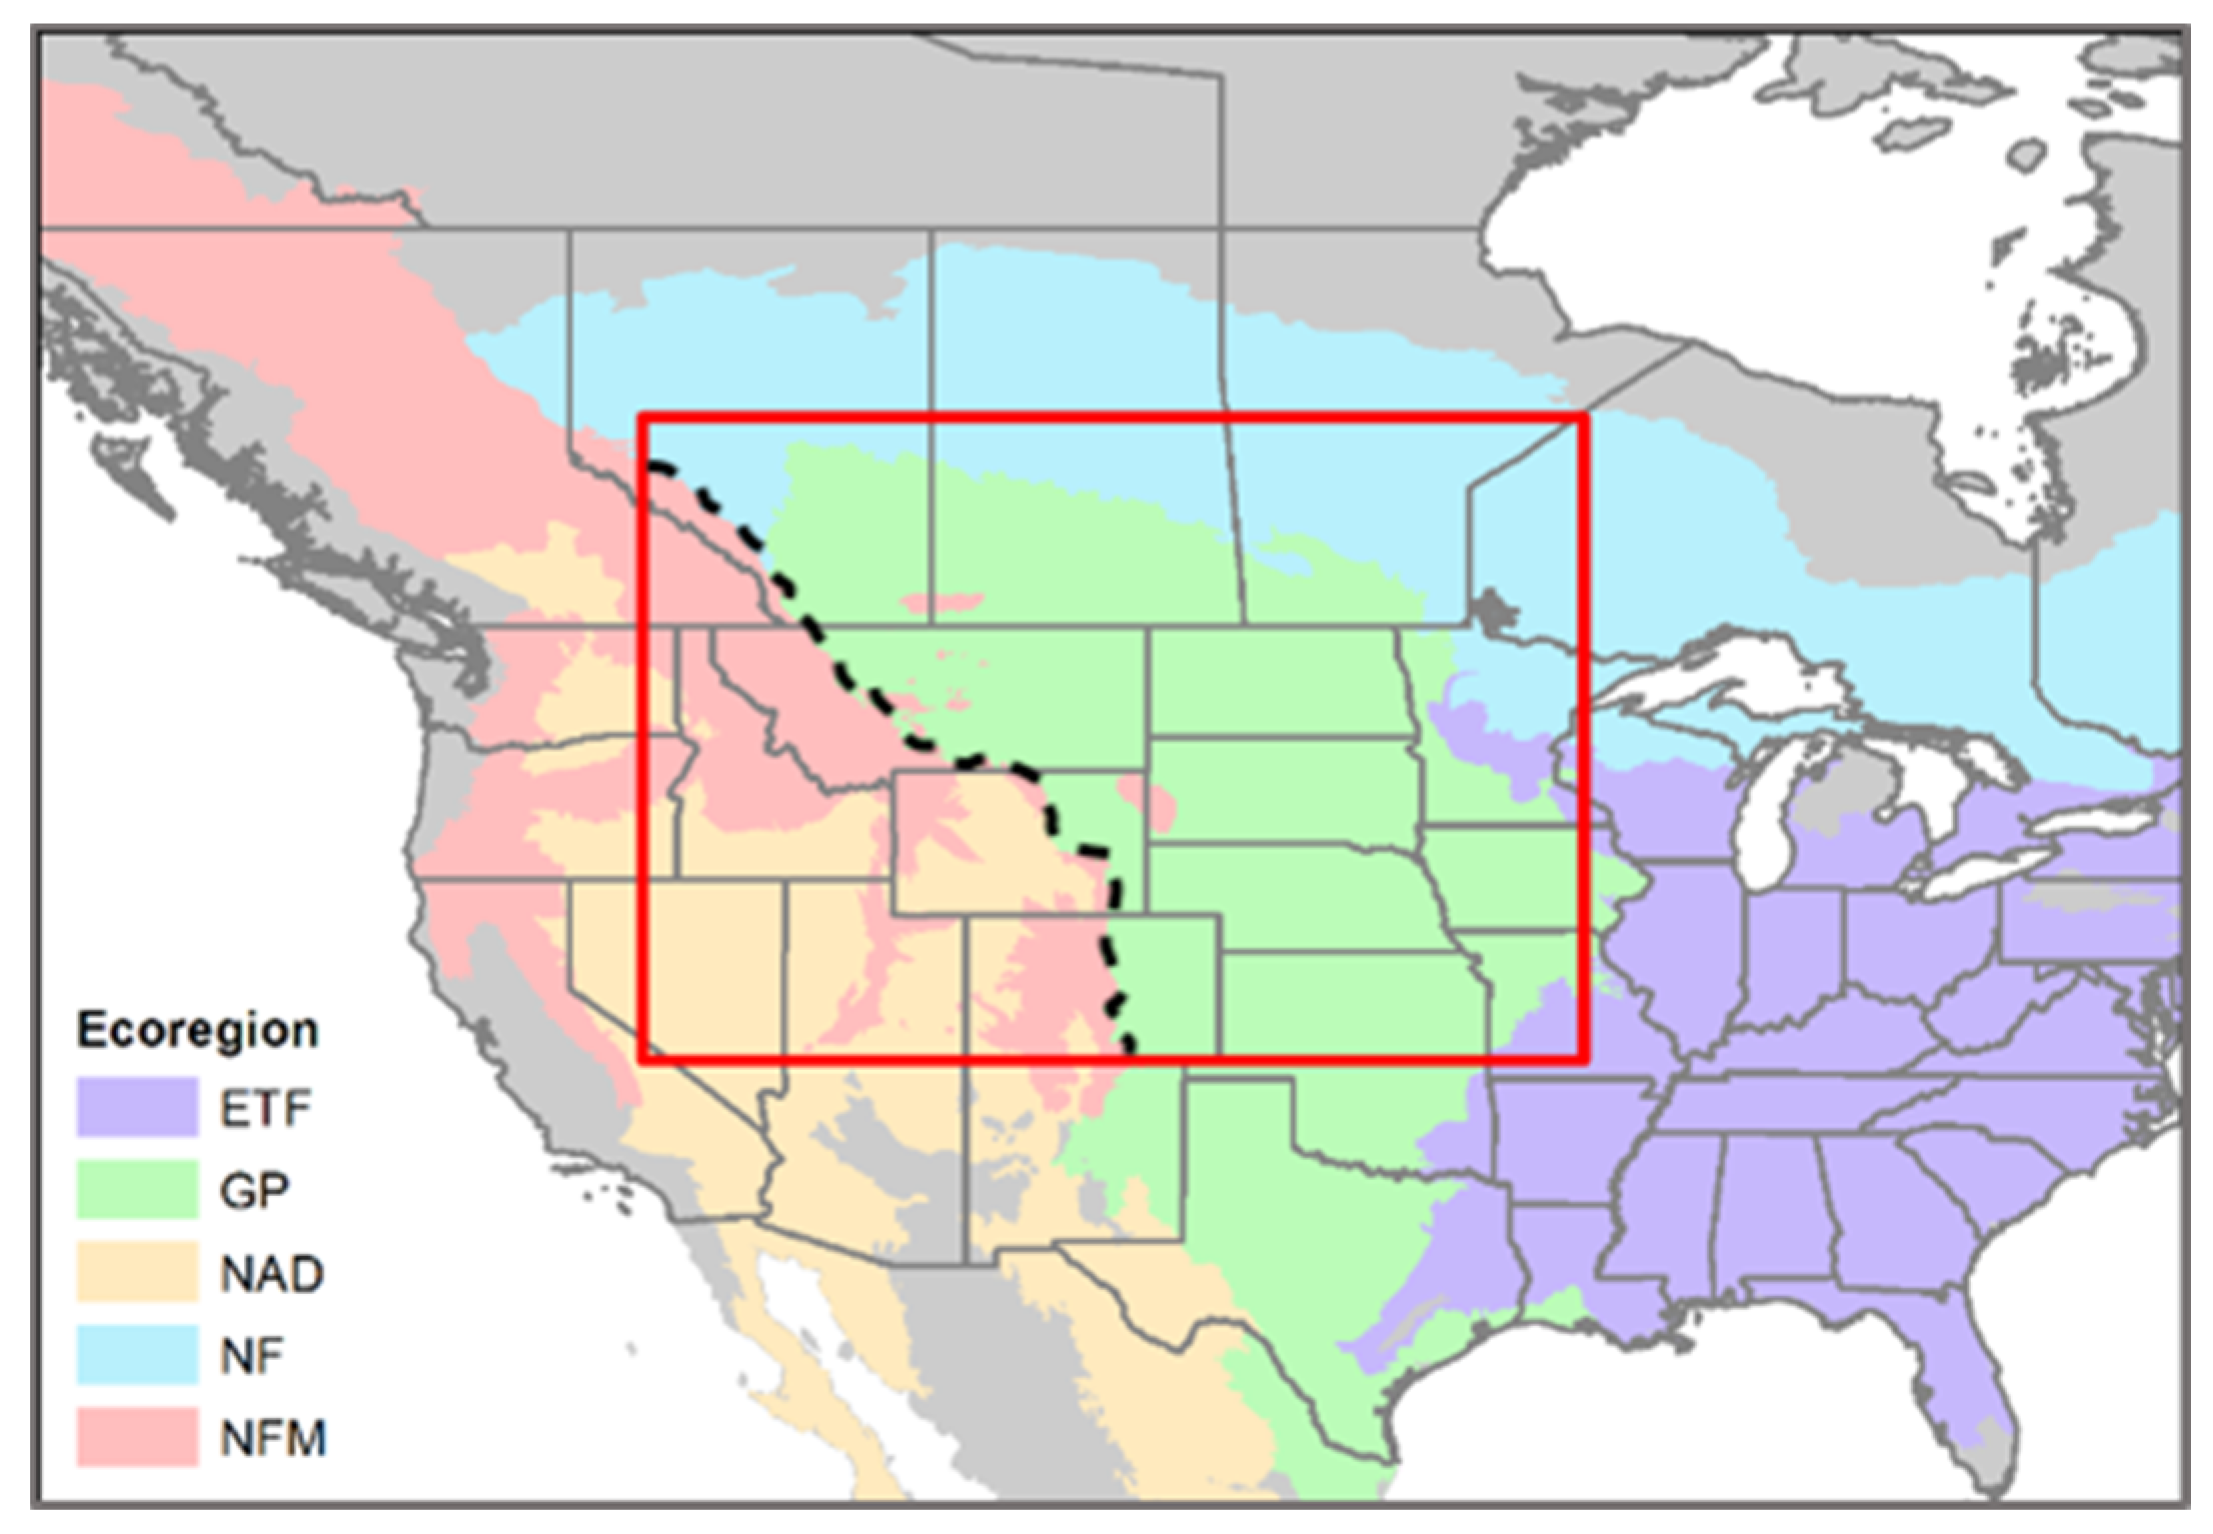
2.1. Study Area and Data Selection

The study area is bounded by 92° W, 118° W, 37° N, and 55° N (Figure 1). The northern and eastern boundaries were based on the extent of the Great Plains ecoregion, while the southern and western boundaries were chosen to include a majority of the Northwestern Forested Mountains ecoregion in central North America, as defined by the United States Environmental Protection Agency (EPA) level I ecoregion. In total, it comprises five ecoregions. For simplicity, we regrouped the Northwestern Forested Mountains and North American Deserts as the “mountain region”, and the remaining three ecoregions—Eastern Temperate Forests, Northern Forests, and Great Plains—as the “plains region” in our analysis.
We obtained daily records of snowfall and temperature from the Global Historical Climatology Network (GHCN) [18,19] within the United States, and from the Environment Canada Historical Data [20] for the area in Canada. Both datasets provide daily measurements of common meteorological variables, which include maximum and minimum temperature (at 0.1 °C precision) of the day for the U.S. stations or mean temperature of the day for the Canadian stations (at 0.1 °C precision), daily precipitation (at 1 mm precision), and daily snowfall (at 1 mm precision). The daily snowfall was measured as the vertical depth of snow that has fallen over the past 24 h using a snow board and snow ruler for most stations, and using an acoustic snow sensor for some stations in Canada. While different measurements may introduce different biases to the interpretation of the exact amounts of snowfall, their influence on trend analysis is limited as long as the same method is used consistently for a station. For daily mean temperature in the United States, we used the average of daily maximum and minimum temperature. We calculated the total snowfall and snow season mean temperature within each water year, defined as from 1 October to 30 September of the following year [21]. We defined the snow season as from October to May within each water year following Kunkel et al. [6]. The global multi-resolution terrain elevation data (GMTED) with a resolution of 250 m [22] were obtained from Google Earth Engine as our elevation data.
As most stations in Canada have no sufficient daily records before 1981 or after 2010, our analysis for the Canadian stations was limited to a study period from 1981 to 2010. The stations in the United States have relatively longer records. The study period for the U.S. stations was 1961–2017, overlapping with the periods examined by most of the studies summarized in Table 1. For snowfall records, Kunkel et al. proposed a set of data-screening criteria [6]: (1) stations must have less than 10% missing data from October to May during the entire study period; (2) stations must have no more than an entire month of missing data in the heart of the snow season (December, January, and February); (3) stations that had standardized anomalies greater than 5.0 or less than −5.0 during the snow season were further checked against Climatological Data publications or surrounding stations; (4) stations must have at least five valid snow season totals during the first decade and last decade; and (5) the long-term mean snowfall of the stations must be in excess of 12.5 cm. We first applied all five criteria and found the most stringent one to be criterion 2, which, if relaxed, would cause the number of stations to increase to 694 (586 in the United States and 108 in Canada) from 145 (90 in the Unites States and 55 in Canada). To avoid sample bias and increase the reliability of our results, we applied the Kunkel et al. criteria with the exception of their criterion 2 to screen the data. Our results showed (Figure 2a,c) that applying the relaxed data quality control, which significantly increased the number of stations for our study, did not affect the results very much. We also applied criteria 1, 3, and 4 (as criterion 5 does not apply to temperature) to the temperature records of the 694 stations that met the snowfall criteria, which resulted in 561 stations (459 in the Unites States and 102 in Canada) that met the data-screening criteria for both snowfall and temperature.
Climate within the study area is continental with considerable variability in precipitation, temperature, and the length of the seasons. The elevation in the mountain region ranges from 451 to 3451 m with an average of 1544 m; the elevation in the plains region ranges from 179 to 2191 m with an average of 601 m (Table 2). The average annual snowfall was 1788 mm and 856 mm, and the average snow season temperature was 2.2 °C and 2.0 °C, for the mountain and plains region (Table 2), respectively. Notice that annual snowfall fluctuated significantly in the mountain region with a standard deviation of 1504 mm and the highest record of 9594 mm, whereas the same statistics values for the plains region were 381 and 3616 mm, respectively (Table 2).

2.2. Statistical Analysis and Mapping

For each station, we estimated the magnitude of the snowfall trends based on the Thiel–Sen estimator following Feng and Hu [11]. The statistical significance of the trend was determined using the Mann–Kendall test with a p-value of 0.05 [11,14,15]. Both the Thiel–Sen estimator and Mann–Kendall test are non-parametric with no assumption on data distribution, and have been widely used for trend analysis in climatic studies [11,15,23].
To examine the distribution of snowfall trends in the entire study area, we applied Ordinary Kriging to interpolated the snowfall trends estimated for each stations into a grid of 5 km resolution, which represents the smallest nearest-neighbor distance among all stations. Ordinary Kriging has been frequently applied in climatic and environmental studies and shown to have an overall better accuracy and robustness than the other interpolation methods [24,25]. Ordinary Kriging was performed through Geostatistical Analyst of ArcMap, and semivariograms were carefully examined and proper models were selected to fit the station-based data for accurate prediction. While some trends failed to show statistical significance through the Mann–Kendall test, they were still considered valuable in understanding regional variations [26], thus we performed the ordinary Kriging using all stations in an attempt to capture the variabilities of snowfall at both large and small scales. For comparison, we also ran the ordinary Kriging interpolation using only those stations that showed significance through the Mann–Kendall test.
We conducted multiple linear regressions using only the 459 stations in the United States with data-screened records in both temperature and snowfall to explore the relationship between the estimated snowfall trends and two environmental variables: elevation and average snow season temperature. As we observed that the fluctuation of the snowfall over time correlated with the average snowfall in most of the stations, we also included the average annual snowfall (annual total snowfall averaged over the entire study period) as an additional variable to improve the overall model fitting. We used p-values and R2 to evaluate the statistical significance and the overall fitting of the models.

3. Results

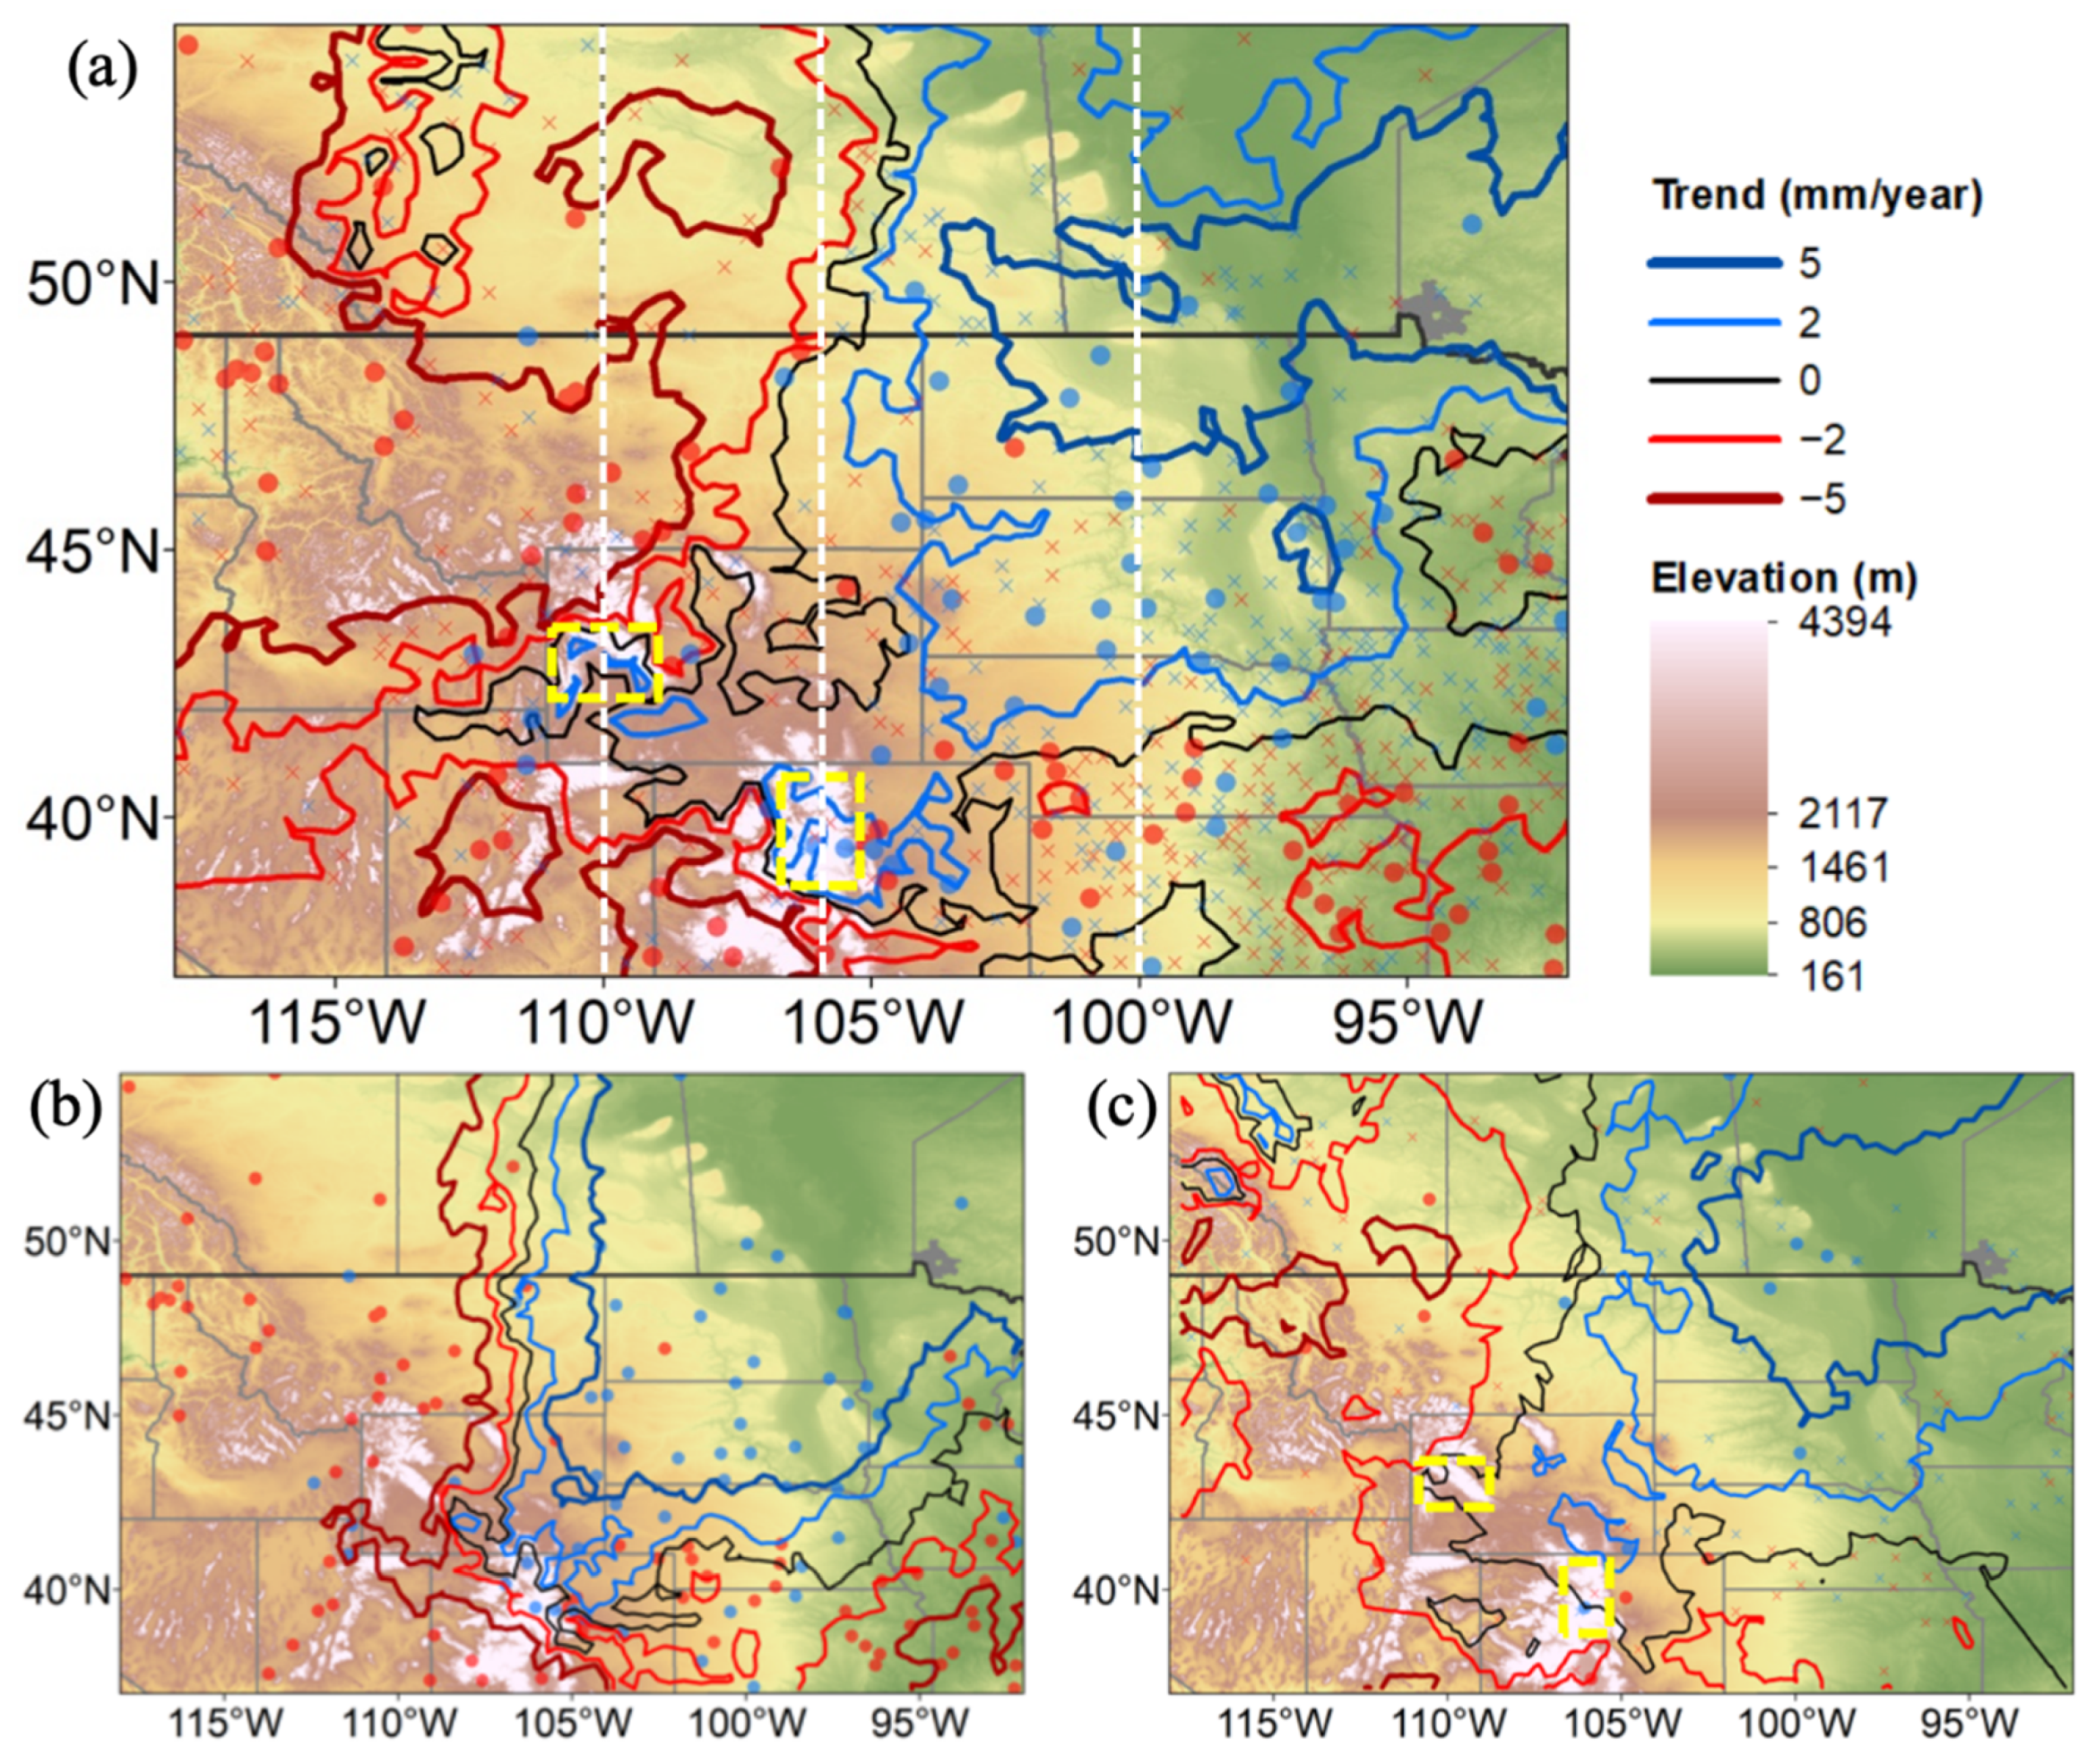
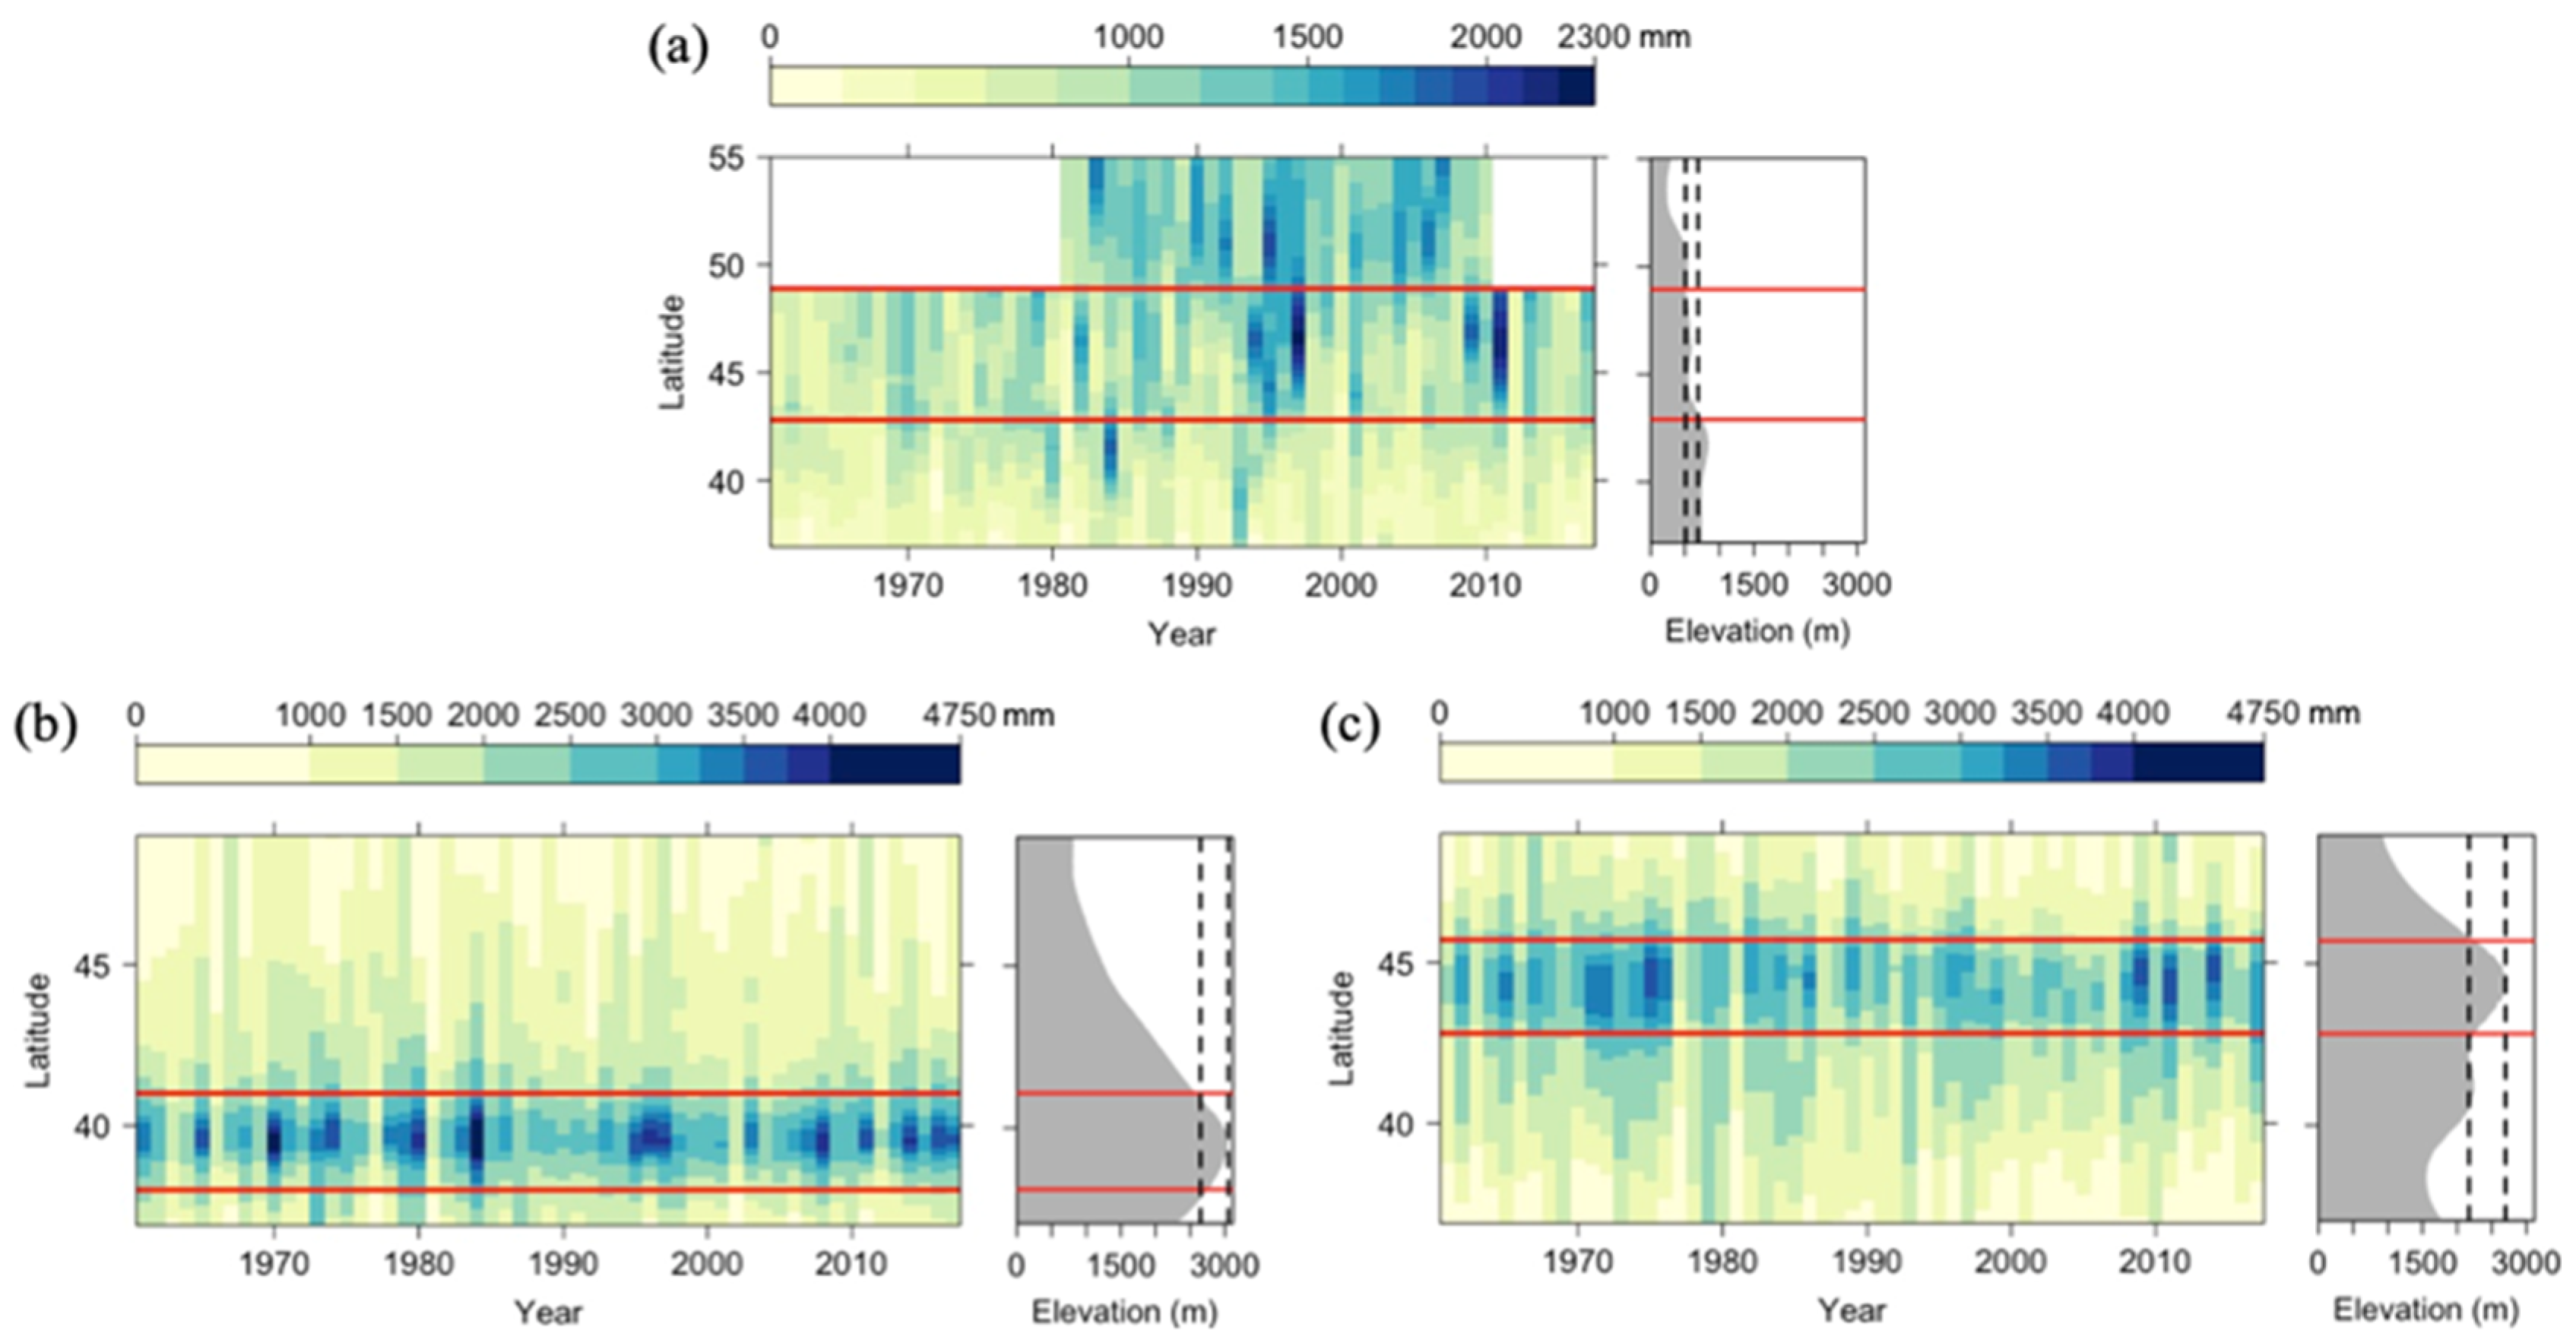
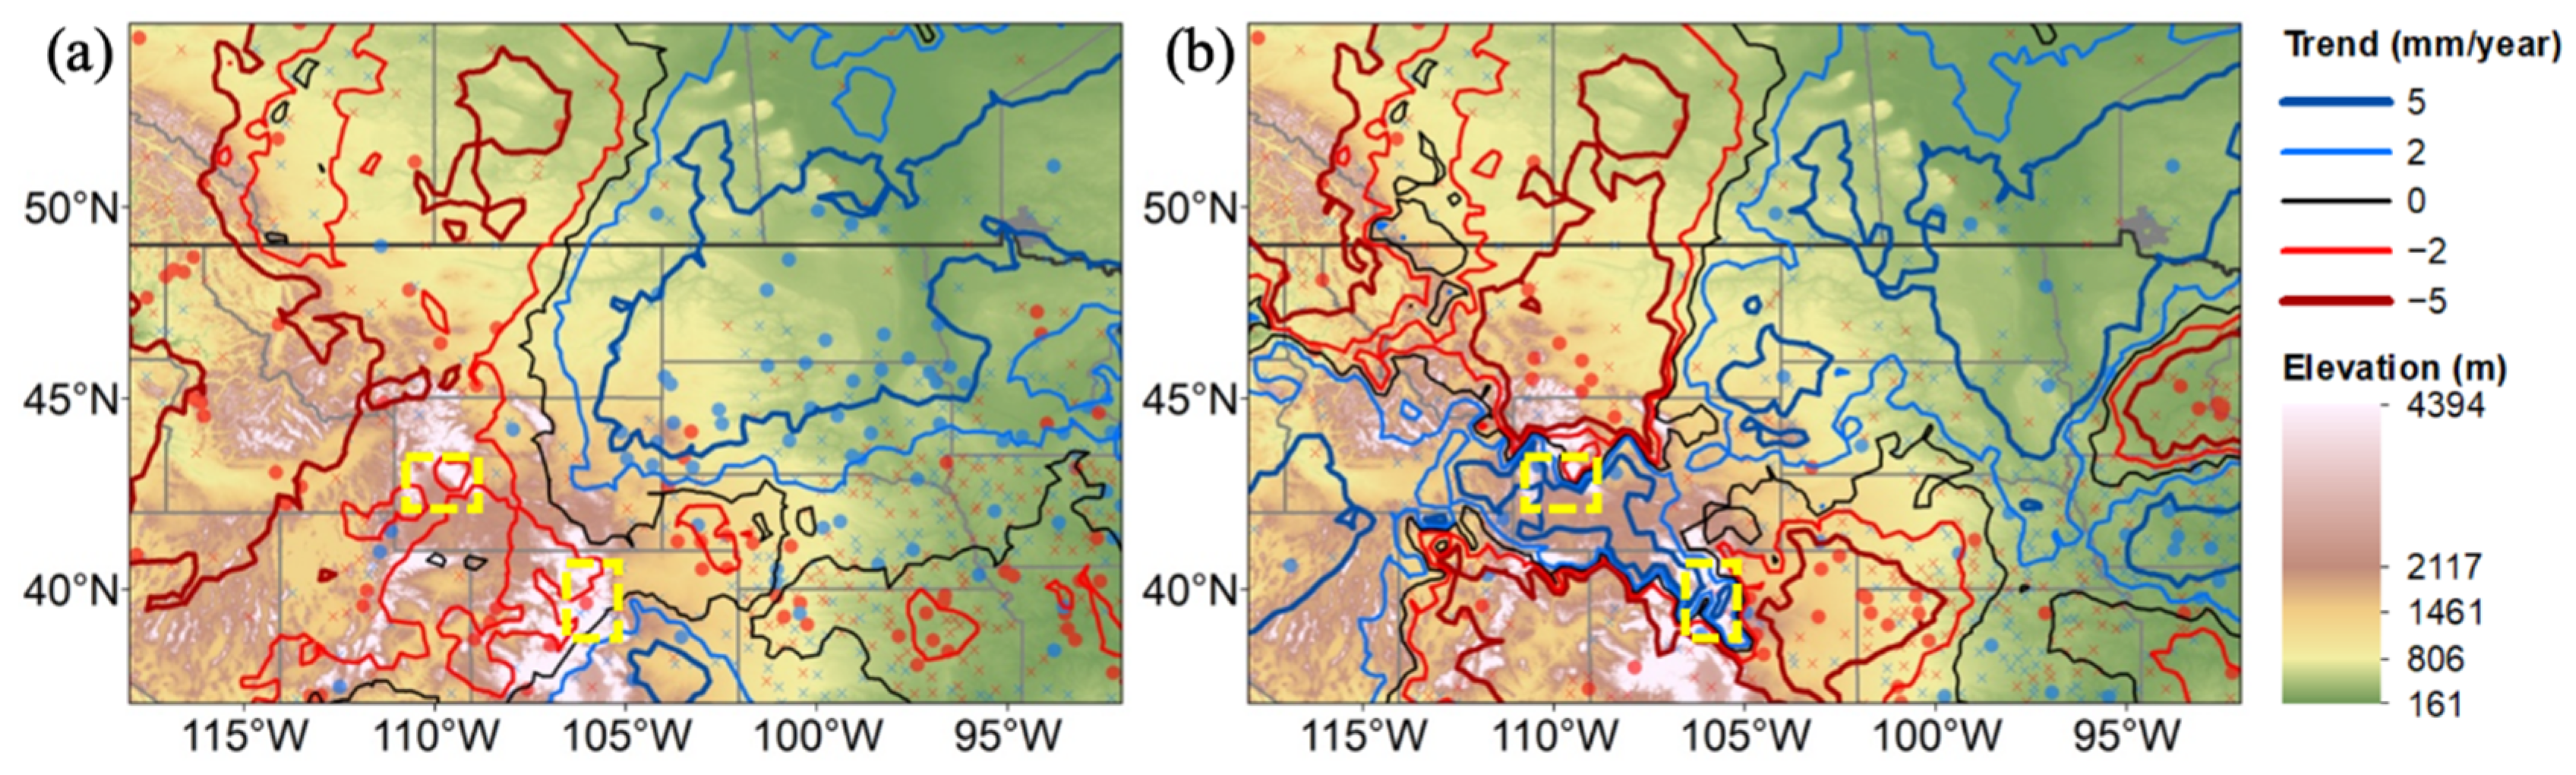
3.1. Annual Snowfall Trends

In our study area, 52% (359 out of 694) of stations exhibited a decreasing trend in snowfall and 21% (76 out of 359) of them are significant, while 48% (335 out of 694) of stations exhibited an increasing trend and 17% (57 out of 335) of them are significant (Figure 2a). The trends ranged from −52.4 to 38.6 mm/year with an average of −0.5 mm/year (Table 2). There seemed to be a distinct difference in the distribution of snowfall trends demarcated approximately by the 105° W meridian. To its east, where the plains region dominates, snowfall generally increased in the north of approximately 42° N, and decreased in the south. The rate of increase was mainly >2 mm/year, with part of North Dakota, Manitoba, and Ontario showing a >5 mm/year increase, whereas the rate of decrease was generally less than 2 mm/year. To the west of 105° W, where the mountain region dominates, we found a prevailing decreasing trend of >5 mm/year that was disrupted by two pocket locations in the Wind River Range and the Front Range experiencing increasing snowfall at a rate of 2–5 mm/year.
Using only the stations that showed significance in the Mann–Kendall test yielded largely similar results, including the prevailing decreasing trend of >5 mm/year in the west of 105° W and the increasing trends of >2 mm/year in the vast area east of 105° W (Figure 2b). However, applying the Mann–Kendall test would filter out a significant number of stations, especially in Canada, where only 11 stations would remain (Figure 2b). Similarly, including the second criterion of data selection used in Kunkel et al. [6], that is, that stations must have no more than an entire month of missing data in the heart of the snow season (December, January, and February), would have eliminated a significant number of stations as well. As shown in Figure 2c, where the second criterion for data screening was included, the distribution of snowfall trends largely remained the same as that identified in Figure 2a, where the second criterion was excluded. In particular, the two pocket areas that stood out with increasing trends among an overall backdrop of decreasing snowfall in the mountain region remained the same in location, albeit with a lower increasing rate in Figure 2c (0–2 mm/year) than in Figure 2a (2–5 mm/year). Thus, to ensure a balanced sample distribution that has a sufficient number of stations for statistical analysis, we decided to exclude criterion 2 from the data screening criteria. We also estimated snowfall trends using the least squares method, as used in Knowles et al. [14] and Wi et al. [15]. We did not find significant differences in the trends between the two methods. The snowfall trends estimated using the Thiel–Sen estimator and the least squares method correlated significantly with a coefficient of 0.99.
To closely examine the snowfall changes in the three areas that were identified with increasing trends, we picked three longitudes at the center of these three areas (white dashed lines in Figure 2a) and plotted the annual total snowfall over the entire study period (Figure 3). In the area north of 42° N along the 100° W meridian (Figure 3a), noticeably high annual snowfalls were observed in 1994–1997 and 2009–2011 in North and South Dakotas, with two extreme snow events in 1997 and 2011. Manitoba (at above 49° N) also experienced a slight increase of snowfall from 1981 to 2010. To test if the long-term increasing trend of snowfall in North and South Dakota is biased by the extreme snow events, we re-ran the linear regressions by excluding the two extreme snow events in 1997 and 2011. Without these two events, the trend would be 4.76 (vs. 6.38) mm per year with a p-value of 0.047 (vs. 0.017). Therefore, the extreme events may have amplified the trends in the region, but the annual snowfall has generally increased in North and South Dakota regardless.
The Front Range, located at approximately 106° W and 40° N and at an elevation of >2500 m, experienced a relatively consistent high annual snowfall since the 1990s (Figure 3b). Higher snowfalls were also observed in 2009, 2011, and 2014 in the Wind River Range located at around 110° W and 43° N and at an elevation of >2100 m (Figure 3c). Both of the mountain ranges are located at the highest elevations (2650–3050 m for the Front Range and 2100–2700 m for the Wind River Range) compared with the other locations at the same longitudes (Figure 3b,c). This is in contrast to the plains regions (Figure 3a), where the variation in elevation was much smaller and the area exhibiting increasing snowfall trends is not located at the highest elevation.

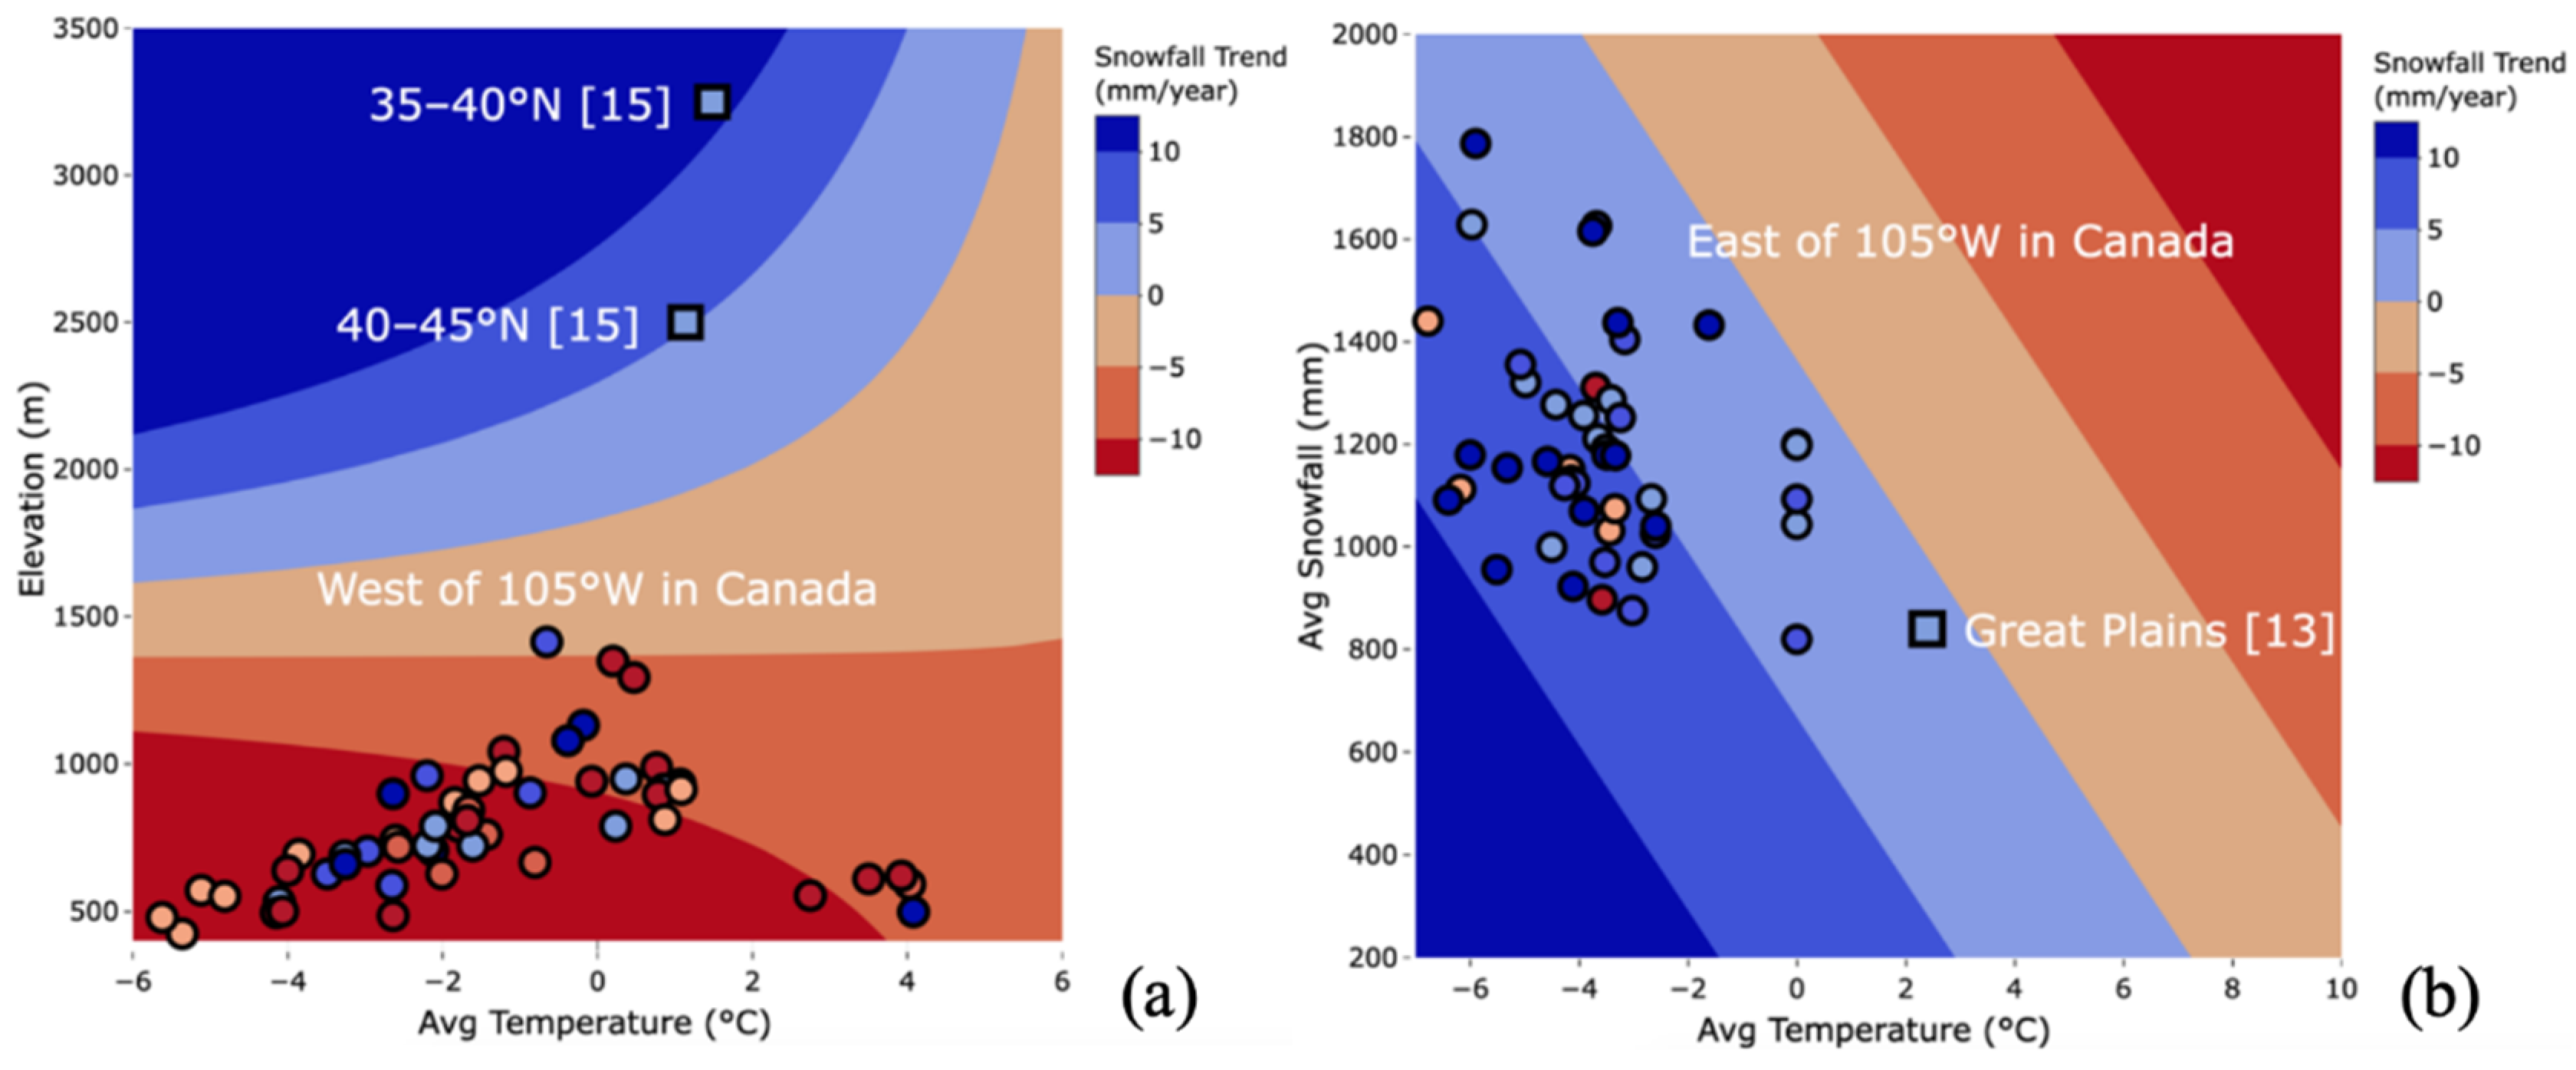
3.2. Relating Snowfall Trends to Potential Factors

We applied multiple linear regressions against the three variables (elevation, average snow season temperature, and average annual snowfall) only using the U.S. stations, which have a longer record. As the plains and mountain regions dominated the east and west of 105° W, respectively, we performed a separate analysis for the plains region and the mountain region in addition to the entire study area within the United States. The results are summarized in Table 3. Among the 459 stations used for the analysis, 75% (344 stations) and 25% (115 stations) were located in the plains and mountain regions, respectively.
Evaluated over the entire study area within the United States, the snowfall trend was found to be significantly correlated with all three independent variables. Among them, only average annual snowfall showed a significant correlation in both regional analyses, whereas elevation was only significant in the mountain region and average snow season temperature was only significant in the plains region. This suggests the influences of elevation and temperature on the snowfall trends are regionally dependent. The magnitudes of the coefficient estimates of the average annual snowfall are consistent across the entire study area and the two sub-regions, suggesting a rather steady association between the long-term average annual snowfall and the spatial distribution of snowfall trends. On average, our model predicts a 0.4 mm/year decrease of snowfall trend for a 100 mm increase in average annual snowfall. The average snow season temperature had a significant and negative effect in the plains region: snowfall trend would decrease by approximately 1.6 mm/year with a 1 °C increase in temperature. Elevation, on the other hand, was significant only in the mountain region, where snowfall trend increases by 11 mm/year for every 1 kilometer increase in elevation. The interaction term between average snow season temperature and elevation also showed statistical significance in the mountain region, suggesting that the underlying mechanism of how temperature affects changes of snowfall trends is likely non-linear and depends upon the topography. We ran the multilinear regressions by varying the combinations of the three variables to account for direct and interacting effects. The current specification, as shown in Table 3, gave the best performance. To verify the robustness of our results, we re-ran all three regressions using only the stations that showed significant snowfall trends (Figure 2b). Although most of the variables lost statistical significance, likely owing to the reduction in sample size, the signs and magnitudes of the coefficient estimates were largely similar (results not shown).

4. Discussion and Conclusions

Our finding of overall contrasting snowfall trend patterns demarcated by the 105° W meridian in central North America is in line with previous observations. In central North America, both Kluver and Leathers [4] and Kunkel et al. [6] found prevailing decreasing snowfall trends to the west and increasing trends mainly in North and South Dakota to the east of 105–107° W (Table 1). Similar longitudinal demarcation has also been reported for other relevant climate variables. The 100° W meridian is generally considered as the separation of relatively humid eastern and relatively dry western parts of the contiguous United States [27], which also respond differently to climate change. For example, Portmann et al. [28] found a clear separation of negative and positive trends in daily maximum temperature from 1950 to 2006 in the east and west of the 100° W meridian. Mauget [29] found an increasing streamflow related to increasing wetness over the last century in the east, and a decreasing streamflow resulted from warming temperature in the west of the same meridian. These findings of opposite trends suggested that the underlying mechanisms that have driven long-term snowfall changes in the east and west of the 105° W meridian might be different.
To the west of 105° W, where the Rocky Mountains dominate, we found the snowfall trend is dependent on elevation. To further illustrate this, we plotted the multiple regression model of snowfall trend (Trend) as a function of snow season temperature (T) and elevation (E) with a fixed median average annual snowfall value (S) of 1293 mm in the mountain region (Figure 4a):
T r e n d m o u n t a i n = 14.246 + 0.011 × E + 2.054 × T 0.004 × 1293 0.002 × E × T
Our model (Equation (1)) predicts increasing snowfall in mountain region with elevations above 2000 m and snow season temperatures lower than 2 °C. The rates increase with increasing elevation and decreasing snow season temperature (Figure 4a). At elevations lower than 1500 m, snowfall in the mountain region generally decreased with decreasing snow season temperature. Similar observations of increasing snowfall trends above an elevation threshold have been reported in both the Rocky Mountains and other mountain ranges globally. For the Rocky Mountains, Wi et al. [15] reported a rate of SFE increases of 0.44 mm/year (roughly equal to 4.4 mm/year in snowfall) at above 3000 m between 35° N and 40° N, and at above 2000 m between 40° N and 45° N from 1981 to 2005. For the same two areas, our model predicted increasing snowfall of 11.0 and 5.2 mm/year, respectively, from 1961 to 2017 (Figure 4a). Laternser and Schneebeli [30] found an increase in heavy snowfall events at above 1300 m in the Swiss Alps. Mir et al. [31] observed increasing trends of annual snowfall above 4000 m in the western Himalayas. While these earlier studies and our results all indicate a general control of elevation in shaping the snowfall change, the exact threshold, above which snowfall would increase, varies for different mountains, highlighting the regional difference on how elevation could affect snowfall. Our statistical analysis shows the observed snowfall trend is significantly correlated with elevation in the Rocky Mountains (Table 3), which has not been reported before and should be further tested and verified in other mountain regions to gain a better understanding of long-term trends of snowfall.
Comparing with the previous studies listed in Table 1, we have more stations in the mountain region and a study period that has not been examined before, which could partially explain the differences found between our results and the earlier results. In the Wind River Range, studies 6, 7, 8, and 11 in Table 1 [4,6,11,14] did not find increasing snowfall as they had virtually no stations in that area, whereas we observed an increasing trend in the same mountain range using data from 10 stations (Figure 2a). In the Front Range, Knowles et al. [14] found a relative mix of trends, with seven stations showing decreasing trend and eight stations showing increasing trend from 1949 to 2004. Also in the Front Range using SNOTEL stations, which are largely located in the mountains, Clow [32] and Fassnacht et al. [33] found a decrease of winter precipitation for 1978–2007 and 1981–2016, respectively. These results in the Front Range differ from the increasing trend of snowfall that we found from 1961 to 2017 (Figure 2a). Because the estimated trend is strongly dependent on the study period [34,35], we re-examined our data over two other periods.
The first period is 1949–2004 used by Knowles et al. [14], which is of a similar length to our study period, but with a different starting point; the second period is 1981–2010, which is a shorter period and corresponds to the one used in Clow [32] and Fassnacht et al. [33]. The same data filtering criteria of snowfall were applied to both periods. Compared with the original period from 1961 to 2017 (Figure 2a), the trend patterns for two sections of 1949–2004 and 1981–2010 were largely similar except for the mountain regions (Figure 5). For 1949–2004, a decreasing trend prevailed in the mountain region, including both the Wind River Range and the Front Range (Figure 5a), whereas the opposite—increasing trends—was observed for 1961–2017. The slight decreasing trends of 0–2 mm/year observed in the Front Range (Figure 5a) roughly agreed with Knowles et al. [14]. For 1981–2010, the increasing trends remained in the two mountain ranges, but extending to southwestern Wyoming and southern Idaho (Figure 5b), which again disagrees with the decreasing trends observed by Clow [32] and Fassnacht et al. [33]. Both Clow [32] and Fassnacht et al. [33] used precipitation from the SNOTEL dataset as their study variables. Unfortunately, the SNOTEL snow depth data, which we used to derive snowfall, are only available after 2000, and thus were unsuitable for this study. In general, we found snowfall trends in the mountain region sensitive to the study period, consistent with Chen and Grasby [34] and Venable et al. [35].
To the east of 105° W, where plains dominate and topography is less complex, we found the snow season temperature to be the main driver of snowfall trend. To further illustrate this, we plotted the predicted snowfall trend (Trend) of the plains region as a function of snow season temperature (T) and average annual snowfall (S) with a fixed elevation value of 442 m (Figure 4b):
T r e n d p l a i n = 11.035 0.003 × 442 1.649 × T 0.007 × S + 0.001 × 442 × T .
In this region, snowfall trends generally increased at locations with lower average snow season temperatures, and vice versa at locations with higher temperatures (Figure 4b). Davis et al. [36] investigated the snowfall–temperature relationship in Canada, where they found that warming temperature may lead to increasing snowfall through the increase of moisture when the average temperature is cold enough to enable snowfall. Kluver and Leathers [4], Kunkel et al. [6], and Hughes and Robinson [13] also found increasing snowfall and snow events in North and South Dakota, which is consistent with our finding in the same area (Figure 2a). Particularly, Hughes and Robinson [13] found an average increase of 2.8 mm/year from 1910 to 1993 in the Great Plains, where our model would predict an increase of 1.0 mm/year from 1961 to 2017 (Figure 4b). The same area also experienced significant flooding in 1997, 2009, and 2011 that was associated with record or near-record snowfalls during the winter season [37,38,39] (see also Figure 3a).
In Canada, Karl et al. [9], Groisman and Easterling [10], and Akinremi et al. [12] all found a decreasing trend of snowfall from 1950 to the 1990s in Alberta, Saskatchewan, and Manitoba, whereas we found opposite trends demarcated by the 105° W (Figure 2a). The reason for this discrepancy is unclear and could be associated with different study periods as well as types of data used. As the stations in Canada were not used in the multiple linear regression, we further tested our models against the actual observations reported in Canada. The Canadian stations in the east of 105° W showed increases in snowfall averaging 5.7 mm/year, which corresponds well with our prediction of an average of 5.5 mm/year from the plains model (Figure 4b). To the west of 105° W, the Canadian stations showed a general decreasing trend of −3.0 mm/year, which, unfortunately, is inconsistent with our mountain model (Figure 4a). This probably suggests that the snowfall trend in Canada to the west of 105° W is influenced by a mechanism that our model did not capture. For example, Davis et al. [36] found their predicted snowfall increase in the same area significantly deviated from the observation with more stations showing negative trends and attributed this discrepancy to the frequent warm, dry condition caused by katabatic winds, which may have inversed the relationship between snowfall and temperature.
In summary, our study found that the snowfall trends over 1961–2017 in central North America showed different patterns, driven by different mechanisms in the east or west of 105° W. In the east, where the plains region dominated, snowfall trends were mainly driven by snow season temperature, generally increasing in the areas with lower average snow season temperatures and decreasing in the areas with higher temperatures. In the west, where the mountain region dominated, elevation and its interaction with temperature had significant and more complex impacts on snowfall trends. Particularly, increasing trends can be found in areas with a combination of higher elevations (>2000 m) and lower average snow season temperatures (<2 °C), such as the Wind River Range and the Front Range. These snowfall increases in the mountains can be crucial as they directly contribute to the water supply for agricultural and municipal water use [1]. Our results also emphasize the importance of accounting for elevation in studying regional climate change and water supply in regions with complex topography, where water supply relies heavily on snowfall.

Author Contributions

Research design, H.Z., X.Z., and J.V.; data collection and analysis, J.Z.; writing—original draft preparation, J.Z.; writing—review and editing, J.Z., H.Z., X.Z., and J.V. All authors have read and agreed to the published version of the manuscript.

Funding

The research was supported by National Science Foundation (NSF) Experimental Program to Stimulate Competitive Research (EPSCoR) grant (#IIA-1355466).

Conflicts of Interest

The authors declare no conflict of interest. The funding sponsors had no role in the design of the study; in the collection, analyses, or interpretation of data; in the writing of the manuscript; and in the decision to publish the results.

References

  1. Barnett, T.P.; Adam, J.C.; Lettenmaier, D.P. Potential Impacts of a Warming Climate on Water Availability in Snow-Dominated Regions. Nature 2005, 438, 303–309. [Google Scholar] [CrossRef] [PubMed]
  2. O’Gorman, P.A. Contrasting Responses of Mean and Extreme Snowfall to Climate Change. Nature 2014, 512, 416–418. [Google Scholar] [CrossRef] [PubMed] [Green Version]
  3. Hall, A. Projecting Regional Change. Science 2014, 346, 1461–1462. [Google Scholar] [CrossRef] [PubMed]
  4. Kluver, D.; Leathers, D. Regionalization of Snowfall Frequency and Trends over the Contiguous United States. Int. J. Climatol. 2015, 35, 4348–4358. [Google Scholar] [CrossRef]
  5. Leathers, D.J.; Mote, T.L.; Kuivinen, K.C.; McFeeters, S.; Kluck, D.R. Temporal Characteristics of USA Snowfall 1945–1946 through to 1984–1985. Int. J. Climatol. 1993, 13, 65–76. [Google Scholar] [CrossRef]
  6. Kunkel, K.E.; Palecki, M.; Ensor, L.; Hubbard, K.G.; Robinson, D.; Redmond, K.; Easterling, D. Trends in Twentieth-Century U.S. Snowfall Using a Quality-Controlled Dataset. J. Atmos. Ocean. Technol. 2009, 26, 33–44. [Google Scholar] [CrossRef] [Green Version]
  7. Kapnick, S.B.; Delworth, T.L. Controls of Global Snow under a Changed Climate. J. Clim. 2013, 26, 5537–5562. [Google Scholar] [CrossRef]
  8. Krasting, J.P.; Broccoli, A.J.; Dixon, K.W.; Lanzante, J.R. Future Changes in Northern Hemisphere Snowfall. J. Clim. 2013, 26, 7813–7828. [Google Scholar] [CrossRef] [Green Version]
  9. Karl, T.R.; Groisman, P.Y.; Knight, R.W.; Heim, R.R. Recent Variations of Snow Cover and Snowfall in North America and Their Relation to Precipitation and Temperature Variations. J. Clim. 1993, 6, 1327–1344. [Google Scholar] [CrossRef] [Green Version]
  10. Groisman, P.Y.; Easterling, D.R. Variability and Trends of Total Precipitation and Snowfall over the United States and Canada. J. Clim. 1994, 7, 184–205. [Google Scholar] [CrossRef] [Green Version]
  11. Feng, S.; Hu, Q. Changes in Winter Snowfall/Precipitation Ratio in the Contiguous United States. J. Geophys. Res. Atmos. 2007, 112. [Google Scholar] [CrossRef]
  12. Akinremi, O.O.; McGinn, S.M.; Cutforth, H.W. Precipitation Trends on the Canadian Prairies. J. Clim. 1999, 12, 2996–3003. [Google Scholar] [CrossRef]
  13. Hughes, M.G.; Robinson, D.A. Historical Snow Cover Variability in the Great Plains Region of the USA: 1910 through to 1993. Int. J. Climatol. 1996, 16, 1005–1018. [Google Scholar] [CrossRef]
  14. Knowles, N.; Dettinger, M.D.; Cayan, D.R. Trends in Snowfall versus Rainfall in the Western United States. J. Clim. 2006, 19, 4545–4559. [Google Scholar] [CrossRef] [Green Version]
  15. Wi, S.; Dominguez, F.; Durcik, M.; Valdes, J.; Diaz, H.F.; Castro, C.L. Climate Change Projection of Snowfall in the Colorado River Basin Using Dynamical Downscaling. Water Resour. Res. 2012, 48. [Google Scholar] [CrossRef] [Green Version]
  16. Bales, R.C.; Molotch, N.P.; Painter, T.H.; Dettinger, M.D.; Rice, R.; Dozier, J. Mountain Hydrology of the Western United States. Water Resour. Res. 2006, 42. [Google Scholar] [CrossRef]
  17. Quiring, S.M.; Kluver, D.B. Relationship between Winter/Spring Snowfall and Summer Precipitation in the Northern Great Plains of North America. J. Hydrometeor. 2009, 10, 1203–1217. [Google Scholar] [CrossRef]
  18. Menne, M.J.; Durre, I.; Korzeniewski, B.; McNeal, S.; Thomas, K.; Yin, X.; Anthony, S.; Ray, R.; Vose, R.S.; Gleason, B.E.; et al. Global Historical Climatology Network-Daily (GHCN-Daily), Version 3. NOAA National Climatic Data Center, 2012. Available online: https://data.nodc.noaa.gov/cgi-bin/iso?id=gov.noaa.ncdc:C00861 (accessed on 25 March 2020).
  19. Menne, M.J.; Durre, I.; Vose, R.S.; Gleason, B.E.; Houston, T.G. An Overview of the Global Historical Climatology Network-Daily Database. J. Atmos. Ocean. Technol. 2012, 29, 897–910. [Google Scholar] [CrossRef]
  20. Historical Data-Climate-Environment and Climate Change Canada. Available online: https://climate.weather.gc.ca/historical_data/search_historic_data_e.html (accessed on 19 October 2018).
  21. USGS—Water Resources of the United States. Available online: https://water.usgs.gov/nwc/explain_data.html (accessed on 11 April 2018).
  22. Danielson, J.J.; Gesch, D.B. Global Multi-Resolution Terrain Elevation Data 2010 (GMTED2010); U.S. Geological Survey Open-File Report 2011–1073; U.S. Geological Survey: Reston, VA, USA, 2011; p. 26.
  23. Huntington, T.G.; Hodgkins, G.A.; Keim, B.D.; Dudley, R.W. Changes in the Proportion of Precipitation Occurring as Snow in New England (1949–2000). J. Clim. 2004, 17, 2626–2636. [Google Scholar] [CrossRef]
  24. Cressie, N.A.C. Statistics for Spatial Data; Wiley: Hoboken, NJ, USA, 1993. [Google Scholar]
  25. Hunter, R.D.; Meentemeyer, R.K. Climatologically Aided Mapping of Daily Precipitation and Temperature. J. Appl. Meteorol. 2005, 44, 1501–1510. [Google Scholar] [CrossRef]
  26. Shahid, S. Rainfall Variability and the Trends of Wet and Dry Periods in Bangladesh. Int. J. Climatol. 2010, 30, 2299–2313. [Google Scholar] [CrossRef]
  27. Seager, R.; Lis, N.; Feldman, J.; Ting, M.; Williams, A.P.; Nakamura, J.; Liu, H.; Henderson, N. Whither the 100th Meridian? The Once and Future Physical and Human Geography of America’s Arid–Humid Divide. Part I: The Story So Far. Earth Interact. 2017, 22, 1–22. [Google Scholar] [CrossRef] [Green Version]
  28. Portmann, R.W.; Solomon, S.; Hegerl, G.C. Spatial and Seasonal Patterns in Climate Change, Temperatures, and Precipitation across the United States. Proc. Natl. Acad. Sci. USA 2009, 106, 7324–7329. [Google Scholar] [CrossRef] [PubMed] [Green Version]
  29. Mauget, S.A. Multidecadal Regime Shifts in U.S. Streamflow, Precipitation, and Temperature at the End of the Twentieth Century. J. Clim. 2003, 16, 3905–3916. [Google Scholar] [CrossRef] [Green Version]
  30. Laternser, M.; Schneebeli, M. Long-Term Snow Climate Trends of the Swiss Alps (1931–1999). Int. J. Climatol. 2003, 23, 733–750. [Google Scholar] [CrossRef]
  31. Mir, R.A.; Jain, S.K.; Saraf, A.K.; Goswami, A. Decline in Snowfall in Response to Temperature in Satluj Basin, Western Himalaya. J. Earth Syst. Sci. 2015, 124, 365–382. [Google Scholar] [CrossRef] [Green Version]
  32. Clow, D.W. Changes in the Timing of Snowmelt and Streamflow in Colorado: A Response to Recent Warming. J. Clim. 2009, 23, 2293–2306. [Google Scholar] [CrossRef]
  33. Fassnacht, S.R.; Venable, N.B.H.; McGrath, D.; Patterson, G.G. Sub-Seasonal Snowpack Trends in the Rocky Mountain National Park Area, Colorado, USA. Water 2018, 10, 562. [Google Scholar] [CrossRef] [Green Version]
  34. Chen, Z.; Grasby, S.E. Impact of Decadal and Century-Scale Oscillations on Hydroclimate Trend Analyses. J. Hydrol. 2009, 365, 122–133. [Google Scholar] [CrossRef]
  35. Venable, N.B.H.; Fassnacht, S.R.; Adyabadam, G.; Tumenjargal, S.; Fernández-Giménez, M.; Batbuyan, B. Does the Length of Station Record Influence the Warming Trend That is Perceived by Mongolian Herders near the Khangai Mountains? Pirineos 2012, 167, 69–86. [Google Scholar] [CrossRef] [Green Version]
  36. Davis, R.E.; Lowit, M.B.; Knappenberger, P.C.; Legates, D.R. A Climatology of Snowfall-Temperature Relationships in Canada. J. Geophys. Res. Atmos. 1999, 104, 11985–11994. [Google Scholar] [CrossRef]
  37. Simonovic, S.P.; Carson, R.W. Flooding in the Red River Basin—Lessons from Post Flood Activities. Nat. Hazards 2003, 28, 345–365. [Google Scholar] [CrossRef]
  38. Stadnyk, T.; Dow, K.; Wazney, L.; Blais, E.-L. The 2011 Flood Event in the Red River Basin: Causes, Assessment and Damages. Can. Water Resour. J.Rev. Can. Ressour. Hydr. 2016, 41, 65–73. [Google Scholar] [CrossRef]
  39. Wazney, L.; Clark, S.P. The 2009 Flood Event in the Red River Basin: Causes, Assessment and Damages. Can. Water Resour. J.Rev. Can. Ressour. Hydr. 2016, 41, 56–64. [Google Scholar] [CrossRef]
Figure 1. Study area (red box) and its cover of United States Environmental Protection Agency (EPA) level I ecoregions in North America. ETF: Eastern Temperate Forests; GP: Great Plains; NAD: North American Deserts; NF: Northern Forests; NFM: Northwestern Forested Mountains. Dashed line represents the boundary between the mountain and plains region that we defined.
Geosciences 10 00157 g001
Figure 2. The distribution of annual snowfall trends estimated using (a) all stations, (b) stations that showed significance through the Mann–Kendall test, and (c) stations that also met the second criterion of Kunkel et al. [6]. For stations, blue and red represent increasing and decreasing trends, respectively, and circles and cross marks represent significant and insignificant trends at the 95% confidence level, respectively. Contour lines are the ordinary Kriging results derived from the individual station results, with increasing and decreasing trends indicated by progressively thicker blue and red lines, respectively. Boxes of yellow dashed lines in (a,c) roughly represent the locations of the Front Range (at 106° W) and the Wind River Range (at 110° W), and the white dashed lines in (a) indicate the 100° W, 106° W, and 110° W meridians.
Geosciences 10 00157 g002
Figure 3. Annual snowfall from 1961 to 2017 at (a) 100° W, (b) 106° W, and (c) 110° W. In each graph, the amount of snowfall is represented by colors changing progressively from light yellow to blue and the corresponding elevation is shown on the right. Different color scales were applied to the plains and the mountain region for better visualization. The zones between the red lines represent the latitudes of (a) North and South Dakota, (b) Front Range, and (c) Wind River Range.
Geosciences 10 00157 g003
Figure 4. Contour plots of predicted snowfall trends based on the multiple linear regression models for (a) the mountain region using Equation (1) and (b) the plains region using Equation (2). Background color bands represent the predicted snowfall trends. Colored circles represent the observed stations-based snowfall trends in Canada in (a) the west of 105° W and (b) the east of 105° W. Colored squares represent the observed snowfall trend reported by (a) Wi et al. [15] and (b) Hughes and Robinson [13] in the areas noted next to them.
Geosciences 10 00157 g004
Figure 5. Same as Figure 2a, but using periods of (a) 1949–2004 and (b) 1981–2010 for the U.S. stations. Boxes of yellow dashed lines represent the locations of the Front Range and the Wind River Range.
Geosciences 10 00157 g005
Table 1. Summary of snowfall changes in North America reported in the previous studies and this study. The reported trends are visualized, with blue and red representing increasing and decreasing trends, respectively, and grey representing mixed or insignificant trends. The red box delineates the area of this study. SFE stands for snowfall water equivalent.
StudyStudy RegionStudy TypeStudy PeriodMajor Finding
1Kapnick and Delworth [7]GlobalGCMs
Prediction
280-year based on 1990 levelAnnual snowfall generally increase at 60° N and above, decrease below 60° N
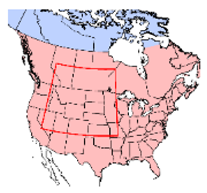
 Geosciences 10 00157 i001
2Krasting et al. [8]Northern HemisphereGCMs
Prediction
2006–2100
3O’Gorman [2]Northern HemisphereGCMs
Prediction
1981–2000 to 2081–2100
4Karl et al. [9]North AmericaObservation1950–1979 to 1980sAnnual snowfall increased at 55–70° N and decreased below 55° N.
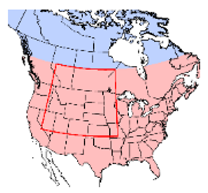
 Geosciences 10 00157 i002
5Groisman and Easterling [10]North AmericaObservation1950–1990Annual snowfall decreased at 45–55° N and increased in the rest of study area above 35° N.
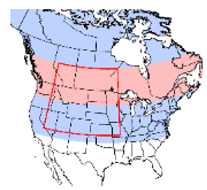
 Geosciences 10 00157 i003
6Kunkel et al. [6]Contiguous U.S.Observation1930–2007Annual snowfall increased in the Great Plains and the southern Rocky Mountains, decreased in the northern Rocky Mountains. Geosciences 10 00157 i004
7Feng and Hu [11]Contiguous U.S.Observation1949–2005Winter SFE decreased in the west coast, mixed in the rest of the country. Geosciences 10 00157 i005
8Kluver and Leathers [4]Contiguous U.S.Observation1930–2007Annual snowfall events increased in the northern Great Plains, decreased in the southeast and from the Rocky Mountains to the western coast. Geosciences 10 00157 i006
9Akinremi et al. [12]Canadian PrairiesObservation1961–1995Annual snowfall significantly decreased in the entire study area. Geosciences 10 00157 i007
10Hughes and Robinson [13]U.S. Great PlainsObservation1910–1993Annual snowfall significantly increased in the entire study area. Geosciences 10 00157 i008
11Knowles et al. [14]Western U.S.Observation1949–2004Winter SFE decreased along the west coast and in the northern Rocky Mountains, increased in the southern Rocky Mountains in New Mexico. Geosciences 10 00157 i009
12Wi et al. [15]Colorado River BasinObservation1981–2005Winter SFE increased at high elevations in the mountains from 35 to 45° N, decreased in the rest of the study area. Geosciences 10 00157 i010
13Current StudyCentral North AmericaObservation1961–2017 in the United States 1981–2010 in CanadaAnnual total snowfall increased in North Dakota, South Dakota, and Manitoba, and in Front Range and Wind River Range. Decreased in the rest of the region. Geosciences 10 00157 i011
Table 2. Descriptive statistics of elevation, average annual snowfall, average snow season temperature, and annual total snowfall trend for the entire study area, the mountain region, and the plains region, respectively.
Entire Study AreaMountain RegionPlains Region
NMeanSDMinMaxNMeanSDMinMaxNMeanSDMinMax
Elevation (m)6948045721793451149154460945134515456013521792191
Avg. Snowfall (mm)694105686317595941491788150417595945458563812053616
Avg. Temperature (°C)5612.03.6−8.211.31312.22.8−5.211.34302.03.8−8.29.2
Snowfall Trend (mm/year)694−0.58.8−52.438.6149−3.913.3−52.438.65450.56.8−40.136.7
Table 3. Multiple linear regression results in the study area within the Unites States, the plains and the mountain regions. Significance at 95% confidence level is shown in bold.
Entire Study AreaPlains RegionMountain Region
No. of Observation459344115
Coef.pCoef.pCoef.p
Elevation0.0020.017−0.0030.0830.0112 × 10−5
Avg. Temperature−0.5580.003−1.6492 × 10−122.0540.086
Avg. Snowfall−0.0042 × 10⁻¹²−0.0072 × 10⁻⁸−0.0043 × 10⁻⁵
Elevation × Avg. Temperature−5 × 10−40.0080.0010.001−0.0020.019
Model R20.125 0.171 0.186

