Review

Hydroacoustic Mapping of Geogenic Hard Substrates: Challenges and Review of German Approaches

1
Leibniz Institute for Baltic Sea Research Warnemünde, 18119 Rostock, Germany
2
Alfred Wegener Institute, Helmholtz Centre for Polar and Marine Research, Wadden Sea Research Station, 25992 List/Sylt, Germany
*
Author to whom correspondence should be addressed.
Geosciences 2020, 10(3), 100; https://doi.org/10.3390/geosciences10030100
Submission received: 17 January 2020 / Revised: 6 March 2020 / Accepted: 7 March 2020 / Published: 9 March 2020
(This article belongs to the Special Issue Marine Habitat Mapping: Selected Papers from "GeoHab 2021")

Abstract

:
Subtidal hard substrate habitats are unique habitats in the marine environment. They provide crucial ecosystem services that are socially relevant, such as water clearance or as nursery space for fishes. With increasing marine usage and changing environmental conditions, pressure on reefs is increasing. All relevant directives and conventions around Europe include sublittoral hard substrate habitats in any manner. However, detailed specifications and specific advices about acquisition or delineation of these habitats are internationally rare although the demand for single object detection for e.g., ensuring safe navigation or to understand ecosystem functioning is increasing. To figure out the needs for area wide hard substrate mapping supported by automatic detection routines this paper reviews existing delineation rules and definitions relevant for hard substrate mapping. We focus on progress reached in German approval process resulting in first hydroacoustic mapping advices. In detail, we summarize present knowledge of hard substrate occurrence in the German North Sea and Baltic Sea, describes the development of hard substrate investigations and state of the art mapping techniques as well as automated analysis routines.

1. Introduction

The ecological importance of geogenic hard substrates for marine ecosystems is intensively studied and beyond dispute [1,2,3]. Geogenic hard substrates can act as oases [4] and are associated with high biomass and species richness [5,6,7]. Sessile invertebrates use them as settling grounds whereas mobile organisms use hard substrates for shelter, foraging and spawning [6,8]. The communities living on hard substrates provide irreplaceable ecosystem services in nutrient cycling, water purification and benthic-pelagic coupling [3,9]. Furthermore, hard substrates serve as ‘stepping stones’ for e.g., larvae dispersion and manifestation of subpopulations [10,11]. Sublittoral hard substrate habitats and its communities suffer under increasing pressure caused directly or indirectly by human activities such as fishing, resource exploitation, coastal management, eutrophication or climate change [3,12,13]. At the same time, mankind is under pressure to take countermeasures and protect these valuable habitats [14,15]. In the European Union, marine habitat and biodiversity conservation, including assessment and monitoring of the environmental status, is regulated by two inter-related directives adopted by the European Commission:
  • The “Council Directive 92/43/EEC on the Conservation of Natural Habitats and of Wild Fauna and Flora” known as the Habitats Directive (HD) assures the conservation of natural habitats and lists these in Annex 1 [16]. To clear any ambiguities in the interpretation of Annex 1 the Directorate General for Environment (DG ENV) developed the “Interpretation Manual of European Union Habitats” [17]. The HD forms (together with the Birds Directive) the foundation of the Natura 2000 ecological network of protected areas.
  • The Marine Strategy Framework Directive (MSFD, 2008/56/EC) aims to achieve or maintain good environmental status of all marine ecosystems including benthic habitats under descriptor 1 (biodiversity) and descriptor 6 (seafloor integrity) across the European Union while enabling the sustainable use of marine goods and services [18].
Similar aims have the regional agreements OSPAR (Convention for the Protection of the Marine Environment of the North–East Atlantic) and HELCOM (Baltic Marine Environment Protection Commission—Helsinki Commission) or the UN Convention on Biological Diversity (CBD).
All relevant directives and conventions around Europe include sublittoral hard substrate habitats in any manner but detailed specifications are rare and specific advices such as acquisition, delineation and minimum spatial size are not provided in these legislations. However, especially when stones (cobbles, boulders and even larger clasts) are loosely scattered on sandy or mixed substrate, delineation rules are important to establish for example special areas of conservation (SAC) or in the course of approval procedures for offshore constructions such as offshore wind farms, cables or pipelines. The most common technique for habitat mapping and the identification of hard substrate areas is the analysis of sidescan sonar (SSS) or multibeam echosounder (MBES) backscatter data [19,20,21,22,23,24]. There are no internationally standardized routines for large-scale data acquisition, processing and interpretation either, albeit recommendations have been developed for the acquisition and processing of MBES derived backscatter data [25]. In times of highly sophisticated computer technology it is still common that experts manually interpret stone signatures on hydroacoustic backscatter data which is, however, very time-consuming and not practical for large and heterogeneous areas. Recently, research has focused on the automated identification of stone signatures in SSS backscatter data by means of machine learning techniques for selected study sites [21,26]. The future perspective is to improve publicly available training data sets to make the models more accurate and applicable for a variation of geological sites and large scale mapping campaigns.
The aim of this paper is to review existing delineation guidelines and definitions relevant for the hard substrate mapping in Germany (Section 2), to summarize current knowledge about hard substrate occurrence and characteristics in the German North Sea and Baltic Sea (Section 3), presenting the development of hard substrate mapping (Section 4) and the present standard mapping techniques (Section 5) as well as data processing techniques (Section 6) to identify the needs for area-wide hard substrate mapping campaigns. The focus is on progresses in Germany because the occurrence of hard substrates in German parts of the Baltic Sea is very diverse and may be used as reference for other study areas.

2. Definitions and Delineation Criteria of Hard Substrates

The European directives, regional sea conventions and habitat classification systems classify hard substrate habitats as ‘reef’ (HD, Annex 1 code 1170), ‘rock and biogenic reefs’ (MSFD), ‘rock and other hard substrata’ (European nature Information System (EUNIS), ‘rock and boulders’ (HELCOM Underwater Biotope and Habitat classification system—HELCOM HUB). The previous classification version HELCOM listed ‘stony bottoms’ for different depth zones [27]. All classifications have in common that the hard substrate habitats are named without any further description concerning substrate characteristics, spatial dimension or habitat delineation. Consequently, member states developed their own delineation criteria which sometimes even differ on district level and which are generally not published on international level. The EU characterizes the geogenic part of the Annex 1 habitat ‘reef’ (code 1170) in the Interpretation Manual of European Union Habitats as “… hard compact substrata on solid and soft bottoms, which arise from the sea floor in the sublittoral and littoral zone” [17]. ‘Hard compact substrata’ is explained as “rocks (including soft rock, e.g., chalk), boulders and cobbles (generally >64 mm in diameter)” [17]. As long as the associated biota of Annex II is present, these hard substrates may (temporally) be covered by a thin and mobile veneer of sediment [17].
Further, the UK has elaborated the term ‘stony reefs’ from a conservation and management point of view [4]. The seabed has to be covered by at least 10% with hard substrate of particles larger than 64 mm (i.e., cobbles, boulders) which arise from the seafloor. The minimum extent should be 25 m2 and the substrate needs to be colonized by benthic communities [4]. It is also recommended to perform geophysical surveys before ecological investigations. Advices for drawing boundaries are, however, not defined.
Maps showing reefs (code 1170, Figure 1), normally result from thematic maps (e.g., from fisheries), analysis of scientific data (mostly regional) and literature reviews. The information is presented in the 10 km European reference grid of the European Environment Agency (EEA), which is strongly generalized and tends to overestimate the areal distribution (Table 1). Furthermore, no distinction is made between geogenic and biogenic reefs.
In Germany, there are at present only generalized habitat maps with reefs (code 1170) publicly available, which, however, do not show the distribution of stones (e.g., [30,31]). The maps in the EEZ are generally based on local hydroacoustic surveys (SSS and MBES) which were done in areas where hard bottom substrates are likely to be present (e.g., moraine ridges). These data were used to manually delineate potential reefs without any delineation specifications [32]. From these potential reefs, code 1170-reefs were selected applying the criteria proposed in Annex III of the habitats directive [29]. The final identified area is up to 18 times smaller than the area described by the EEA (Table 1). In the territorial waters the mapping strategy and progress varies depending on the federal state. Specific delineation criteria are rare or not public. A common, national approach is under development.
For local offshore licensing procedures the BfN has published a manual for reef mapping in the German waters which specifies appropriate sampling techniques, substrate size and biological assessment criteria [33]. The substrate identification is based on SSS backscatter data (frequency ≥300 kHz). As substrate density and distribution differ in the North Sea and Baltic Sea, criteria for detection and delineation strategies vary for the two regions (Table 2) due to their geological background (compare Section 3). All these criteria are based on expert knowledge but lack the scientific evaluation. To fulfill these delineation criteria, individual objects have to be identified, measured and marked. The delineation criteria are dependent on the substrate:
(1)
Boulder field: This type typically occurs in areas characterized by a heterogeneous sediment distribution. Each hard substrate object of a certain size needs to be identified and surrounded by a bounding boundary of a certain diameter. The values differ for North Sea and Baltic Sea. For details see Table 2. The bounding boundaries of at least 21 objects are needed to be connected within a certain radius to form a reef. A biological verification is not required.
(2)
Marine erratic boulders: Each erratic boulder (≥2 m in diameter) is defined as reef disregarding their areal distribution density. A biological verification is not necessary.
(3)
Lag deposits with erratic cobbles and boulders: Lag deposits typically contain a wide range of hard substrate sizes mixed with sand and gravel. Single object detection is not required. The entire area is classified as reef when characteristic reef species assemblages are present.
According to the abovementioned guideline [33] a biological verification is only necessary for type three (lag deposits). The authors assume that hard substrates ≥30 cm in diameter are almost always settled by epibenthic fauna and flora. The absence of epibenthic assemblages in exceptional cases is explained by anthropogenic impacts (e.g., bottom trawling) or sediment mobility. A recent study by Michaelis et al. [34] confirmed that at least 88% of boulders exceeding diameters of 20 cm in the German North Sea are settled. The colonized proportion of smaller hard substrates shows a strongly regional dependency. Furthermore, object size influences the sessile taxa richness [35], which is not further considered in any guidelines.

3. Hard Substrate Origin

Grab sampling and hydroacoustic mapping campaigns have shown that the geogenic hard substrates in the German waters are present as loose scattered cobbles (64–256 mm) and boulders (>256 mm) with maximum sizes up to several meters [20,22,23,34,36,37] including a high amount of flint stones [38]. They originate from Scandinavia and were transported by several Pleistocene glacial advances to the North Sea [38,39,40] and Baltic Sea [41,42], and deposited in end and ground moraines. An exception is the ‘Helgoländer Festlandsockel’ in the North Sea with outcrops of Paleozoic and Mesozoic bedrock [43].
The Weichselian ice shield reached the mainland of the Baltic region [44]. The line of maximum extension was located in eastern Schleswig Holstein [44,45] between Baltic Sea and North Sea. In contrast, the most recent ice coverage of the North Sea area took place during the Saalian glaciation [46,47]. This explains the general distribution pattern of hard substrates in the North Sea and Baltic Sea. Most stones in the North Sea are found offshore in the EEZ (Sylter Outer Reef and Borkum Reef Ground) in water depth of 20–45 m [22,34] whereas in the Baltic Sea hard substrates are located along the coast in 5–15 m water depth and on submarine sills (Fehmarn Belt, Kadet Trench, Adler Grund, Rönne Bank) [20]. The distribution of hard substrates in the North Sea is less dense and stones of boulder size are generally spaced a few meters to several decameters apart while in the Baltic Sea the distance of individual boulders varies between a few decimeters and several meters [20].
The moraines were initially reworked by wind and later with increasing sea level by waves and tidal currents, resulting in lag deposits with exposed cobbles and boulders. Abrasion is still going on in the Baltic Sea with rates of 1 to 5 cm/yr [19,48,49] and submerged hard substrates are getting continuously exposed [50]. Fine material is removed by waves and deposited in the surrounding. In the present basins of the Baltic Sea lag deposits are normally completely covered by limnic sediments mainly deposited during the Baltic Ice Lake (approx. 12.600–10.300 BP) and organic-rich mud deposited ever since approx. 8.000 BP [51,52,53]. In the North Sea the Saalian lag deposits are partly covered by Holocene marine sands (maximum thickness approx. 10 m) whereas the thickness of the cover is decreasing with increasing distance to the coast [38,54] and is partly absent in the offshore area [22].
Both in Baltic Sea and North Sea exposed stones are generally settled by sessile organisms [8,34,36,55]. For the North Sea Michaelis et al. [34] have shown that the proportion of colonized hard substrate is increasing with object size. The sessile communities show regional differences [35,37,56].

4. History of Geogenic Hard Substrate Investigation Activities

Earliest information about geogenic hard substrate distributions can be derived from fishermen who noted the positions of broken and entangled nets in their maps. This knowledge combined with initial systematic investigation of the seafloor characteristics was first published for the European Oceans in 1871 by the French cartographer Delesse [57]. The map comprises the main sediment types mud, sand, gravel and ‘stone’. About the same time more detailed sediment investigations started for the North Sea (e.g., [38,58] and references therein). The focus was set on soft sediments (gravel and finer) which could be investigated with contemporary state of the art instruments like diverse types of grab samplers. Jarke [58] explicitly emphasized that appropriate tools for hard substrate investigations were missing, thus information on their occurrence still originated mostly from fishermen’s experience or observations of damaged grab samplers. He further highlighted the future importance of clearly demarcated stony areas for fishing and science and suggested the use of dredges and single beam echo sounders, which were used commonly for the search of wrecks. Generally, the sample distribution at that time was poor and the accuracy in positioning was not better than ±2–3 nautical miles, resulting in the use of small map scales (e.g., 1:1,000,000). A more systematically investigated map for the North Sea (1:250,000), with grab sample information at least each nautical mile, was published by Figge [59] and updated by Laurer et al. [60]. These maps comprise also a layer of ‘gravel and stones’ distribution.
In the EEZ of the German Baltic Sea systematic sediment grab mapping started in the 1930’s [61]. Stones are named in context of lag deposits. More detailed maps on a scale 1:100,000 with an additional stone layer (based on grab sampling) was published by Tauber and others [62,63,64,65,66,67,68,69,70,71,72]. For local areas detailed studies on geogenic hard substrate distributions by means of diving, underwater video inspection or SSS were done [19,20,73,74]. They were conducted to investigate the effects of commercial stone extraction in the coastal zone and the regeneration potential of depleted areas. Between approximately 1850 and 1974 about 3.5 million tons (equivalent to approx. 5.6 km2) of stones (here: 60–150 cm in diameter) were removed from water depth of up to 20 meter for construction purposes on land [19,75]. The intensive extraction has led to an almost complete absence of geogenic hard substrates and the threatened situation of blue mussels (Mytilus sp.) and brown algae (Fucus spp.) in large areas [76,77]. By comparing the number of stones on analogue sidescan sonar records from the 1980s with digital ones from 2007 it was shown that on a decadal time scale a natural regeneration of hard substrates by abrasion processes exists along the Baltic coast [19].
Since 2012 the project SedAWZ coordinated by the Federal Maritime and Hydrographic Agency (BSH) maps the area wide sediment distribution, including hard substrates, in the German EEZ with sidescan sonar on a scale of 1:10,000. A mapping guideline was developed to standardize acquisition, processing and interpretation procedures of SSS data [78]. The sediments are classified on three levels of detail. Hard substrates are represented in the class ‘lag sediments’ and large boulders are indicated using an extra layer. No delineation criteria are given. The sediment maps (until now without the large boulder layer) are published and regularly updated in the GeoSeaPortal of the BSH (geoseaportal.de, last accessed on 08.01.2020).

5. Hydroacoustic Mapping Techniques

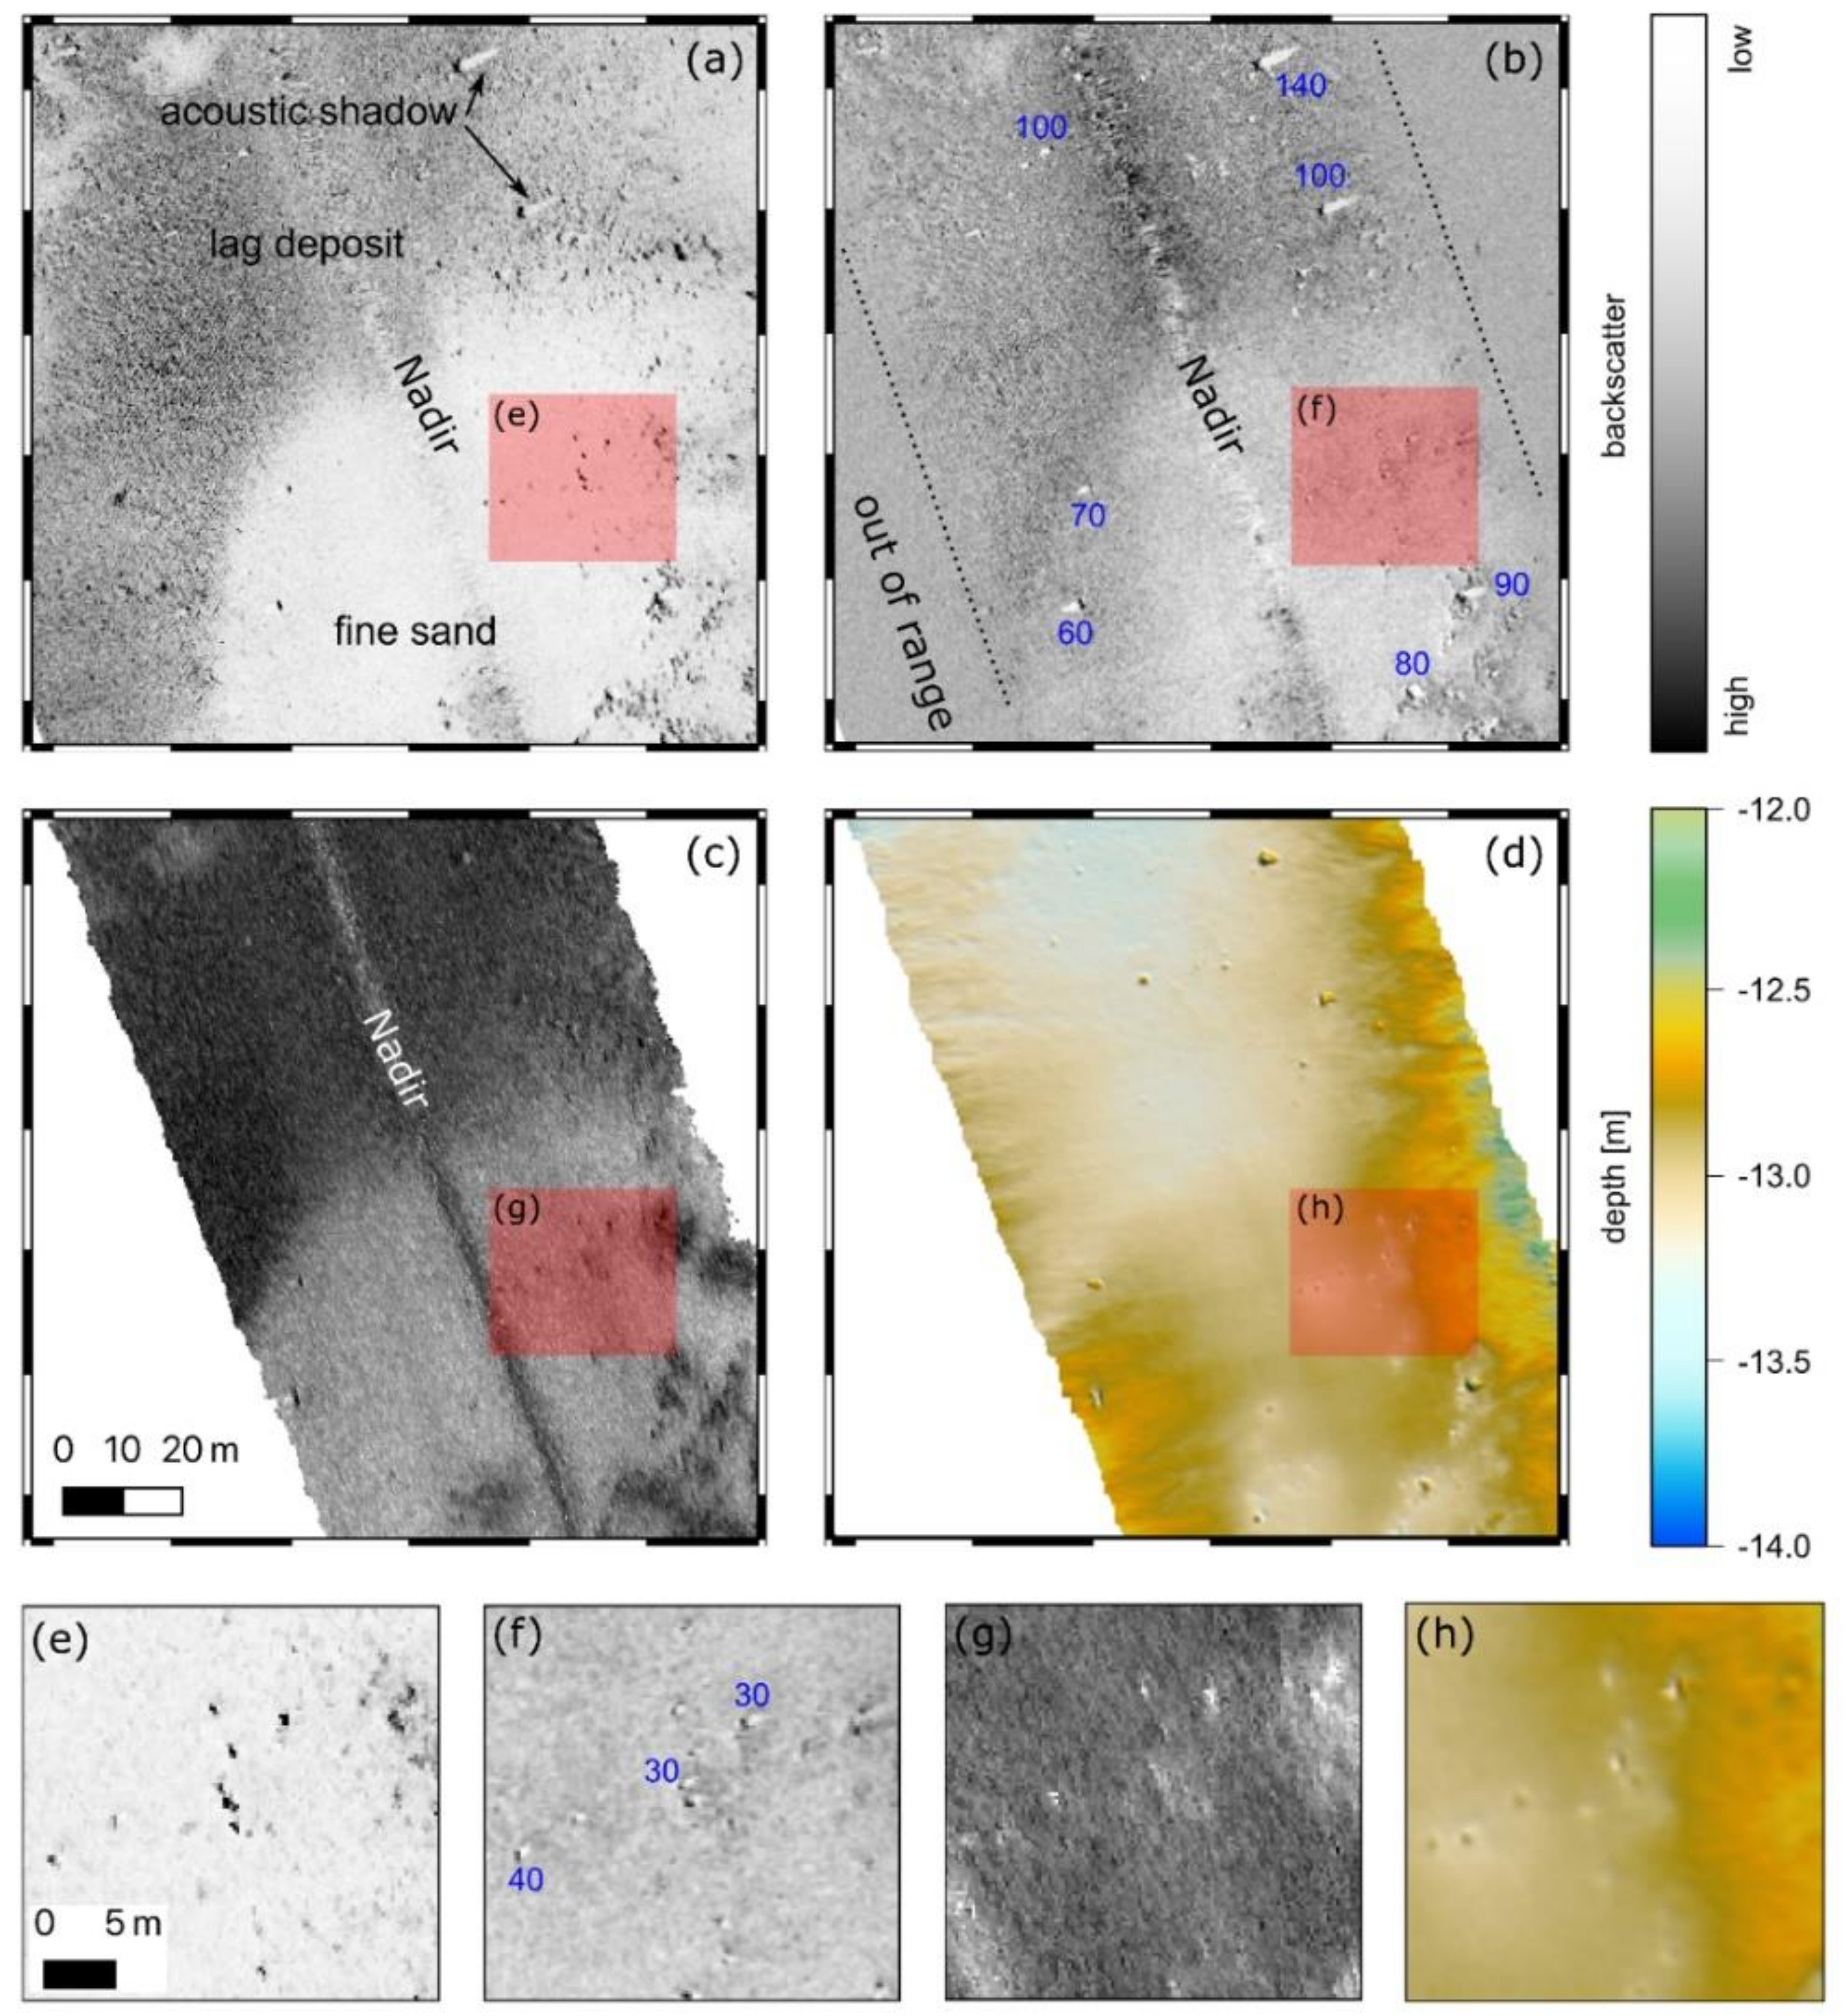
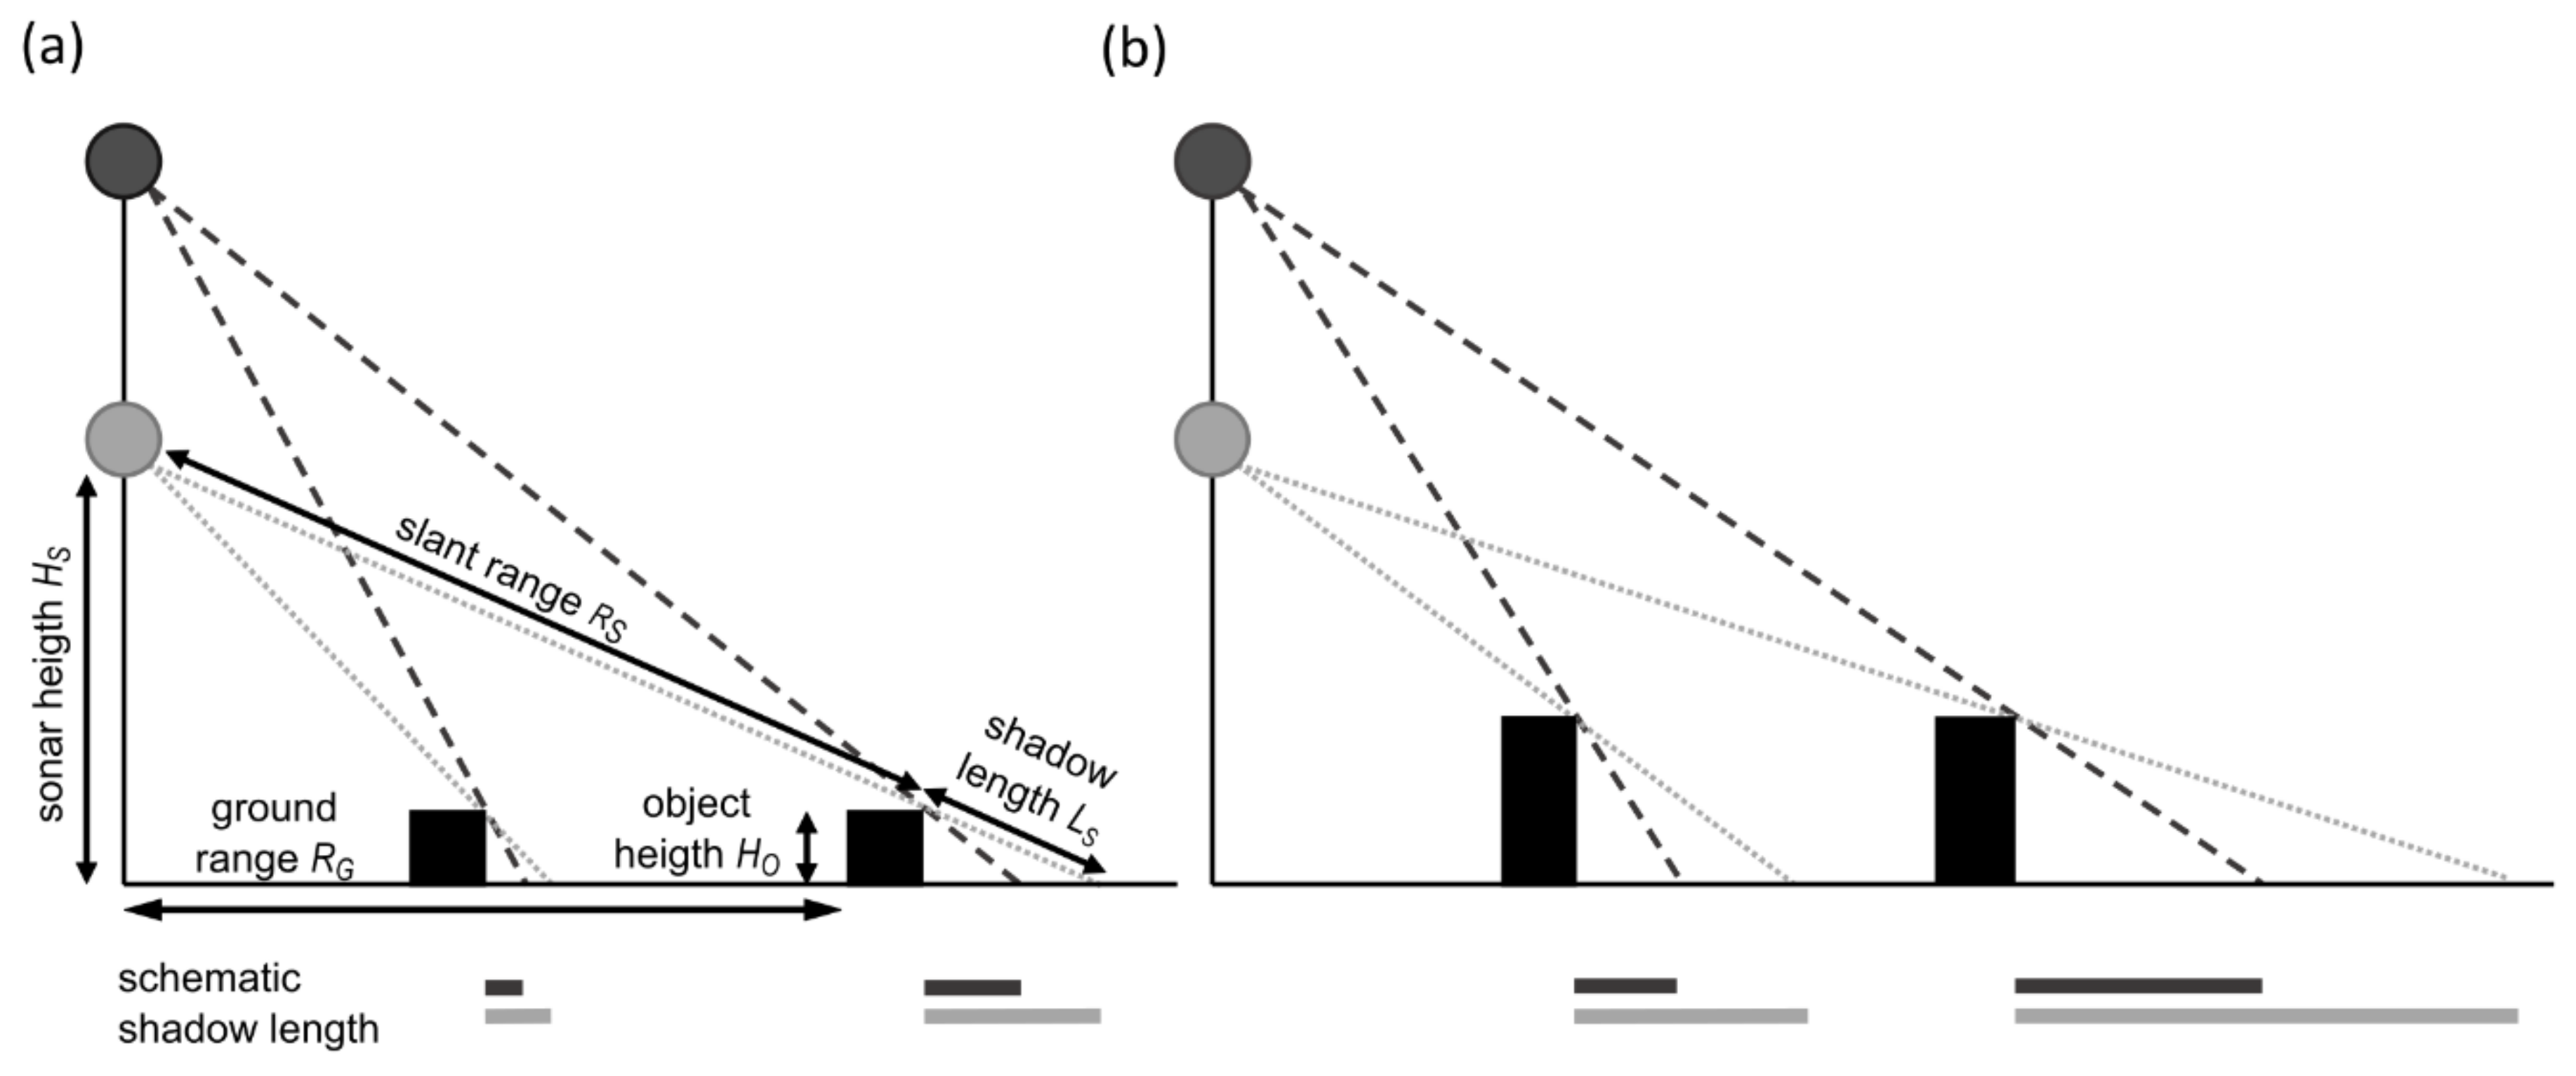
Typical products of hydroacoustic surveys with SSS or MBES are maps of backscatter intensity and bathymetry (MBES and interferometric SSS only). Backscatter intensity imagery, reflecting the strength of acoustic echo return, provide information on physical seafloor parameters and images obstacles lying on top of the seafloor like pipelines, wrecks, debris or stones [79]. Objects elevated from the seafloor will intercept the emitted acoustic signal and prevent backscattering from the bottom at the backside of the object, producing an acoustic shadow corresponding to the object’s shape, while backscatter is increased at the ensonified front of the object (Figure 2) [79]. The shadow length (LS) depends on the object height and the geometry between the object and the sound source [80]. With means of the geometric relation the object height (H0) and the across track distance to the nadir (ground range, RG) can be calculated using Equations (1) and (2) [81]:
H O = L S x H S L S + R S
R G = R S 2 H S 2
where H0: object height; LS: shadow length; HS: sonar height; RS: slant range.
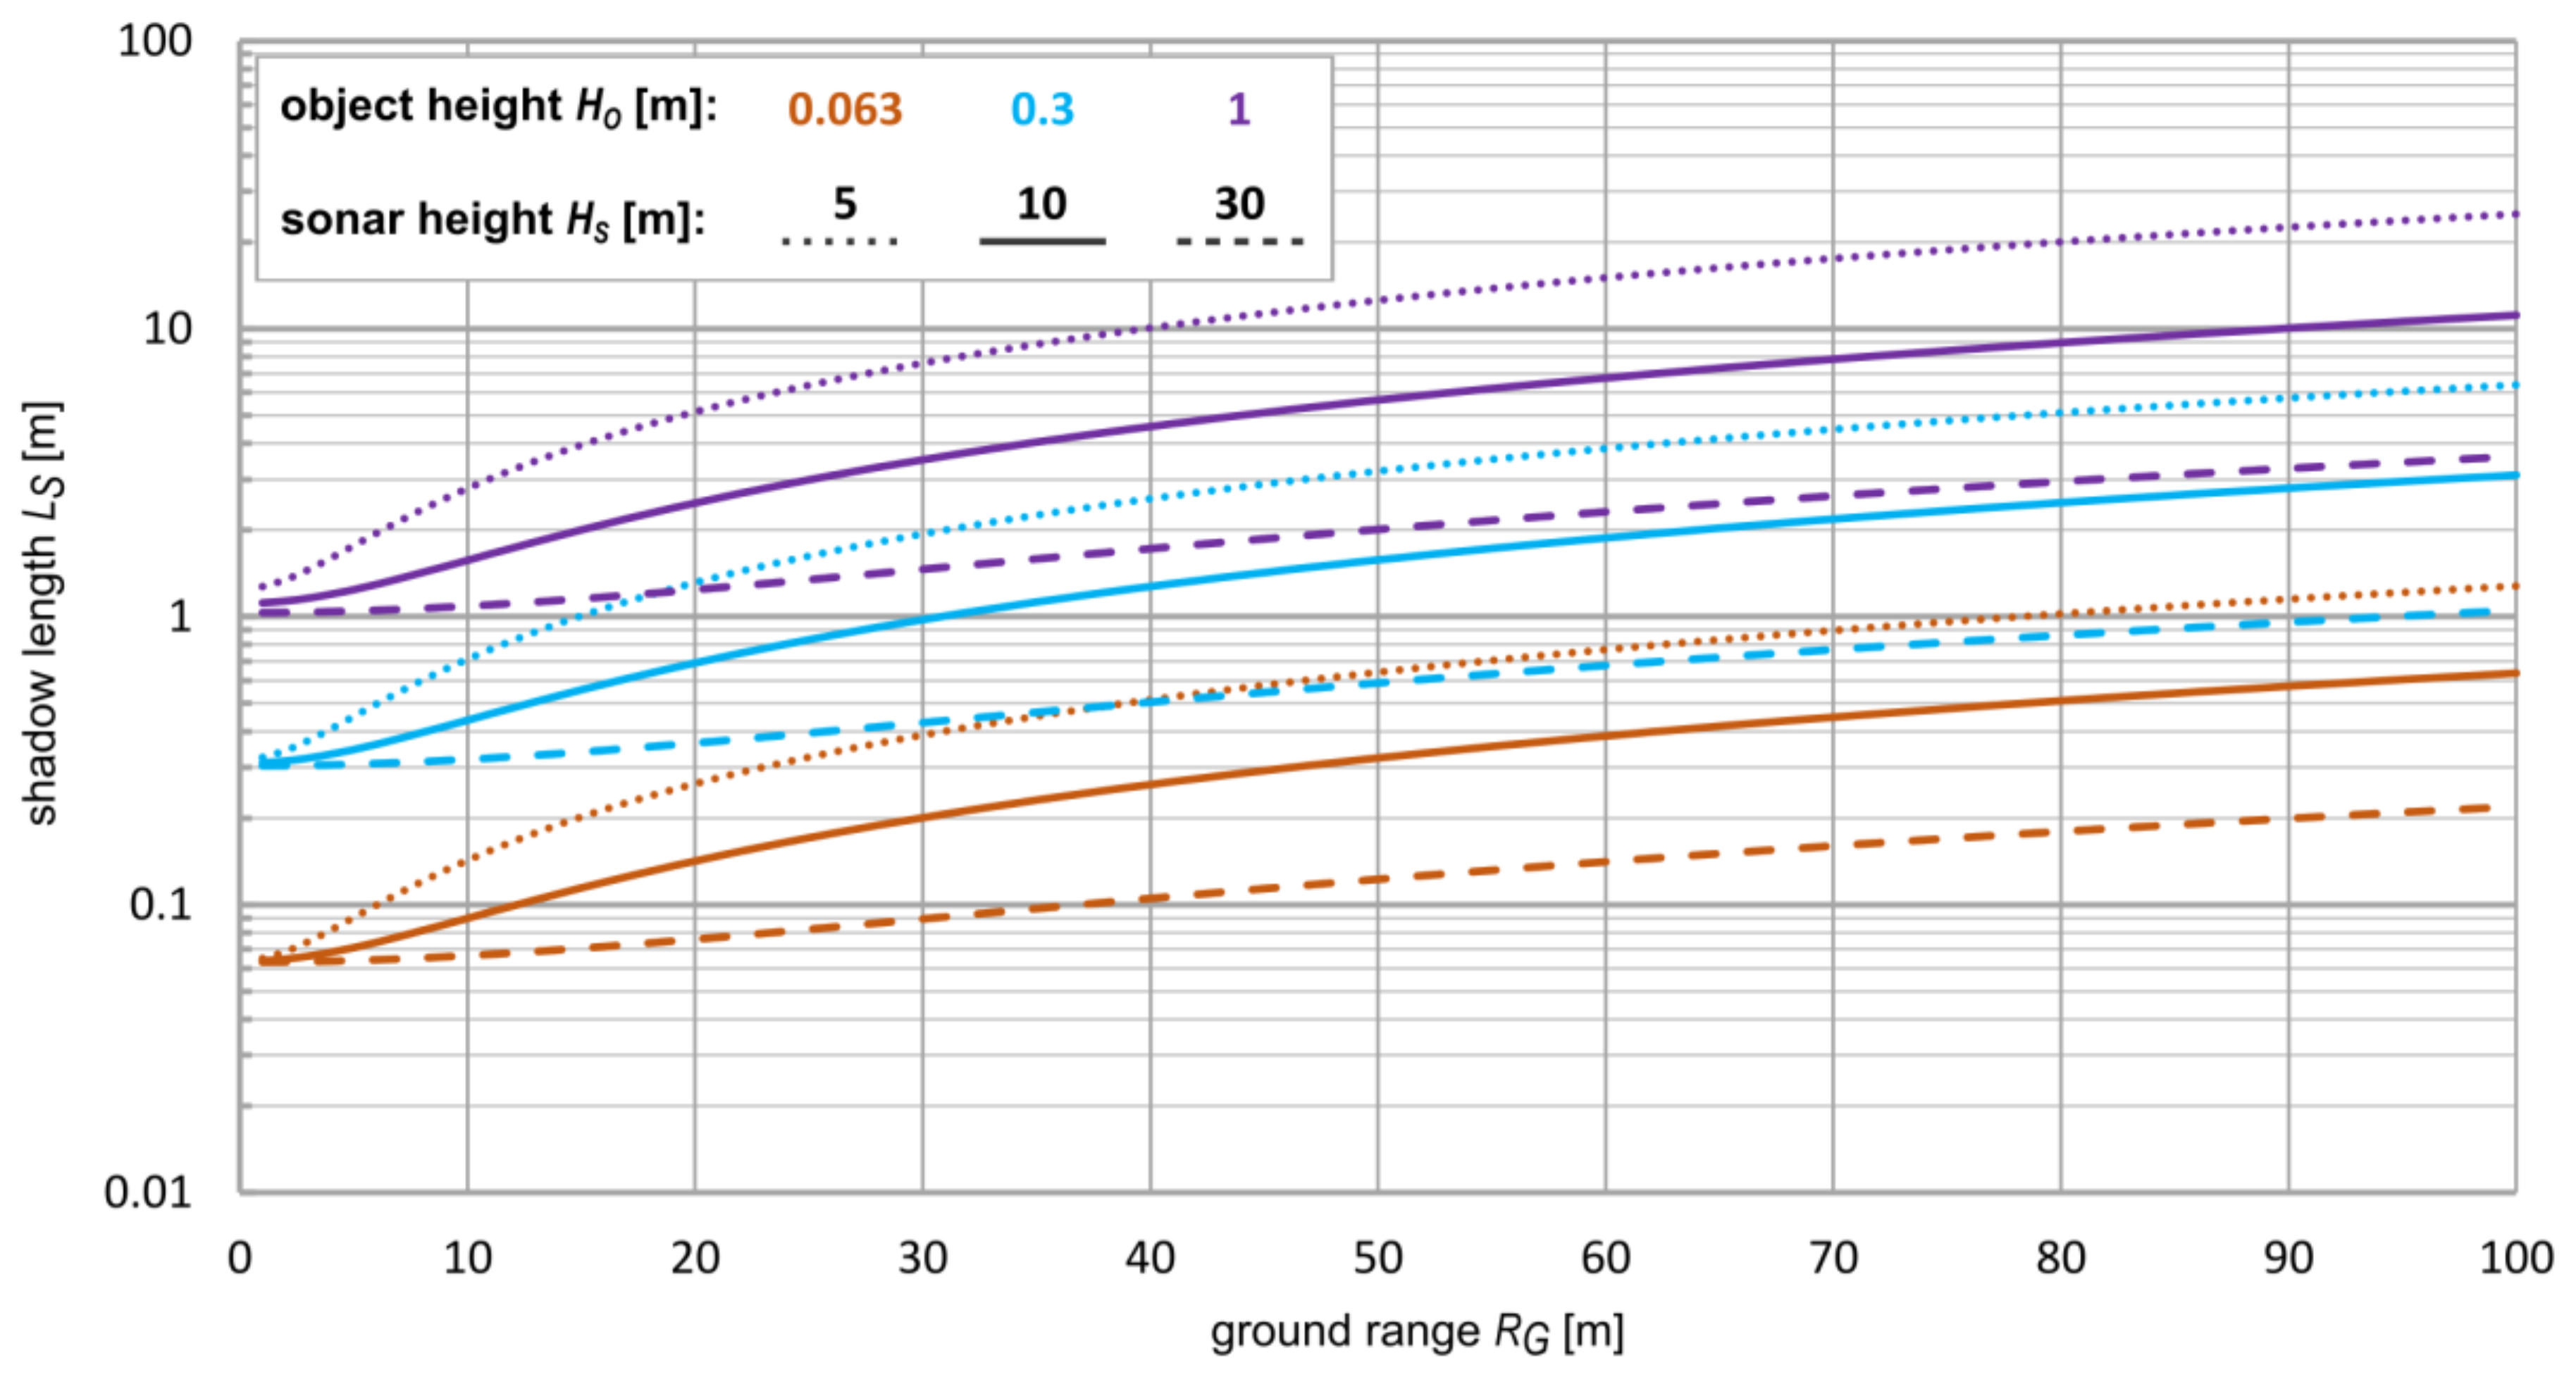
Figure 3 and Figure 4 display the shadow length in relation of the object height, sonar height and ground range. Objects close to the nadir cast shorter shadows compared to objects of the same size located farther away (Figure 3 and Figure 4). Directly in the nadir region high quality backscatter data is difficult to record, as the return signal is located within the specular regime [82], requiring more than 100% overlap of acoustic data to provide high quality data in full coverage. In addition, objects close to the nadir normally produce shadow lengths below the sonar data resolution. The loss of this characteristic feature makes objects difficult to detect. Incidence is less grazing for hull-mounted MBES than for SSS towed closer to the seafloor [79], making shadows caused by stones more difficult to recognize. For SSS it is recommended to tow them at a height above the bottom that is maximum 10–15% of the range of the sonar.
Next to their position in the acoustic swath, the quantity of detected objects is increasing with higher data resolution. Von Rönn et al. [23] recognized an underestimation of boulders of up to 42% with lower image resolution. The resolution of backscatter imagery depends on the sonar frequency and pulse length (continuous wave systems) or bandwidth (frequency modulated systems, “Chirp technology”), the across and along track aperture, the range to the sonar and the speed of the ship. Generally, pulses of higher frequency have a higher spatial resolution for a given transducer array length but have a smaller swath due to quick absorption and vice versa. Resolution versus mapped seafloor area is reviewed for different acquisition systems by Kenny [83].
Beam spreading of SSS results in resolution variations across and along track (Figure 5). The acoustic wave is widening with increasing distance from the sonar but across-track footprint is decreasing. Close to the nadir the acoustic wave is smaller and detects objects of a certain along track distance as individual objects. Objects of the same along track distance but further apart from the sonar appear as one single object [80].
While MBES across-track resolution used to be lower than SSS resolution, the introduction of beam time series (“snippets”) considerably increased MBES across track resolution [85]. Advantages of MBES backscatter investigation is the additional depth information which can be used to detect stones directly in bathymetric data, while a corresponding disadvantage of MBES remains the depth-dependent size of the acoustic footprint which may not be constant across an investigation area. Increasingly common multi-frequency surveys [86,87,88,89,90], in which the sonar cycles through different frequencies, provide different resolutions for imagery derived from each frequency. While the use of multiple frequencies for habitat mapping is undoubted, the capacity of multi-frequency maps for object detection will be reduced due to increased ping intervals per frequency. Currently, the individual backscatter datasets cannot be easily merged into an image of higher resolution.
The influence of flora and fauna on backscatter characteristics of sediments is known from diverse studies [91,92,93,94,95]. While single beam systems are established for the discrimination of colonized and non-colonized hard substrates [36,96,97], the effect of benthic organisms on SSS and MBES backscatter characteristics of stones is still unknown. The biomass may absorb and scatter parts of the acoustic signal so that the typical high backscatter at the front of the object can become attenuated or even erased [80], and further studies are required on this topic.
In terms of object detection highly accurate positioning is necessary which is often lacking for towed sonars. Layback correction computed from the cable length (assumed straight) and trigonometric relations are too inaccurate, especially for long cables and when wind and tidal induced currents cause lateral and vertical misalignment. USBL (ultra-short baseline) systems can enhance the positioning underwater. The subsea position (range and bearing) is calculated from a transceived acoustic pulse between ship and towed sonar. A disadvantage is that update frequency is low (seconds interval) [98]. Problems with multipath issues can occur when water is to shallow or stratified due to strong temperature and salinity gradients.
Hull-mounted sonar systems do not have the problem of positioning but may not be able to detect small objects especially in deep areas and the data quality also suffers when sea state is wavy. However, platform movement can be compensated by multibeam echo sounders already during beam steering.
In case that backscatter resolution is too low to identify objects by means of their acoustic shadow, Papenmeier and Hass [22] recommend the combination of simultaneous recorded backscatter and single beam data. Parametric sediment echo sounder data for instance indicate hyperbolas at the sediment surface in stony areas. By merging this information with backscatter data it is possible to differentiate e.g., fine gravel substrates (also characterized by high backscatter) from stony substrates.

6. Automated Stone Detection

Current expert analysis techniques to estimate stone density do not scale to the large area of European Seas, thus requiring the use of automated methods in the future. This is especially the case for the identification and localisation of individual stones for the purpose of habitat delineation and ecosystem research. However, research on the automatic detection of stones is still ongoing. The majority of the applied automated classification algorithms are based on the identification of the strong backscatter signal and the associated acoustic shadow region. Deterministic approaches for automated target detection utilize classification algorithms designed by human experts to match features of the expected targets and have been primarily developed for the detection of anthropogenic objects such as mines or debris. In principle, these methods may be applicable to the detection of stones, although no corresponding studies exist to our knowledge. Recent examples include the use of independent component analysis to extract features of high resolution backscatter mosaics for the detection of smaller metallic objects [99] or shipwrecks [100]. Environmental conditions are included in the analysis by Williams and Fakiris [101]. A further example of a study potentially transferable to automatic stone detection is the use of shadow areas in SSS data based on a priori geometrical information of underwater mines using an unsupervised random Markov field model [102] or image thresholding and spatial domain filtering [103]. Recent studies dealing directly with the identification of stones in backscatter data have been made using deep learning and closely related techniques. While these studies require significantly less feature engineering, they depend on the collection of large training datasets with several thousand entries. Although this can be a critical constraint for anthropogenic targets such as mines or shipwrecks, such training datasets are comparatively easy to generate for stones due to their widespread occurrence. Sawas et al. [104] and Barngrover et al. [105] have trained Haar-Like features (equivalent to convolutional neural networks with pre-selected kernel values) to automatically detect objects, specifically mines, using real and synthetic SSS images to increase the sample size. Applying Haar-Like features to the identification of stones based on ~22,000 positive images and ~340,000 negative samples, Michaelis et al. [26] showed that training data in terms of different acoustic backscatter signals of the underlying seafloor have a strong influence on the detectability of stones in heterogeneous environments. Detection of mines using convolutional neural networks was attempted by Dzieciuch et al. [106]. An image classification framework based on a convolutional neural network for the identification of stones on SSS mosaics is presented by Feldens et al. [21]. The performance of the trained algorithm was as good as the results obtained from a manual classification, especially with regard to the general occurrence of stones. However, when it comes to smaller sized objects and distortions of the SSS data, the manual classification was more favorable. All methods have in common that their performance highly depends on the quality of the acoustic data, most importantly the resolution and the presence of distortions (e.g., [107]).

7. Conclusions and Future Needs

Geogenic hard substrates host a high number of benthic species on a small area and provide irreplaceable ecosystems services but the distribution is almost always misjudged. Although, hard substrate habitats are under protection by EU legislation (reef—code 1170) delineation criteria remain weak. The declaration of marine protected areas (Natura 2000) was realized by expert knowledge without detailed knowledge on single objects, especially with regard to their distribution pattern, size or benthic coverage. However, these parameters are essential for present questions and scopes like understanding ecosystem functioning, monitoring environmental status, marine spatial planning, ensuring safe navigation and many more. Especially, the influence of object size and distribution pattern on the ecosystem function is totally unknown, although such knowledge is needed to develop ecologically meaningful delineation criteria. This requires the detection of single objects which is commonly done by SSS or MBES backscatter imagery. The minimum size of detectable objects may be decreased by utilizing synthetic aperture sonars in the future. In case of monitoring issues or object localization for navigational risk management MBES data sets are recommended despite their smaller range because of a more accurate positioning and additional depth information when compared to data retrieved from SSS. Autonomous underwater vehicle (AUV) could support area wide data acquisition whereas the height above seafloor and thus the geometrical relation to the objects has to be considered. The identification of objects and the delineation of stony habitats/reefs on backscatter images is still time-consuming and subjective. The integration of automatized routines by e.g., machine learning is very promising but still rudimentary. The future perspective is to improve training datasets including both backscatter and bathymetric data as well as derived datasets (texture, bathymetric position index) to make the models applicable for a variation of geological sites and to optimize the algorithms for the detection of small objects. Finally, the application of neural networks on ground-truthed full waveform data collected by MBES may allow to differentiate stones with attached flora and fauna. Nevertheless, some kind of actually verified punctual data would be needed which can be provided by e.g., remote operating vehicles (ROV).

Author Contributions

Conceptualization, S.P.; Writing—Original Draft Preparation, S.P.; Writing—Review & Editing, A.D., P.F. and R.M.; Visualization, S.P. and P.F. All authors have read and agreed to the published version of the manuscript.

Funding

This research received no external funding.

Acknowledgments

We would like to thank all colleagues who have been involved in all the stimulating discussions about hard substrate mapping over the past years. This includes in particular the team of the project SedAWZ coordinated by the Federal Maritime and Hydrographic Agency, the colleagues of the German Federal Agency for Nature Conservation (Vilm) and the state authorities responsible for the coastal zone.

Conflicts of Interest

The authors declare no conflict of interest.

References

  1. Sheehan, E.V.; Bridger, D.; Attrill, M.J. The ecosystem service value of living versus dead biogenic reef. Estuar. Coast. Shelf Sci. 2015, 154, 248–254. [Google Scholar] [CrossRef]
  2. Taylor, R. Density, biomass and productivity of animals in four subtidal rocky reef habitats: The importance of small mobile invertebrates. Mar. Ecol. Prog. Ser. 1998, 172, 37–51. [Google Scholar] [CrossRef] [Green Version]
  3. Wahl, M. Marine Hard Bottom Communities: Patterns, Dynamics, Diversity, and Change, 1st ed.; Ecological studies; Springer: Dordrecht, The Netherlands; New York, NY, USA, 2009. [Google Scholar]
  4. Irving, R. The Identification of the Main Characteristics of Stony Reef Habitats under the Habitats Directive. Summary Report of an Inter-Agency Workshop 26–27 March 2008; JNCC Report No. 432; Joint Nature Conservation Committee: Peterborough, UK, 2009.
  5. Brzana, R.; Janas, U. Artificial hard substrate as a habitat for hard bottom benthic assemblages in the southern part of the Baltic Sea—A preliminary study. Oceanol. Hydrobiol. Stud. 2016, 45, 121–130. [Google Scholar] [CrossRef]
  6. Grzelak, K.; Kuklinski, P. Benthic assemblages associated with rocks in a brackish environment of the southern Baltic Sea. J. Mar. Biol. Assoc. U. K. 2010, 90, 115–124. [Google Scholar] [CrossRef]
  7. Post, A.L.; Lavoie, C.; Domack, E.W.; Leventer, A.; Fernandez, R. Dropstones on a glaciated continental shelf as key habitat, Sabrina Shelf, East Antarctica. In Seafloor Geomorphology as Benthic Habitat; Elsevier: Amsterdam, The Netherlands, 2020; pp. 641–653. [Google Scholar]
  8. Coolen, J.W.P.; Bos, O.G.; Glorius, S.; Lengkeek, W.; Cuperus, J.; van der Weide, B.; Agüera, A. Reefs, sand and reef-like sand: A comparison of the benthic biodiversity of habitats in the Dutch Borkum Reef Grounds. J. Sea Res. 2015, 103, 84–92. [Google Scholar] [CrossRef]
  9. Sheehan, E.V.; Cousens, S.L.; Nancollas, S.J.; Stauss, C.; Royle, J.; Attrill, M.J. Drawing lines at the sand: Evidence for functional vs. visual reef boundaries in temperate Marine Protected Areas. Mar. Pollut. Bull. 2013, 76, 194–202. [Google Scholar] [CrossRef] [Green Version]
  10. Beisiegel, K.; Tauber, F.; Gogina, M.; Zettler, M.L.; Darr, A. The potential exceptional role of a small Baltic boulder reef as a solitary habitat in a sea of mud. Aquat. Conserv. Mar. Freshw. Ecosyst. 2019, 29, 321–328. [Google Scholar] [CrossRef]
  11. Ruiz, G.M.; Freestone, A.L.; Fofonoff, P.W.; Simkanin, C. Habitat Distribution and Heterogeneity in Marine Invasion Dynamics: The Importance of Hard Substrate and Artificial Structure. In Marine Hard Bottom Communities: Patterns, Dynamics, Diversity, and Change; Wahl, M., Ed.; Ecological Studies; Springer: Berlin/Heidelberg, Germany, 2009; pp. 321–332. [Google Scholar]
  12. Airoldi, L. The effects of sedimentation on rocky coast assemblages. In Oceanography and Marine Biology, An Annual Review, Volume 41; Gibson, R.N., Atkinson, R.J.A., Eds.; CRC Press: Boca Raton, FL, USA, 2003; pp. 161–263. [Google Scholar]
  13. Von Nordheim, H.; Boedeker, D.; Krause, J.C. Progress in Marine Conservation in Europe: Natura 2000 Sites in German Offshore Waters, 1st ed.; Springer: Berlin, Germany; New York, NY, USA, 2006. [Google Scholar]
  14. Elliott, M. Marine science and management means tackling exogenic unmanaged pressures and endogenic managed pressures—A numbered guide. Mar. Pollut. Bull. 2011, 62, 651–655. [Google Scholar] [CrossRef]
  15. UN General Assembly. Transforming Our World: The 2030 Agenda for Sustainable Development. 2015. Available online: https://sustainabledevelopment.un.org/post2015/transformingourworld/publication (accessed on 08 March 2020).
  16. European Commission. Council Directive 92/43/EEC of 21 May 1992 on the Conservation of Natural Habitats and of Wild Fauna and Flora 1992. Available online: https://eur-lex.europa.eu/legal-content/EN/TXT/?uri=CELEX%3A31992L0043 (accessed on 08 March 2020).
  17. Interpretation Manual of European Union Habitats—EU 28; European Commission DG-ENV: Brussels, Belgium, 2013; Available online: https://eunis.eea.europa.eu/references/2435 (accessed on 08 March 2020).
  18. Directive 2008/56/EC of the European Parliament and of the Council of 17 June 2008 Establishing a Framework for Community action in the Field of Marine Environmental Policy (Marine Strategy Framework Directive). Available online: https://eur-lex.europa.eu/legal-content/EN/TXT/?uri=CELEX%3A02008L0056-20170607 (accessed on 08 March 2020).
  19. Bohling, B.; May, H.; Mosch, T.; Schwarzer, K. Regeneration of submarine hard-bottom substrate by natural abrasion in the western Baltic Sea. Marbg. Geogr. Schriften 2009, 145, 66–79. [Google Scholar]
  20. Diesing, M.; Schwarzer, K. Identifications of submarine hard-bottom substrates in the German North Sea and Baltic EEZ with high-resolution acoustic seafloor imaging. In Progress in marine conservation in Europe: Natura 2000 sites in German Offshore Waters, 1st ed.; von Nordheim, H., Boedeker, D., Krause, J.C., Eds.; Springer: Berlin, Germany; New York, NY, USA, 2006; pp. 111–125. [Google Scholar]
  21. Feldens, P.; Darr, A.; Feldens, A.; Tauber, F. Detection of Boulders in Side Scan Sonar Mosaics by a Neural Network. Geosciences 2019, 9, 159. [Google Scholar] [CrossRef] [Green Version]
  22. Papenmeier, S.; Hass, H. Detection of Stones in Marine Habitats Combining Simultaneous Hydroacoustic Surveys. Geosciences 2018, 8, 279. [Google Scholar] [CrossRef] [Green Version]
  23. Von Rönn, G.A.; Schwarzer, K.; Reimers, H.-C.; Winter, C. Winter Limitations of Boulder Detection in Shallow Water Habitats Using High-Resolution Sidescan Sonar Images. Geosciences 2019, 9, 390. [Google Scholar] [CrossRef] [Green Version]
  24. Brown, C.J.; Smith, S.J.; Lawton, P.; Anderson, J.T. Benthic habitat mapping: A review of progress towards improved understanding of the spatial ecology of the seafloor using acoustic techniques. Estuar. Coast. Shelf Sci. 2011, 92, 502–520. [Google Scholar] [CrossRef]
  25. Lamarche, G.; Lurton, X. Recommendations for improved and coherent acquisition and processing of backscatter data from seafloor-mapping sonars. Mar. Geophys. Res. 2018, 39, 5–22. [Google Scholar] [CrossRef] [Green Version]
  26. Michaelis, R.; Hass, H.C.; Papenmeier, S.; Wiltshire, K.H. Automated Stone Detection on Side-Scan Sonar Mosaics Using Haar-Like Features. Geosciences 2019, 9, 216. [Google Scholar] [CrossRef] [Green Version]
  27. HELCOM HUB—Technical Report on the HELCOM Underwater Biotope and habitat classification; Helsinki Commission: Helsinki, Finnland, 2013; Available online: https://helcom.fi/helcom-at-work/publications/helcom-bsep-series/ (accessed on 08 March 2020).
  28. European Environment Agency. Distribution of species and habitat types. Available online: https://www.eea.europa.eu/data-and-maps/data/article-17-database-habitats-directive-92-43-eec-1#tab-data-visualisations (accessed on 08 January 2020).
  29. Boedeker, D.; Krause, J.C.; von Nordheim, H. Interpretation, identification and ecological assessment of the NATURA 2000 habitats “sandbank” and “reef”. In Progress in marine conservation in Europe: Natura 2000 sites in German Offshore Waters, 1st ed.; von Nordheim, H., Boedeker, D., Krause, J.C., Eds.; Springer: Berlin, Germany; New York, NY, USA, 2006; pp. 47–64. [Google Scholar]
  30. Boedeker, D.; Herrmann, U.; Hübner, P.; Kias, M.; Merck, T.; Rachor, E.; von Nordheim, H. Ökologisch Besonders Wertvolle Marine Gebiete im Deutschen Nordseebereich. BfN-Map: 2. Überarbeitete Auflage; Federal Nature Conservation Agency (BfN): Vilm, Germany, 2001.
  31. Boedeker, D.; Herrmann, U.; Hübner, P.; Kias, M.; Meißner, J.; von Nordheim, H. Ökologisch Besonders Wertvolle Marine Gebiete im Deutschen Ostseebereich. BfN-Map: 2. Überarbeitete Auflage; Federal Nature Conservation Agency (BfN): Vilm, Germany, 2001.
  32. Schwarzer, K.; Diesing, M. Erforschung der FFH-Lebensraumtypen Sandbank und Riff in der AWZ der deutschen Nord- und Ostsee; Christian-Albrechts-Universität: Kiel, Germany, 2006. [Google Scholar]
  33. Boedeker, D.; Heinicke, K. BfN-Kartieranleitung für “Riffe“ in der deutschen ausschließlichen Wirtschaftszone (AWZ); Federal Nature Conservation Agency (BfN): Vilm, Germany, 2018.
  34. Michaelis, R.; Hass, H.C.; Mielck, F.; Papenmeier, S.; Sander, L.; Ebbe, B.; Gutow, L.; Wiltshire, K.H. Hard-substrate habitats in the German Bight (South-Eastern North Sea) observed using drift videos. J. Sea Res. 2019, 144, 78–84. [Google Scholar] [CrossRef]
  35. Michaelis, R.; Hass, H.C.; Mielck, F.; Papenmeier, S.; Sander, L.; Gutow, L.; Wiltshire, K.H. Epibenthic assemblages of hard-substrate habitats in the German Bight (south-eastern North Sea) described using drift videos. Cont. Shelf Res. 2019, 175, 30–41. [Google Scholar] [CrossRef]
  36. Bartholomä, A.; Capperucci, R.M.; Becker, L.; Coers, S.I.I.; Battershill, C.N. Hydrodynamics and hydroacoustic mapping of a benthic seafloor in a coarse grain habitat of the German Bight. Geo-Mar. Lett. 2019. [Google Scholar] [CrossRef]
  37. Beisiegel, K.; Darr, A.; Zettler, M.L.; Friedland, R.; Gräwe, U.; Gogina, M. Understanding the spatial distribution of subtidal reef assemblages in the southern Baltic Sea using towed camera platform imagery. Estuar. Coast. Shelf Sci. 2018, 207, 82–92. [Google Scholar] [CrossRef]
  38. Pratje, O. Die Deutung der Steingründe in der Nordsee als Endmoräne. Dtsch. Hydrogr. Z. 1951, 4, 106–114. [Google Scholar] [CrossRef]
  39. Figge, K. Das Elbe-Urstromtal im Bereich der Deutschen Bucht (Nordsee). Eiszeitalt. Ggw. 1980, 30, 203–211. [Google Scholar]
  40. Sindowski, K.-H. Das Quartär im Untergrund der Deutschen Bucht (Nordsee). Eiszeitalt. Ggw. 1970, 21, 33–46. [Google Scholar]
  41. Bressau, S. Abrasion, Transport und Sedimentation in der Beltsee. Küste 1957, 6, 64–102. [Google Scholar]
  42. Kolp, O. Die Sedimente der westlichen und südlichen Ostsee und ihre Darstellung. Beitr. Zur Meereskd. 1966, 17–18, 9–60. [Google Scholar]
  43. Spaeth, C. Zur Geologie der Insel Helgoland. Küste 1990, 49, 1–32. [Google Scholar]
  44. Ehlers, J.; Gibbard, P.L.; Hughes, P.D. Quaternary Glaciations—Extent and Chronology: A Closer Look; Developments in Quaternary science; Elsevier: Amsterdam, The Netherlands; Boston, MA, USA, 2011. [Google Scholar]
  45. Gripp, K.; Dittmer, E. Die Entstehung Nord-Frieslands. Naturwissenschaften 1941, 29, 577–581. [Google Scholar] [CrossRef]
  46. Ehlers, J.; Wingfield, R. The extension of the Late Weichselian/Late Devensian ice sheets in the North Sea Basin. J. Quat. Sci. 1991, 6, 313–326. [Google Scholar] [CrossRef]
  47. Stocks, T. Der Steingrund bei Helgoland. Dtsch. Hydrogr. Z. 1955, 8, 112–118. [Google Scholar] [CrossRef]
  48. Schrottke, K. Rückgangsdynamik schleswig-holsteinischer Steilküsten unter besonderer Betrachtung submariner Abrasion und Restsedimentmobilität; Berichte - Reports Institut für Geowissenschaften Kiel: Kiel, Germany, 2001; p. 168. [Google Scholar]
  49. Wefer, G.; Flemming, B. Tauchgruppe Kiel Sumbarine Abrasion des Geschiebemergels vor Bokniseck (Westl. Ostsee). Meyniana 1976, 28, 87–94. [Google Scholar]
  50. Schwarzer, K.; Bohling, B. Regeneration subaquatischer Steinfelder in der westlichen Ostsee; Christian-Albrechts-Universität: Kiel, Germany, 2008. [Google Scholar]
  51. Andrén, T.; Björck, S.; Andrén, E.; Conley, D.; Zillén, L.; Anjar, J. The Development of the Baltic Sea Basin During the Last 130 ka. In The Baltic Sea Basin; Springer: Berlin/Heidelberg, Germany, 2011; pp. 75–97. [Google Scholar]
  52. Björck, S. A review of the history of the Baltic Sea, 13.0–8.0 ka BP. Quat. Int. 1995, 27, 19–40. [Google Scholar] [CrossRef]
  53. Heinrich, C.; Anders, S.; Schwarzer, K. Late Pleistocene and early Holocene drainage events in the eastern Fehmarn Belt and Mecklenburg Bight, SW Baltic Sea. Boreas 2018, 47, 754–767. [Google Scholar] [CrossRef] [Green Version]
  54. Zeiler, M.; Schulz-Ohlberg, J.; Figge, K. Mobile sand deposits and shoreface sediment dynamics in the inner German Bight (North Sea). Mar. Geol. 2000, 170, 363–380. [Google Scholar] [CrossRef]
  55. Beisiegel, K.; Darr, A.; Gogina, M.; Zettler, M.L. Benefits and shortcomings of non-destructive benthic imagery for monitoring hard-bottom habitats. Mar. Pollut. Bull. 2017, 121, 5–15. [Google Scholar] [CrossRef] [PubMed]
  56. Becker, L.R.; Bartholomä, A.; Singer, A.; Bischof, K.; Coers, S.; Kröncke, I. Small-scale distribution modeling of benthic species in a protected natural hard ground area in the German North Sea (Helgoländer Steingrund). Geo-Mar. Lett. 2019. [Google Scholar] [CrossRef]
  57. Delesse, A. Lithologie des mers de France et des mers principales du globe; Lithologie du fond des mers; Librairie Scientifique, Industrielle et Agricole Eugène Lacrois: Paris, France, 1871. [Google Scholar]
  58. Jarke, J. Eine neue Bodenkarte der südlichen Nordsee. Dtsch. Hydrogr. Z. 1956, 9, 1–9. [Google Scholar] [CrossRef]
  59. Figge, K. Sedimentverteilung in der Deutschen Bucht (Blatt-Nr. 2900, Maßstab 1:250 000); Deutsches Hydrographisches Institut: Hamburg, Germany, 1981. [Google Scholar]
  60. Laurer, W.-U.; Naumann, M.; Zeiler, M. Erstellung der Karte zur Sedimentverteilung auf dem Meeresboden in der deutschen Nordsee nach der Klassifikation von FIGGE (1981). Geopotenzial Dtsch. Nordsee, Modul. B Dok. 2014, 1, 1–19. [Google Scholar]
  61. Pratje, O. Die Bodenbedeckung der südlichen und mittleren Ostsee und ihre Bedeutung für die Ausdeutung fossiler Sedimente. Dtsch. Hydrogr. Z. 1948, 1, 45–61. [Google Scholar] [CrossRef]
  62. Tauber, F. Meeresbodensedimente in der deutschen Ostsee: Adlergrund, Karte Nr. 2938. Maßstab 1:100000; Bundesamt für Seeschifffahrt und Hydrographie: Hamburg, Germany, 2012. [Google Scholar]
  63. Tauber, F. Meeresbodensedimente in der deutschen Ostsee: Arkona, Karte Nr. 2936. Maßstab 1:100000; Bundesamt für Seeschifffahrt und Hydrographie: Hamburg, Germany, 2012. [Google Scholar]
  64. Tauber, F. Meeresbodensedimente in der deutschen Ostsee: Darß – Hiddensee, Karte Nr. 2935. Maßstab 1:100000; Bundesamt für Seeschifffahrt und Hydrographie: Hamburg, Germany, 2012. [Google Scholar]
  65. Tauber, F. Meeresbodensedimente in der deutschen Ostsee: Fehmarn, Karte Nr. 2932. Maßstab 1:100000; Bundesamt für Seeschifffahrt und Hydrographie: Hamburg, Germany, 2012. [Google Scholar]
  66. Tauber, F. Meeresbodensedimente in der deutschen Ostsee: Kieler Bucht – Flensburger Förde, Karte Nr. 2931. Maßstab 1:100000; Bundesamt für Seeschifffahrt und Hydrographie: Hamburg, Germany, 2012. [Google Scholar]
  67. Tauber, F. Meeresbodensedimente in der deutschen Ostsee: Lübecker Bucht – Mecklenburger Bucht, Karte Nr. 2933. Maßstab 1:100000; Bundesamt für Seeschifffahrt und Hydrographie: Hamburg, Germany, 2012. [Google Scholar]
  68. Tauber, F. Meeresbodensedimente in der deutschen Ostsee: Mecklenburger Bucht – Darß, Karte Nr. 2934. Maßstab 1:100000; Bundesamt für Seeschifffahrt und Hydrographie: Hamburg, Germany, 2012. [Google Scholar]
  69. Tauber, F. Meeresbodensedimente in der deutschen Ostsee: Pommersche Bucht, Karte Nr. 2939. Maßstab 1:100000; Bundesamt für Seeschifffahrt und Hydrographie: Hamburg, Germany, 2012. [Google Scholar]
  70. Tauber, F. Meeresbodensedimente in der deutschen Ostsee: Rügen – Usedom, Karte Nr. 2937. Maßstab 1:100000; Bundesamt für Seeschifffahrt und Hydrographie: Hamburg, Germany, 2012. [Google Scholar]
  71. Tauber, F.; Lemke, W.; Endler, R. Map of sediment distribution in the western baltic sea (1:100,000), sheet falster —møn. Dtsch. Hydrogr. Z. 1999, 51, 5–32. [Google Scholar] [CrossRef]
  72. Tauber, F.; Lemke, W. Map of sediment distribution in the Western Baltic Sea (1: 100,000), Sheet “Darß”. Dtsch. Hydrogr. Z. 1995, 47, 171–178. [Google Scholar] [CrossRef]
  73. Schwarzer, K.; Heinrich, C.; Papenmeier, S. Abschlussbericht: Identifikation mariner Lebensraumtypen in der Mecklenburger Bucht (Kartierung der Sagasbank); Christian-Albrechts-Universität: Kiel, Germany, 2014. [Google Scholar]
  74. Schwarzer, K.; Bohling, B.; Heinrich, C. Submarine hard-bottom substrates in the western Baltic Sea – human impact versus natural development. J. Coast. Res. 2014, 70, 145–150. [Google Scholar] [CrossRef]
  75. Karez, R.; Schories, D. Die Steinfischerei und ihre Bedeutung für die Wiederansiedlung von Fucus vesiculosus in der Tiefe. Rostock. Meeresbiol. Beitr. 2005, 14, 95–107. [Google Scholar]
  76. Bock, G.; Thiermann, F.; Rumohr, H.; Karez, R. Ausmaß der Steinfischerei an der schleswig-holsteinischen Ostseeküste. Jahresber. Landesamt Für Nat. Umw. Landes Schlesw.-Holst. LANU 2003, 2003, 111–116. [Google Scholar]
  77. Healy, T.; Wefer, G. The efficacy of submarine abrasion vs. cliff retreat as a supplier of marine sediment in the Kieler Bucht, Western Baltic. Meyniana 1980, 32, 89–96. [Google Scholar]
  78. BSH. Guideline for Seafloor Mapping in German Marine Waters Using High-Resolution Sonars; BSH: Munich, Germany, 2016. [Google Scholar]
  79. Lurton, X. An introduction to underwater acoustics: Principles and applications; Springer-Praxis books in geophysical sciences; Second edition; Springer: Berlin, Germany, 2010; ISBN 978-3-540-78480-7. [Google Scholar]
  80. Blondel, P. The Handbook of Sidescan Sonar; Springer: Berlin/Heidelberg, Germany, 2009; ISBN 978-3-540-49886-5. [Google Scholar]
  81. Flemming, B. Side-Scan Sonar: A Practical Guide. Int. Hydrogr. Rev. 1976, 53, 65–92. [Google Scholar]
  82. Lamarche, G.; Lurton, X.; Verdier, A.-L.; Augustin, J.-M. Quantitative characterisation of seafloor substrate and bedforms using advanced processing of multibeam backscatter—Application to Cook Strait, New Zealand. Cont. Shelf Res. 2011, 31, S93–S109. [Google Scholar] [CrossRef] [Green Version]
  83. Kenny, A. An overview of seabed-mapping technologies in the context of marine habitat classification. ICES J. Mar. Sci. 2003, 60, 411–418. [Google Scholar] [CrossRef] [Green Version]
  84. Blondel, P.; Lurton, X. Handbook of Seafloor Sonar Imagery; Wiley-Praxis Series in Remote Sensing; Wiley: Chichester, UK; New York, NY, USA, 1997. [Google Scholar]
  85. Zhao, J.; Meng, J.; Zhang, H.; Yan, J. A New Method for Acquisition of High-Resolution Seabed Topography by Matching Seabed Classification Images. Remote Sens. 2017, 9, 1214. [Google Scholar] [CrossRef] [Green Version]
  86. Buscombe, D.; Grams, P. Probabilistic Substrate Classification with Multispectral Acoustic Backscatter: A Comparison of Discriminative and Generative Models. Geosciences 2018, 8, 395. [Google Scholar] [CrossRef] [Green Version]
  87. Fakiris, E.; Blondel, P.; Papatheodorou, G.; Christodoulou, D.; Dimas, X.; Georgiou, N.; Kordella, S.; Dimitriadis, C.; Rzhanov, Y.; Geraga, M.; et al. Multi-Frequency, Multi-Sonar Mapping of Shallow Habitats—Efficacy and Management Implications in the National Marine Park of Zakynthos, Greece. Remote Sens. 2019, 11, 461. [Google Scholar] [CrossRef] [Green Version]
  88. Feldens, P.; Schulze, I.; Papenmeier, S.; Schönke, M.; Schneider von Deimling, J. Improved Interpretation of Marine Sedimentary Environments Using Multi-Frequency Multibeam Backscatter Data. Geosciences 2018, 8, 214. [Google Scholar] [CrossRef]
  89. Gaida, T.; Tengku Ali, T.; Snellen, M.; Amiri-Simkooei, A.; van Dijk, T.; Simons, D. A Multispectral Bayesian Classification Method for Increased Acoustic Discrimination of Seabed Sediments Using Multi-Frequency Multibeam Backscatter Data. Geosciences 2018, 8, 455. [Google Scholar] [CrossRef] [Green Version]
  90. Gaida, T.C.; Mohammadloo, T.H.; Snellen, M.; Simons, D.G. Mapping the Seabed and Shallow Subsurface with Multi-Frequency Multibeam Echosounders. Remote Sens. 2019, 12, 52. [Google Scholar] [CrossRef] [Green Version]
  91. Che Hasan, R.; Ierodiaconou, D.; Laurenson, L. Combining angular response classification and backscatter imagery segmentation for benthic biological habitat mapping. Estuar. Coast. Shelf Sci. 2012, 97, 1–9. [Google Scholar] [CrossRef] [Green Version]
  92. Heinrich, C.; Feldens, P.; Schwarzer, K. Highly dynamic biological seabed alterations revealed by side scan sonar tracking of Lanice conchilega beds offshore the island of Sylt (German Bight). Geo-Mar. Lett. 2017, 37, 289–303. [Google Scholar] [CrossRef]
  93. McGonigle, C.; Grabowski, J.H.; Brown, C.J.; Weber, T.C.; Quinn, R. Detection of deep water benthic macroalgae using image-based classification techniques on multibeam backscatter at Cashes Ledge, Gulf of Maine, USA. Estuar. Coast. Shelf Sci. 2011, 91, 87–101. [Google Scholar] [CrossRef]
  94. McGonigle, C.; Brown, C.; Quinn, R.; Grabowski, J. Evaluation of image-based multibeam sonar backscatter classification for benthic habitat discrimination and mapping at Stanton Banks, UK. Estuar. Coast. Shelf Sci. 2009, 81, 423–437. [Google Scholar] [CrossRef]
  95. Schönke, M.; Wiesenberg, L.; Schulze, I.; Wilken, D.; Darr, A.; Papenmeier, S.; Feldens, P. Impact of Sparse Benthic Life on Seafloor Roughness and High-Frequency Acoustic Scatter. Geosciences 2019, 9, 454. [Google Scholar] [CrossRef] [Green Version]
  96. Anderson, J. Acoustic classification of marine habitats in coastal Newfoundland. ICES J. Mar. Sci. 2002, 59, 156–167. [Google Scholar] [CrossRef]
  97. Mielck, F.; Bartsch, I.; Hass, H.C.; Wölfl, A.-C.; Bürk, D.; Betzler, C. Predicting spatial kelp abundance in shallow coastal waters using the acoustic ground discrimination system RoxAnn. Estuar. Coast. Shelf Sci. 2014, 143, 1–11. [Google Scholar] [CrossRef] [Green Version]
  98. Mandić, F.; Rendulić, I.; Mišković, N.; Nađ, Đ. Underwater Object Tracking Using Sonar and USBL Measurements. J. Sens. 2016, 2016, 1–10. [Google Scholar] [CrossRef] [Green Version]
  99. Fakiris, E.; Papatheodorou, G.; Geraga, M.; Ferentinos, G. An Automatic Target Detection Algorithm for Swath Sonar Backscatter Imagery, Using Image Texture and Independent Component Analysis. Remote Sens. 2016, 8, 373. [Google Scholar] [CrossRef] [Green Version]
  100. Zhu, B.; Wang, X.; Chu, Z.; Yang, Y.; Shi, J. Active Learning for Recognition of Shipwreck Target in Side-Scan Sonar Image. Remote Sens. 2019, 11, 243. [Google Scholar] [CrossRef] [Green Version]
  101. Williams, D.P.; Fakiris, E. Exploiting Environmental Information for Improved Underwater Target Classification in Sonar Imagery. IEEE Trans. Geosci. Remote Sens. 2014, 52, 6284–6297. [Google Scholar] [CrossRef]
  102. Reed, S.; Petillot, Y.; Bell, J. An automatic approach to the detection and extraction of mine features in sidescan sonar. IEEE J. Ocean. Eng. 2003, 28, 90–105. [Google Scholar] [CrossRef]
  103. Wang, X.; Zhao, J.; Zhu, B.; Jiang, T.; Qin, T. A Side Scan Sonar Image Target Detection Algorithm Based on a Neutrosophic Set and Diffusion Maps. Remote Sens. 2018, 10, 295. [Google Scholar] [CrossRef] [Green Version]
  104. Sawas, J.; Petillot, Y.; Pailhas, Y. Cascade of boosted classifiers for rapid detection of underwater objects. In Proceedings of the 10th European Conference on Underwater Acoustics, Istanbul, Turkey, 5–9 July 2010; p. 164. [Google Scholar]
  105. Barngrover, C.; Kastner, R.; Belongie, S. Semisynthetic versus real-world sonar training data for the classification of mine-like objects. IEEE J. Ocean. Eng. 2014, 40, 48–56. [Google Scholar] [CrossRef] [Green Version]
  106. Dzieciuch, I.; Gebhardt, D.; Barngrover, C.; Parikh, K. Non-linear convolutional neural network for automatic detection of mine-like objects in sonar imagery. Int. Conf. Appl. Nonlinear Dyn. 2016, 309–314. [Google Scholar]
  107. Dura, E.; Zhang, Y.; Liao, X.; Dobeck, G.J.; Carin, L. Active Learning for Detection of Mine-Like Objects in Side-Scan Sonar Imagery. IEEE J. Ocean. Eng. 2005, 30, 360–371. [Google Scholar] [CrossRef] [Green Version]
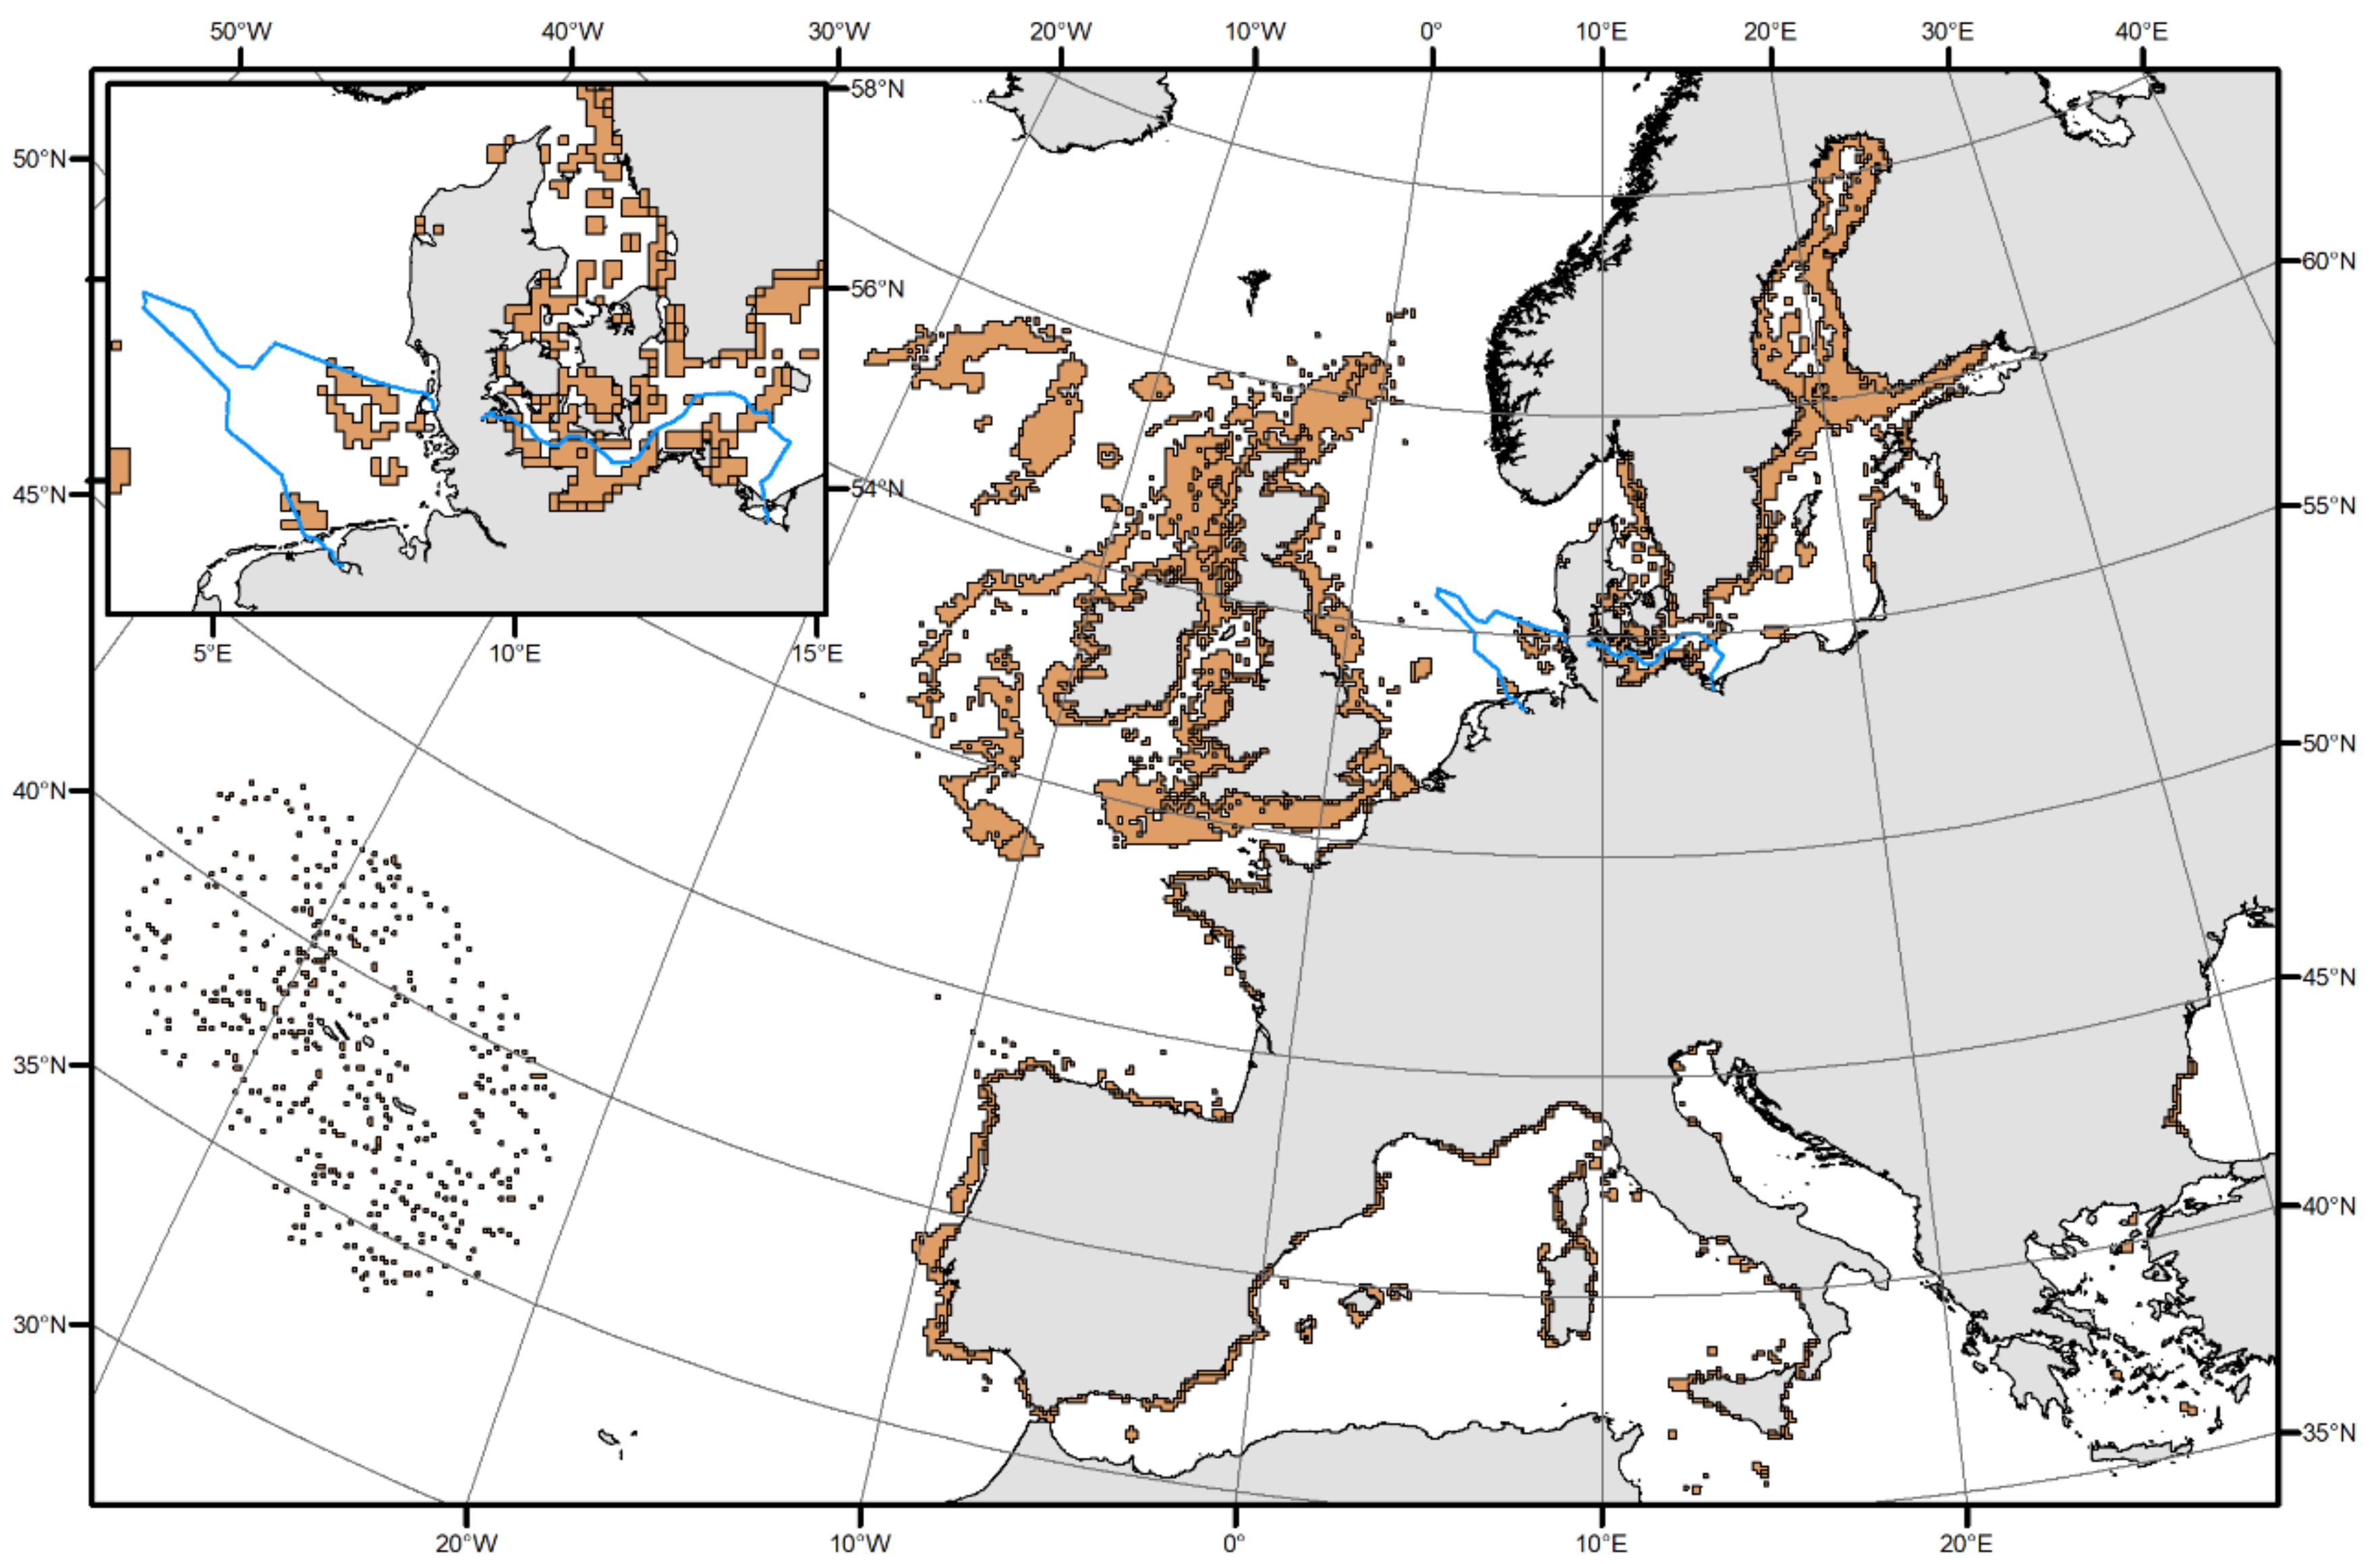
Figure 1. Map showing the distribution of reef habitats (geogenic and biogenic, code 1170) in Europe (orange boxes) as reported by the EU member states between 2007 and 2012. The visualization is based on the EEA (European Environment Agency) data set [28]. The size of raster cells is 10 × 10 km. Each cell can contain more than one habitat type. The blue line represents the outer boundary of the German Exclusive Economic Zone (EEZ).
Geosciences 10 00100 g001
Figure 2. Backscatter and bathymetry data of a hard-substrate area: (a) 400 kHz SSS, (b) 900 kHz SSS, (c) MBES 300 kHz, (d) MBES bathymetry. Red boxes represent insets of (eh). Data resolution is 25 cm. The blue numbers indicate the calculated object height in centimeters. SSS height above the sea floor was approximately 6.5 m.
Geosciences 10 00100 g002
Figure 3. Diagram showing the change of shadow length in relation to sonar height, distance to the nadir (ground range) and object height (a) vs. (b).
Geosciences 10 00100 g003
Figure 4. Calculated shadow length depending on ground range (across track distance) and sonar height for objects with size of 6.3 cm, 30 cm and 1 m.
Geosciences 10 00100 g004
Figure 5. Along track object detection is depending on the across track distance (ground range). Closely spaced objects far from the nadir are imaged as one object due to beam spreading (modified after Blondel and Lurton [84]). (a) Horizontal beam evolution and size of footprint in relation to the across track distance for time stamp t: 1–3. (b) Schematic sonar image.
Geosciences 10 00100 g005
Table 1. Area of reef habitats (code 1170) for the German North Sea and Baltic sea published by the German Federal Agency for Nature Conservation (BfN) [29] in comparison with areas given by the European Environment Agency (EEA) [28] shown in Figure 1. It has to be considered that each EEA raster cell can contain more than one habitat type.
German North SeaGerman Baltic Sea
km2% of Total Territorykm2% of Total Territory
Reefs TotalBfN452.83 1.11719.9611.1
EEA5768.5414.17814.0150.4
Reefs EEZBfN240.810.6463.773.0
EEA4394.2510.71158.817.5
Reefs Coastal ZoneBfN212.020.51256.198.1
EEA1374.293.46655.2042.9
Table 2. Criteria for delineation of geogenic reefs (code 1170) in the German EEZ for regional investigations according to the reef mapping guideline published by the German Federal Agency for Nature Conservation [33]. The original German terms are shown in italic.
TypeNorth SeaBaltic Sea
Boulder Field
“Steinfeld/Blockfeld”
object size: >30–50 cm
buffer: 75 m
≥21 stones with overlap = reef
no biological verification
object size: ≥50 cm
buffer: 7.5 m
≥21 stones with overlap = reef
no biological verification
Marine Erratic Boulders
“Marine Findlinge”
object size: ≥2 m
each object = reef
no biological verification
Lag deposits with Erratic Cobbles and Boulders
“Restsedimente mit vereinzelten Steinen und/oder Blöcken”
no single object detection
sediment type: lag deposit
polygon size ≥1.000 m2
biological verification mandatory