Abstract
This paper presents the quantification of uncertainties in the prediction of settlements of embankments built on prefabricated vertical drains (PVDs) improved soft soil deposits based on data collected from two well-documented projects, located in Karakore, Ethiopia, and Ballina, Australia. For this purpose, settlement prediction biases and settlement distributions were statistically computed based on analyses conducted on two Class A and Class C numerical predictions made using PLAXIS 2D finite element modelling. From the results of prediction bias, Class C predictions agreed well with the field measured settlements at both sites. In Class C predictions, the computed settlements were biased to the measured values. For Class A predictions, the calculated settlement values were in the range of mean and mean minus 3SD (standard deviations) for Karakore clay, and they were within mean and mean minus 2SD limit for the Ballina soil. The contributing factors to the settlement uncertainties of the Karakore site may include variability within the soil profile of the alluvial deposit, particularly the presence of interbedded granular layer within the soft layers, and the high embankment fills, and the limited number of samples available for laboratory testing. At the Ballina test embankment site, the uncertainties may have been associated with the presence of transitional layers at the bottom of estuarine clay and sensitivity of soft soil to sample disturbances and limitations in representing all the site conditions.
1. Introduction
Infrastructure construction over soft soil deposits often involves pre-construction improvement of the soil to increase the strength and stiffness, so that anticipated risks of excessive post-construction settlement and associated instability can be minimized. Among the available ground improvement methods for soft soils, the installation of prefabricated vertical drains (PVDs) accompanied by preloading is one of the most widely used and cost-effective stabilization techniques. The provision of PVDs facilitates faster rates of consolidation allowing the presumed vertical and horizontal settlements to be completed in a reasonably short period of time. A number of theoretical, analytical [1,2,3,4] and numerical models [5,6,7,8,9,10] are available for estimating ground movement parameters such as ultimate settlement, degree of consolidation, and excess pore water pressure. However, reliable predictions of the rate and magnitude of consolidation settlement remain a challenging task due to several uncertainties associated with input parameters, variability in soil profiles, properties of PVDs and prediction methods and constitutive material models affecting the outcome of the estimations [11,12,13,14].
Alluvial deposits are formed over flood plain areas and along river terraces where the terrain is flat and drainage conditions are poor. These deposits are mainly formed in four different facies models [15]. Alluvial sediments are characterized by distinctively orthotropic stratigraphy situations [16]. Estuarine clays are coastal region formations with thick deposits that are characterized as very low overconsolidation ratio and preconsolidation pressure and large consolidation settlements [17].
Soft ground improvement has become an important part of geotechnical engineering practices. The improvement methods generally can offer technical, economic, environmental, and time benefits [16,18]. A number of soft ground improvement techniques have been used in practice. The classification of these methods is based on different criteria. An optimum method of ground improvement is typically selected based on grainsize distribution of the soil, depth of improvement, type of the structure to be built on it, simplicity in construction, speed of consolidation process, environmental constraints, availability of materials and equipment, cost of construction and maintenance, reliability and durability compared to other ground improvement techniques [18]. Sand drains (SD), deep mixing method (DMM) using lime and cement [18,19], PVDs and deep vibro-compaction (DVC), are among the most widely used methods to improve soft soil deposits. Other methods such as sand compaction piles (SCP), stone columns (SC), horizontal drains (HD), vibro-concrete column (VCC), dynamic consolidation (DC), geotextile encased columns (GEC), and jute drain (JD) are also used widely as ground improvement techniques in many parts of the world for different conditions. However, PVDs associated with surcharge and/or vacuum preloading is the most common, easy construction and economically effective method of ground improvement for railway and highway structures for its fast consolidation process [18,19,20,21]. The PVDs technology were originally band-shaped drains, each drain made of a cardboard core and a paper filter jacket [18]. However, nowadays, PVDs are typically manufactured from a combination of corrugated polypropylene material core, which is enclosed in a polyethylene geotextile filter [19].
Intensive studies have been done on the numerical modelling of the deformation behavior of PVD-improved soft grounds accompanied by surcharge preloading and/or vacuum preloading for the coastal regions. Chai et al. (2001) studied the multilayer problem of Ariake clay deposit with finite element method (FEM) emphasizing equivalent vertical hydraulic conductivity [22]. Indraratna and Redana (2002) modelled the behavior of Bangkok and Muar clays incorporating the smear and well resistance [23]. Voottipruex (2014) came up with solutions for PVD-improved Bangkok clay coupled with vacuum preloading problems using a new numerical simulation of PVDCON software [24]. Yildiz (2009) studied a three-dimensional (3D) numerical analysis of PVD-improved soft clays using a newly developed constitutive model. A transformation of 3D problems into two-dimensional (2D) problems using matching techniques has been presented by the several authors [25,26]. The work of matching techniques was reported by other authors too [7,27,28]. Kelly et al. (2018) and a number of other engineers have reported on the numerical modelling development of a trial embankment built on PVD-improved estuarine soft clay of Ballina, Australia [10,29,30,31,32,33].
In order to model the behaviors and performances of embankment structures built on PVD-improved soft grounds, two common approaches have been used after Lambe [34], in relation to the information of input parameters. Class A prediction is employed before the field monitoring data are known. In this prediction, the information obtained from laboratory tests is used for the numerical modelling [35], while Class C is used once the field measured data that represent the real condition are known. Class C prediction is performed using back-analysis techniques [24,30,36]. In the back-analysis technique, parameters are adjusted systematically until the predicted settlement agreed reasonably well with the field measurement data.
However, many previously studied solutions for PVD-improved soft ground accompanied by surcharge preloading problems are based on deterministic approaches. Due to randomness and spatial variability of soil profiles under an embankment, deterministic procedures are not satisfactory for estimating the settlement performance of overlaying structures [12]. So, it is essential to quantify the uncertainties of predicted settlements in a simpler and understandable manner. Understanding the concepts of the subject would provide a means of quantifying uncertainties and properly handling them [37]. If the predicted values produce considerably lower or higher than the expected values, it would help the client for subsequent decision-making processes so that it can assign risk and allocate the required fund and to take corrective actions. Proper decision and early action minimize risks and anticipated associated costs and maximizes opportunities [31,38].
Karakore railway embankment was completed for soft soil improvement as a part of the Awash- Kombolcha-Haragebaya (AKH) railway project, Wollo Province, Ethiopia. The railway project covers 390 km length and traverses on several topographic conditions, including soft grounds found in Karakore and its vicinity [39]. Muhammed et al. [39] presented the deterministic settlements using Class A and Class C predictions for the Karakore soft soil. The Ballina test embankment is located in Ballina, New South Wales (NSW), Australia. It is a soft soil Field Test Facility that was established by the Australian Research Council Centre of Excellence for Geotechnical Science and Engineering (CGSE). The background information and field monitoring details are reported by Kelly et al. [21]. Site investigation, laboratory tests, and field instrumentation data from the Ballina project can be accessed online at [40] or references and further studies [41].
This study aimed at evaluating the uncertainties associated with the settlement predictions and prediction biases of embankments built on soft alluvial Karakore clay and coastal area deposit of estuarine Ballina clay. It also examined the main parameters and factors that contributed to the uncertainties in estimating the consolidation settlements. Systematic comparisons were also made in the predictions and uncertainties for the two different soft soil deposits.
2. Uncertainties in Settlement Predictions
Uncertainty, risk, and safety are common themes encountered in geotechnical engineering analysis and design. Despite a detailed and highest quality location-specific soil investigations and field monitoring data and with the best modeling method, it is recommended that the analyses shall be accompanied by uncertainty evaluations and quantifications [42]. In geotechnical engineering, uncertainties are mainly inductive [37]. Aleatory (temporal or spatial inherent variability) and epistemic (measurement errors, statistical, and transformation uncertainties) are the two broad types of uncertainties. Reliability analyses are performed to deal with the effects of uncertainties on the output results. Reliability-based analyses are carried out based on principles of probability and statistics. Statistics and probability are useful tools for the quantification of the mean (most probable, expected) value and the possible range of values of an input soil parameter and output results [43]. Statistical and probabilistic methods can be used to quantify uncertainties making it possible to account for the randomness of variables more rationally and consistently.
The observational method is a widely accepted effective way to deal with the uncertainty behavior of geo-materials [37]. For Karakore and Ballina soft clays, field observation data were utilized to predict the best fit values with the field conditions and to perform uncertainty analyses on the possible range of output results. Statistics of soil properties estimated from a limited number of test data and insufficient observations would lead to uncertainty. Such uncertainty is named as statistical uncertainty [44]. Since limited data was available for the project work undertaken at Karakore, predictions can suffer from statistical uncertainties in the soil parameters. In contrast, in Ballina, where data from the investigation were available for research and study purposes, the statistical uncertainties could be minimal. According to Liu et al. (2018), in Ballina test embankment, soil parameters of layers, spatial variabilities, disturbance around drains, groundwater variation, layer thickness, shear deformation modelling, pore pressure prediction, and approximation of modelling in 2D are the major contributing factors for the uncertainty of predictions of subsoil behaviors [42].
2.1. Probabilistic Techniques
There are several probabilistic approaches to perform statistical analyses of random variables. In this study, the two most popular probabilistic techniques were used to evaluate the statistical analysis of mean and standard deviation (CoV) of settlements. These are Taylor series reliability analysis [45] and the Monte Carlo (MC) simulation method [42]. The Taylor Series method is a first-order second moment (FOSM) analysis in which the first two moments, such as the mean and the standard deviation (SD) and CoV, are considered in the analysis. It consists of two distinct steps in the analysis. The first was to determine the CoV for the computed settlements and to assume a normal or lognormal distribution for the computed results; second, to determine the probability of failure or biasness using the computed values [46]. For this study, a lognormal distribution was assumed for the soil parameters obtained from test results, and a normal distribution was assumed for the randomly generated variables.
The MC simulation method is an advanced numerical technique for estimating the statistical properties of random input and response variables in a model. MC simulation is often used to solve stochastic problems, where random samples are taken from the distribution of a variable to generate a series of values. It can also be used to address deterministic, mathematical, and empirical problems in which the variables within the computation contain uncertainties with presumed probability distributions [44]. The MC simulation approach is also applicable to both linear and non-linear problems with a large number of simulations to provide reliable distribution of the response [42].
In this study, to evaluate the reliability of predictions on short-term and long-term settlement responses of embankments built on PVD-improved soft deposits of Karakore and Ballina, several factors were considered. Uncertainties associated with input parameters and prediction methods were assessed in detail. On Ballina clay, previous probabilistic studies have been carried out to quantify uncertainties in the prediction of settlements, pore water pressure, and lateral deformation of the soft estuarine clay [10,31,38,42]. These previous works have been used here to compare with the current settlement prediction results. The comparison is presented under Section 5.
2.2. Measure of Dispersion of Data
Statistical dispersions of random variables are measured by standard deviation, coefficient of variation, skewness, and kurtosis. The coefficient of variation (CoV) the relative distribution of data sets in terms of their standard deviation and mean. CoV measures the confidence level associated with input soil parameters. A low CoV value indicates that the confidence level of model parameters is relatively high and vice versa. The CoV value for input model parameters was determined from laboratory tests, and the results are presented as in Table 1. For both Karakore and Ballina, the authors judged a minimum of 0.10 for the CoV of the field measured settlement. For Ballina clay, it was found that the CoV value for the vertical settlement ranged between 0.10–0.29 [21,31,47].

Table 1.
Compression and hydraulic parameters of two soft soils (laboratory test results).
There are several random variables involved in the estimation of settlement analytically or using FE modeling. These parameters would contribute to a combined effect on the output of predicted settlement. So, one can compute the standard deviations of the variables involved in the estimation of model settlement [45].
where ΔS1, ΔS3, ΔSn, are the change in settlement values of mean −SD (1, 2, …, n) and + SD (1,2, …, n) from parameters 1, 2, and n respectively at a given time of observation.
Coefficient of variation of settlements from the combined effects of all parameters can be obtained as:
where SMP is the most probable predicted settlement value at a specific time of observation.
2.3. Bias in Settlement Predictions
Prediction bias or settlement error can be represented by settlement ratio (R). R can be computed from the ratio of predicted settlement to measured settlement.
Model bias or model error is another uncertainty associated with the model used for the prediction of settlements. Logically, uncertainties about the input random variable lead to uncertainty about the model output [48]. Hence, both input soil parameters and modeling techniques contribute to the uncertainty of settlement estimation. For Class A and Class C predictions, settlement bias was considered. For Class A, the predicted settlement usually deviates from the measured values due to high uncertainty associated with laboratory test results for the model input parameters. Therefore, it is not easy to differentiate the contribution of the model uncertainty from the uncertainty in input soil parameters. However, model bias was evaluated for Class C prediction with respect to the field measured settlement values. Bias for model uncertainty was based on the judgment from the experience with predictions of the behavior of soft grounds under an embankment.
3. Statistical Soil Properties
3.1. Description of the Soft Soil Profiles, the Embankments and Field Measurements
The background information for the Karakore preloading embankment and Ballina test embankment including vertical soil profile, in-situ and laboratory test data, and results from field instrumentation and monitoring are found in [39] and [21], respectively. The soft layers of Karakore are mainly characterized by ancient alluvial Quaternary deposits, and the soil profile at deeper depths is formed from an older Tertiary Eocene deposits. The vertical profile varies from soft to very soft silty clay and has variable thicknesses. It can be characterized as a heterogeneous soil profile, and the soft portion is interbedded by granular and very compressible organic matter (where the natural moisture contents significantly exceed the liquid limits).
The soil profile under the Ballina embankment has several layers with variable compression and consolidation parameters. The geological profile of Ballina clay, which was formed as estuarine Quaternary sediment, consists of a coastal area deposit. The soil profile at the deeper depths consists of silty clay. It is a young formation from the Pleistocene age. Ballina soil is dominated by estuarine clay, which covers 70% of the total soft portion and is relatively uniform, as compared to Karakore soil.
The Karakore preloading embankment, over PVD-improved soft ground on the AKH railway project, has a base width of 60 m, 3H:1V slope, and 8 m total height (of which 2 m is an extra fill which was removed later). It was built to facilitate the consolidation settlement of the PVD-improved subsoil. The vertical PVDs (CeTeau wick drains) installed into the soft section covers 12 m depth and installed at 1.3 m square grid, underlain by 0.6 m working platform and 0.5 m drainage blanket and 0.20 m thin layer to prevent the ingression of fine particles to the drainage layer. The field monitoring was done at the centerline of the railway line. A surface settlement was measured on the top surface of the fill where readings were taken once a week.
The Ballina geometry of the test embankment, the crest, is 3 m high and 28 m wide at the base of the embankment and 80 m longitudinally with 1.5H: 1V side slope. The working platform has 0.6 m thick and 0.4 m sand drainage layer that was placed beneath the embankment. The vertical PVDs (CeTeau wick drains) were installed into 16 m depth with a 1.2 m square grid. Field settlements were measured using a magnetic extensometer (Mex1) at the centerline of the embankment. Mex1 had 6 (M0–M6) legs of spider magnets to measure the settlements at different depths vertically. For our case, the settlement at M0 (at the ground surface below the embankment) was considered for the analyses and comparisons.
3.2. Soil Properties of Karakore and Ballina
A number of field and laboratory tests were carried out to characterize the engineering properties of the soft soils. At Karakore, a borehole was drilled to a depth of 26 m at station KM 160 + 750, whereas at the Ballina site, a borehole was drilled to a depth of about 23 m at MEX01. Common soil characterization procedures grain-size analysis, Index tests, consolidation, and triaxial tests, as well as field tests, were conducted at both project sites. Details of the test results for Karakore and Ballina sites are reported in [21,39,49]. Here, for the purpose of comparison, only grain-size analysis, compression, and consolidation test parameters are presented as in Figure 1 and Table 1. Figure 1 presents the distribution of particle size of Karakore and Ballina for the soft soil sections. Karakore has a significant amount of coarse-grained (gravelly sand) particle proportion than Ballina. Karakore soil profile is interbedded by a coarse-grained layer (nearly 3 m thick). Nevertheless, the clay proportion is higher for Ballina than Karakore. Table 1 summarizes the mean and CoV values of basic compression parameters (compression index (Cc), recompression index (Cr), and initial void ratio (eo)) and consolidation (vertical coefficient of permeability (kv)) which were typically utilized in the finite element prediction modeling.
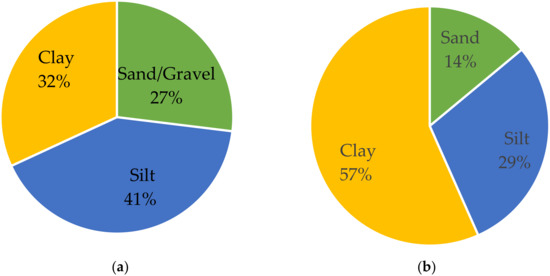
Figure 1.
Mean value of particle size distribution of soft layers (a) Karakore soil (thickness of the soft layer h = 12.50 m) and (b) Ballina clay (thickness of soft layer h = 12.26 m).
3.3. Uncertainty in Model Parameters
One of the challenges often encountered in geotechnical analysis and design involves the selection of representative values for input soil parameters. The selection of "best estimate," "upper bound," or "lower bound" is often based on expert judgment and past experience [50]. The associated uncertainties with the soil properties are limited to the extent to which the parameters could influence the outcome. In conjunction with conventional statistical estimates, the probabilistic distribution of soil parameters is employed in some national codes such as Eurocodes [44].
Figure 2 and Figure 3 present the mean values of basic input model parameters for Karakore and Ballina clay, respectively. The probability distribution of parameters is demonstrated for the most influential layers. The most sensitive and influential parameters were identified based on previous work documented in references to [39] and [51] for Karakore and Ballina clays, respectively.
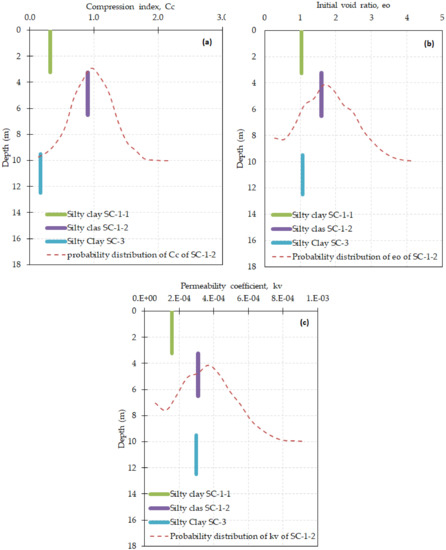
Figure 2.
Mean values of model parameters for different layers and probabilistic distribution for the most influential layer (Silty clay SC-1-2) of Karakore clay (a) Compression index (b) Initial void ratio (c) vertical coefficient of permeability.
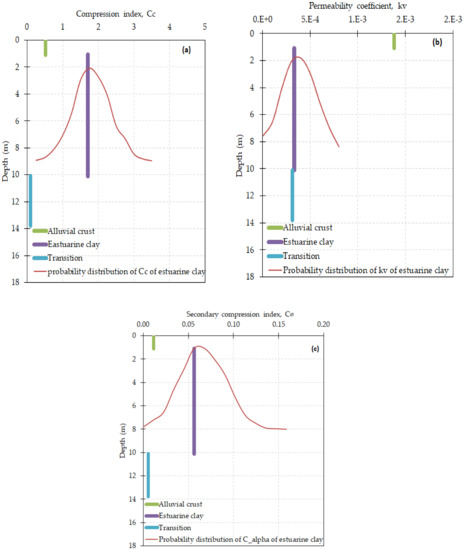
Figure 3.
Mean values of model parameters for different layers and probabilistic distribution for the most influential layer (estuarine clay)) of Ballina clay (a) Compression index (b) Secondary compression index (c) vertical coefficient of permeability.
4. Settlement Predictions
4.1. Random Input Variables
The significant random variables associated with the prediction of settlements include input soil parameters and output settlements. Three model parameters were considered in this analysis for each soft soil site. For the Karakore site, the most influencing and sensitive parameters, as determined from previous work [39], were Cc, Cα, and Kv were utilized. For the Silty Clay layer (SC-1-2), which was found to be highly compressible, these parameters were considered as stochastic variables, while they were modeled as deterministic values for the other layers. The input parameters, Kv and Cα were the most significant model parameters for Ballina clay. The distribution of the data sets for the input variables was better represented by lognormal distribution [42,45].
4.2. Calibration of MC Simulations
The estimation of MC simulation was carried out by R programming. R is an open-source coding system with flexible functionalities in statistics and probability [52]. The probabilistic distribution of soil properties, model parameters, and settlements was simulated using MC. For a general simulation of random samples from the distribution of random variables, the following procedures were followed. (a) Random samples were generated (say n = 5000 for this case) based on known statistical parameters such as mean and standard deviation which were obtained from laboratory or field test data, (b) a new mean was estimated from the generated samples, (c) the new mean was computed as a cumulative mean so that the simulated mean values converged to the ‘True Mean’ referring to the initial input mean value as a target value; alternatively, the convergence can be checked against the expected variance, such that the values should lay within the range of 1/n–2/n1/2. The simulation was computed with the ‘replicate’ function in R coding script. Replicate indicates that how times each sample point is iterated. In this case, the iteration(replication) was done for 1000 times for each sample points.
Figure 4 presents the number of simulated samples for the settlement of Karakore soft soil on the 310 days of observation. In the MC simulation technique for random variables converged at 4000 number of samples. This indicated that increasing the number of simulations beyond 4000 samples did not affect the probabilistic distribution of the population data and did not bring significant change to the outcome of the dataset. The simulation of random samples was assessed for random model inputs, settlement outputs, and settlement ratio. From Figure 4, the minimum sample size for the random variable to reach an acceptable accuracy was found to be 4000. This random sample number agreed well with the recommendation made by Phoon (2015) for MC simulations [46].
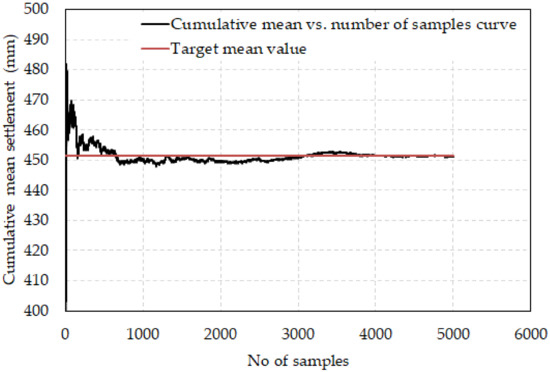
Figure 4.
Generation of random samples and convergence of the number of samples (adopted from Class A prediction of the Karakore site—the settlement on 310th day).
4.3. Modeling Techniques and Input Parameters
The probabilistic settlement predictions were performed based on settlements from Class A and Class C predictions. Soil parameters were updated in Class C consolidation settlement prediction before probabilistic analysis was carried out. The settlement behavior was modeled using the PLAXIS 2D Finite Element computer program. From the output of the modeling, probabilistic analyses were performed using the computed statistical values of mean and coefficient of variation (CoV).
Class A predictions were performed using laboratory test data for input soil parameters while Class C predictions were made after settlement data were obtained through field monitoring. A plane strain condition (2D) with a discretization of 15-node of triangular elements was employed. Soft Soil Creep (SSC) constitutive material model was employed for the soft layers for both sites. The other layers were modeled by relatively simple soil models such as Mohr-Coulomb (MC) for the fill and coarse-grained layers while Modified Cam-Clay (MCC) model was for the stiffer clay layers. The embankment fill, working platform, the drainage layers, and the sand layers were modeled as ‘drained’ condition, while the other soft and stiff silty clay layers were modeled as ‘undrained’.
The parameters adopted in FE modeling for Class A and Class C predictions are summarized in Table 2 and Table 3. Some of the basic input parameters (layer thickness, unit weight, angle of frictions) were obtained from investigation tests while the others were derived from literature (Young’s modulus, Poisson’s ratio, cohesive strength). Class A input parameters were obtained from laboratory tests. The stiffness parameters (Cc, Cr, OCR) and consolidation parameter (kv, eo) were obtained from Oedometer consolidation tests using the incremental loading (IL) for Karakore and Ballina clay and constant rate of strain (CRS) with a loading rate of 10-7/second method (Ballina clay).

Table 2.
Basic input parameters for FE modeling.

Table 3.
SSC model mean soil parameters for Class A and Class C predictions.
An over consolidation ratio (OCR) of 1.5 and permeability change index (Ck = 0.6eo) was used for the Karakore soil modeling. For Ballina, OCR of 4 for the top alluvial crust and 1.7 for the estuarine clay, as well as Ck = 0.5eo, were applied. Besides, a pre-overburden pressure (POP) of 27 kPa was used as a deterministic input parameter. A groundwater table (GWT) of 1.5 m and 1 m were used for the Karakore and Ballina soils, respectively.
4.4. Loading Stages and Settlement Readings
The fill placement was carried out stage by stage for both Karakore [39] and Ballina [21,51] soft soil sites. For the Karakore site, settlement reading was started after the completion of the embankment fill and lasted for 310 days, while for Ballina soil, the settlement reading was started before the placement of the embankment and construction of the working platform and was monitored for 1770 days.
5. Result Analyses and Discussions
5.1. Prediction Bias for Class A and Class C Settlements
Prediction bias or settlement ratio (R) was computed using the settlement values obtained from the Class A and Class C predictions using PlAXIS 2D against field measured values by adopting Equation (3). Figure 5 and Figure 6 demonstrate the relationship between settlement ratio and time for Class A and Class C predictions of Karakore and Ballina embankments on PVD-improved soft subsoils.
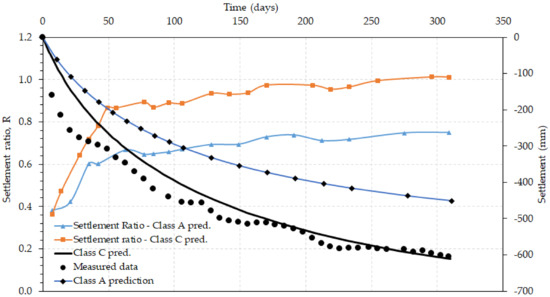
Figure 5.
Settlement ratio and predicted settlements vs. time for Karakore clay.
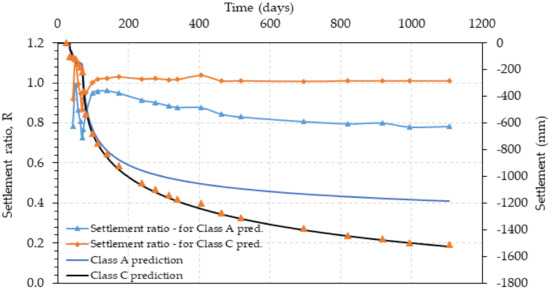
Figure 6.
Settlement ratio and predicted settlements vs. time for Ballina clay.
5.1.1. Class A Predictions
For Karakore clay (Figure 5), Class A under-predicted the field settlement. Correspondingly, from the settlement ratio-time (R-t) curve, R was found below 1. It showed that the predicted settlement underestimated the measured values. It also showed that there is high uncertainty in the estimation of settlements using Class A input parameters. The value of R was small during the early periods of observation. Then, it increased significantly until it reached an average value of 0.73 during the latter period of observations. In general, the average prediction bias for Class A prediction was found to be 0.65.
For Ballina clay (Figure 6), generally, Class A also under-predicted the field settlement of the estuarine clay. But, during the early period of observation (during the loading phase), the predictions matched well with the field measured settlements and the average R values were closer to 1. During these early periods of observation, stiffness and consolidation model parameters had a lesser influence on the settlement response. The applied embankment load was the major contributing factor for the deformation. This supported the finding reported by Liu et al. [42] that pre-overburden pressure (POP) was the most influencing random variable on the predicted settlement during the period of embankment loading. Besides, at the end of filling, the plastic deformation (shear yielding) was the dominant settlement than the consolidation settlement in which the applied load exceeded POP Chan et al. [32]. However, beyond 98 days, Class A approach under-predicted the field settlement. The corresponding average R was found to be 0.87 for Ballina clay.
Concerning Ballina clay and Class A prediction, the current study reasonably agreed with the works of Josted et al. [30] and Liu et al. [42]. Other predictors such as Lim et al. [51], though the settlement with Class A was still under-predicted, the authors came up with an improved estimation. Lime et al. (2018) employed a combined analytical solution of Barron and Hansbo with hand calculation techniques.
The discrepancies in Class A prediction were likely resulted from the differences in laboratory test parameters with the field conditions and the rigorous procedure followed during modelling. Furthermore, model uncertainty could have contributed to the deviations, but it is difficult to estimate the magnitude of the explicit contribution of the model uncertainty on the prediction.
5.1.2. Class C Prediction
For Karakore clay (Figure 5), the value of R calculated based on Class C prediction was initially below 1.0. But it increased to nearly 0.9 in less than 50 days of observation. Then it gradually approached a ratio of 1.0. Accordingly, Class C prediction simulated the settlement behavior much better than Class A. The field monitoring settlement-time data by itself was not smooth and consistent. This may be attributed to the seasonal and environmental variation effects on the field recordings of the settlement data. However, Class C did not perfectly capture the actual settlement behavior still. Particularly, during the early period of observations (say up to 121 days), the discrepancies between the measured and the predicted settlement were considerable. The causes of these differences were not clear and were probably due to multiple contributory factors. But, one of the probable reasons is the deformation of the embankment itself which was nearly 8m high and contained some fine-grained contents. The settlement monitoring was taken on the top of the embankment surface at the centerline of the railway line. So that the field monitoring would account for the settlement of the entire embankment system, including both the PVD-improved soft subsoil and the embankment itself. The other reason possible due to the presence of an interbedded loose gravelly sand layer with a significant thickness (3 m).
For Ballina clay (Figure 6), during early periods of observation, the dominant factor was the embankment loading rather than the input parameters. That is why the settlements from Class A and Class C matched well with the field monitoring data up to nearly 98 days. Beyond this period, Class C best simulated the field behavior of the settlement of Ballina clay. The prediction was biased to the measured settlement with an R-value of 1.0, and it showed that Class C perfectly simulated the field settlement behavior. From this, one can understand that the model uncertainty in Class C prediction was 1.0, and the prediction biased to the true (measured value).
In general, Class C predicted the behavior of the field settlement behavior of Ballina clay much better than it did for Karakore clay. The distribution of Ballina soil profile is relatively uniform, the laboratory tests and field monitoring were controlled and well established than Karakore. Figure 7 depicts the relationship between Class C predicted and field measured settlements of Karakore and Ballina sites. For Karakore area, it can be seen that the points scattered about the line of equality, indicating that during the earlier observation periods, the prediction underestimated settlements, but later the predicted and measured values agreed well; whereas for Ballina, the field measured and PLAXIS 2D model predicted settlements fitted well to the line of equality.
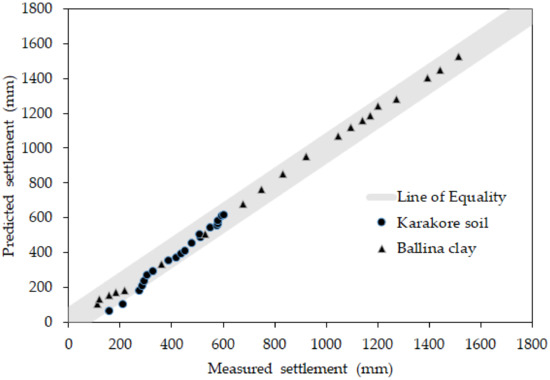
Figure 7.
Class C Predicted vs. measured settlement of Karakore and Ballina clay.
5.2. Distribution of Settlement Predictions Bias
The uncertainty of prediction bias, R was computed from Class A and Class C predictions and presented statistically. R was computed from the mean values of predicted and measured settlements at the end of the observation period for both sites. Figure 8 and Figure 9 present the histogram and probabilistic distribution of average settlement bias for Class A and Class C predictions of Karakore and Ballina sites. The distribution of random variable R was simulated using MC method. From the simulated histogram and density function curve, the prediction bias was spread over a wider range for the Karakore clay. This shows that the prediction from this area has significant uncertainty and more biased against the field measurements. Whereas, for Ballina clay, the data set relatively was spread over a narrow range. The prediction of the Ballina test embankment settlement has a lesser uncertainty and biased towards the measured settlement.
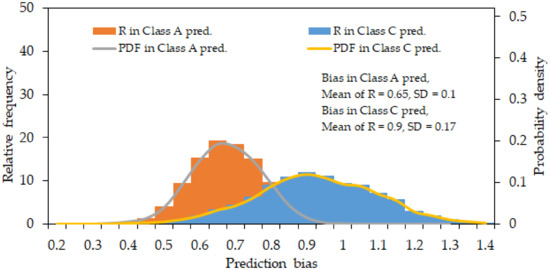
Figure 8.
Distribution of settlement prediction bias for average values of R from Class A and Class C pred.—Karakore clay.
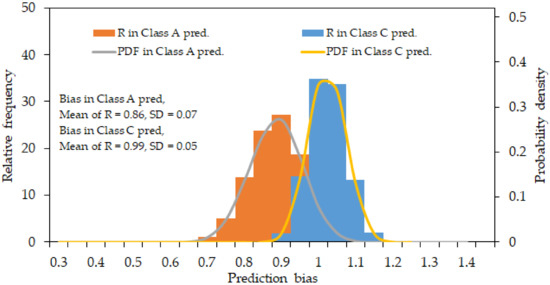
Figure 9.
Distribution of settlement prediction bias for average values of R from Class A and Class C—Ballina clay.
5.3. Probable Limits of Predicted Settlements
Labeling of characteristics values as ‘lower bound’ (LB), ‘most probable’ (MP), and ‘upper bound’ (UB) are essential for use in geotechnical analysis and design. For Karakore and Ballina soft soils, the most probable value (MP) of settlements was computed from Class C prediction, which is equivalent to the measured settlement. A FOSM probabilistic analysis was carried out for mean (measured value) ± 1SD, ± 2SD, and ± 3SD of the settlement, and it is shown in Figure 10 and Figure 11. For Karakore, the analysis was done for 7, 70, 154, and 310 days of observation, while for the Ballina, it was computed for 34, 98, 314, and 1107 days.
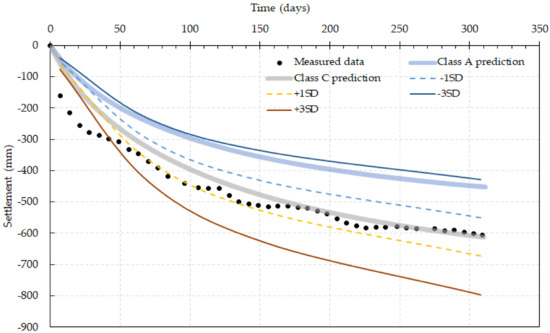
Figure 10.
Measured and Predicted settlement for mean values ± 1SD and ± 3SD for Karakore clay.
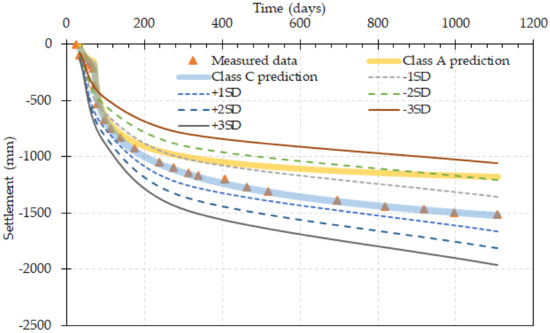
Figure 11.
Measured and Predicted settlement for mean ± 1SD, ± 2SD and ± 3SD for Ballina clay.
From Figure 11 and Figure 12, Class A prediction of Karakore and Ballina was found to be close to the best estimate of mean—3SD and mean—2SD, respectively. The predicted settlement of Karakore clay using the laboratory input parameters at the end of observation was found to be 428.4 mm as LB values, whereas the UP was 795.6 mm. This shows that the prediction was found within a 99.73% confidence interval of all values. Whereas, Ballina clay, the LB predicted value was 1209.2 mm, whereas the UB was 1814.4 mm, which is all values laid within a 95% confidence interval.
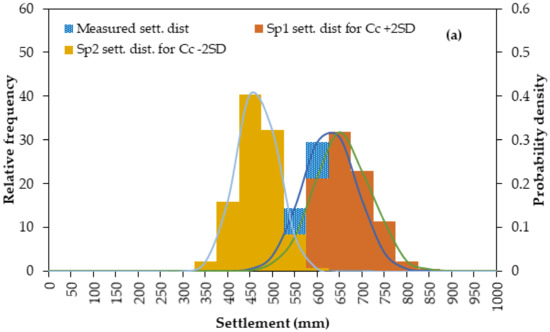
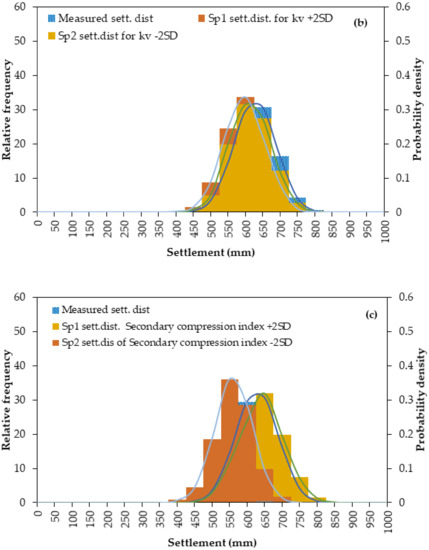
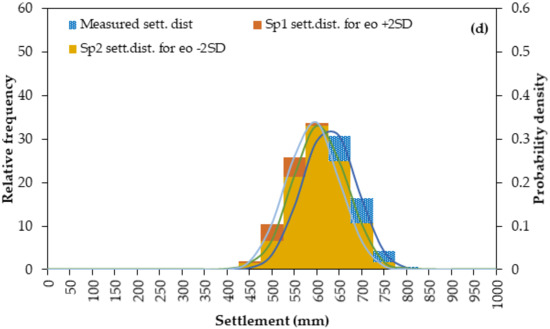
Figure 12.
Uncertainty distribution of ultimate consolidation settlement for (a) Cc (b) kv (c) Cα and (d) eo–Karakore site.
For both sites, it was observed that model predictions based on laboratory test results mostly underestimated the actual field settlements. FEM based prediction of settlements were found equal to or less than the field measured values. The work of a number of authors on Ballina clay supports this argument. The predictions of settlements were analyzed using PLAXIS 2D by employing SSC material model and incorporating LS mesh update option by Lie et al. [42], Josted et al. [30], Chan et al. [32] and Gong [53]. These studies showed that predicted results were found less than or equal to the field observation values.
5.4. Evaluation of Settlement Uncertainties
This section presents and discusses the effects of variation of input parameters on settlement distribution. Influences of input parameters on the output distribution of settlements were evaluated for both Karakore and Ballina clay. To assess the impact of input parameters on the distribution of settlements, an uncertainty analysis was executed for Class C prediction. The settlement distribution was performed by varying the most influencing compression and consolidation parameters namely Cc, and Cα, eo and kv plus and minus two SD. It led to the settlement distribution of Sp1 (settlement for mean of a parameter +2SD) and Sp2 (settlement for mean of a parameter −2SD) and presented in Figure 12, and Figure 13. To compute the settlement distributions, a reasonable CoV of 0.15 for Karakore field monitoring and 0.1 value of CoV for Ballina [31] were used for the settlement measurement error. Then, the mean and SD were computed from the generated probabilistic settlement distribution.
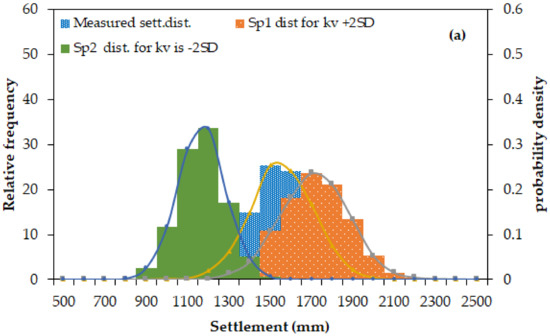
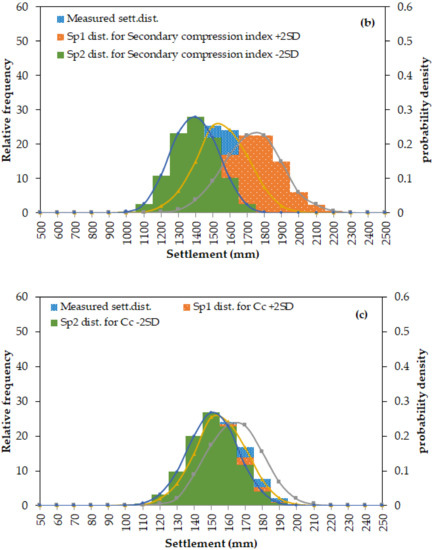
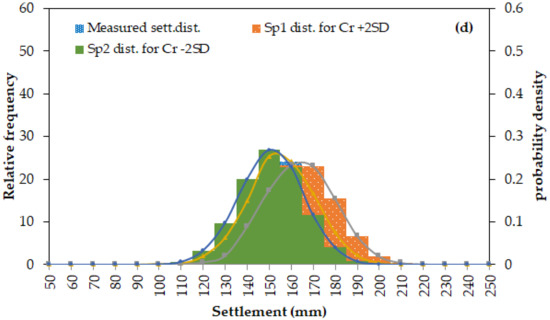
Figure 13.
Uncertainty distribution of ultimate consolidation settlement for (a) kv (b) Cα (c) Cc and (d) Cr–Ballina site.
For Karakore clay (Figure 12), the settlement distribution from the effect of Cc ± 2SD covered a wide range with two tails of probability density distribution. It was compared to the distribution of measured settlement values. From the probable distribution, it showed that Cc is the most dominant model parameter and significantly influenced the settlement distributions. Furthermore, the second influencing parameter was the secondary creep coefficient, Cα, Kv and eo have equivalent influence on the settlement distribution. This may work for the reason that Kv is a function of eo, and kv depends on the amount of void ratio. PLAXIS 2D also considers the change of void ratio to estimate the coefficient of permeability during the application of load in the model analysis [54].
For Ballina clay (Figure 13), next to the vertical coefficient of permeability, the secondary creep coefficient was the dominant parameter in affecting the settlement predictions. The distribution of the settlement spread over large area owing to the variation of kv −2SD and +2SD.
5.5. Standard Deviation and CoV of the Predicted Settlements
The CoV of the predicted settlement was estimated from the combined standard deviation of the change in settlements from the most probable value for each parameter (Figure 12 and Figure 13). The settlement change from the variation of Cc, kv, Cα, and eo was estimated for both sites. Then, the mean settlements, the most probable value which was obtained from the prediction at the beginning and end of the observation, were considered for computing CoV as per Equation (1) and (2). For Ballina clay, the computed CoV of settlement prediction ranged from 0.22–0.31. And, CoV ranged from 0.1–0.17 for Karakore clay. From this, one can understand that for equal increments of parameters with mean ±2SD, the predicted settlement of Ballina clay was more sensitive to the change of parameters than the Karakore soft soil.
6. Final Remarks and Conclusions
6.1. Final Remarks
The large degree of variability and uncertainty associated with the input soil parameters pose special challenges in obtaining reliable results from geotechnical analyses. In such situations, geotechnical engineers must decide which random variables are most dominant and must be given special considerations. The study mainly concentrated on utilizing the routinely available statistical techniques and implemented a number of simplifications in the modeling of the input parameters and soil profiles. Though the use of probabilistic methods did not avoid the need to conduct a high-quality laboratory and field tests, installing field monitoring systems, implementing proper model parameters, and constitutive models, it would provide the advantage of estimating uncertainties in a more understandable, reliable and practicable way.
For practical engineering projects such as railway and highway embankments to be built on similar soft geo-materials and improved with PVDs, one can employ this approach to evaluate the settlement performance of constructed structures. The approach has the capability of capturing the range of settlements of alluvial deposits (for Karakore clay) and estuarine deposits (Ballina clay) and to replicate the method for similar deposits in these regions with some modifications. It would also help as a useful tool to evaluate the uncertainty conditions of settlements with similar ground formations and properties by simply using conventional test results. The minimum predicted settlement can be considered within the range of mean and mean minus three standard deviations and minus two standard deviations for alluvial and estuarine clays respectively.
In other words, one can use Class A settlement predictions by using model parameters which can be obtained from laboratory tests. Since Class A usually underestimates the field conditions, it is recommended that the field settlement can be estimated as Class A predicted values plus two or three standard deviations. But, as it is difficult to determine the actual standard deviation without having the field settlement data, alternatively, one can estimate the field settlement by employing prediction bias, R value (see also Equation (3)) which can be obtained from Class A predictions. The ranges of values of prediction bias of settlements were presented in Figure 8 and Figure 9. The average values of prediction bias are 0.65 and 0.86 for Karakore and Ballina soils respectively. Generally, prediction bias values between 0.65–0.86 may be adopted for soft grounds with their soil properties fall within Karakore and Ballina clays.
6.2. Conclusions
In consideration of the previous remarks and the objectives mentioned above, the authors have come up with the following conclusions.
- The average prediction bias from Class C prediction for Ballina clay and Karakore was found to be 1.0 and 0.9 respectively. This showed that the prediction and model uncertainties for estuarine Ballina clay are lower than that of the Karakore alluvial soil.
- For both sites, the prediction bias was not consistent throughout the observation periods in both Class A and Class C predictions. This showed that the parameters which influenced the settlement output depend on the time of observation. This agreed with the work published by Liu et al. (2018) on Ballina clay [42].
- Cc was found to be the most uncertain random variable in predicting the consolidation settlement of Karakore alluvial clay deposit, while kv was for Ballina estuarine clay. Cc and kv were also highly influenced by the distribution of predicted settlements than other parameters for both Karakore and Ballina sites, respectively.
- Generally, for Karakore soft clay, the uncertainty could stem from the variability of the soil profile, presence of interbedded granular layers, and high embankment fills and limited samples for the laboratory tests; whereas for Ballina clay, the contributory factors may include the presence of transitional layers at the bottom of estuarine clay, sensitivity of the soft soil to sample disturbances.
- Uncertainty based analyses and comparisons have brought advantages over deterministic approaches by taking into account the uncertainties related to soil properties (Karakore soft alluvial vs. Ballina estuarine clay), model parameters, and quality of samples in representing the field conditions.
Author Contributions
Conceptualization, J.J.M. and P.W.J.; Data curation, J.J.M.; Formal analysis, J.J.M.; Methodology, J.J.M.; Software, J.J.M.; Supervision, P.W.J. and S.E.-O.; Visualization, J.J.M.; Writing—original draft, J.J.M.; Writing—review & editing, P.W.J. and S.E.-O. All authors have read and agree to the published version of the manuscript.
Funding
This research received no external funding.
Acknowledgments
The authors gratefully acknowledge the support given by Ethiopian Railway Corporation—AKH Project office, esp. the project manager—Eng. Abdulkerim Muhammed., T. Yapi Merkezi İnşaat (YMI)—Geology and Geotechnics office. We also thank the Centre of Excellence for Geotechnical Science and Engineering (CGSE) which was established the Australian National Field Testing Facility (NFTF) in Ballina, Northern New South Wales, to make the field and laboratory tests data available on the web for free.
Conflicts of Interest
The authors declare no conflict of interest.
References
- Hansbo, S. Consolidation of Clay by Band Shaped Prefabricated Drains Ground Eng’g. Gr. Eng. 1979, 12, 16–25. [Google Scholar]
- Barron, A.R. Consolidation of Fine-Grained Soil by Drain Wells. In Transactions of the American Society of Civil Engineers; American Society of Civil Engineers: New York, NY, USA, 1948; Volume 113, pp. 324–360. [Google Scholar]
- Huat, B.B.K.; Hoe, N.C.; Munzir, H.A. Observational Methods for Predicting Embankment Settlement. Pertanika J.Sci. Technol. 2004, 12, 115–128. [Google Scholar]
- Balasubramaniam, A.S.; Cai, H.; Zhu, D.; Surarak, C.; Oh, E.Y.N. Settlements of Embankments in Soft Soils. Geotech. Eng. 2010, 41, 61. [Google Scholar]
- Hird, C.C.; Pyrah, C.; Russell, D. Finite Element Modelling of Vertical Drains beneath Embankments on Soft Ground. Geotechnique 1992, 42, 499–511. [Google Scholar] [CrossRef]
- Bergado, D.T.; Alfaro, M.C. Improvement of Soft Bangkok Clay Using Vertical Drains. Geotext. Geomembr. 1993, 12, 615–663. [Google Scholar] [CrossRef]
- Rujikiatkamjorn, C.; Indraratna, B.; Chu, J. 2D and 3D Numerical Modeling of Combined Surcharge and Vacuum Preloading with Vertical Drains. Int. J. Geomech. 2008, 8, 144–156. [Google Scholar] [CrossRef]
- Indraratna, B.; Baral, P.; Rujikiatkamjorn, C.; Perera, D. Class A and C Predictions for Ballina Trial Embankment with Vertical Drains Using Standard Test Data from Industry and Large Diameter Test Specimens. Comput. Geotech. 2018, 93, 232–246. [Google Scholar] [CrossRef]
- Chai, J.; Shen, S.; Bergado, D.T. Modelling Prefabricated Vertical Drain Improved Ground in Plane Strain Analysis. Proc. ICE Eng. Improv. 2013, 166, 65–78. [Google Scholar] [CrossRef]
- Müthing, N.; Zhao, C.; Hölter, R.; Schanz, T. Settlement Prediction for an Embankment on Soft Clay. Comput. Geotech. 2018, 93, 87–103. [Google Scholar] [CrossRef]
- Zhou, W.; Hong, H.P.; Shang, J.Q. Probabilistic Design Method of Prefabricated Vertical Drains for Soil Improvement. J. Geotech. Geoenviron. Eng. 1999, 125, 659–664. [Google Scholar] [CrossRef]
- Krizek, R.J.; Corotis, R.B.; El-Moursi, H.H. Probabilistic Analysis of Predicted and Measured Settlements: Reply. Can. Geotech. J. 2011, 14, 276–277. [Google Scholar] [CrossRef]
- Chai, B.J.; Miura, N. Investigation of Factors Affecting Vertical Drain Behaviour. J. Geotech. Geoenviron. Eng. 1999, 125, 216–226. [Google Scholar] [CrossRef]
- Arulrajah, A.; Nikraz, H.; Bo, M.W. Factors Affecting Field Instrumentation Assessment of Marine Clay Treated with Prefabricated Vertical Drains. Geotext. Geomembr. 2004, 22, 415–437. [Google Scholar] [CrossRef]
- Bullinger-Weber, G.; Gobat, J.M. Identification of Facies Models in Alluvial Soil Formation: The Case of a Swiss Alpine Floodplain. Geomorphology 2006, 74, 181–195. [Google Scholar] [CrossRef]
- Kirsch, K.; Bell, A. Ground Improvement; CRC Press: Boca Raton, FL, USA, 2009. [Google Scholar]
- Chung, S.G.; Giao, P.H.; Nagaraj, T.S.; Kwag, J.M. Characterization of Estuarine Marine Clays for Coastal Reclamation in Pusan, Korea. Mar. Georesour. Geotechnol. 2002, 20, 237–254. [Google Scholar] [CrossRef]
- Han, J. Principles and Practices of Ground Improvement; John Wiley & Sons Inc.: Hoboken, NJ, USA, 2015. [Google Scholar]
- Chai, J.; Carter, J.P. Deformation Analysis in Soft Ground; Springer: Berlin, Germany, 2011. [Google Scholar]
- Indraratna, B.; Chu, J.; Rujikiatkamjorn, C. Ground Improvement Case Histories: Compaction, Grouting, and Geosynthetics; Elsevier Ltd.: Amsterdam, The Netherlands, 2015. [Google Scholar]
- Kelly, R.B.; Sloan, S.W.; Pineda, J.A.; Kouretzis, G.; Huang, J. Outcomes of the Newcastle Symposium for the Prediction of Embankment Behaviour on Soft Soil. Comput. Geotech. 2018, 93, 9–41. [Google Scholar] [CrossRef]
- Chai, J.-C.; Shen, S.-L.; Miura, N.; Bergado, D.T. Simple Method of Modelling PVD-Improved Subsoil. J. Geotech. Geoenviron. Eng. ASCE 2001, 127, 965–972. [Google Scholar] [CrossRef]
- Indraratna, B.; Redana, I.W. Numerical Modeling of Vertical Drains with Smear and Well Resistance Installed in Soft Clay. Can. Geotech. J. 2000, 37, 132–145. [Google Scholar] [CrossRef]
- Voottipruex, P.; Bergado, D.T.; Lam, L.G.; Hino, T. Back-Analyses of Flow Parameters of PVD Improved Soft Bangkok Clay with and without Vacuum Preloading from Settlement Data and Numerical Simulations. Geotext. Geomembr. 2014, 42, 457–467. [Google Scholar] [CrossRef]
- Yildiz, A.; Karstunen, M. Three-Dimensional Analyses of PVD-Improved Soft Soils. In Geotechnics of Soft Soils: Focus on Ground Improvement; CRC Press: Boca Raton, FL, USA, 2009; pp. 197–203. [Google Scholar]
- Yildiz, A. Numerical Analyses of Embankments on PVD Improved Soft Clays. Adv. Eng. Softw. 2009, 40, 1047–1055. [Google Scholar] [CrossRef]
- Indraratna, B.; Redana, I.W. Plane Strain Modeling of Smear Effects Associated with Vertical Drains. J. Geotech. Geoenviron. Eng. ASCE 1997, 123, 474–478. [Google Scholar] [CrossRef]
- Hird, C.C.; Pyrah, L.C.; Russell, D.; Cinicioglu, F. Lntroduct Ion Theory for Matching Behaviour in Axisymmetry and Plane Strain Results of Applying the Matching Procedure. Can. Geotech. J. 1995, 32, 795–807. [Google Scholar] [CrossRef]
- Chai, J.C.; Shen, J.S.L.; Liu, M.D.; Yuan, D.J. Predicting the Performance of Embankments on PVD-Improved Subsoils. Comput. Geotech. 2018, 93, 222–231. [Google Scholar] [CrossRef]
- Jostad, H.P.; Palmieri, F.; Andresen, L.; Boylan, N. Numerical Prediction and Back-Calculation of Time-Dependent Behaviour of Ballina Test Embankment. Comput. Geotech. 2018, 93, 123–132. [Google Scholar] [CrossRef]
- Zheng, D.; Huang, J.; Li, D.Q.; Kelly, R.; Sloan, S.W. Embankment Prediction Using Testing Data and Monitored Behaviour: A Bayesian Updating Approach. Comput. Geotech. 2018, 93, 150–162. [Google Scholar] [CrossRef]
- Chan, K.F.; Poon, B.M.; Perera, D. Prediction of Embankment Performance Using Numerical Analyses—Practitioner’s Approach. Comput. Geotech. 2018, 93, 163–177. [Google Scholar] [CrossRef]
- Rezania, M.; Nguyen, H.; Zanganeh, H.; Taiebat, M. Numerical Analysis of Ballina Test Embankment on a Soft Structured Clay Foundation. Comput. Geotech. 2018, 93, 61–74. [Google Scholar] [CrossRef]
- Lambe, T.W. Predictions in Soil Engineering. Geotechnique 1973, 23, 151–202. [Google Scholar] [CrossRef]
- Indraratna, B.; Rujikiatkamjorn, C.; Ewers, B.; Adams, M. Class A Prediction of the Behavior of Soft Estuarine Soil Foundation Stabilized by Short Vertical Drains beneath a Rail Track. J. Geotech. Geoenviron. Eng. 2010, 136, 686–696. [Google Scholar] [CrossRef]
- Hiep, H.; Chung, S.G. Back-Analysis of Geotechnical Parameters on PVD-Improved Ground in the Mekong Delta. Geotext. Geomembr. 2018, 46, 402–413. [Google Scholar] [CrossRef]
- Baecher, G.B.; Christian, J.T. Reliability and Statistics in Geotechnical Engineering; John Wiley & Sons Ltd.: Hoboken, NJ, USA, 2003. [Google Scholar]
- Buttling, S.; Cao, R.; Lau, W.; Naicker, D. Class A and Class C Numerical Predictions of the Deformation of an Embankment on Soft Ground. Comput. Geotech. 2018, 93, 191–203. [Google Scholar] [CrossRef]
- Muhammed, J.J.; Jayawickrama, P.W.; Teferra, A.; Özer, M.A. Settlement of a Railway Embankment on PVD Improved Karakore Alluvium Soft Soil. JESTECH Elsevier 2019, in press. [Google Scholar]
- University of Western Australia. Datamap. Available online: www.geocalcs.com/datamap (accessed on 3 January 2020).
- Doherty, J.P.; Gourvenec, S.; Gaone, F.M.; Pineda, J.A.; Kelly, R.; O’Loughlin, C.D.; Cassidy, M.J.; Sloan, S.W. A Novel Web Based Application for Storing, Managing and Sharing Geotechnical Data, Illustrated Using the National Soft Soil Field Testing Facility in Ballina, Australia. Comput. Geotech. 2018, 93, 3–8. [Google Scholar] [CrossRef]
- Liu, Z.; Choi, J.C.; Lacasse, S.; Nadim, F. Uncertainty Analyses of Time-Dependent Behaviour of Ballina Test Embankment. Comput. Geotech. 2018, 93, 133–149. [Google Scholar] [CrossRef]
- Paulo, J.; Ekwaro-Osire, S.; Cunha, A.; Dabetwar, S.; Nispel, A.; Alemayehu, F.M.; Endeshaw, H.B. Parametric Probabilistic Approach for Cumulative Fatigue Damage Using Double Linear Damage Rule Considering Limited Data. Int. J. Fatigue 2019, 127, 246–258. [Google Scholar]
- Cao, Z.; Wang, Y.; Li, D. Probabilistic Approaches for Geotechnical Site Characterization and Slope Stability Analysis; Springer: Berlin, Germany, 2017. [Google Scholar]
- Duncan, J.M. Factor of Safety and Reliability in Geotechnical Engineering. J. Geotech. Geoenviron. Eng. 2000, 126, 189–190. [Google Scholar] [CrossRef]
- Phoon, K.-K.; Ching, J. Risk and Reliability in Geotechnical Engineering; CRS Press: Boca Raton, FL, USA, 2015. [Google Scholar]
- Liu, B.; Jin, H.; Sun, L.; Sun, Z.; Niu, Q.; Zhang, C. Geochemical Characteristics of Holocene Aeolian Deposits and Their Environmental Significance in the Mu Us Desert, Northern China. Geol. J. 2016, 337, 325–337. [Google Scholar] [CrossRef]
- Wu, T.H.; Gale, S.M.; Zhou, S.Z.; Geiger, E.C. Reliability of Settlement Prediction-Case History. J. Geotech. Geoenviron. Eng. 2011, 137, 312–322. [Google Scholar] [CrossRef]
- Pineda, J.A.; Sloan, S.W.; Suwal, L.P.; Kelly, R.B.; Bates, L. Characterisation of Ballina Clay. Géotechnique 2016, 66, 556–577. [Google Scholar] [CrossRef]
- Lacasse, S.; Nadim, F.; Rahim, A.; Guttormsen, T.R. Statistical Description of Characteristic Soil Properties. In Proceedings of the Offshore Technology Conference—OTC 19117, Houston, TX, USA, 30 April–3 May 2007; pp. 1–8. [Google Scholar]
- Lim, G.T.; Pineda, J.A.; Boukpeti, N.; Carraro, J.A.H. Predicted and Measured Behaviour of an Embankment on PVD-Improved Ballina Clay. Comput. Geotech. Elsevier Ltd. 2018, 93, 204–221. [Google Scholar] [CrossRef]
- Kerns, G.J. Introduction to Probability and Statistics Using R. GNU Free Documentation License. ISBN: 978-0-557-24979-4. 2010. Available online: http://www.atmos.albany.edu/facstaff/timm/ATM315spring14/R/IPSUR.pdf (accessed on 3 January 2020).
- Gong, Y.; Chok, Y.H. Predicted and Measured Behaviour of a Test Embankment on Ballina Clay. Comput. Geotech. 2018, 93, 178–190. [Google Scholar] [CrossRef]
- PLAXIS bv. 2D Reference Manual 2018. Build 2018, 9462, 1–831. [Google Scholar]
© 2020 by the authors. Licensee MDPI, Basel, Switzerland. This article is an open access article distributed under the terms and conditions of the Creative Commons Attribution (CC BY) license (http://creativecommons.org/licenses/by/4.0/).