Abstract
The validation of initial data is an important process to reduce the risk of errors in calculations. The large amount of heterogeneous data in the area of hydrocarbon reservoirs development leads to a significant increasing in complexity and calculation time of data validation. Here, we consider the problem of validation and completion of the initial data for the task of hydrocarbon reservoirs development. A validation and completion method, based on the use of 3D visual models and searching of analogies, is proposed. The results of testing the proposed method on the data of reservoirs of the Tomsk region of the Russian Federation are shown. The results showed that the time of the procedure of validation and completion of the initial data was reduced by 22.2% for projects of reserve calculation and by 32.2% for projects of development forecast in comparison with standard manual validation procedure. During the validation, experts identified 18% and 13.5% more errors with the proposed method for projects of reserve calculation and development forecast, respectively, showing that the proposed method could be an effective tool for data validation and completion.
1. Introduction
The validation of initial data is an important process to reduce the risk of errors in calculations, that is a necessary step to be performed with calculated data. When it is required to provide a lot of complex calculation steps in the course of solving a specific practical task of assessment, planning, or management, then errors in the initial data provide more significant negative impact on the final result, and the process of their validation becomes more difficult.
There are general methodologies and approaches to data verification and validation [1], but not all areas of activity apply these approaches with full effectiveness because of the task complexity and the large amount of data, that leads to significant complications and an increasing in the time of data validation [2].
One such task is the development of hydrocarbon (HC) reservoirs [3], which have a complex hierarchical structure in terms of the relationship of administrative, infrastructural, and economic components of development. The composition of this system includes such elements as underground oil reservoirs, ground infrastructure (pipelines, power plants, living and working space, roads, etc.), as well as drilled wells (production, injection, and measurement).
The planning task in the management of reservoirs becomes critical, when it takes into account the volume of capital investments (the cost of drilling and developing of wells, conducting of research, and field work) and the operating costs of reservoirs developing, as well as the degree of uncertainty in plans implementation. The solution of this task is a long-term strategy for the functioning of the HC reservoirs.
The technology for HC reservoirs development includes many calculations and building of models based on initial data [4,5]. At the same time, the development planning process itself is quite long, and each subsequent step most often actively uses the information obtained at the previous stage. This explains the importance of the correctness of the initial data for development and their influence on the final result. Errors in the initial data accumulate during the transition to the next stages of modeling, and a small error can grow multiple times after several iterations. If the project of developing is approved according to incorrect initial data, this can lead to significant losses in material and time. Considering that the initial information is arrays of a large volume and various types of data, validation and completion of the initial data becomes one of the most priority ways of increasing the efficiency of the planning management process of reservoir development.
Validation and completion of initial data at the current level of development of analytical technologies requires the involvement of the cognitive abilities of experts in the process of HC reservoirs development. This leads to an increase in the influence of the human factor on the development planning process, and makes it more unpredictable as well as the process of reservoir functioning following it. This unpredictability leads to a decrease in efficiency, which is fully based on the approved forecasts and plans.
The study of important issues of increasing the efficiency of HC reservoirs development has been and is being done by many scientists [6,7,8,9].
An analysis of the studies on the subject of HC reservoirs development let us suggest that the tasks of current interest are tasks of reducing the planning time in HC reservoir management, increasing of adequacy of reservoir models and the effectiveness of decision-making by reducing the human factor in the development process.
The method of the initial data validation and completion, that can be applied to large amounts of data and aimed at increasing the speed of perception of this information by the end user (an expert), will improve the decision-making mechanism in the HC reservoirs development and reduce the planning time as well as the number of errors in the data.
A good solution for improving the perception of the information and identifying anomalies in the data is the construction of visual models and their analysis [10,11,12]. Visualization is focused on obtaining new information and knowledge as a result of identifying patterns, connections, or anomalies in visual data images. Visualization, or, in other word, visual research, is a process that combines the creation of a visual model of the initial data and its interpretation [13]. Examples of visual 2D models are graphs and charts, examples of visual 3D models are geological grids and surfaces [14]. A visual representation of higher-dimensional data is possible using special conventions or perception capabilities to interpret the generated images. For example, multidimensional visual models were used for the task of analysis of empirical data on the current state of the study of processes for producing nitrogen carbide by the electric arc method [10], task of visualization, and presentation of components of an undergraduate educational program [13] and others.
The potential advantages of visualization form the conditions for the use of visualization tools in solving urgent problems in many areas of human activity: medicine, technology, economics, law, etc. Controlled performance visualization tools are widely used as an applied tool for scientific research [15,16,17,18,19,20,21,22,23].
In this regard, it is proposed to improve the expert approach to data validation using the capabilities of automation, scientific visualization and construction of visual data models.
In the process of solving the task of data validation and completion the main advantage of visual analysis based on flexible 3D model is expert’s opportunity to see and control the entire array of available data. This approach (visual analysis of the flexible 3D model) allows the expert to change the criteria for finding a solution at any data processing stage. In comparison, statistical analysis (that could be defined as the traditional way of data analysis) provides a strict set of criteria, without the possibility of changing them at internal stages. Use of such 3D models will reduce the burden on experts, and increase the degree and speed of understanding of information through the use of spatial visual perception.
2. Modelling Procedure
Existing approaches to validate and complete of initial data can be divided in two directions: automated validation of compliance with formal requirements and restrictions [24] and manual expert analysis at various stages of interaction with data [25]. The second direction allows not only to validate the initial data, but also to determine how probable they look in the context of the task being solved. The predictability and accuracy of the result of manual validation is difficult to forecast, while the time and human resources spent on it grows exponentially with increasing dimensions and volume of the initial data.
Three key directions can be distinguished in the task of the initial data validation and completion:
- Check for boundary values. The initial data may contain errors made during digitization or input. If the data goes beyond the boundaries of possible values, their validation and adjustment is quite easy to automate. The automated approach requires explicitly specifying boundary conditions for the data. The construction of visual models taking into account such checks allows not only to eliminate errors in the data, but also to increase the general understanding of the correctness level of the initial data by the expert.
- Search for outliers. Outliers may not cross the boundaries of the permissible values of any parameter, but significantly distort in the same time the picture of the data array as a whole. It is almost impossible to validate such data in automatic mode, except in cases where the distribution law of this data in the array is approximately known. It is possible to quickly and with high reliability identify such anomalies in the case of an examination, and especially in the case of an examination based on visual models.
- Comparison with analogues. A part of the initial data required by the conditions for solving the task may be missed. In this case, the only acceptable solution is often search of analogues among known data, after which we can extrapolate these known data to the array under study. This allows us to synthesize new data that is suitable for formal validation criteria and relatively reliably reflects the nature of changes in known values, filling in the missing elements of the data array. Automated validation in this situation requires knowledge of many parameters, which in the case of visual analysis can be chosen by experts more or less intuitively.
The initial data may also contain hidden errors due to gaps in their structural and formal presentation, or due to the fundamental impossibility of their formal structured presentation.
In general, the proposed method of validation and completion can be described by the following algorithm:
- Formalization and preparation of data. At the initial stage, it is important to convert all the data used in the analysis into a form suitable for further processing. In this case, the reduction of all data to a strictly discrete form is not mandatory, but the general structure of the data array is important. Each logical data element must be in the correct address position and be extractable from the array by a specific request [26,27].
- Building of a visual model of the data array, that takes into account and including three key areas of validation and completion of data:
- Check for boundary values;
- Search for outliers;
- Comparison with analogues.
- Data redundancy check. Data can be duplicated for a number of parameters, replaced with repeated investigations or flaws in the planning of the research process and workflow. Redundancy can also include data that are linearly dependent on each other and do not affect further estimates and calculations, the so-called deadlock data branches. The selection of suitable data and redundancy elimination within the framework of the proposed algorithm are provided with the method of search of analogies [28].
- Logical validation (validation of suitability of data with the boundaries of permissible values, expected values distribution functions, etc.).
- Data conflicts resolving. Important data can be marked as incorrect or unreliable after identifying internal or external contradictions. These data should be excluded from further analysis, which leads either to a next transition to the data completeness check, or to the classification of the entire data array as unreliable. A method of search of analogies in the context of cross-validation is used for this step.
- Data completeness check. Some of the data may be missing due to data entry errors, insufficient research of the development object, changes in measurement procedures during the course of the project, and many other reasons. In the traditional validation methods, the incompleteness of the data is compensated only on the basis of the previous experience of the expert. Within the framework of the proposed algorithm, the method of search of analogies from previously investigated projects is used for this task.
- Arrays of adjusted data based on conducted validation and completion procedures forming. Formulation of the conclusion about the level of data sufficiency for reliable project of reservoir development on their basis and recommendations for the search of analogies among data of other reservoirs in the case of insufficient conclusion about available data.
The described algorithm of data validation and completion includes elements of the method of search of analogies at three different stages: the stage of data redundancy check, the stage of data completeness check and the stage of data conflicts elimination.
Assessment of the complexity of the validation and completion process can be carried out optionally at the data preparation stage. It checks such parameters as the volume and structure of the evaluated information (it effects on the automation capabilities); computational complexity (it depends on logical rules for compliance with which data will be checked); cohesion (interdependence) of data and rules of their validation.
The steps of the proposed algorithm of visual validation and completion of the initial data are shown in Figure 1.
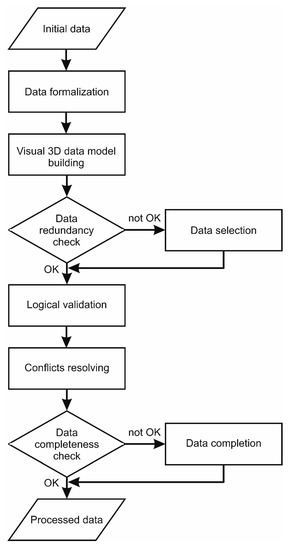
Figure 1.
The scheme of initial data validation and completion algorithm.
In the context of the task of HC reservoirs development, it is possible to specify the most complex step of the proposed algorithm, in particular, the method of search of analogies.
The method of search of analogies, which was presented earlier in the work [28], basically contains the idea of finding similar HC reservoirs that are selected in accordance with the following formula:
where k is a final grade characterizing the level of similarity of the compared objects, is the vector of covariance of compared parameter (e.g., the level of proximity to a given reservoir; the similarity in depth disposition; the similarity of the reservoir layers; the similarity of the HC properties); is the vector of weight coefficients of these parameters; n is a total number of the considered parameters depended on the task condition (it could vary significantly, since reservoirs contain tens and hundreds of heterogeneous parameters by which a comparison is possible to made). Usually, the number of parameters is limited due to the complexity of calculating the final grade (including setting weights and determining the covariance). In this work the total number of parameters is limited to 13.
The parameter covariance always lies in the range from 0 to 1, where c = 0 is the total independence of values of the compared parameter, c = 1 is the completely coinciding values of the parameter (or the identical vector of values, if the parameter is not a scalar quantity). The weight coefficient may be a dimensionless quantity, but in the case of its normalization from 0 to 1, the final similarity grade will also lie in this range, and by the proximity of this estimate to 0 or to 1 it will be possible to estimate the overall level of similarity of the compared objects. According to the studies [29], when a k value is more than 0.8, then the considered reservoirs can be marked as similar in terms of disposition. Then some parameters of the considered reservoir can be taken when its own researches are unavailable at an early stage of development.
During such an analysis, reservoir must be compared with each reservoir in the available set, and then the most suitable one should be selected with the maximum value of k coefficient. In this work the total number of compared HC reservoirs is limited to 14.
Within the framework of the proposed method, the selection of the closest analogue-reservoir is carried out using a visual data model, a conceptual scheme of which is presented in Figure 2. This method allows us to avoid the numerical calculation of weight coefficients and covariance of compared parameters replacing them by work with visual model.
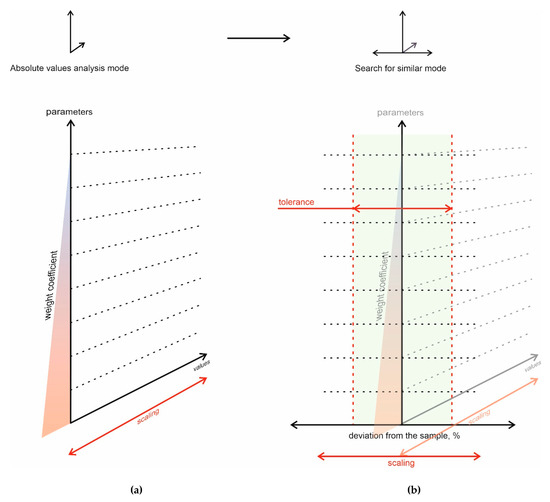
Figure 2.
Conceptual scheme of a visual data model: (a) 2D mode; (b) 3D mode
The parameters of candidate reservoirs in the visual model are arranged in accordance with their weight coefficients for better visual perception of importance of each parameter. In the 2D mode (Figure 2a), the model makes it possible to analyze an array of absolute values (by the X-axis), taking into account weight coefficients (by the Y-axis); the parameters are scaled for better visual perception. The third measurement of the model (Figure 2b) implements a mode for comparing the deviations of the parameters of candidate reservoirs from the chosen reservoir; the permissible deviation is limited to a confidence interval (marked as “tolerance” in figure). In this mode, the expert performs a visual assessment and search for the most suitable reservoir analog by the criterion of proximity of the parameter curve (from the expert’s point of view) to the central line (chosen reservoir).
An example of 3D model for a visual data analysis is presented in Figure 3. Parameter values are marked in the left side of the 2D model (Figure 3a), horizontal axes correspond to the selected parameters and are located in accordance with their weight coefficients. A 2D mode for comparing absolute values shows the missed connection between some data due to the fact that the sample contains values of the parameters of various reservoir layers (collector rocks containing HC). The 3D mode of search of analogies is shown in Figure 3b (the central axis is the chosen reservoir, the color curves are deviations of the candidate parameters from the chosen reservoir in one or another direction, the confidence interval is indicated by a parallelepiped). The curve of the parameters of the best analog reservoir, chosen by an expert as the closest solution to the studying reservoir for the entire set of parameters, can be indicated here (e.g., by line with a larger thickness).
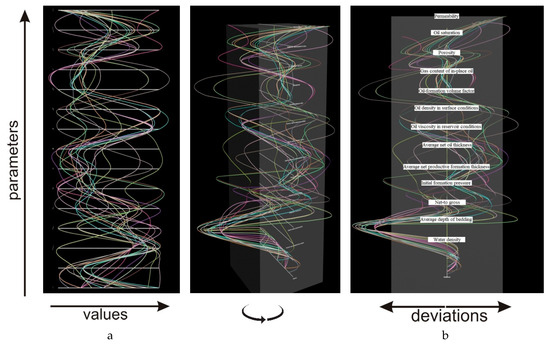
Figure 3.
Visual data model for the search of analogies task: (a) 2D comparison mode; (b) 3D search of analogies mode.
The presented approach combines in one 3D visual model:
- 2D analysis of the absolute values of the parameters;
- Analysis of deviations of parameters from the reference value;
- Ranking of parameters by weight coefficients;
- Use of confidence interval;
- Scaling of parameter values for a better user perception.
All of the above, as well as the interactivity of the 3D model (the ability to change the angle and scale of both the entire model and its individual parameters for estimating of local effects) provide an intuitive experience of large amounts of information to user and reduce the time of the visual model analysis and decisions making.
Using a complex 3D model for a visual data analysis of reservoirs makes it possible to quickly find a solution to the task of analogies search. This solution fills in the missing data and build the correct geological and hydrodynamic models of the reservoirs (in accordance with the current regulatory documents [30,31,32]), as well as performs predictive development modeling.
Such a model is the equivalent of an array of 2D models that the expert has to analyze with the standard (traditional) approach. This approach involves the use of table editors or specialized software (such as Schlumberger, Roxar, etc. as viewers for geophysics and inclinometry, data visualizers for development projects) to build charts, graphs, histograms of deviations, etc.
The numerical solution of the validation task is based on a set of rules [33,34]. An example of rules for the considered Jurassic reservoirs of Tomsk Region in Russian Federation (location and lithography example is presented in Figure 4) is given in Table 1. The restrictions in such rules depend on the conditions of the reservoir and the type of reservoir.
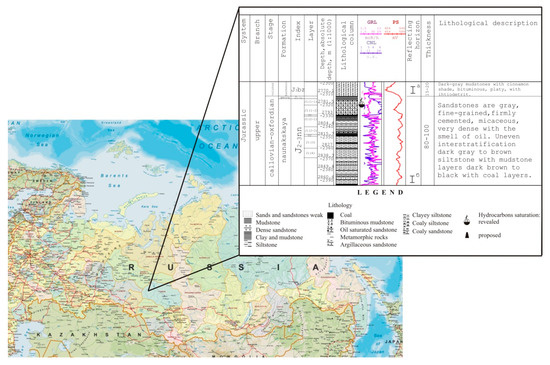
Figure 4.
Location of considered hydrocarbon (HC) reservoirs on a map of Russian Federation and lithography description of one of them.

Table 1.
Example of rules for initial data validation.
A sample of real data of HC reservoir development projects was used in test of the proposed method of the initial data validation and completion. The data includes 23 projects of reservoirs in the Tomsk Region of Russian Federation. 14 of data set projects relate to the reserve calculation and nine relate to the development forecast. Inclinometry (depth, angle, and azimuth) and well logging (porosity, reservoir, permeability, etc.) were verified for wells in reserve calculation projects. Data on the history of reservoir development in wells (oil and water production by months, pressure measurements) were estimated in development forecast modeling. A portion of the projects relate to the same reservoirs, but differ in initial data, which were updated at different time periods according to the results of additional investigations.
A group of 11 experts in the area of oil and gas reservoirs development projects took part in the testing. The competence of experts is confirmed by the experience of successful implementation of more than 50 projects of reserve calculation and development forecasts for a period of more than 10 years. Experts performed some of the stages associated with the validation of the initial data using the developed method. The proposed method was implemented in the form of a software visual model [28]. The results were compared with the available data on the implementation of approved projects for the same reservoirs.
Validation and completion by the proposed method on the basis of visual data models was carried out using data of similar objects. The assessment of the correctness of the initial data was calculated from a comparison of the data arrays with their analogues from the existing set.
Testing according to the criteria of redundancy, incompleteness and inconsistency was carried out on data of HC reservoirs without their own core investigations, which are necessary to predict development. Such investigations from one of the similar reservoirs can be used for chosen reservoir. It is necessary to find in the initial sample of candidates an analogous reservoir that is closest to the chosen one in key parameters. The initial sample included 18 candidate reservoirs. 13 key geological and physical characteristics—water density (t/m3); average depth of bedding (m); net-to gross (u.f.); initial formation pressure (MPa); average net productive formation thickness (m); average net oil thickness (m); oil viscosity in reservoir conditions (mPa·sec); oil density in surface conditions (t/m3); oil-formation volume factor (u.f.); gas content of in-place oil (m3/t); porosity (u.f.); oil saturation (u.f.); permeability (D) (Figure 5)—were identified as important for the reservoir from the entire data set by experts. They assigned weight coefficients and allowable deviations from the chosen reservoir for each of key characteristics.
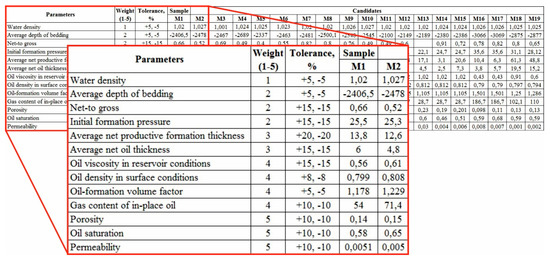
Figure 5.
Initial data sampling for testing the search of analogies method.
The method of search of analogies was estimated by the time it took to search for similar reservoirs, which can be used to make up for missing data that required for a project.
Comparison of the results was carried out on 14 reserve calculation projects. Development forecast projects were excluded from the test data set, as they do not contain new information on the geological and geophysical characteristics of the reservoirs.
Testing results were evaluated by two quantitative indicators: the runtime and the number of errors and conflicts found in the data.
We used both standard software tools (Excel, Schlumberger Petrel) and software that implements a 3D model of initial data (3D Max) to conduct tests of proposed method.
3. Results
3.1. Analogy Search Method
The measurement of the runtime was carried out without taking into account the time for preparation and processing of the initial data, since in this case it was the same for the entire set. Time of search of analogues were calculated with standard approach (with statistical and 2D visualization tools like Schlumberger Petrel), which is used in real development projects, and with proposed approach (3D models of initial data built in 3D Max) by 11 experts in semiautomatic mode. The results of the evaluation of the average runtime for the search procedure of analogues are presented in Table 2 and Figure 6.

Table 2.
Measurement results of search of analogues runtime by experts.
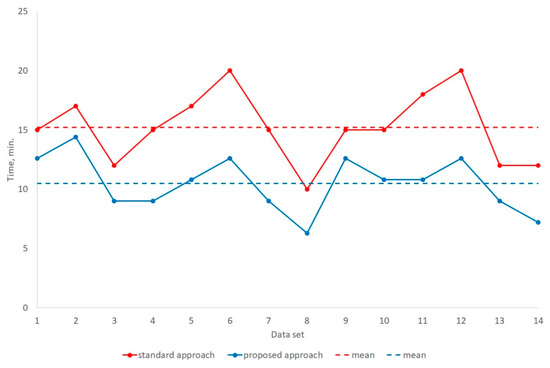
Figure 6.
Measurement results of search of analogues runtime by experts.
The use of search of analogues method allowed to reduce the execution time of this operation by 30.9% on average. An average impact of proposed approach in speed up of search of HC reservoir analogues by 11 experts is stable positive for all considered cases. The minimum increase in speed was 15.3% (for the data set No. 2), the maximum increase was 40% (for data sets No. 4, No. 7, No. 11, and No. 14).
These results make it possible to conclude that proposed approach is useful in considered task in comparison with standard approach that uses statistical evaluation and 2D visualization with charts and graphs.
3.2. Method of Initial Data Validation and Completion
The obtained measurements on the time of validation and completion of the initial data for test projects are presented in Table 3 and Figure 7. In these tests proposed approach is compared with standard approach the same way as analogy search method.

Table 3.
Measurement results of the runtime of the initial data validation by experts.
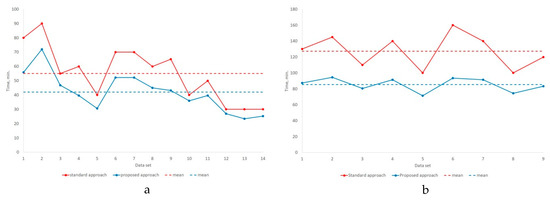
Figure 7.
Measurement results of the runtime of the initial data validation by experts in the task of: (a) reserve calculation; (b) development forecast
From Table 3 we can conclude that the application of the method of the initial data validation led to a reduction in the validation time by 22.2% in reserve calculation, and by 32.2% in the development forecast on average.
An average impact of proposed approach in speed up of validation of HC reservoir initial data by 11 experts is stable positive for all considered cases. For reserve calculation projects the minimum increase in speed was 10% (for data sets No. 10 and No. 12), the maximum increase was 34% (for the data set No. 4). For development forecast projects the minimum increase in speed was 25.6% (for the data set No. 8), the maximum increase was 41.6% (for the data set No. 6).
In Figure 7 it should be noticed, that the projects with minimal effect on validation speed have the smallest time of validation with standard approach too. Probably these projects had more structured data set then others that could explain such an effect. In a whole proposed approach makes times of project calculation more homogeneous and, consequently, more predictable.
The quality of validation was also evaluated with the average number of errors by 11 experts. The results on the number of errors and conflicts found by experts in the initial data are presented in Table 4 and Figure 8.

Table 4.
The number of errors identified by experts during the initial data validation.
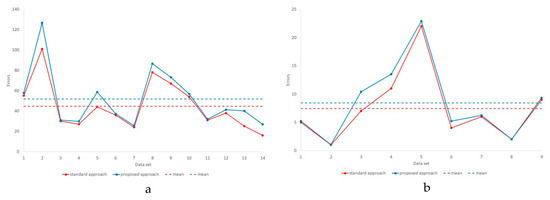
Figure 8.
The number of errors identified by experts in the initial data validation in the task of: (a) reserve calculation; (b) development forecast in comparison with approved projects
As it can be seen from the results presented in Table 4, the application of the method of the initial data validation allowed us to identify by 18% more errors in reserve calculation and 13.5% more in development forecast on average compared to standard statistic methods. Moreover, the negative effect of the application of the method did not be revealed in any of the tests.
An average impact of proposed approach in number of detected errors in HC reservoir initial data by 11 experts is mostly positive for all considered cases. For reserve calculation projects the minimum increase in number of errors was 3% (for data sets No. 3, No. 6, and No. 11), the maximum increase was 67.4% (for the data set No. 14). For development forecast projects the minimum increase in number of errors was 0% (for the data set No. 8), the maximum increase was 48.6% (for the data set No. 3).
The number of errors found (two errors for the entire data set) was the same with the use of the method and without it in only one data set (No. 8, development forecast). That supposedly can indicate the high quality of this initial data set.
In Figure 8 there are no any significant differences between proposed approach and standard approach for data validation, but the average number of detected errors slightly higher in proposed approach with using visual analysis of 3D model of initial data set.
4. Conclusions
The method of validation and completion of data, proposed as part of this work, implemented as a software system, and including the method of search of analogies, was evaluated by the criterion of runtime and the number of identified discrepancies in the data.
The application of the method of search of analogies led to a reduction in the time required to complete this operation in reserve calculation by 30.9% on average according to the results of testing and comparison on 14 development projects in the Tomsk Region in Russian Federation.
The application of the method of the initial data validation and completion reduced the processing time of the initial data of reserve calculation by 22.2% on average and by 32.2% with the initial data of development forecast.
The proposed method allowed us to identify 18% more errors in the initial data of reserve calculation and 13.5% more errors in the initial data of development forecast on average compared to standard manual statistic methods.
The positive effect of the application of the developed method of the initial data validation and completion in the area of HC reservoirs development allows us to conclude that the software tool for visual analysis and obtaining new information created as part of this research has advantages in data validation tasks when automation of the data array analysis process is difficult due to heterogeneity, multiscale, and large amounts of data. In the context of the task of HC reservoirs development, the proposed method makes it possible to save a lot of time and human resources in the process of initial data expertise and makes results of data analysis more perceptible for experts.
Using the developed visual model makes it possible to quickly detect objects close to each other in the studied data from the point of view of the observer and principles recognized by him. This approach, involving visual modeling, evaluates, analyzes, and compares large volumes of heterogeneous data faster and more efficiently than standard (traditional) statistical and 2D visual methods of analysis.
Author Contributions
Validation, S.N.; formal analysis, A.Z.; investigation, D.Z.; resources, S.N.; data curation, D.Z.; writing and original draft preparation, S.N.; writing, review and editing, Y.R.; visualization, D.Z.; supervision, K.Z.; project administration, K.Z. All authors have read and agreed to the published version of the manuscript.
Funding
This research was funded by “The Tomsk State University competitiveness improvement programme”, grant number No. 8.2.17.2019. The APC was funded by “The Tomsk State University competitiveness improvement programme”.
Conflicts of Interest
The authors declare no conflict of interest. The funders had no role in the design of the study; in the collection, analyses, or interpretation of data; in the writing of the manuscript, or in the decision to publish the results.
References
- Zio, M.D.; Fursova, N.; Gelsema, T.; Gießing, S.; Guarnera, U.; Petrauskienė, J.; Quensel-Von Kalben, L.; Scanu, M.; Ten Bosch, K.O.; Van Der Loo, M.; et al. Methodology for Data Validation 1.0 Essnet Validat Foundation. 2017. Available online: https://pdfs.semanticscholar.org/3405/a059ed0da789aa1002d38ab538f118391bf6.pdf (accessed on 22 January 2020).
- Gao, J.; Xie, C.; Tao, C. Big Data Validation and Quality Assurance—Issuses, Challenges, and Needs. In Proceedings of the 2016 IEEE Symposium on Service-Oriented System Engineering, SOSE 2016, Oxford, UK, 29 March–2 April 2016. [Google Scholar]
- Turchaninov, V.Y.; Kosenkov, S.O.; Samovarov, O.I.; Tchij, O.P.; Korovin, I.S.; Schaefer, G. High-Performance Cloud Computing for Managing the Life Cycle of Oil and Gas Fields. In Advances in Intelligent Systems and Computing; Springer Singapore: Singapore, 2019; Volume 752, pp. 1093–1098. [Google Scholar]
- Ding, G.; Xue, Y.; Cao, R.; Zhang, X. Fine 3-D Geology Modeling-Based Study of Remaining Oil Distribution in Linpan Oilfield. In Springer Series in Geomechanics and Geoengineering; Springer Singapore: Singapore, 2019; pp. 201–211. [Google Scholar]
- Liu, Y.; Zhang, B.; Dong, Y.; Qu, Z.; Hou, J. The Determination of Variogram in the Presence of Horizontal Wells—An Application to a Conglomerate Reservoir Modeling, East China. J. Pet. Sci. Eng. 2019, 173, 512–524. [Google Scholar] [CrossRef]
- Pakyuz-Charrier, E.; Giraud, J.; Ogarko, V.; Lindsay, M.; Jessell, M. Drillhole Uncertainty Propagation for Three-Dimensional Geological Modeling Using Monte Carlo. Tectonophysics 2018, 747, 16–39. [Google Scholar] [CrossRef]
- Yang, Y.; Zhang, M.; Bie, A.; Cui, Z.; Xia, Z. An Integrated Approach to Uncertainty Assessment for Coalbed Methane Model. In Springer Series in Geomechanics and Geoengineering; Springer Singapore: Singapore, 2019; pp. 1560–1567. [Google Scholar]
- Mollaei, A.; Lake, L.W.; Delshad, M. Application and Variance Based Sensitivity Analysis of Surfactant-Polymer Flooding Using Modified Chemical Flood Predictive Model. J. Pet. Sci. Eng. 2011, 79, 25–36. [Google Scholar] [CrossRef]
- Mollaei, A.; Delshad, M. Introducing a Novel Model and Tool for Design and Performance Forecasting of Waterflood Projects. Fuel 2019, 237, 298–307. [Google Scholar] [CrossRef]
- Zakharova, A.A.; Vekhter, E.V.; Shklyar, A.V.; Pak, A.J. Visual Modeling in an Analysis of Multidimensional Data. J. Phys. Conf. Ser. 2018, 944, 012127. [Google Scholar] [CrossRef]
- Zakharova, A.A.; Vekhter, E.V.; Shklyar, A.V.; Krysko, A.V.; Saltykova, O.A. Quantitative Assessment of Cognitive Interpretability of Visualization. Sci. Vis. 2018, 10, 145–153. [Google Scholar] [CrossRef]
- Zakharova, A.A.; Podvesovskii, A.G.; Shklyar, A.V. Visual and Cognitive Interpretation of Heterogeneous Data. Int. Arch. Photogramm., Remote. Sens. Spat. Inf. Sci. 2019. Available online: https://www.int-arch-photogramm-remote-sens-spatial-inf-sci.net/XLII-2-W12/243/2019/ (accessed on 22 January 2020).
- Zakharova, A.A.; Krysko, A.; Vekhter, E.; Shklyar, A. Meta-Design of Processes Based on Visualization Tools. Communications in Computer and Information Science. 2019. Available online: https://link.springer.com/chapter/10.1007%2F978-3-030-29743-5_19 (accessed on 22 January 2020).
- Huang, R.; Zan, C.; Long, W.; Cheng, H.; Li, W.; Wang, G.; Zhang, B. {OpenGL} Based A 3D Visual Technology of Digital Core. J. Phys. Conf. Ser. 2019, 1302, 22086. [Google Scholar] [CrossRef]
- Ko, S.; Cho, I.; Afzal, S.; Yau, C.; Chae, J.; Malik, A.; Beck, K.; Jang, Y.; Ribarsky, W.; Ebert, D.S. A Survey on Visual Analysis Approaches for Financial Data. Comput. Graph. Comput. Graph. Forum 2016, 35, 599–617. [Google Scholar] [CrossRef]
- Javed, W.; Elmqvist, N. ExPlates: Spatializing Interactive Analysis to Scaffold Visual Exploration. Comput. Graph. Forum 2013, 32, 441–450. [Google Scholar] [CrossRef]
- Horak, T.; Mathisen, A.; Klokmose, C.N.; Dachselt, R.; Elmqvist, N. Vistribute: Distributing Interactive Visualizations in Dynamic Multi-Device Setups. Proceedings of the Conference on Human Factors in Computing Systems. 2019. Available online: https://dl.acm.org/doi/10.1145/3290605.3300846 (accessed on 22 January 2020).
- Green, T.M.; Ribarsky, W.; Fisher, B. Building and Applying a Human Cognition Model for Visual Analytics. Inf. Vis. 2009, 8, 1–13. [Google Scholar] [CrossRef]
- Endert, A.; Ribarsky, W.; Turkay, C.; Wong, B.L.W.; Nabney, I.; Blanco, I.D.; Rossi, F. The State of the Art in Integrating Machine Learning into Visual Analytics. Comput. Graph. Forum 2017, 36, 458–486. [Google Scholar] [CrossRef]
- Bederson, B.B.; Shneiderman, B.; Wattenberg, M. Ordered and Quantum Treemaps: Making Effective Use of 2D Space to Display Hierarchies. AcM Trans. Graph. (TOG) 2002, 21, 833–854. [Google Scholar] [CrossRef]
- Badam, S.K.; Mathisen, A.; Radle, R.; Klokmose, C.N.; Elmqvist, N. Vistrates: A Component Model for Ubiquitous Analytics. IEEE Trans. IEEE Trans. Vis. Comput. Graph. 2018, 25, 586–596. [Google Scholar] [CrossRef] [PubMed]
- Aris, A.; Shneiderman, B.; Qazvinian, V.; Radev, D. Visual Overviews for Discovering Key Papers and Influences across Research Fronts. J. Am. Soc. Inf. Sci. Technol. 2009, 60, 2219–2228. [Google Scholar] [CrossRef]
- Yang, L.; Hyde, D.; Grujic, O.; Scheidt, C.; Caers, J. Assessing and Visualizing Uncertainty of 3D Geological Surfaces Using Level Sets with Stochastic Motion. Comput. Geosci. 2019, 122, 54–67. [Google Scholar] [CrossRef]
- Wedge, D.; Lewan, A.; Paine, M.; Holden, E.J.; Green, T. A Data Mining Approach to Validating Drill Hole Logging Data in Pilbara Iron Ore Exploration. Econ. Geol. 2018, 113, 961–972. [Google Scholar] [CrossRef]
- Maxwell, J.A.; Reybold, L.E. Qualitative Research. International Encyclopedia of the Social & Behavioral Sciences: Second Edition. 2015. Available online: https://www.sciencedirect.com/science/article/pii/B9780080970868105586?via%3Dihub (accessed on 22 January 2020).
- Zakharova, A.A.; Nebaba, S.G.; Zavyalov, D.A. Algorithms and Software Increasing the Efficiency of Processing Multidimensional Heterogeneous Data. Program. Comput. Softw. 2019, 45, 196–201. [Google Scholar] [CrossRef]
- Zakharova, A.A.; Nebaba, S.G.; Zavyalov, D.A. The Algorithm for the Classification of Methods for Processing Multidimensional Heterogeneous Data in Application to Designing of Oil Fields Development. Communications in Computer and Information Science. 2019. Available online: https://link.springer.com/chapter/10.1007%2F978-3-030-29743-5_13 (accessed on 22 January 2020).
- Zakharova, A.A.; Vekhter, E.V.; Shklyar, A.V.; Zavyalov, D.A. Visual Detection of Internal Patterns in the Empirical Data. In Proceedings of the Communications in Computer and Information Science, Volgograd, Russia, 12–14 September 2017. [Google Scholar]
- Zakharova, A.A. Modeli, algoritmy i programmy, razvivajushhie tehnologiju 3D-modelirovanija neftegazovyh mestorozhdenij. Ph.D. Thesis, Tomsk Polytechnic University, Tomsk, Russia, January 2009. [Google Scholar]
- Minprirody Rossii. Metodicheskie rekomendacii po podgotovke tehnicheskih proektov razrabotki mestorozhdenij uglevodorodnogo syr’ja. 2016. Available online: http://www.gkz-rf.ru/sites/default/files/docs/metodicheskie_rekomendacii_po_pravilam_prektirovaniya_uvs.pdf (accessed on 6 December 2019).
- Minprirody Rossii. Metodicheskie rekomendacii po primeneniju klassifikacii zapasov i resursov nefti i gorjuchih gazov. Available online: http://www.gkz-rf.ru/sites/default/files/docs/metodicheskie_rekomendacii_po_primeneniyu_nkz_utverzhdennye.pdf (accessed on 22 January 2020).
- Russia: Oil & Gas Regulation 2019. Available online: https://iclg.com/practice-areas/oil-and-gas-laws-and-regulations/russia (accessed on 6 December 2019).
- Skorobogatov, V.A. Research and Development of the Hydrocarbons Potential of the Soils of the Western Siberian Sedimentary Megabasin: Results and Perspectives. Vesti Gazov. Nauk. Mosc.: Gazprom VNIIGAZ LLC 2014, 3, 8–26. [Google Scholar]
- Mahdavi, E.; Suleymani, M.; Rahmanian, N. Oil and Gas Properties and Correlations. Fluid Phase Behavior for Conventional and Unconventional Oil and Gas Reservoirs. 2017. Available online: https://www.researchgate.net/publication/311776432_Oil_and_Gas_Properties_and_Correlations (accessed on 22 January 2020).
© 2020 by the authors. Licensee MDPI, Basel, Switzerland. This article is an open access article distributed under the terms and conditions of the Creative Commons Attribution (CC BY) license (http://creativecommons.org/licenses/by/4.0/).