1. Introduction
The problem of climatic fluctuations and their consequences has become a priority during last decades. The Arctic is currently experiencing the largest increase in air temperatures (2 °C or more over the last 50 years) [
1]. The Arctic permafrost stores large resources of greenhouse gases that directly affect the global climate upon release [
2,
3]. An increase in air temperature leads to permafrost degradation and release of additional amounts of labile carbon in the form of greenhouse gases, such as carbon dioxide (CO
2) and methane (CH
4) [
4,
5]. Methane is the most active greenhouse gas, and over 100 years it contributes 28 times more to the greenhouse effect than carbon dioxide [
1]. The fraction of the CH
4 that enters the atmosphere depends on three factors: the production rate, the rate of emission, and the rate of consumption along this transport pathway [
6]. Methane is formed in saturated active layer under anoxic conditions, which are typical of the Arctic tundra, in the presence of a sufficient amount of organic carbon in available forms. In saline sediments, CH
4 can be produced even at subzero temperatures [
7]. An increase in air temperature caused by the continuing climate warming leads to an increase in the temperature of permafrost and depth of seasonal thawing. Melting of ground ice, and especially massive-ice bodies, results in thaw subsidence and formation of water-filled depressions. Thus, an increase in the active layer thickness and thawing of the upper permafrost can lead to an increase in wetness of the terrain and activation of thermokarst, which causes a general change in the landscape structure of the area. Under these conditions, the emission of CH
4 from the surface increases, and the carbon balance can change dramatically.
Methane forms as a result of complex biogeochemical reactions, or by anaerobic methane-forming microorganisms (methanogens). Anaerobic methanogenesis occurs in tundra soils, bogs, lacustrine sediments, and is accompanied by CH
4 emission from the surface. During the fall freezing of the active layer, CH
4 is concentrated in its lower part. Observations in northeastern Siberia [
8] showed that biogenic CH
4 tends to accumulate near the base of the active layer. In some cases, during the freezing of the active layer CH
4 can be squeezed into the upper permafrost for a few meters, accumulating in lithological pockets [
9].
Arctic ecosystems, including the most common wetland landscapes, emit from 8 to 29 Tg (CH
4) * yr
−1, according to different estimations [
10,
11], which corresponds to approximately 10% of global CH
4 emissions from all natural wetlands [
12].
Observations of CH
4 emissions in the Arctic and Subarctic have shown that emission begins in spring when the daytime air temperature exceeds zero. It reaches a maximum in late July—early August, and then decreases to zero in fall with a reverse transition of daytime temperature from positive to negative values [
13,
14].
Field studies of the methane content in the upper permafrost in various landscape conditions were performed in the northwestern part of Yamal [
15]. The CH
4 content in the upper permafrost varied from 0 to 22.4 mg (CH
4)/kg. In August 1995, measurements of methane fluxes from the surface of natural landscapes were performed. On dry surfaces, they were minimal, while in thermokarst depressions and water tracks the CH
4 flux ranged from 8.5 to 52.7 mg (CH
4) * m
−2 * h
−1. The maximum CH
4 emission was recorded in the middle of the day from 11 to 15 h, and after 18 h the emission decreased rapidly. In conclusion, the authors of this study stated that in situations when the active layer thickness increases as a result of climate warming or human impact, CH
4 flux, which is released as a result of thawing of the upper permafrost, is added to the total flux.
Year-round monitoring of CH
4 emissions performed in northeastern Siberia recorded CH
4 emissions into the atmosphere that occurred in late fall (November) before complete freezing of the active layer [
3]. The highest fall emissions in the Arctic occur from non-inundated upland tundra areas [
16].
Changes in the landscape structure and CH
4 emissions currently occur almost everywhere in the Arctic [
17,
18,
19]. According to current forecasts, climate warming in the Arctic will continue [
1], and an increase in the duration of the growing season, soil temperature, and the active layer thickness are expected, as well as thawing or complete degradation of permafrost in the forest-tundra and northern taiga subzones [
20] and changes in soil hydrology. These changes significantly affect the structure of tundra ecosystems and methane emission.
Practically no year-round observations of CH4 emissions have been performed in the continuous permafrost zone of the western sector of the Russian Arctic. The data on the CH4 content in the active layer, which is the main source of methane emissions into the atmosphere, are also insufficient.
The goal of this study is to evaluate the methane content in the active layer and upper permafrost and to estimate the peak values (values that are close to maximum values per year) of CH4 flux into the atmosphere in the dominant landscapes of typical tundra. These studies are necessary to understand the response of permafrost landscapes to climate change.
2. Study Area
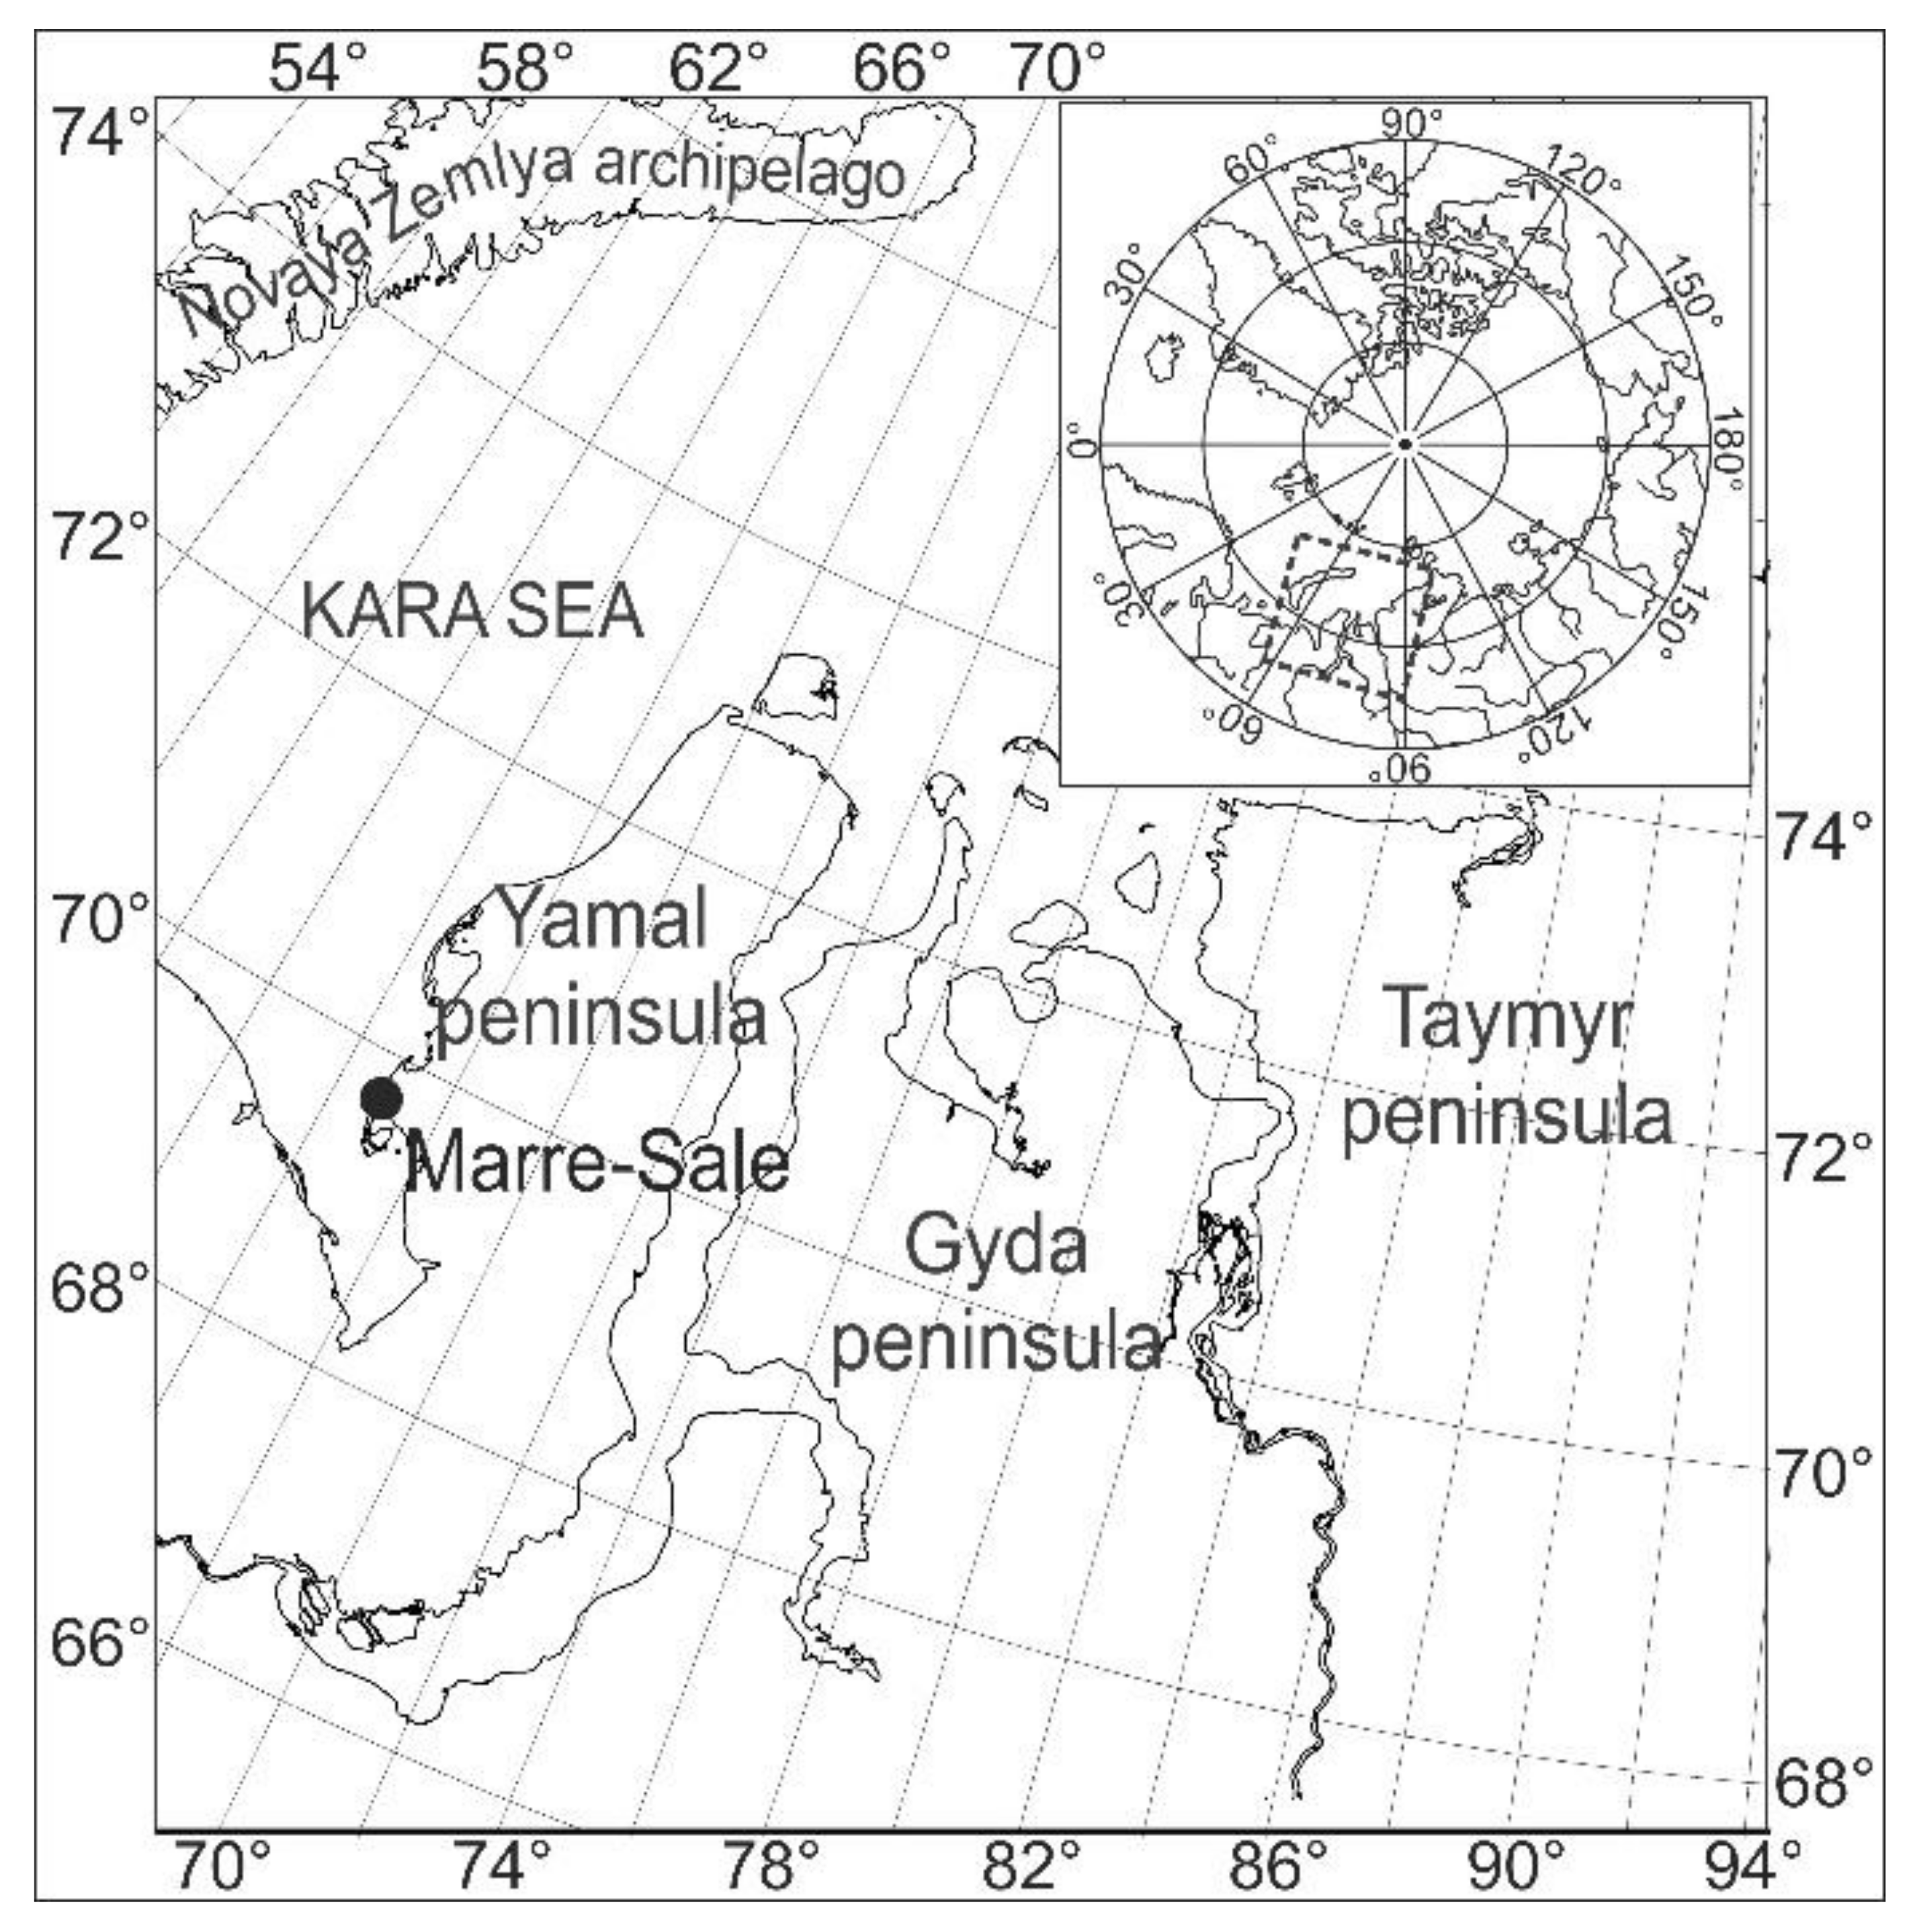
The study has been performed in the area of the Marre-Sale permafrost monitoring station located in the zone of typical tundra on the western coast of the Yamal Peninsula (
Figure 1). In terms of geomorphology, the study area belongs mainly to a rugged surface of the third marine terrace (20–24 m average elevation above sea level). At the northern part of the study area, the third marine terrace is bordered by the floodplain of the Marre-Yakha River with a height of 0.5 to 3 m.
In terms of geology, the study area is represented by two strata of Late Quaternary deposits: the upper stratum is composed by continental deposits, which underlain by marine deposits. From the surface to a depth of about 6–8 m, a stratum of lacustrine-alluvial sediments represented by sands and sandy loams was distinguished; the radiocarbon age of sediments varied from 12.4 to 43.1 ky BP [
21]. Continental sands and sandy loams contain organic detritus; the average content of organic carbon (OC) is approximately 0.3–0.4%. These deposits are underlain by Late Pleistocene marine clays and loams with layers of sands. There are no visible fragments of organic matter in marine sediments, but the average OC content varies from 0.8% to 1%.
The study area belongs to the continuous permafrost zone. Cryostratigraphy of Quaternary deposits of the Marre-Sale area have been described by Kanevskiy et al. [
22], Streletskaya et al. [
23], and Slagoda et al. [
24,
25]. Continental deposits are solid frozen and contain ice inclusions, lenses, and layers, as well as relatively small ice wedges in the upper part of the section. Saline clayey marine deposits contain lenses of segregated ice, but soils themselves are in a plastic state or semi-frozen, although they have a negative temperature. Tabular massive-ice bodies have been observed in the coastal bluff [
23,
24,
25]. The mean annual ground temperature at a depth of zero annual amplitudes varies from −2.5 to −6.0 °C, depending on landscapes. The depth of seasonal thawing varies from 0.4 to 2.2 m, depending on the type of landscapes, soil texture, and thickness of organic layer.
Marre-Sale permafrost monitoring station was established in 1978 near the polar station of the same name. To study the geological structure, composition of sediments, ice content, and cryostratigraphy, 46 boreholes were drilled in 1978–1986. Nine monitoring plots 10 × 10 m were established within all dominant landscapes. In the center of each plot, boreholes were drilled to a depth of 10–12 m, and monitoring of the thermal regime of permafrost has been performed. At each plot, the vegetation species composition has been studied. The thaw depth has been measured annually at the end of the warm season, and hydrological regime of the active layer has been studied. All monitoring plots are located at sites with undisturbed natural conditions.
3. Materials and Methods
The permafrost monitoring station is located in the vicinity of the Marre-Sale weather station, thus the data on weather conditions during field observations were obtained directly from the weather station. The daily climatic characteristics were obtained from the station archives and from the open database of the All-Russian Research Institute of Hydrometeorological Information—the World Data Center (
http://www.meteo.ru/data).
The landscape structure of typical tundra in the Marre-Sale area was studied based on (1) decoding aerial photographs of a scale of 1:2000 (1988); (2) decoding of Landsat 8 and SPOT 6 and 7 satellite images with resolutions of 30 m and 1.5 m per pixel, respectively; (3) studying topographic plans of terrain at a scale of 1:5000; and (4) ground-based observations. Landscapes of the geosystem rank were selected as the main object of mapping. Landscapes correspond to terrain mesoforms. Each landscape is characterized by specific morphology, composition of sediments, moisture regime, type of tundra soils, vegetation, thermal regime of permafrost, and depth of seasonal thawing. The preliminary landscape mapping was supplemented by field studies of landscape features, including composition of sediments, hydrological regime of soils, and vegetation cover. Based on these studies, a GIS-oriented landscape map was compiled.
Monitoring of the thermal regime of permafrost in all dominant landscapes has been performed since 1978 in 10 to 12 m-deep boreholes. This depth in the Marre-Sale area approximately corresponds to a depth of the layer of zero annual amplitudes. Initially, measurements were taken once a year at the end of the summer season, but since 2006, some of the boreholes have been equipped with loggers for continuous temperature measurement. Four-channel loggers HOBO U12-008 (manufactured by ONSET, USA) were installed to measure ground temperatures. In accordance with the GTN-P protocol [
26], the mandatory depths of sensor installation are 2, 3, 5, and 10 or 12 m. In some boreholes, two 4-channel loggers were installed, and in these cases soil temperatures have been measured at depths 0.05, 2, 3, 4, 5, 6, 8, 10 or 12 m. Measurements have been taken every 6 h. HOBO U12 loggers provide soil temperature measurement accuracy of ±0.1 °C. To measure soil temperature in the active layer, 2-channel loggers HOBO Pro v2 (manufactured by ONSET, USA) with measurement accuracy of ±0.21 °C have been used. The standard installation depths of the sensors for such measurements are not defined, so we selected measurement depths of 0.0, 0.5, 1.0, 1.5, and 2.0 m.
Measurements of the active layer thickness have been performed at the end of the warm season during the period of maximum thawing. A metal permafrost probe with a cross-section of 1.4 cm has been used. The measurement accuracy is ±1 cm. Within the measurement sites on the main dominant landscapes, measurements are performed with 20-fold repetition. In landscapes where the thickness of the active layer exceeds 2 m, manual drilling has been used. To assess the regional interannual fluctuations in the active layer thickness, a special plot was established in 1995 as a part of the framework of the International CALM (Circumpolar Active Layer Monitoring) program. The CALM plot is a square with a side of 1000 × 1000 m, divided into a grid with a side of 100 m. The measurements have been taken at the 121 grid points with 5 repetitions. The regional value of the active layer thickness is taken as the average of measurements performed at all grid points [
27].
Every year in each landscape, samples have been taken from the unfrozen active layer and upper permafrost to determine gravimetric moisture content.
Since 2012, we started measurements of gas composition and concentration (mainly CH
4) in the Marre-Sale area in sediments of various origins and ages. The sampling and analysis technique included collecting frozen or thawed cylindrical samples with a volume of approximately 50 cm
3. After weighing, the sample was placed into a 150 mL “Janet” plastic syringe (manufactured in Russia). The sample was degassed following the “HeadSpace” method [
28]. A highly concentrated saline solution with a volume of approximately 50 cm
3 was pumped into the syringe, so a space of approximately 50 cm
3 remained free (filled with air). After complete thawing, a gas sample was taken from this free space. After that, the gas sample was pumped from the syringe into a 10-mL glass sealed vial, initially filled with highly concentrated saline solution, which prevented transition from the gas phase into solution. To prevent the leakage from the vials, part of the solution (about 1–2 mL) remained in the vial while pumping, which provided additional protection against leakage of the gas sample through the rubber plug. In this form, the samples were transported to the laboratory of the Federal State Budgetary Institution “VNIIOkeangeologiya” (St. Petersburg). In the laboratory, the composition of gases was determined by gas chromatography on a SHIMADZU GC-2014 apparatus (Japan) equipped with a flame ionization detector. The methane concentration from the free space of the syringe was adjusted for the volume, which had been calculated based on the mass of each sample and its density.
In 2018 and 2019, the authors were measuring CH
4 fluxes into the atmosphere using isolated chambers made of organic glass; the size of the chambers was 25 × 25 × 25 cm. Depending on the specific conditions, the chamber was buried at 3 to 5 cm in the soil, which was taken into account when the volume of the chamber was calculated. Fans equipped with an automatic on-off system (regulated by timer) were installed inside the chambers to ensure constant air mixing. The fan was switched on for 15 s every 10 min. To control the temperature, 2-channel HOBO Pro v2 loggers were installed directly near the chambers. One sensor was installed on the surface, the second one was buried into the soil at a depth of 10 cm. The temperature was recorded every 10 min. The first sampling from the chamber was performed immediately at the beginning of the experiment and then after one hour for 4 h during the daytime without removing the chamber, i.e., we had 5 samples from each site. A gas sample was collected from the center of the chamber using a 150 mL “Janet” plastic syringe. Immediately after, gas in a volume of about 7–8 mL was pumped into a 10-mL glass sealed vial with a rubber stopper, which was previously completely filled with saline solution. The rest of the solution in the vial serves as an additional hermetic seal. In this form, the samples were delivered to the laboratory of the “VNIIOkeangeologiya”. We do not take into account the possibility of changing the diffusion gradient due to experimental conditions and also the influence of transportation because it was not possible to determine these limitations. Determination of the gas content was performed using the same gas chromatography method as for soil samples. CH
4 fluxes were calculated taking into account changes in air temperature and pressure during the experiment [
29]. CH
4 fluxes are presented in mg (CH
4) * m
−2 * h
−1.
The organic carbon content was measured by the catalytic oxidation method using the Shimadzu TOC-VCSH total and organic carbon analyzer by the “VNIIOkeangeologiya” laboratory.
4. Results and Discussion
4.1. Climate
Western Yamal is located within the subarctic zone of the moderately cold and humid Atlantic area of the Western Arctic climatic region [
30]. The climate of the study area is characterized by a long period with sub-zero air temperatures. According to the Marre-Sale meteorological station, the standard mean annual air temperature (averaged over 1961–1990) was −8.5 °C. The coldest month is February with an average monthly temperature of −22.7 °C, and the warmest is July with 7.1 °C (1961–1990). The absolute minimum of the daily temperature was −45.9 °C (27 December 1986), and the absolute maximum was 23.6 °C (14 July 1990).
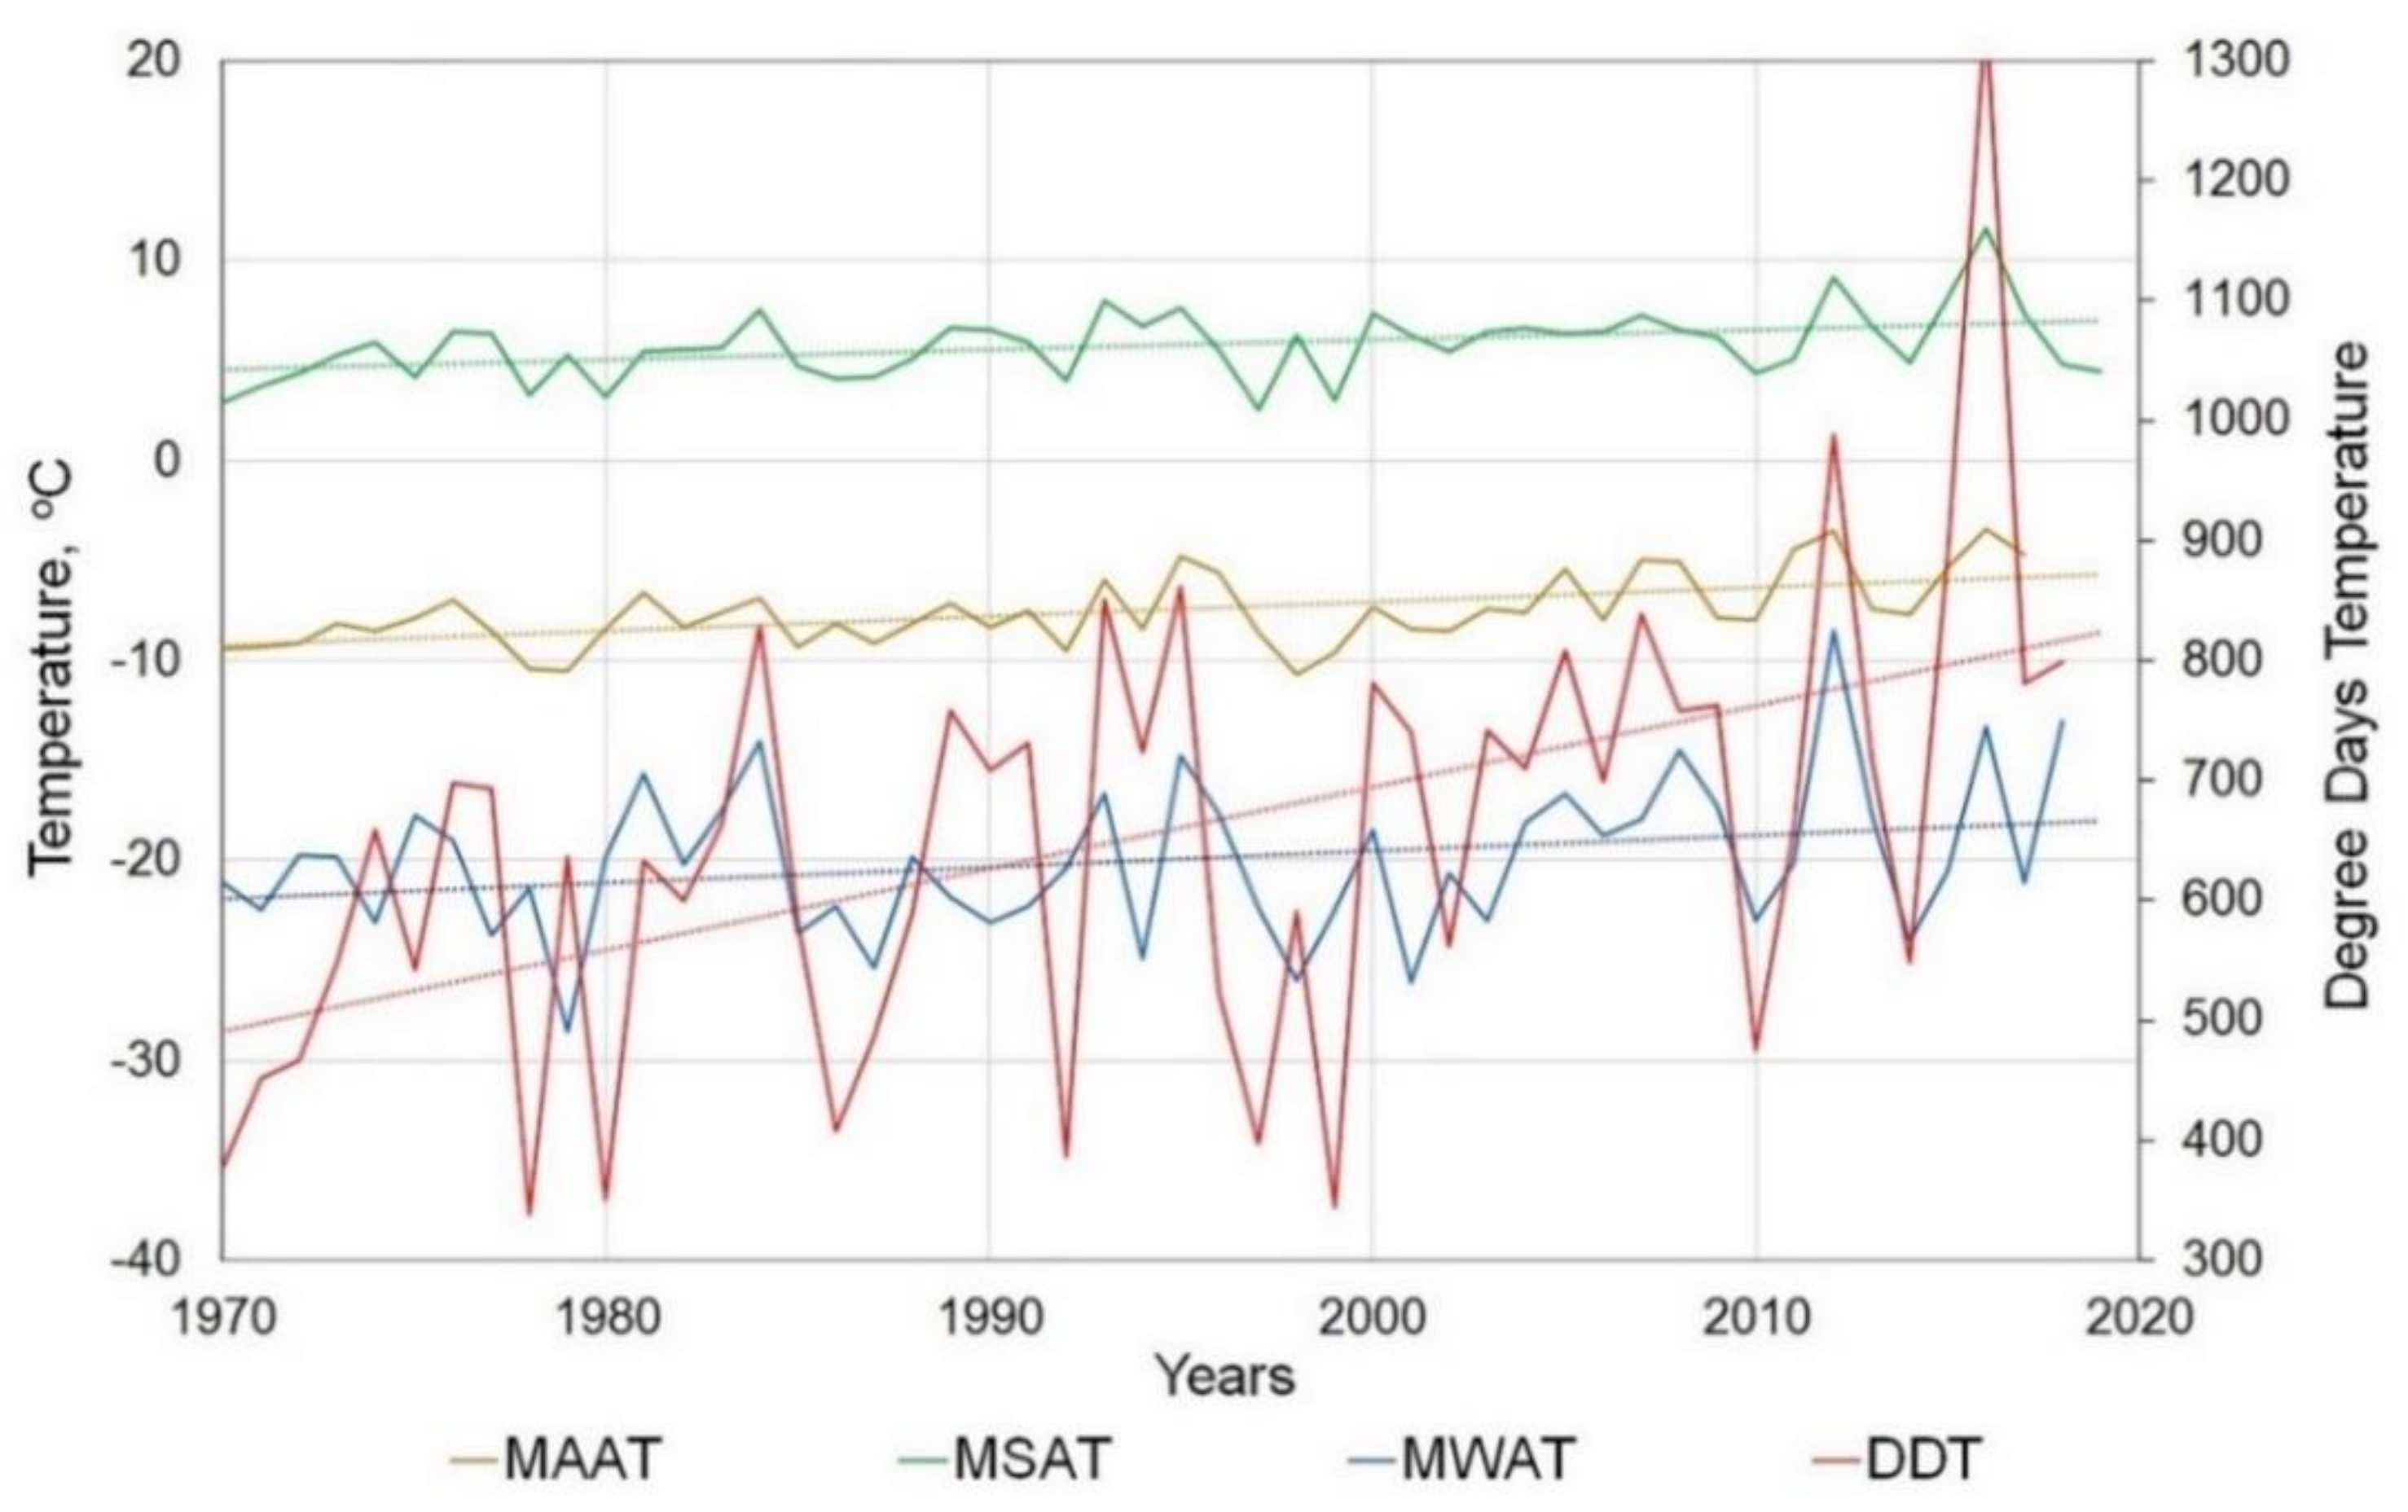
Climate warming in the western sector of the Russian Arctic began in the 1970s and continues since that time. The variations in mean annual air temperature (MAAT), mean temperatures of the warm (June–September) and cold periods (October–May), and thawing index (cumulative number of degree-days above 0 °C, DDT) from 1970 to 2019 are shown in
Figure 2. The MAAT during this period has increased from −9.4 to −5.9 °C, the mean rate of increase in the MAAT was 0.07 °C/year. The mean summer air temperature has increased from 5.5 to 6.9 °C, the average rate of temperature increase was 0.029 °C/year. The air temperature in the winter period has increased from −22.0 to −18.0 °C, the average rate of temperature increase was 0.081 °C/year.
Thus, climate warming occurs largely due to an increase in air temperature in winter; an increase in summer temperatures is much less pronounced.
The standard thawing index (DDT value average for the 1961–1990 period) was 560; from 1970 to 2019 the thawing index has increased from 500 to 810 (see the linear trend in
Figure 2); the rate of increase in DDT in 1970–2019 was 5.9 DDT/year.
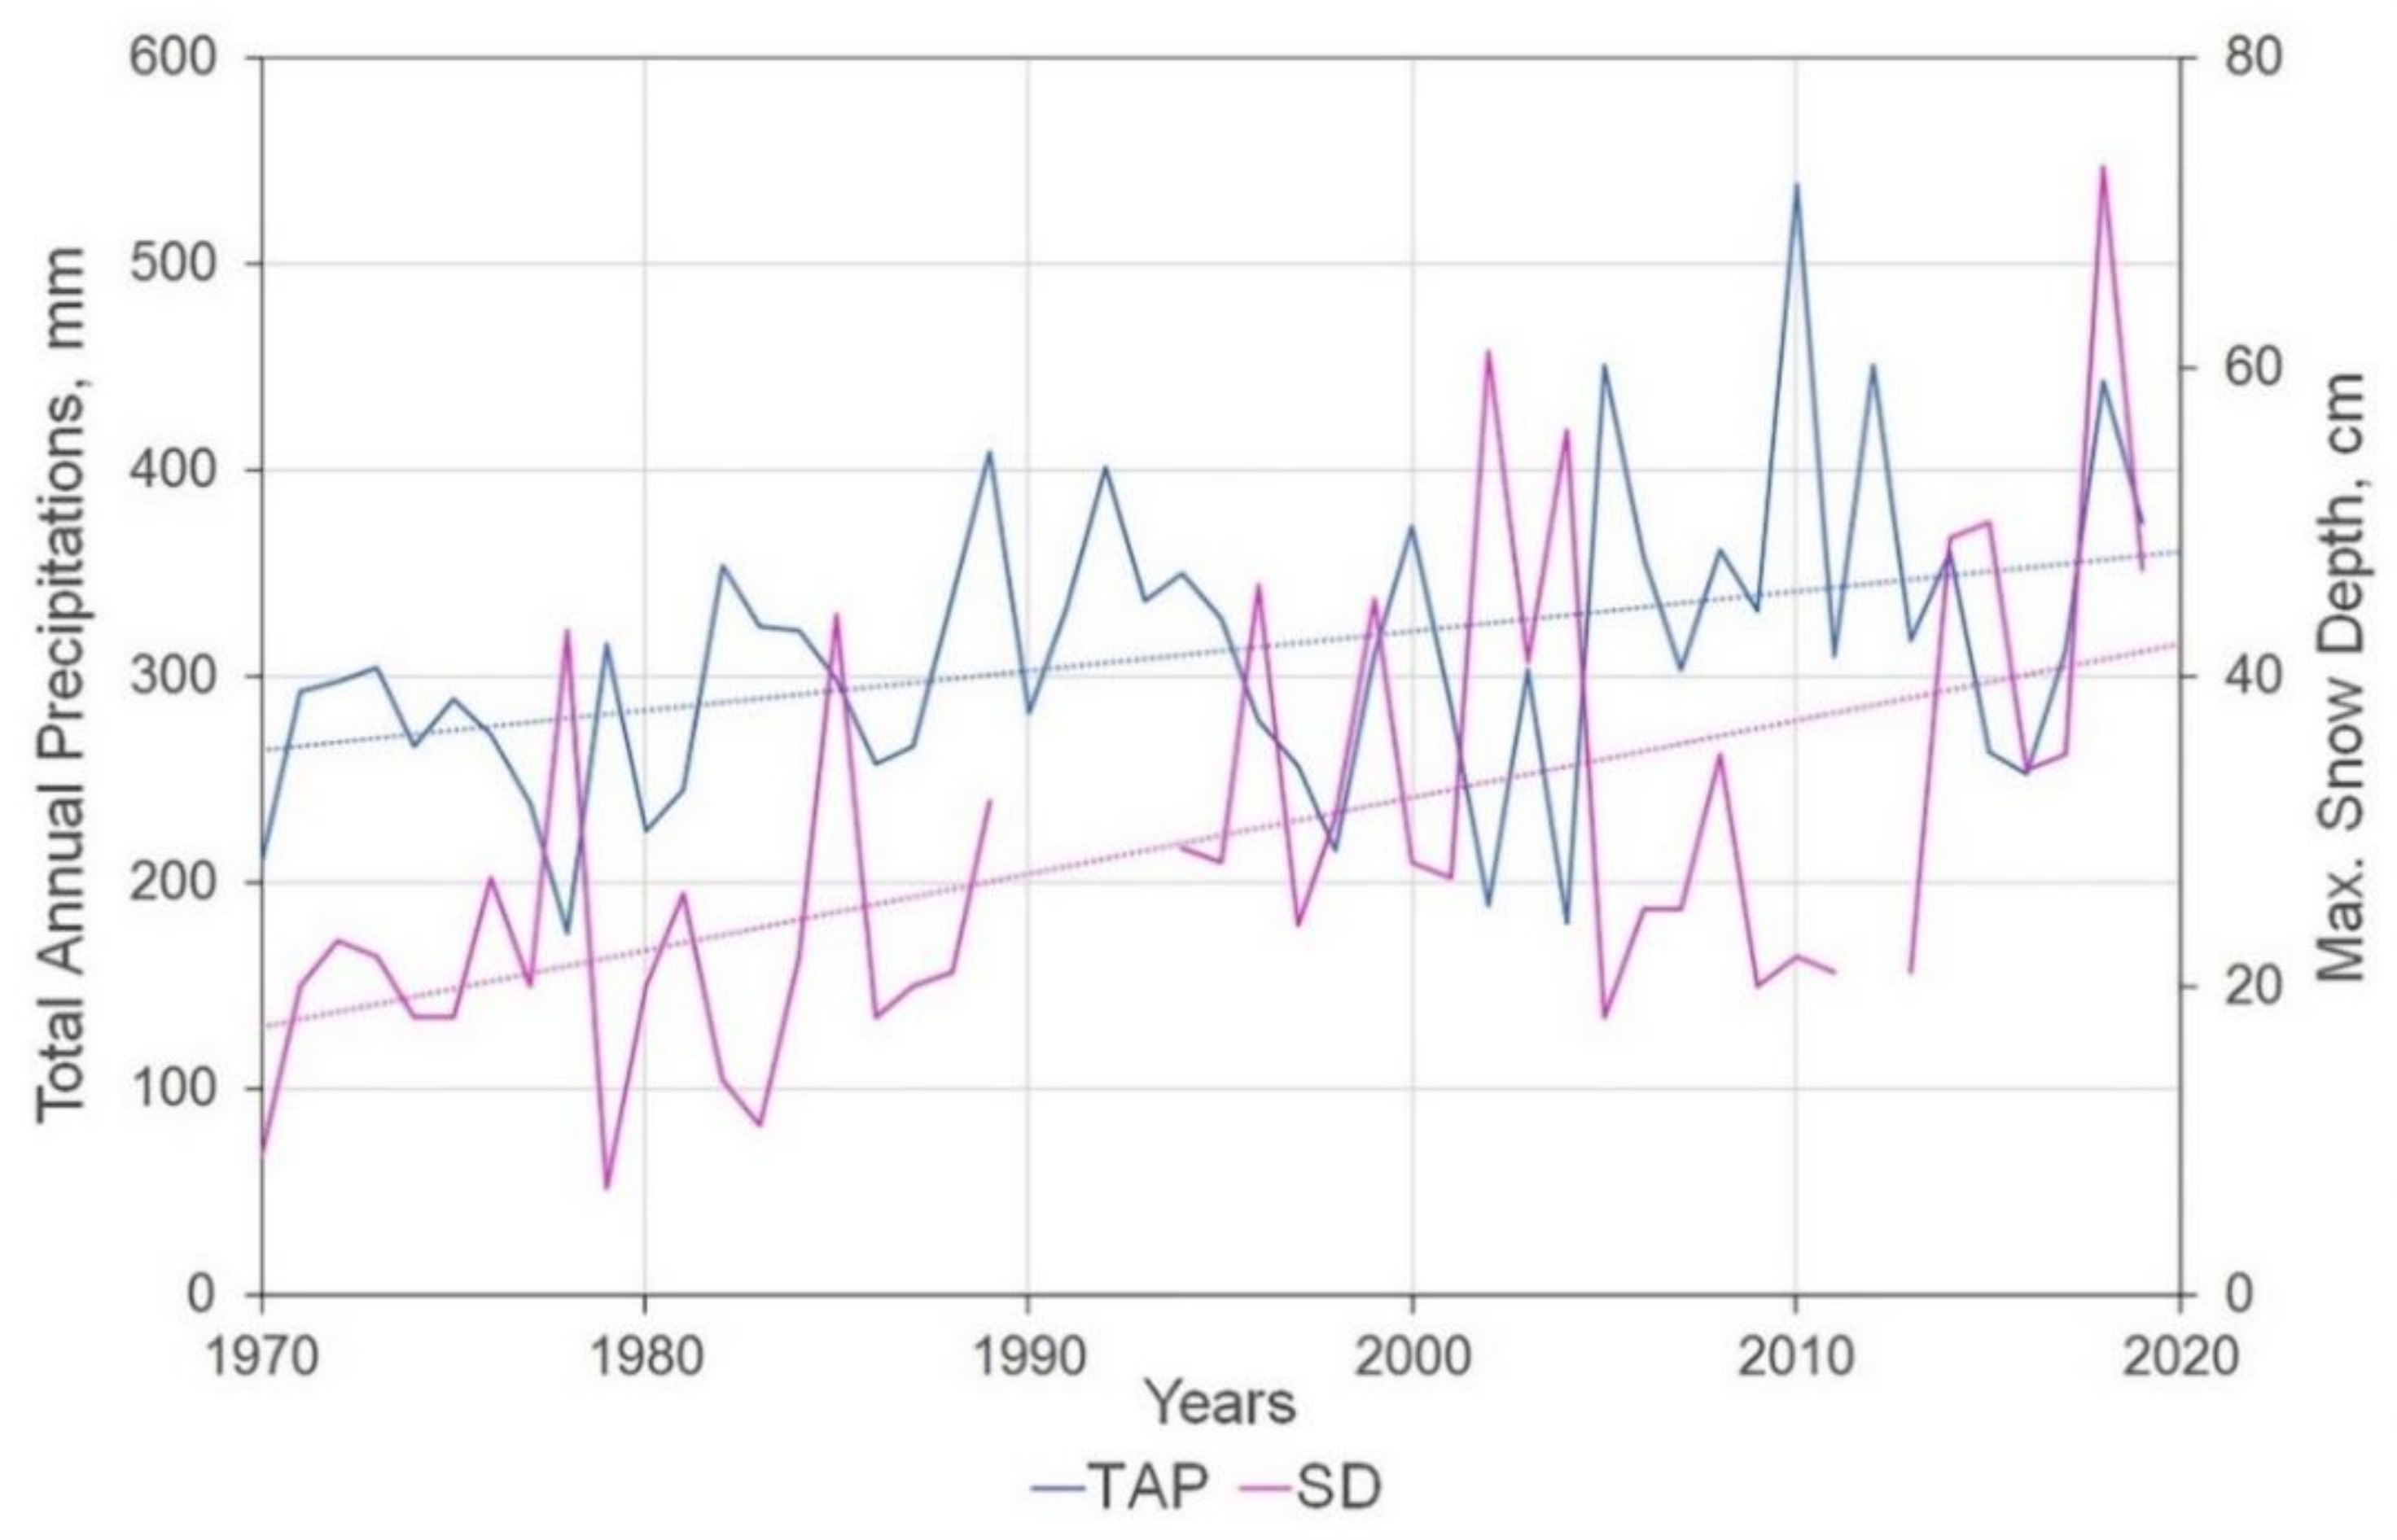
The standard amount of annual precipitation (averaged over 1961–1990) was 297 mm. Summer precipitation makes approximately a half of the total. Similarly, to changes in the air temperature, an increase in the amount of precipitation has been observed since 1970s: from 1970 to 2019 it has increased from 280 to 350 mm (
Figure 3); average rate of increase in the amount of annual precipitation was 1.65 mm/year. Over the 1970 to 2019 period, average rate of increase in snow accumulation was 0.41 cm/year.
4.2. Landscape Structure
The Marre-Sale permafrost monitoring station is located in the bioclimatic subzone D of typical tundra [
31] on the surface of the third marine terrace with elevations of 15 to 30 m above sea level. The marine terrace is dissected by a system of water tracks, gullies, and lake basins. The northern part of the study area is occupied by the floodplain of the Marre-Yakha River with elevations of 0.5 to 3.0 m above sea level. The landscape structure of the study area is representative for the entire area of typical tundra of the Yamal Peninsula. Each landscape is characterized by specific morphology, composition of sediments, moisture regime, type of tundra soils, vegetation, thermal regime of permafrost, and depth of seasonal thawing.
The landscape structure of the study area, covering the main geomorphic units—the third marine terrace and the floodplain of the Marre-Yakha River—is shown in
Figure 4. The landscape map was compiled by the authors on the basis of interpretation by satellite imagery, aerial photographs, ground observations et al. Lakes occupy approximately 12% of the study area.
In the landscape structure of the Marre-Sale study area, there are nine dominant landscapes characteristic of the permafrost regions of the northern part of Western Siberia [
32]. According to the moisture conditions of the territory [
33], all landscapes are subdivided into four main classes. The class of
dry tundra includes sand fields (SF, sites 43) and well-drained tundra (WDT, site 6). The SF terrain is a well-drained and poorly vegetated sand surface with occasional Poa plants. The WDT landscape is a flat surface of drained tundra with <2 cm-high grass–shrub–lichen vegetation community. The class of
poorly drained tundra includes one landscape—moist tundra (MT, site 1) with flat moist surface covered by grass-shrub-lichen vegetation up to 5 cm high. The class of
wet tundra includes the saturated tundra (ST, site 3) and polygonal tundra (PT, site 2). The ST landscape has a water-saturated flat surface of typical tundra with shrub–grass–moss vegetation up to 12–15 cm high. The PT landscape has a poorly drained surface with ice-wedge polygons and grass-shrub-moss vegetation up to 10 cm high, with small shallow ponds at places. The class of
flooded tundra includes water tracks (WT, site 4), lake basins (LB, site 44), and (PB, site 36). The WT landscape is characterized by erosional depressions with sedge–moss vegetation up to 5 cm high and small bogs. The LB landscape is characterized by periodically flooded basins with grass–moss vegetation up to 15 cm high. The landscape PB occupies periodically flooded areas of the Marre-Yakha River floodplain with sedge–moss–shrub vegetation up to 15 cm high. We also distinguished the peatland landscape (PL, site 17), which does not belong to four identified classes of landscapes. The PL landscape is characterized by flat-topped elevated peat surfaces with a prevalence of shrub–lichen–moss vegetation.
In the landscape structure of the Marre-Sale study area, dry tundra landscapes WDT and SF dominate within the surface of the 3rd marine terrace (24.4% and 5.7% of the study area, respectively); they occur mainly in well-drained areas adjacent to lakes and lake basins. The LB landscape with grass–moss cover within flooded bogs occupies 20.6% of the area. The ST landscape with shrub–grass–moss cover occupy 6.5% of the area. The area of drained flat tundra with grass-shrub-lichen cover (MT landscapes) comprises 6.4%. Polygonal grass-shrub-lichen-moss tundra (PT) occupies 5.5% of the area. The WT landscape occupies 6.2% of the area. The PL landscape of the flat-topped peatland occupies 4.6% of the study area. The PB landscape, located in the northern part of the area within the floodplain of the Marre-Yakha River, is considered as a single undivided wetland unit; it occupies 19.0% of the study area.
4.3. Vegetation
The climate warming leads to a change in the composition of the vegetation cover. In the tundra zone, this process is especially active, since almost all types of vegetation in this region are at the brink of survival, using the terminology of Karelin and Zamolodchikov [
34].
Detailed geobotanical descriptions were performed in the Marre-Sale study area in 1978–1988, including determination of the species composition of vegetation within each dominant landscape, and large-scale schemes of the horizontal structure of plant communities were compiled [
35].
Zonal tussocky sedge-shrub-lichen-moss tundra developed on tundra gley soils is typical of the high areas of the dissected 3rd marine terrace. The above-ground vegetation cover is dominated by sedge (Carex aquatilis), willow (Salix polaris, S. glauca), and dwarf birch (Betula nana). The moss cover is formed by green mosses (Sphagnum, Dicranum, Polytrichum) with the participation of lichens. On drained sandy areas with poorly developed soils, the species diversity of plant communities is significantly smaller compared to the moist loamy soils of sedge–shrub–lichen–moss tundra.
In the gramineous-shrub-green moss-lichen tundra, no Boreal species have been observed. Such areas are characterized by a greater concentration of Arctic and Arctic–Alpine species in comparison with sedge–shrub–lichen–moss tundra. An analysis of the species composition of the vegetation cover showed that the typical tundra of West Yamal is characterized by the dominance of the hypoarctic fraction (45%), and smaller participation of Arctic and Arctic–Alpine (40%) and boreal species (15%).
In 2019, we repeated the work on detection of the plant species, evaluation of their occurrences, and measurement of projective cover of vegetation in the dominant landscapes of the Marre-Sale station area. A botanical description was performed, and the projective cover was measured for each species.
Table 1 presents the characteristics of the dominant landscapes and their vegetation cover. The obtained data are still insufficient to determine the long-term changes in the characteristics of vegetation cover related to climate warming. It was only possible to trace the changes in sphagnum cover: from 1978 to 2019, the average sphagnum height had increased from 2.0 to 5.5 cm, and the projective cover has increased from 14% to 29%.
4.4. Permafrost Evolution
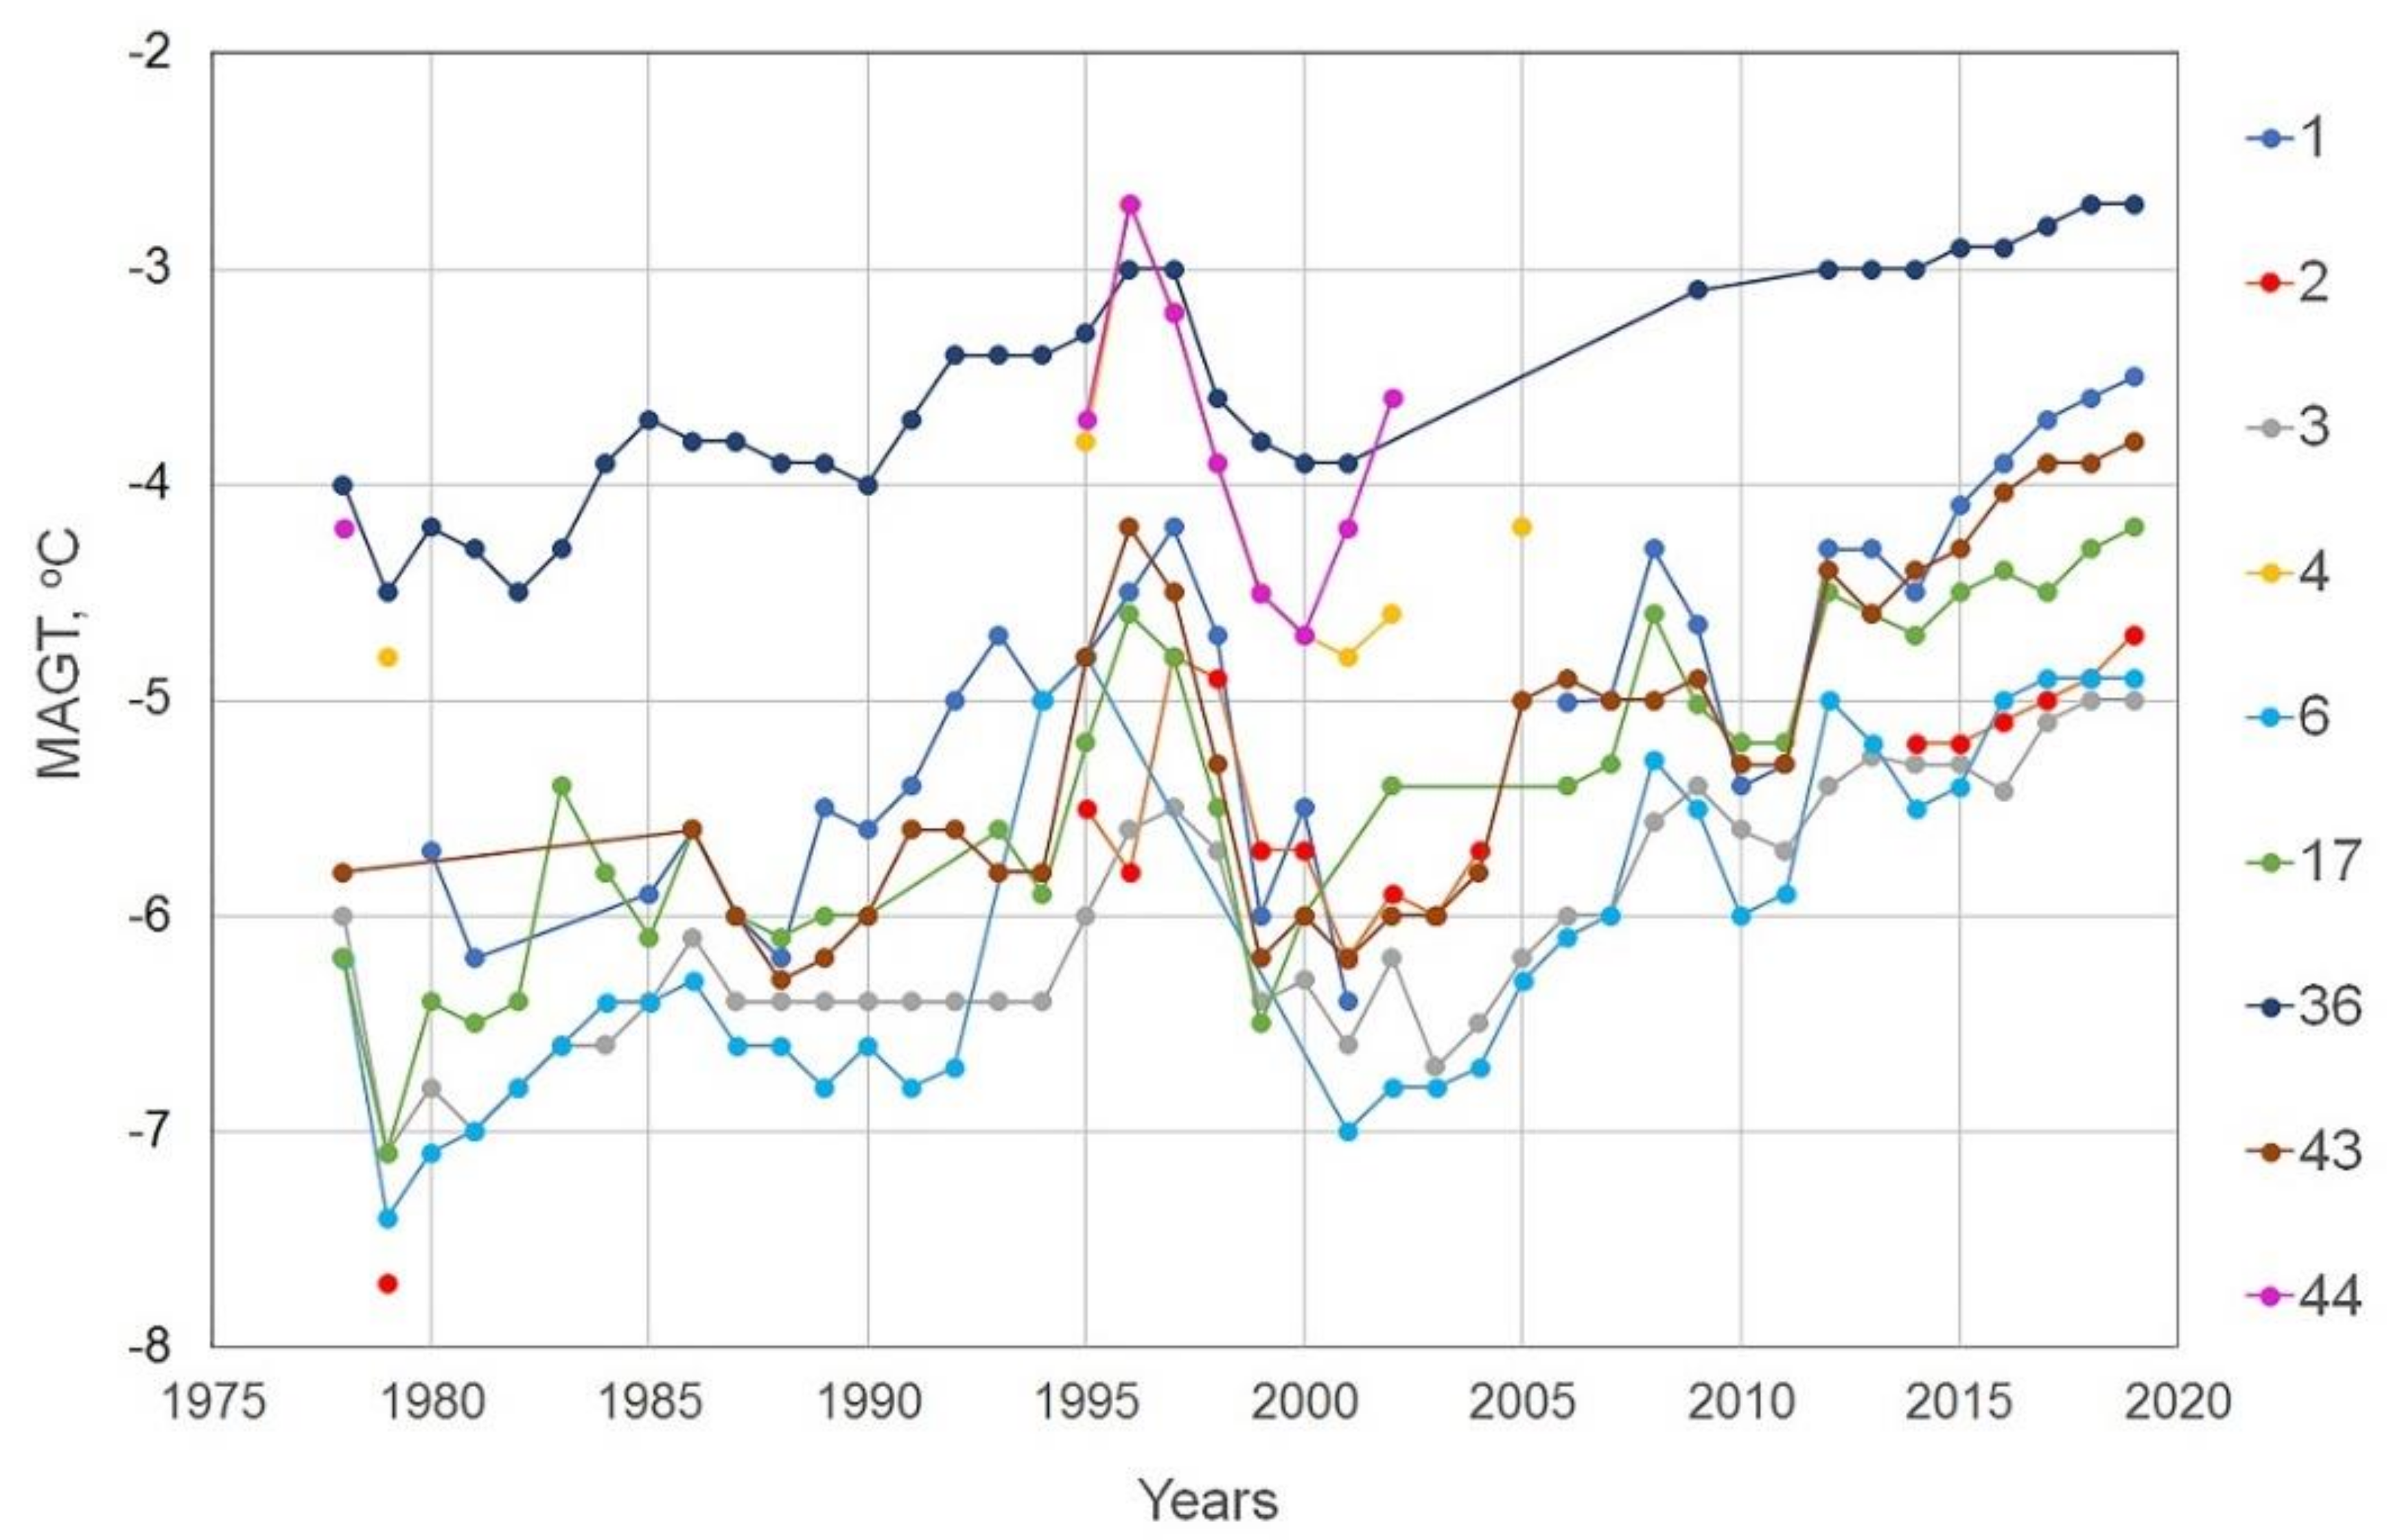
The study area is characterized by relatively low values of the mean annual ground temperatures (MAGTs) of the permafrost. Differences in landscape characteristics and snow accumulation determine the range of variations in the MAGT of the study area. Climate warming has caused a significant increase in MAGT (
Figure 5).
All the sites can be divided into two groups based on their MAGT values (
Figure 5). The first group includes MAGT monitoring sites located within negative landforms (sites 4—water track or gullies, 36—river floodplain, and 44—lake basins); permafrost temperatures for this group have been 1.5–2.0 °C higher compared to the second group. In the late 1970s, MAGTs here were −4 to −4.8 °C; by 2019, permafrost temperatures had increased up to −2.2 to −2.7 °C. The rate of increase in MAGT for this group of landscapes was 0.04 °C/year.
The second group includes all other landscapes (sites 1, 2, 3, 6, 17, and 43) and is characterized by lower MAGT values. At the beginning of the observation period, the MAGTs were −5.8 to −7.7 °C, by 2019 the permafrost temperatures had increased up to −3.5 to −5.0 °C. The average rate of increase in MAGT for this group of landscapes was 0.062 °C/year. Relatively low MAGTs at all monitoring sites suggest a relatively stable thermal state of the permafrost of typical tundra landscapes of Western Yamal under a warming climate.
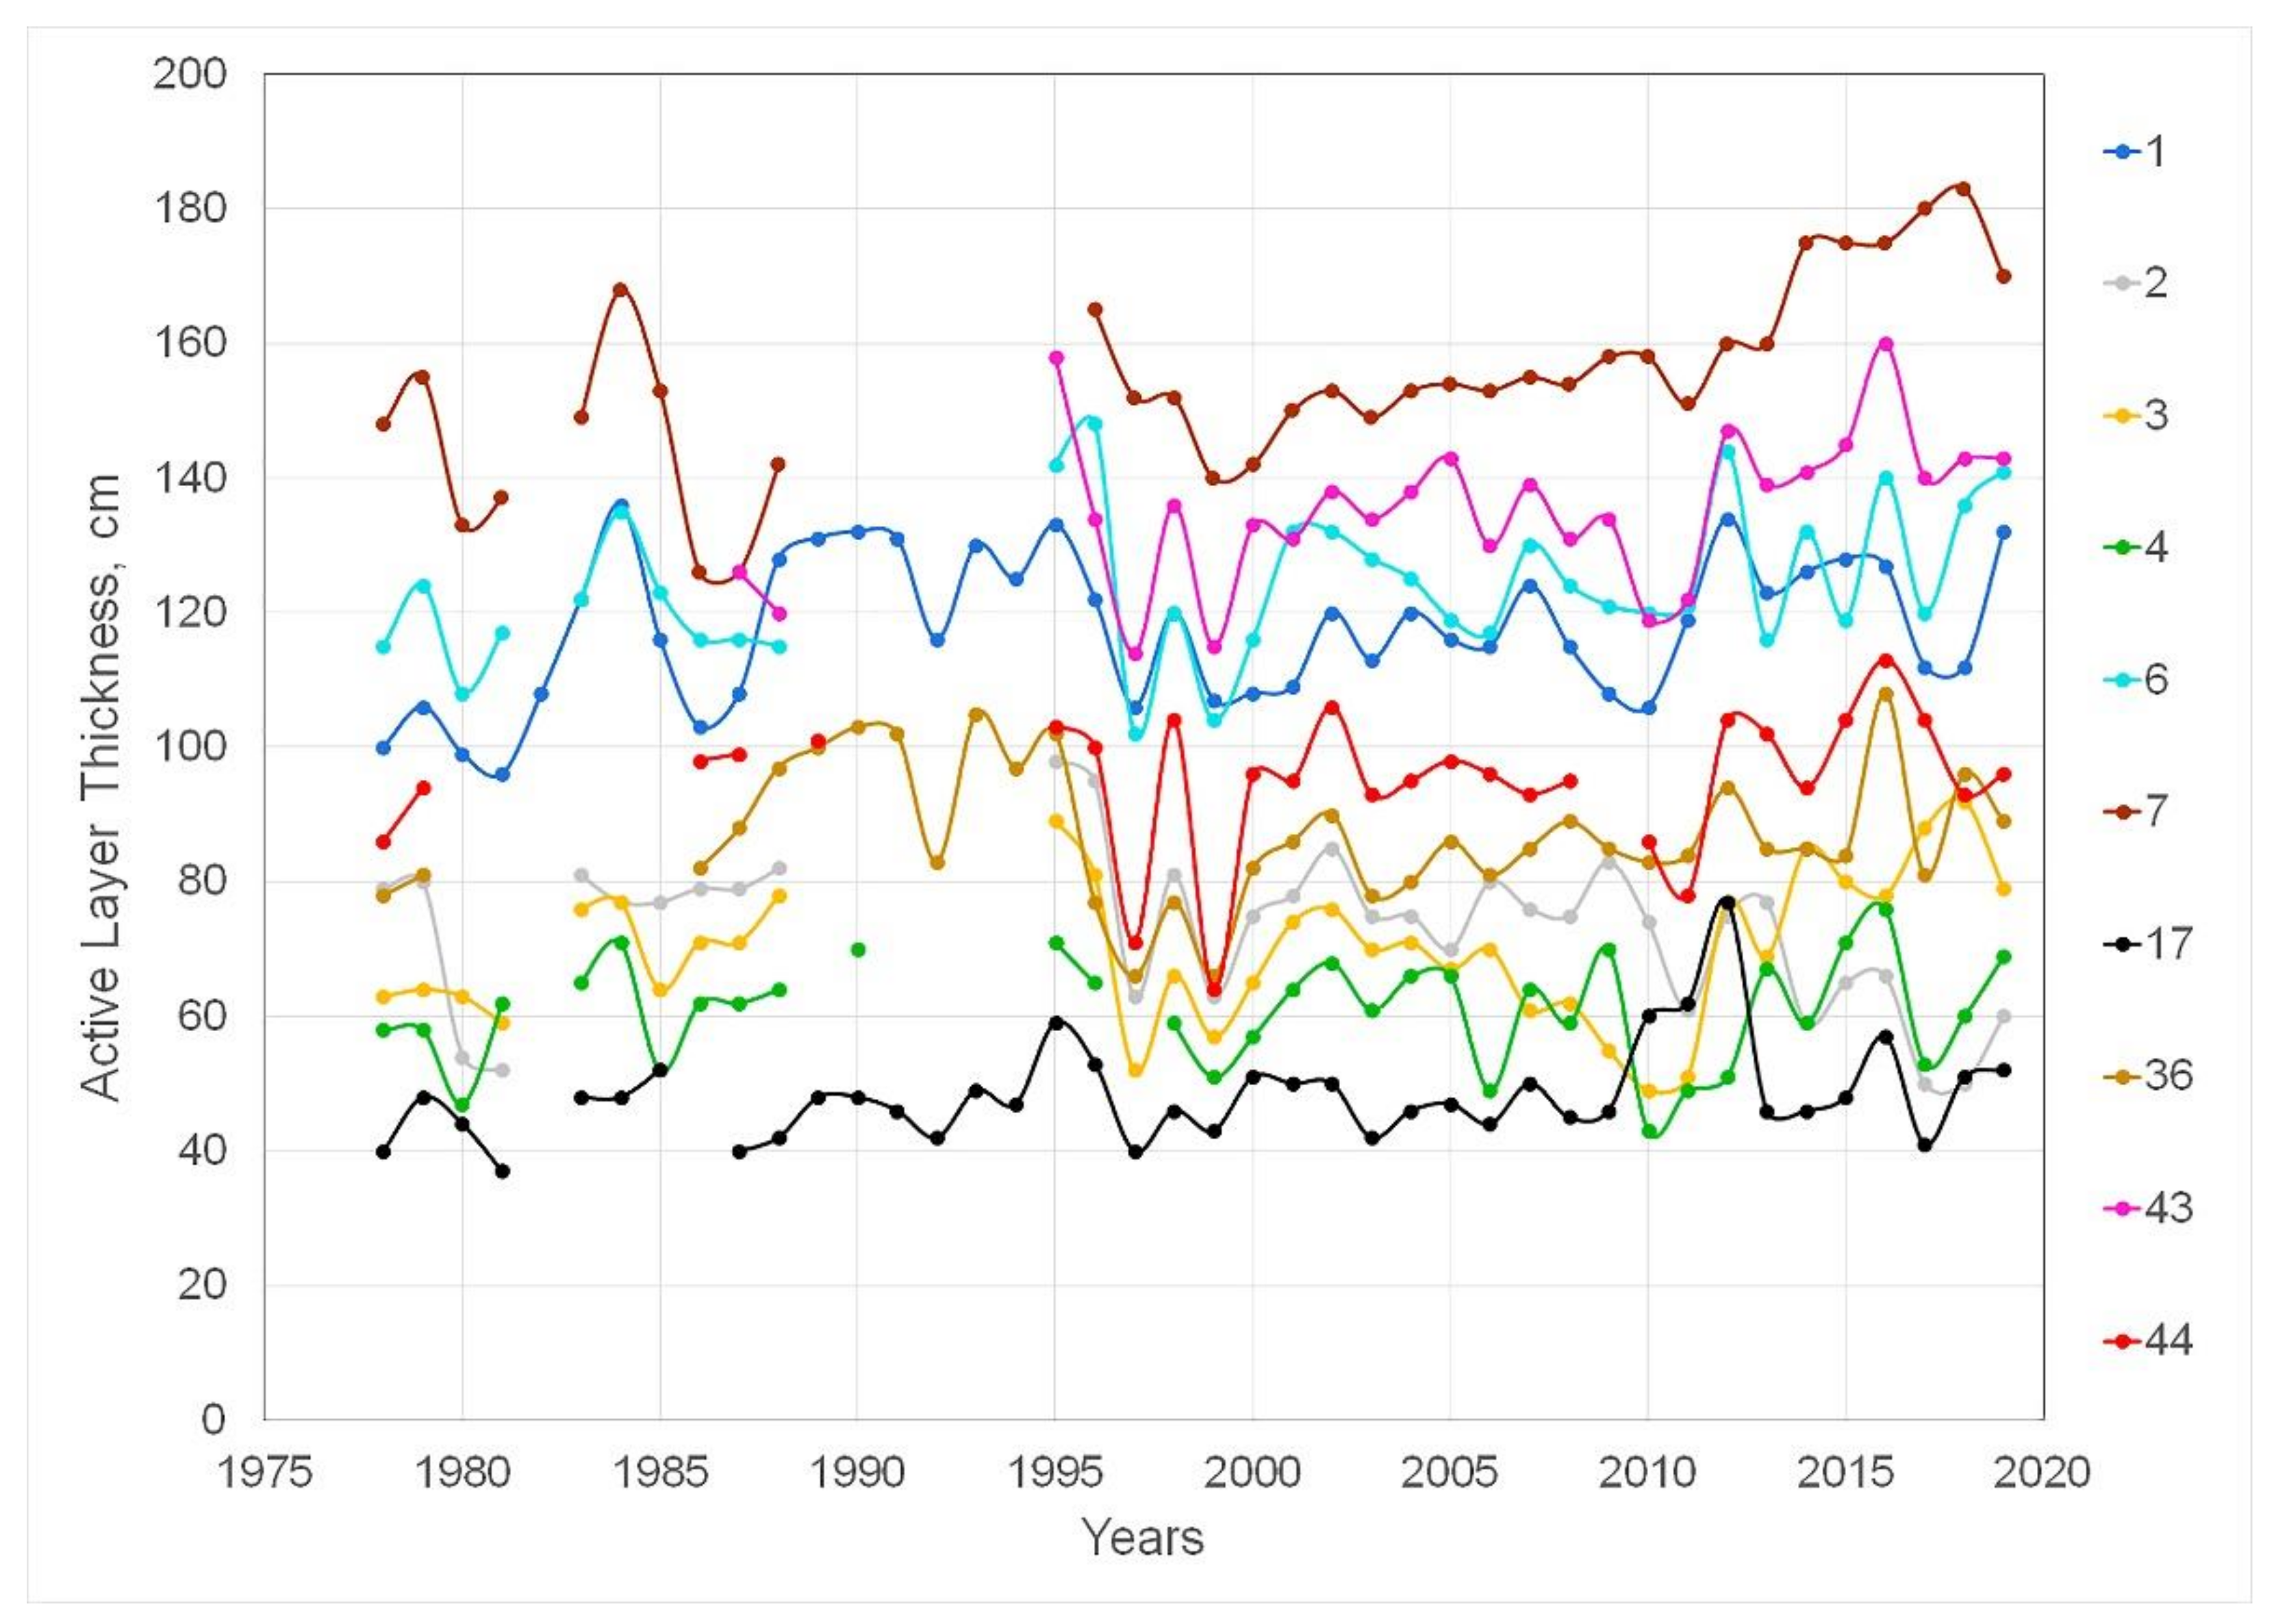
Seasonal thawing of soils begins immediately after the transition of air temperatures to positive values. Differences in key characteristics of dominant landscapes—relief, thickness and composition of vegetation cover, thickness of peat, texture of sediments, hydrological regime of soils—determine differences in the depth of seasonal thawing. Observations of the interannual dynamics of seasonal thawing in different permafrost landscapes (
Figure 6) showed that the values of maximum thawing, which corresponds to the active layer thickness (ALT), depend mainly on characteristics of moss and vegetation cover and soil moisture.
Analysis of the data presented in
Figure 6 shows that all permafrost landscapes can be divided into two groups based on the ALT and its response to climate warming. The first group includes dry and moist landscape classes: well-drained tundra (WDT), sand fields (SF), and moist tundra (MT), sites 6, 43, 7, and 1. These landscapes are characterized by the highest values of the ALT and the maximum rate of its increase related to climate warming. The maximum thawing depth is typical of sand fields: in 1978 it was 126 cm and by 2019 it had increased to 143 cm. The minimum thawing depth for landscapes of the first group is observed in moist tundra. Here it varied from 100 cm (1978) to 132 cm (2019). The average rate of increase in depth of seasonal thawing for this group was 0.62 cm/year.
The second group is formed by wet and flooded landscape classes, which include saturated tundra (ST), polygonal tundra (PT), water tracks (WT), and like basins (LB). This group also includes peatlands (PL). Permafrost landscapes of the second group are characterized by low ALT values. In the peatlands, the ALT had increased from 40 cm (1978) to 52 cm (2019), and in lake basins from 83 cm (1978) to 96 cm (2019). The average rate of increase in the depth of seasonal thawing for landscapes of this group was 0.2 cm/year. For polygonal tundra and peat bogs, negative trends have been observed. We presume that as soon as the increasing depth of seasonal thawing in these landscapes reaches the horizon with high ground-ice content underlying the active layer, the high latent heat required for fusion of ice slows down further deepening of the active layer, even with continuing increase in DDT. Moreover, this slow thawing of the ice-rich soils, which have very high thaw strain values, is accompanied by subsidence of the surface that occurs without accumulation of significant amount of thawed soil above the thawing permafrost [
36]. These effects may result in low positive or even negative trends in the interannual variations of the ALT.
In 1970s, the freezing of the active layer in the Marre-Sale area usually started in late September—early October. Complete freezing of the active layer occurred in the second half of November. Our recent observations show that due to climate warming, the freezing of the active layer currently starts in mid-October, and it becomes completely frozen by early December. In the continuous permafrost zone, the freezing of the active layer commonly occurs both from above and below. According to observations performed in 1980s in central Yamal [
37], the lower part of the active layer (~23% of its total thickness) experienced freezing from below, while the freezing from above affected more than 75% of the total active-layer thickness.
Our detailed observations of the active layer thermal regime in the Marre-Sale area show that in the areas occupied by well-drained and moist tundra, the freezing from below affects approximately 10% of the total active-layer thickness, while ~90% of the active layer freezes from above. In other landscapes, we expect different ratios: presumably 10% to 25% of the active layer freezes from below, and 75% to 90% freezes from above.
High ice content in the upper permafrost is a common phenomenon, which may be explained by a concept of transition zone of the upper permafrost that consists of two layers: transient and intermediate [
38,
39,
40,
41]. The uppermost part of the transition zone—transient layer—is defined as a layer of soil that belongs to the permafrost for several years and joins the active layer in the years with deeper seasonal thaw [
42,
43]. In mineral soils, thickness of the transient layer can be as much as 30% of the annual mean ALT.
An intermediate layer forms due to a gradual decrease in the ALT, mostly as a result of accumulation of organic matter after termination or slow-down of sedimentation. This long-term process transforms the initial transient layer and a part of the initial active layer into a perennially frozen state. The thickness of the ice-rich intermediate layer exceeds the initial thickness of the active layer as a result of accumulation of ground ice and under certain conditions may reach 1.5–2 m and even more [
38,
39,
41]. A well-developed intermediate layer is characterized by extremely high ice content with prevailing suspended (ataxitic) cryostructure; the volume of visible ice in soil with ataxitic cryostructure exceeds 50%. Thick ice layers (“belts”) are also typical of the intermediate layer.
Our studies showed that the well-developed intermediate layer is not very common in many landscapes of the Marre-Sale study area, especially in landscapes with prevailing sandy soils. However, this layer may be encountered in some landscapes. For example, we described the 30 cm-thick intermediate layer in silty loam with gravimetric moisture content 90% to 150%, which has developed in modern alluvial-marine sediments near the mouth of the Marre-Yakha River [
22].
Thus, our analysis of changes in the main characteristics of permafrost conditions—MAGT and ALT—has shown that these changes are determined mainly by characteristics of permafrost landscapes and their response to climate warming.
4.5. Methane Concentrations in Active Layer and Upper Horizon of Frozen Sediments
Methane contents vary significantly between various permafrost landscapes. These differences are significant both in the amount of methane contained in the soil samples of the active layer (AL) and transition zone of the upper permafrost (TZ), and in methane fluxes into the atmosphere.
For the study area, we have collected and analyzed data on the methane contents obtained from more than 700 soil and ground-ice samples, 242 of which were collected in dominant landscapes from the AL (156 samples) and TZ (86 samples). In our previous study [
44], we showed that the isotopic composition of methane in the active layer (average δ
13C (CH
4) was −63.6 ± 5.6‰) suggests its microbial origin. The methane contents in landscapes of sand fields (SF), well-drained tundra (WDT), and peatlands (PL) have not been studied, since previously obtained data showed extremely low methane concentrations in the soils of the active layer of these landscapes—less than 0.1 mL (CH
4)/kg [
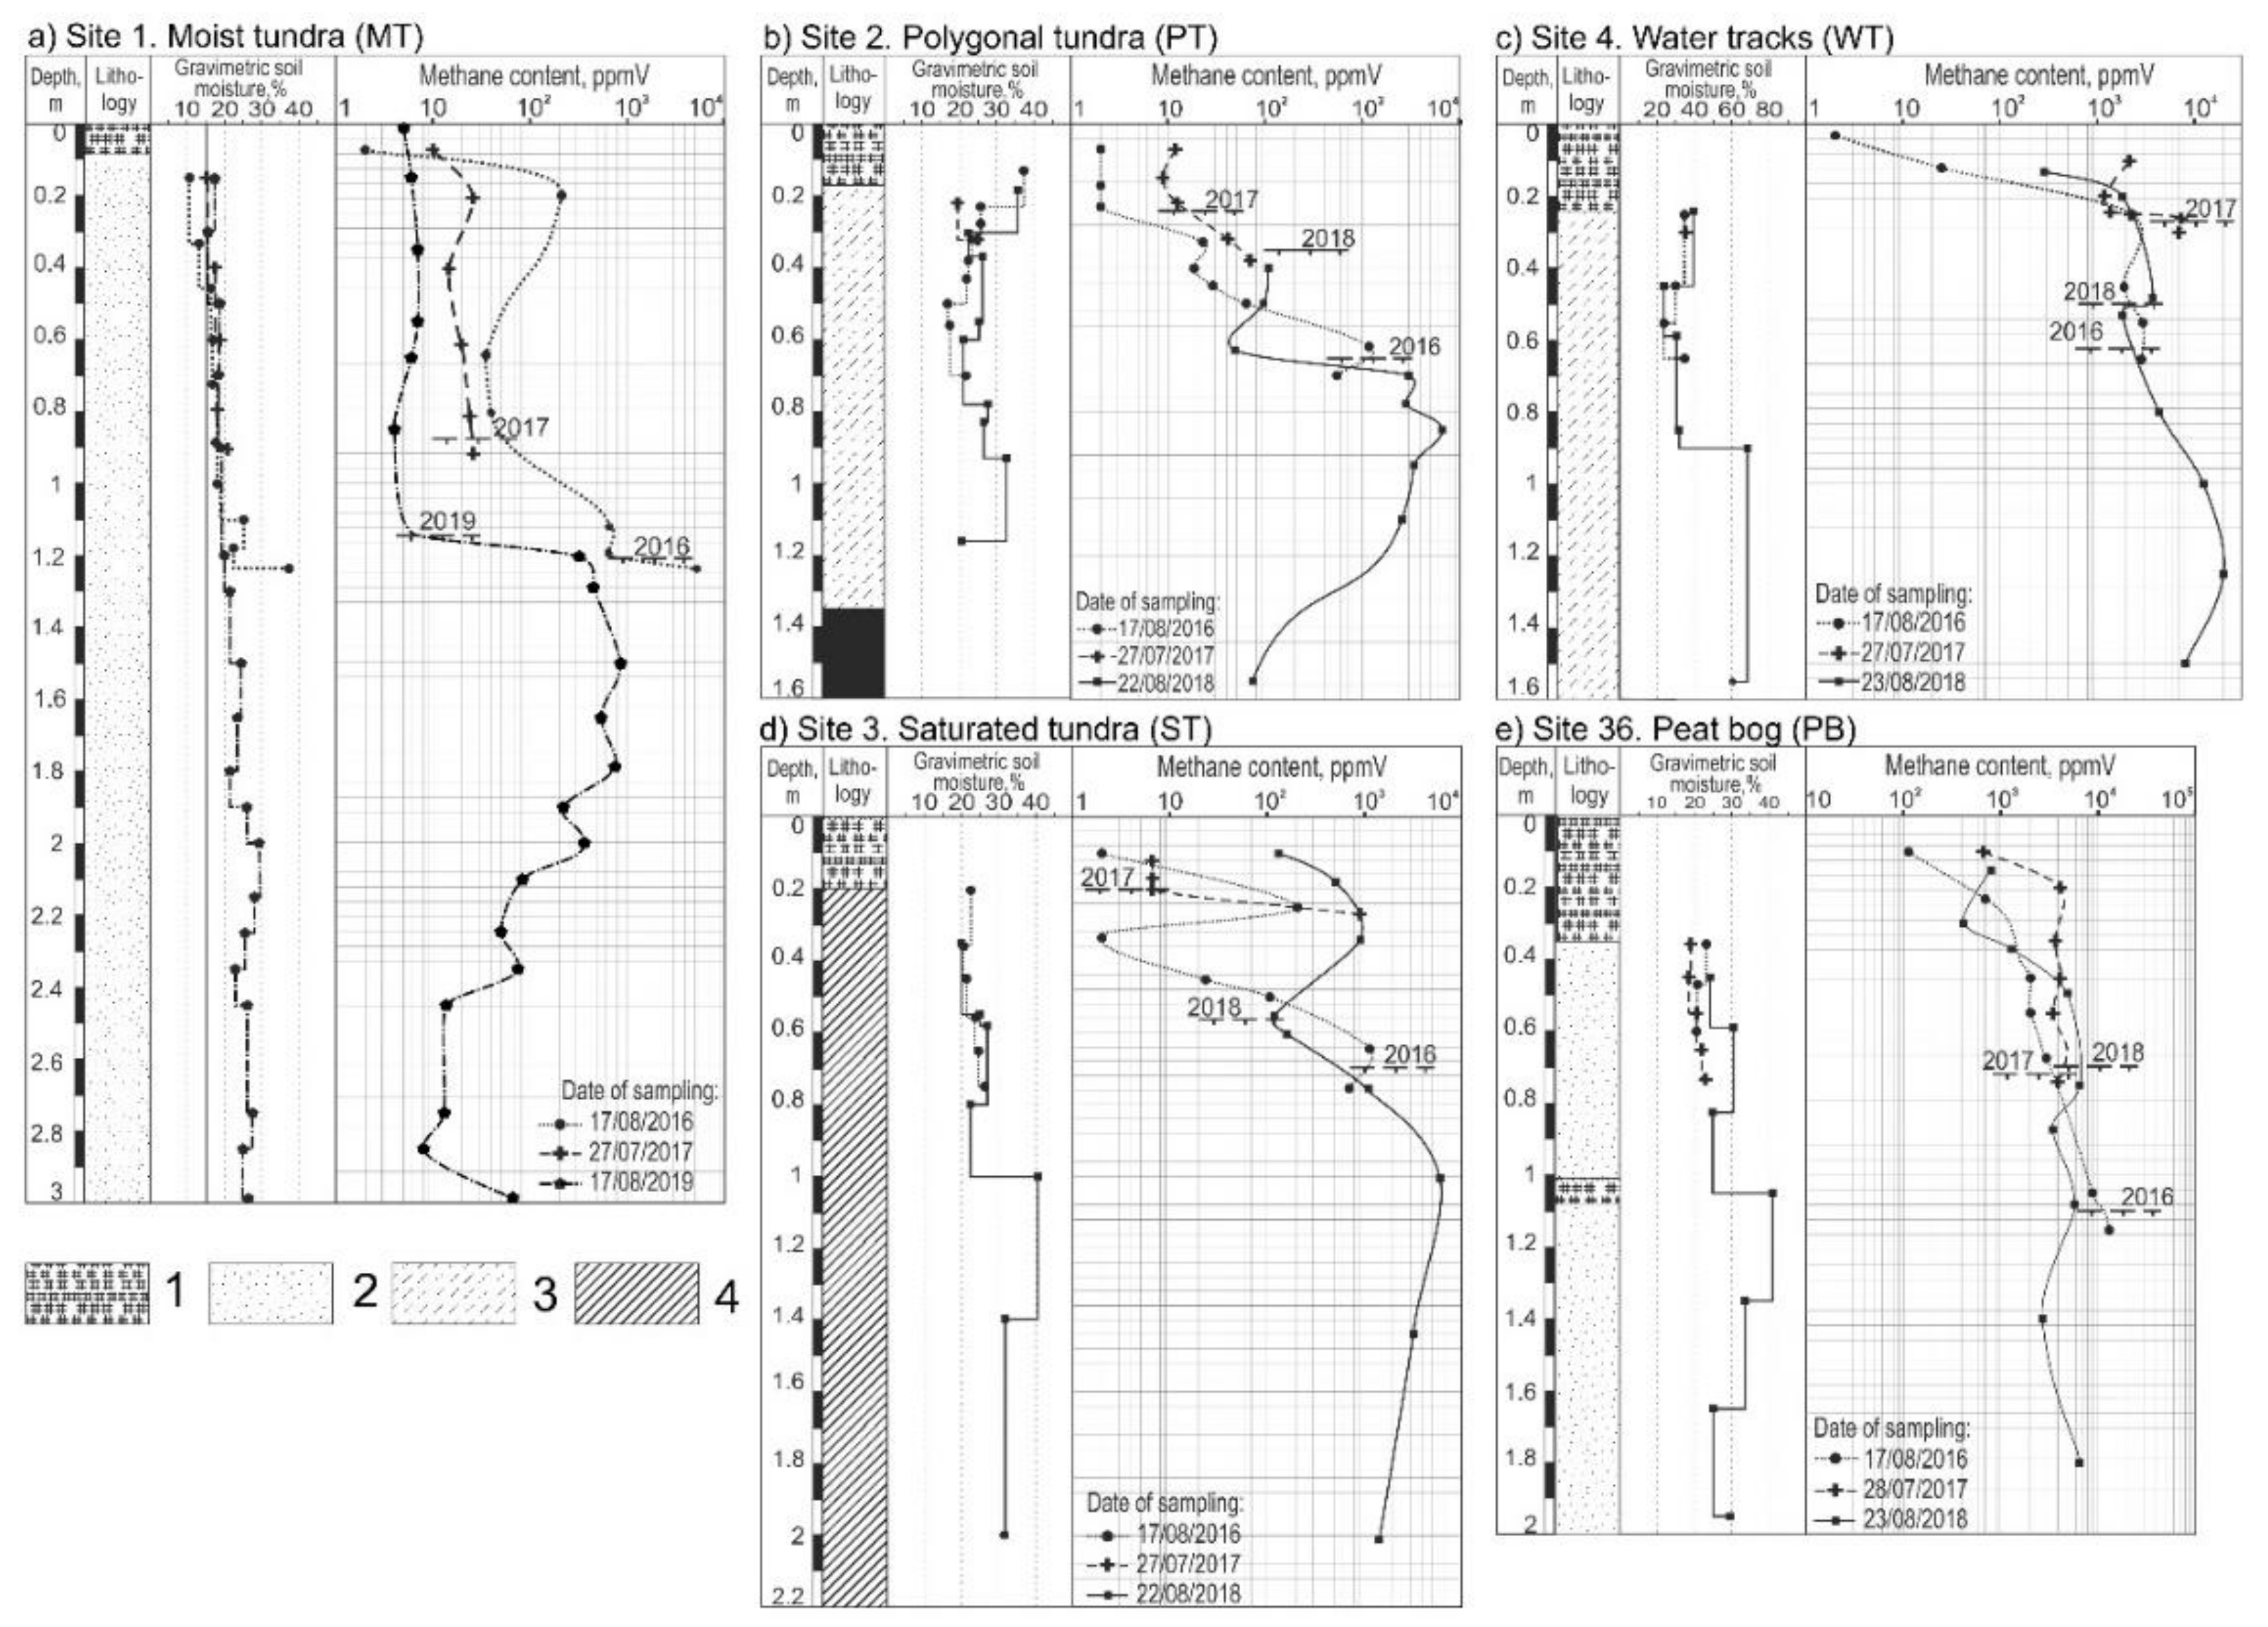
44]. We presume that soil and moisture conditions within these landscapes are not favorable for methane production. Soil characteristics (texture, gravimetric moisture contents) and methane contents in AL and TZ in landscapes with different moisture and vegetation conditions are presented in
Figure 7.
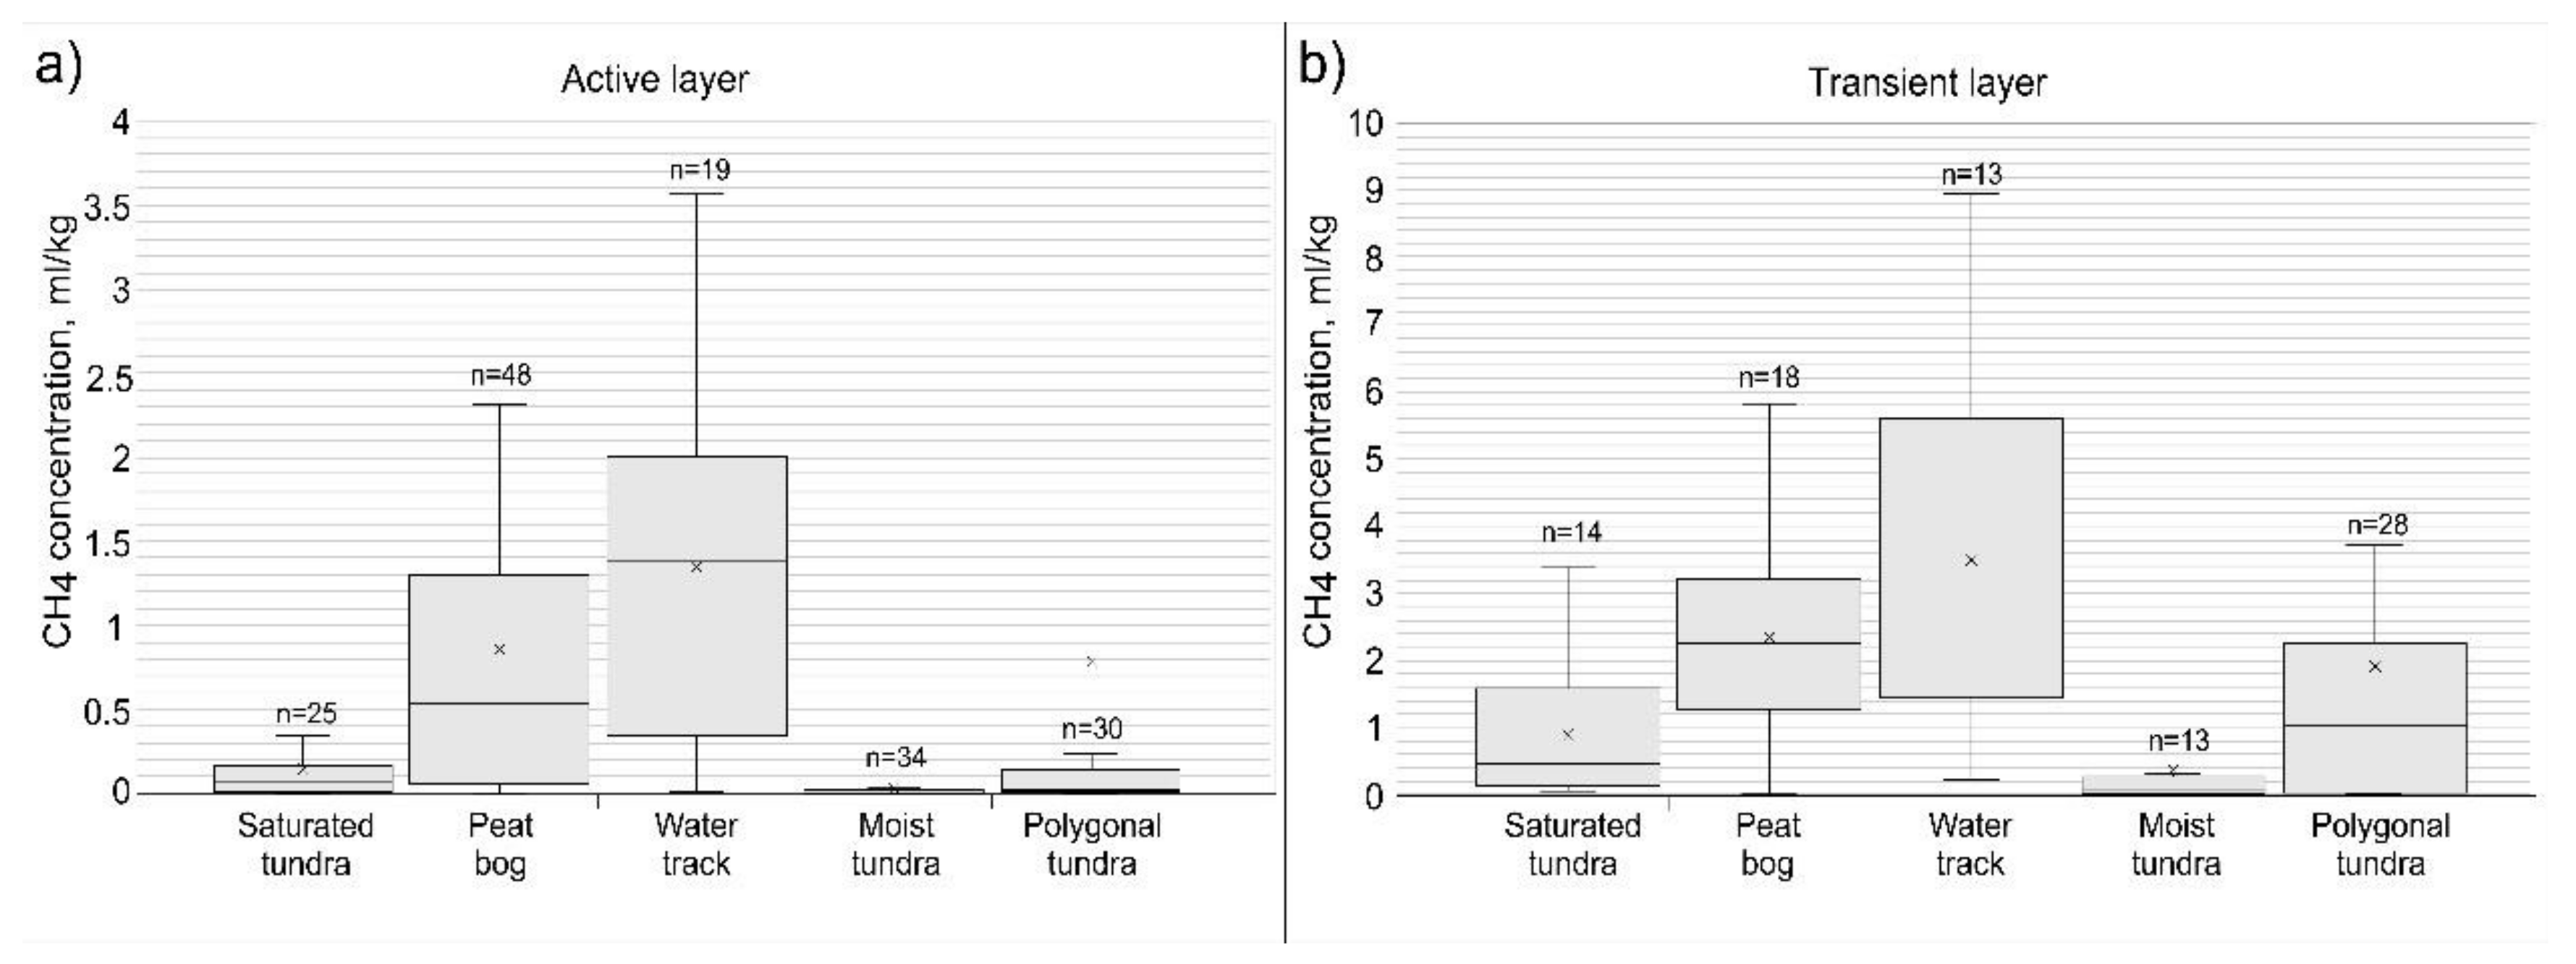
The methane content both in the active layer and in the transition zone varies greatly depending on the moisture conditions of the territory and soil properties. Despite the high variability in the methane concentration in the active layer, in general it significantly increases with depth. This probably indicates an important role of the diffuse mechanism of methane transport to the surface during its emission. In frozen soils of the transition zone, the amount of methane is always higher than in seasonally thawed soils. The highest methane contents for both the active layer and the transition zone are typical of the landscapes of the peat bogs located within the river floodplain (site 36, landscape PB) and the water tracks (site 4, landscape WT) (
Figure 8).
In the seasonally thawed soils of water tracks (WT, site 4), the average methane content was 1.36 ± 1.03 mL (CH
4)/kg (n = 19), with the maximum value of 3.56 mL (CH
4)/kg (
Figure 8b). In peat bogs (PB, site 36), the average methane content was lower and reached 0.86 ± 0.96 mL (CH
4)/kg, with the maximum of 2.4 mL (CH
4)/kg (n = 48). All other landscapes are characterized by significantly lower methane contents in the active layer. In the water-saturated tundra (ST, site 3), the average methane content was 0.14 ± 0.18 mL (CH
4)/kg with a maximum of 0.34 mL (CH
4)/kg (n = 25); in the polygonal tundra (PT, site 2) the average value was 0.79 ± 1.92 mL (CH
4)/kg (n = 30). In the active layer of moist tundra (MT, site 1), sand fields (SF, site 43), and peatlands (PL), the methane content was less than 0.1 mL (CH
4)/kg. Based on these data, there is a certain trend for the methane content to increase with increasing soil moisture, but this correlation is not strong.
In the underlying frozen soils of the transition zone, the methane content is significantly higher in comparison with the active layer (
Figure 8). The average methane content in the landscapes of water tracks (WT, site 4) was 3.52 ± 2.61 mL (CH
4)/kg (n = 13), the maximum value was 8.97 mL (CH
4)/kg. In frozen soils of peat bogs (PB, site 36), the average methane content was 2.37 ± 1.56 mL (CH
4)/kg (n = 18) with a maximum of 5.82 mL (CH
4)/kg. In the soils of the polygonal tundra (PT, site 2), the average methane content was 1.92 ± 2.8 mL (CH
4)/kg (n = 28), the maximum was 3.72 mL (CH
4)/kg. In soils of the water-saturated tundra (ST, site 3), the average methane content was 0.91 ± 0.98 mL (CH
4)/kg (n = 14), the maximum was 3.40 mL (CH
4)/kg. In frozen soils of the transitional layer of landscapes of moist tundra (MT, site 1), sand fields (SF, site 43), and peatlands (PL), the methane content in frozen soils of the transition zone was low (<0.5 mL (CH
4)/kg), similarly to the active layer values in the same landscapes.
Our data for the transition zone showed that almost in all landscapes there was an increase in the methane content with depth from the base of the active layer to the maximum values that were measured at depths varying for different landscapes from approximately 0.8 to 2.0 m (0.3 to 1.6 m from the top of permafrost); below these depths, a slight decrease in the methane content with depth was measured (
Figure 7). The increased methane content in the transition zone may be explained by pushing methane downward as a result of the fall freezing and its subsequent concentration in the underlying permafrost. Such a mechanism of methane accumulation in the underlying transition zone was described by Kraev [
8].
Thus, the methane content in the transition zone of the upper permafrost is 2.5–5 times higher than in the active layer. With the permafrost degradation, this methane previously preserved in the permafrost will be released and involved in the process of methane emission from the permafrost into the atmosphere.
4.6. Methane Flux
Measurements of CH
4 fluxes into the atmosphere were performed in late July—early August of 2018 and 2019 at five sites (MT, PT, ST, WT, and PB), where high methane contents were measured in the active layer and significant methane emissions were expected. In the drained tundra (SF, WDT, and PL landscapes), no observations were performed because the methane emissions measured in similar landscapes were close to zero [
45]. A total of 28 four-hour-long experiments were performed at air temperatures varying from 3.5 to 10 °C.
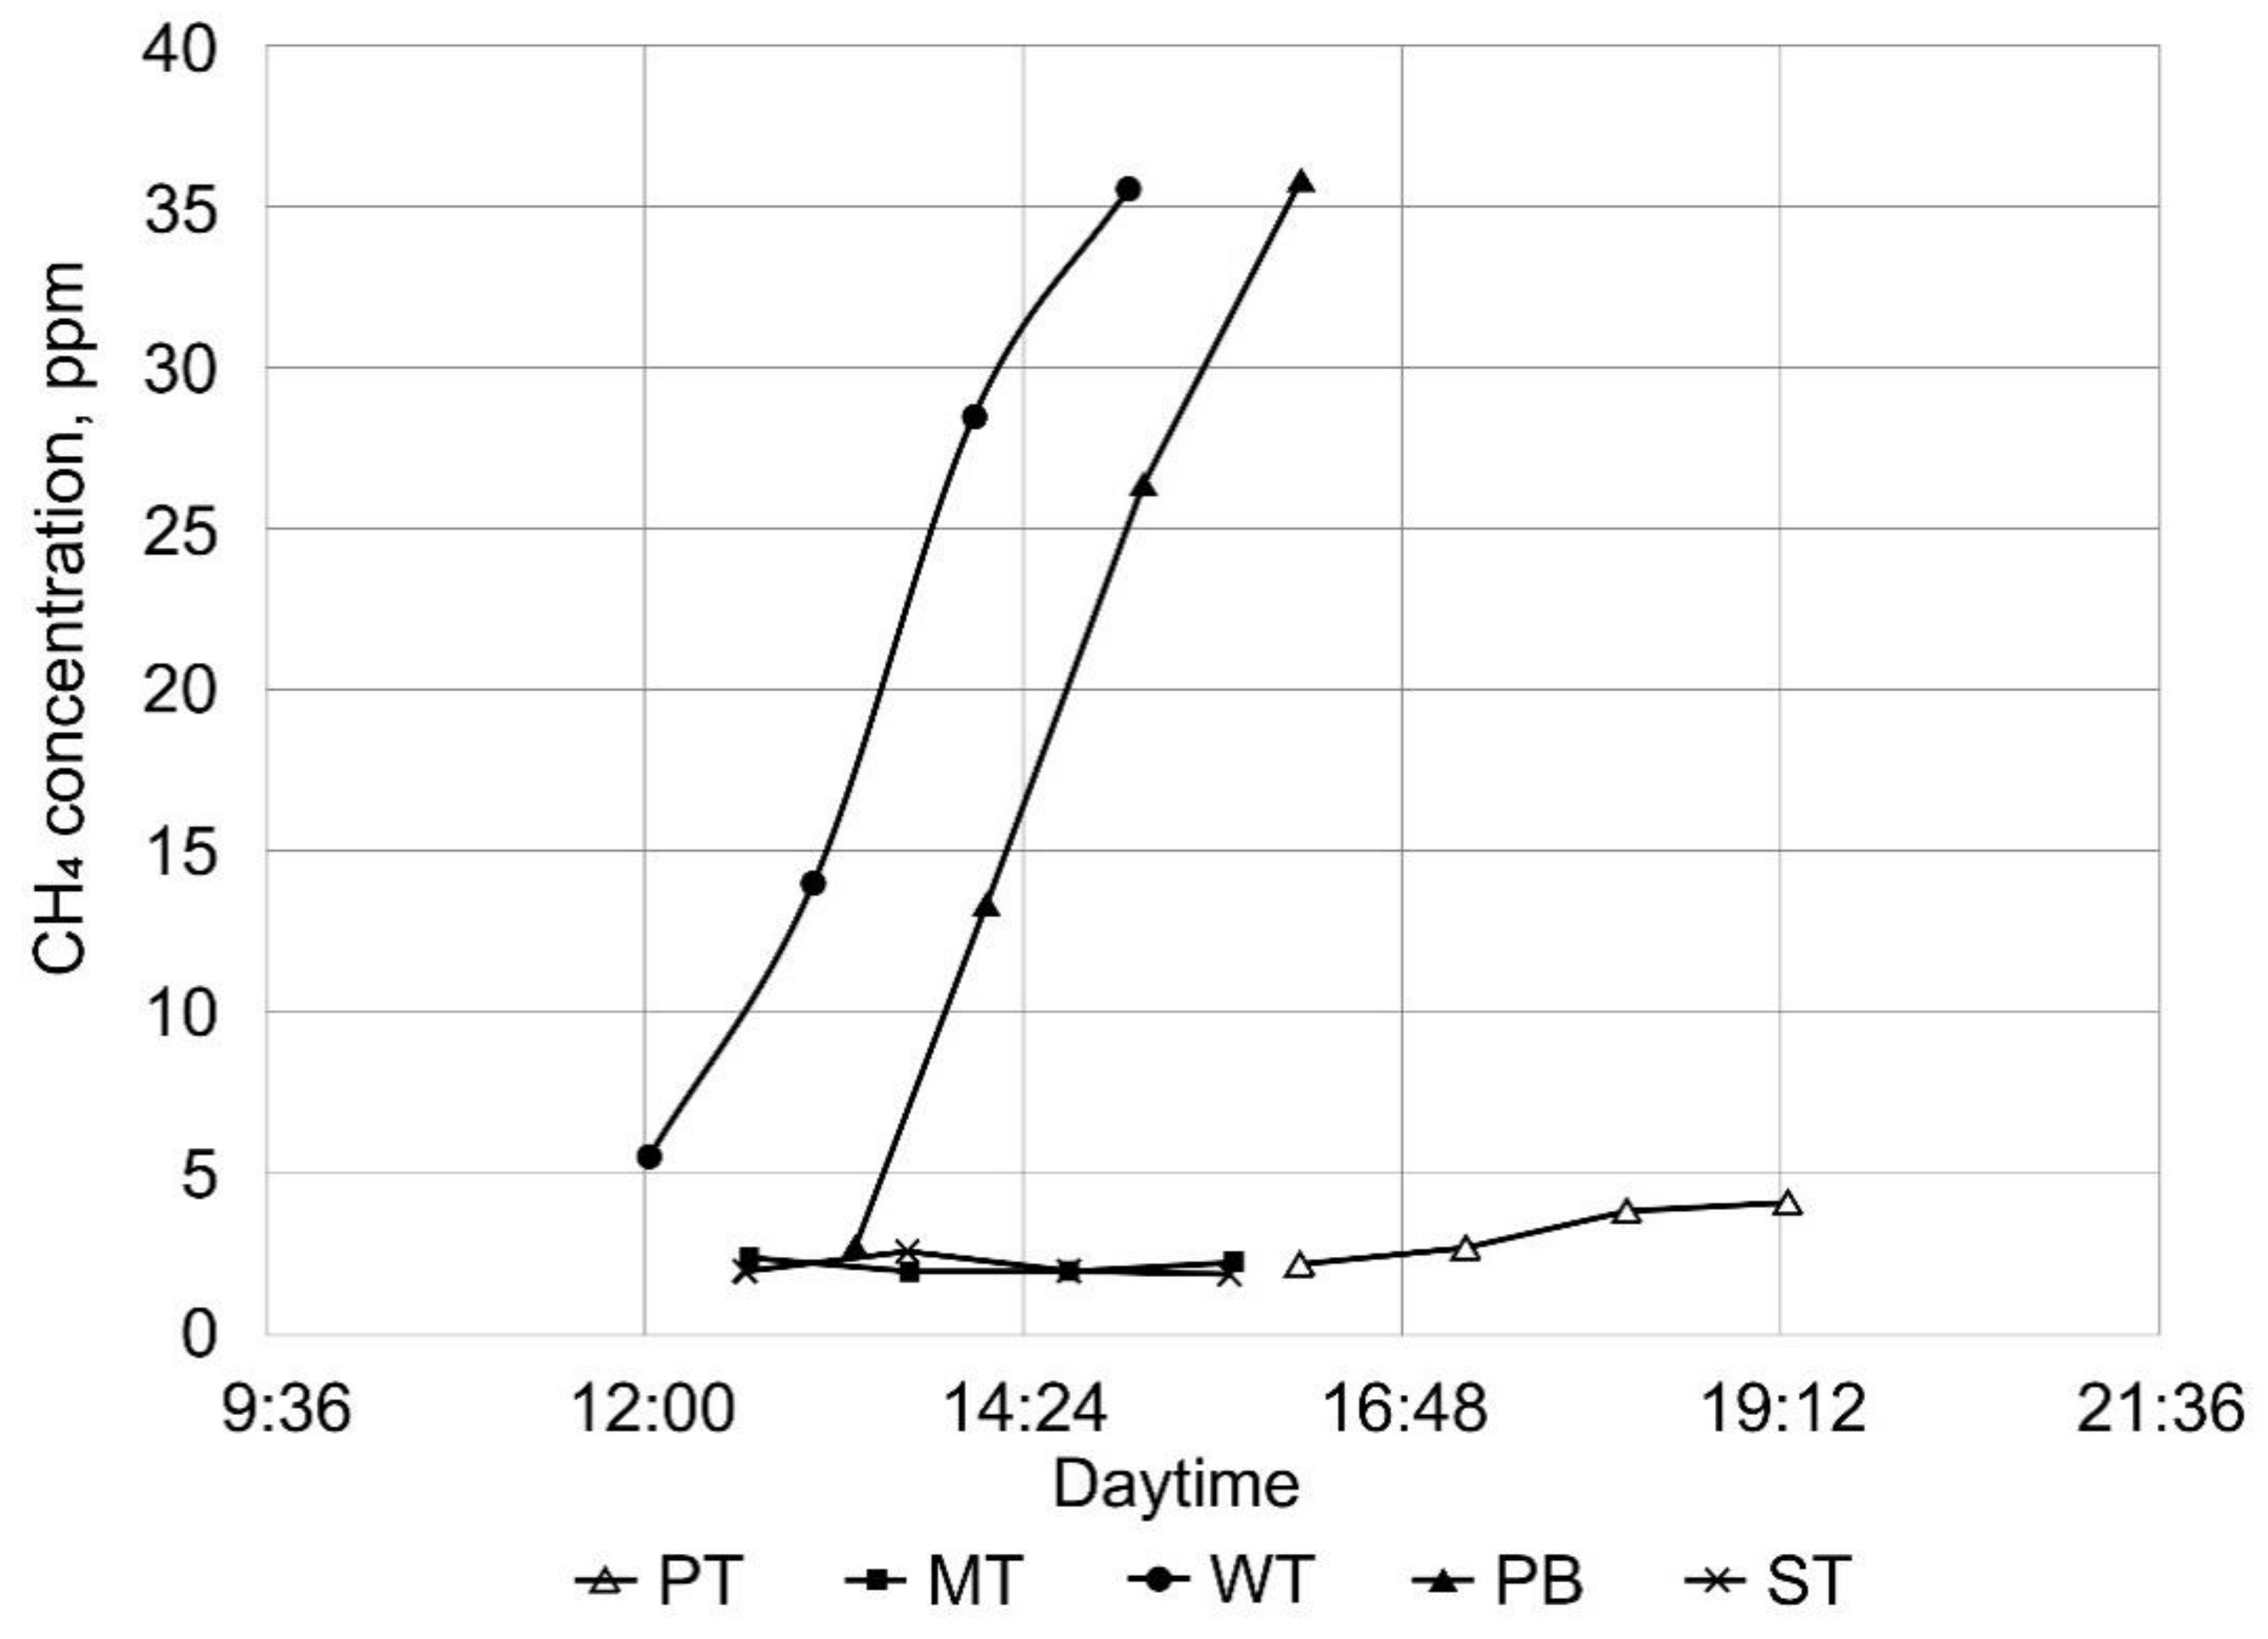
The graphs of methane accumulation in static chambers (
Figure 9) clearly show that there were two types of landscapes, in which methane emissions were significant: the water tracks landscape (WT, site 4) and the peat bog landscape within the floodplain of the Marre-Yakha River (PB, site 36). For WT, the maximum measured values of the methane flux reached 2.6 ± 0.9 mg (CH
4) * m
−2 * h
−1; average values for this landscape were approximately 1.5–1.7 mg (CH
4) * m
−2 * h
−1. For the PB landscape, the maximum methane flux was 2.5 ± 0.3 mg (CH
4) * m
−2 * h
−1 (
Figure 10); average values of the methane flux here varied from 0.9 to 1.8 mg (CH
4) * m
−2 * h
−1. Approximately the same methane fluxes were measured by Euskirchen et al. [
14] in various ecosystems of Alaska in the continuous permafrost zone. For the Subarctic region (Abisko, Sweden) with discontinuous and sporadic permafrost, methane fluxes are 3.8 mg (CH
4) * m
−2 * h
−1 [
2], which is more than two times higher than values obtained during our study.
In the water-filled ice-wedge trough (the PT landscape), the maximum methane flux reached 0.6 ± 0.2 mg (CH4) * m−2 * h−1. In dry and moist landscapes MT, PT (on the dry surface of the polygon center), and ST, methane fluxes did not exceed 0.2 mg (CH4) * m−2 * h−1.
Our measurements of methane fluxes in typical tundra are approximately 2.5 to 5 times lower than those obtained in southern tundra on the floodplain of the Kolyma River [
45].
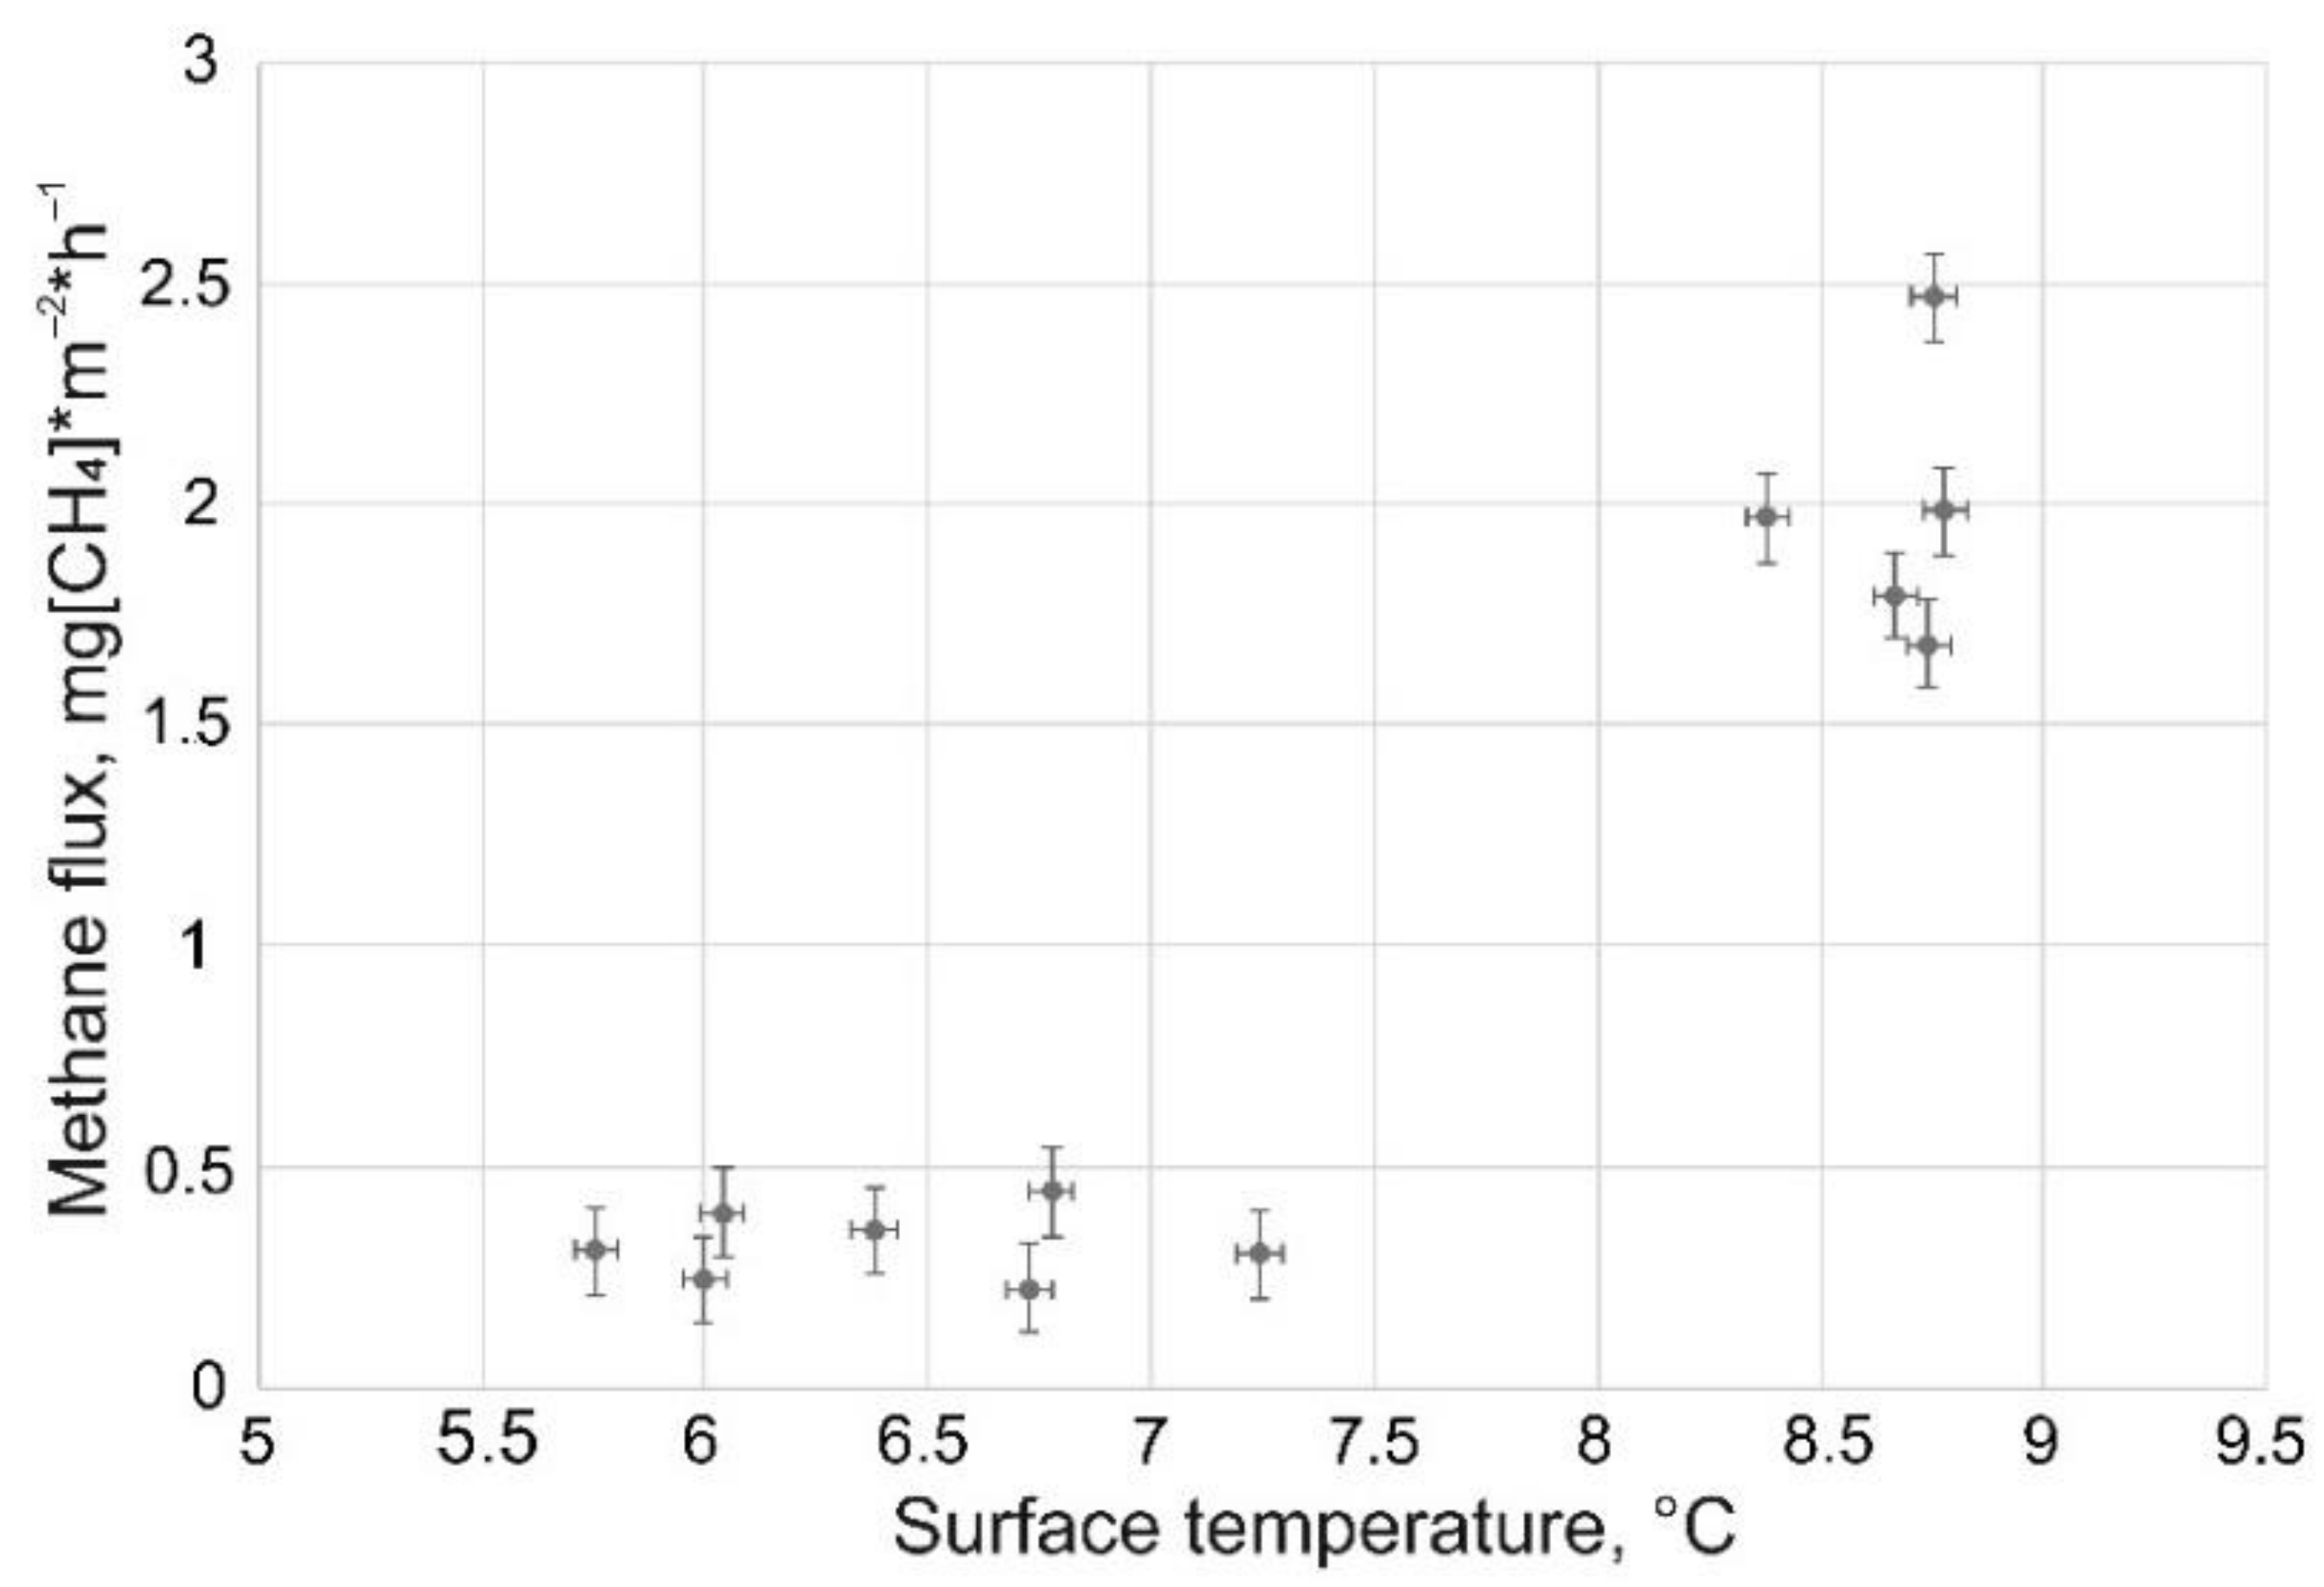
The flow of methane increases with increasing air temperature. This trend is obvious only for landscapes with a relatively high methane flow, like the peat bog landscape within the floodplain (PB, site 36). An increase in the surface temperature from 5.5 to 9.0 °C led to an increase in the methane flux by 4 to 5 times (from 0.3–0.4 to 1.7–2.4 mg (CH
4) * m
−2 * h
−1) (
Figure 10). The increase of methane fluxes with increasing surface temperatures is nonlinear, which generally corresponds to the diffuse mechanism of emission.
Thus, relatively high values of methane fluxes have been observed only in the landscape of water tracks (WT, site 4) and the peat bog landscape within the floodplain (PB, site 36). We presume that similar values of methane fluxes may be expected in the lake basins landscape (LB, site 44). In all other landscapes of typical tundra of Western Yamal, methane fluxes are negligible and may not be taken into account in estimates of carbon balance.
5. Conclusions
Based on our studies in the Marre-Sale area, we have obtained new reliable data on the methane content in the active layer, underlying frozen soils of the transition zone of the upper permafrost, and data on the methane emission into the atmosphere for the dominant landscapes of the typical tundra region of Western Yamal.
To analyze the spatial distribution of methane fluxes, a landscape map was compiled, and the plant species and vegetation cover characteristics were determined for the study area. The landscapes were classified according to the moisture conditions and degree of aeration of surficial sediments. The changes in sphagnum cover were detected: from 1978 to 2019, the average sphagnum height had increased from 2.0 to 5.5 cm, and the projective cover had increased from 14% to 29%.
The highest content of methane in soils was measured in the landscapes of the peat bogs within the river floodplain (PB) and the wet surface of water tracks (WT). The average methane content here was approximately 1.36 mL (CH4)/kg, with maximum values up to 3.6 mL (CH4)/kg). For landscapes of the moist surface of polygonal tundra (PT) and saturated tundra (ST), the average values of methane content were approximately 0.14 mL (CH4)/kg. The lowest methane contents in soils of the study area were characteristic of the landscapes of moist tundra (MT), well-drained tundra (WDT), and sand fields (SF).
The analysis of the methane contents distribution with depth showed that the methane contents in the underlying frozen soils of the transition zone is 2- to 5-times higher than in the soils of the active layer. An increase in the methane contents in the transition zone is explained by intrusion of methane into the underlying layers during the fall freezing. Due to the high content of methane in the transition zone, it should be considered as a significant source of methane, which can be involved in emission of greenhouse gases into the atmosphere during permafrost degradation.
Peak values of methane fluxes into the atmosphere for all dominant types of landscapes of typical tundra were determined, and stable significant fluxes were observed for sites 44 and 36, which had the highest methane contents in the active layer. The maximum value of methane flux of 2.6 mg (CH4) * m−2 * h−1 was measured for the landscape of the water tracks (WT). For the landscape of peat bogs within the river floodplain (PB), the methane flux was 2.5 mg (CH4) * m−2 * h−1. At other landscapes, the maximum methane fluxes did not exceed 0.2–0.6 mg (CH4) * m−2 * h−1. According to other studies, sources of methane emissions into the atmosphere occupy approximately 45% of the total area of typical tundra.

 ,
, 


