1. Introduction
Water erosion is one of the main factors of soil degradation and decrease of the arable land capability. It leads to the formation of long gullies, the loss of soil layers, and the removal of significant areas of agricultural land from crop rotation [
1,
2,
3,
4].
The study of erosion processes and erosive relief is a very popular topic of research. This is due to the urgency of this issue, creating a breadth of directions and opportunities for a variety of studies. Dynamics of natural conditions, especially humidification, the increase or decrease of anthropogenic load on the territory, and changes in individual components of landscapes determine a constant interest in the study of gully systems. Occasionally, there are works on the classification of erosive forms, description of separate types of gullies, and the functionality of gully systems in different agricultural areas [
1]. In particular, in connection with the development of science and technology in recent years, there are more publications on methods of study of erosion forms of relief, which are constantly being improved [
5,
6,
7].
Gullies represent an extreme degree of erosion. They are common everywhere. Thus, soil erosion by water is a problem throughout Europe [
8]. The annual washout of soil from arable lands in the non-black soil zone of Russia amounts on average to 10.6 tons/ha; in the Central Black soil (Chernozem) zone, it reaches 12 tons/ha; in Altai, it ranges from 2 to 42; in Western Siberia, it reaches 40–50 tons/ha [
9]. In Eastern Siberia, in particular in the Baikal region, in the second half of the 20th century, gully erosion and sheet erosion of soil covered up to 270,000 ha [
10]. A total of 9576 gullies over 250 m long have been registered in the most developed steppe, dry, and forest-steppe regions. According to some estimates, the total length of the gully network in Buryatia is 8700–9000 km [
11,
12].
The study of gullies in the Selenga middle mountains in general and those located in the Kuitunka river basin, in particular, has been conducted in various directions for over half a century. The study of loose deposits can be found in deep erosion forms on the right flank of the Kuitun valley, with an accompanying description of the fossil fauna carried out by D.B. Bazarov [
13]. The general description and characteristic of the gully network of the territory in different years was carried out by Vasiliev et al. [
14] and Tarmaev et al. [
15]. Paleogeographical reconstructions of the natural environment in Pleistocene with the involvement of fossil fauna materials from sections of loose deposits exposed by gullies in the Kuitunka River basin were carried out by Kobylkin [
16], Klementyev [
17], and Kalmykov et al. [
18]. The first date records on fossil fauna remains (Bison priscus Bojanus skull, 1827) found outside archaeological sites in Transbaikalia are also made on material originating from a gully of this territory [
19]. On the basis of the study of soil-sedimentary series on the described territory, the main stages of soil formation in the Selenga middle mountains were established [
20,
21,
22].
Today, the research on erosion processes in the Selenga middle mountains is complicated by the peculiarities of the natural and climatic situation. The main feature of the modern climate is the strengthening of the global climate since the second half of the 1970s. Warming is most strongly pronounced on the territory of Russia [
23]. The territory of Transbaikalia has a significantly higher growth rate (2.5 times) of surface air temperature [
24]. We have established that since the 1970s, the warming rate in Ulan-Ude has increased to 0.36 °C/10 years; in Novoselenginsk it has increased to 0.18 °C/10 years; and in Kyakhta, has increased to 0.16 °C/10 years [
25]. Long-term precipitation variations have a pronounced cyclicity [
26], with the last dry phase starting in 1999 [
27]. Climate change intensifies land degradation processes, which are widespread in the steppe landscapes of Buryatia, where the anthropogenic component of desertification is stronger due to their greater economic development. Long-term drought and, as a result, low precipitation, both in winter and summer [
28], has led to a slowdown and decay in the growth of gullies.
Under such conditions, recording a slight growth in the area of lands subject to erosion using traditional methods is often inefficient, which cannot be said about surveying with UAVs. The main objective of the study is detection of the scale and rate of modern erosion processes, occurring in conditions of the next climatic stage of precipitation reduction, alongside the fixation of erosion forms of grassy and shrub vegetation. In the context of the rapid development of science and technology, the study of natural processes can be carried out more effectively, having ample opportunity to develop and implement new methods and technologies.
This paper presents the results of the complex study of the erosive forms of relief, including their dynamics and current state, with the use of the newest surveying equipment. The currently used methods of quantitative evaluation of gully formation have a number of drawbacks; mainly, these are its relatively low information value and efficiency. Thus, when using the most widespread to date linear method of benchmarks, significant errors occur due to the inaccurate localization of the measuring tape at the gully rim. During tacheometric survey, errors occur due to the discreteness of surveying via tacheometrical traverse being formed from straight sections, and the obtained “image” of the gully does not fully correspond to the actual, natural one. Errors are inevitable when surveying with high-precision GPS equipment due to again inaccurate localization of the GPS receiver on the gully rim. It should also be noted that ground-based survey methods (theodolite, tacheometric, using GPS equipment) are not always efficient.
Aerial and space imagery materials are now widely used to obtain reliable and up-to-date information; however, the fleet of aerial survey carriers is steadily decreasing as high economic costs of aircraft maintenance and fueling lead to the higher cost of final products and make their use in a number of works, such as small area surveying, unreasonable.
Modern space imagery methods are distinguished by their operational efficiency and high level of automatic performance, which allows receiving satellite data in a rather short time (1–2 weeks from requesting to receiving data). However, space imagery, despite the declared annual cost reduction for final products, still remains quite expensive. Thus, an archived five-year-old ultra-high resolution image (0.61 m) from QuickBird satellite, covering an area of 25 km2, costs about 600 USD. Satellite systems, working in real-time survey, are extremely expensive. There are also the difficulties in the prompt acquisition of initial observation data for specific regions (based on cloudiness, illumination, spatial resolution, space launchers orbital passage, etc.). Available Google Earth, SAS.Planet satellite mapping Internet services do not fully satisfy users in large-scale satellite material due to the insufficient speed of its updating.
Laser scanning and unmanned aerial vehicle (UAV) imagery are completely devoid of all these deficiencies. High-accuracy laser scanning systems, which allow receiving from several tens to hundreds of thousands of samples in one second, are very expensive and do not have sufficient operational efficiency as opposed to aerospace systems due to the labor-intensive processing of large amounts of source materials. The intermediate position between ground and aerospace imagery for the purpose of local monitoring of small territories according to the “efficiency–cost” criterion is occupied by imagery based on remotely operated UAV, which provides operations at extremely low altitudes and is much more cost-effective in comparison with traditional aerospace vehicles. The main advantages of UAV imaging are as follows: (1) high accuracy; (2) low cost of flights; (3) high productivity; (4) increased resource; (5) mobility and operational efficiency, maintenance ease; (6) automatic control (controlled from a pad or smartphone using a radio channel); (7) independence of use; (8) space efficiency (fits in a small case), availability of removable modules; (9) no need for specially equipped aerodromes, the possibility of takeoff and landing in a limited area; (10) possibility of low-altitude imaging under the clouds on cloudy days; (11) a simplified scheme of obtaining flight permits; (12) low vibration level, and noiselessness [
29,
30,
31,
32,
33]. In addition, UAVs are widely used in the study of ravines [
34,
35,
36].
The purpose of this work is to quantify the spatial and temporal variability of the model section of the gully in the Lower Bulanka Depression as a result of erosion processes with the help of modern means and methods of aerial surveying using the UAV board. For this purpose, a number of field expeditions were carried out in the summer–autumn periods of 2016–2018; high-precision multi-temporal digital elevation models (DEM) of the model section were created; borders, areas of logging displacement, and ravine volume changes were determined.
So, the paper presents the results of the quantitative evaluation of spatial and temporal variability of borders and volumes of the model section of the gully in the Nizhnyaya Bulanka depression with the help of modern means and methods of aerial imaging from the UAV board. Thus, in the summer–autumn periods of 2016–2018, a number of field expeditions were conducted [
37]. To assess the gully formation dynamics, high-precision multi-temporal digital elevation models (DEM) of the gully model section were created. Boundaries, rim displacement areas, and changes in gully volumes have been determined. The complex analysis of paleo-geographical aspects and the modern state of the nature of the territory has been carried out.
2. Research Area
Bottom gullies in intermountain depressions represent a peculiar chronicle of natural settings of the past and at the same time demonstrate the full course of modern exogenous geological processes. The study of large erosive relief forms allows establishing the paleo-geographical situation of the past as a whole, to reveal features of morpholithogenesis, pedogenesis, flora and fauna of the territory, etc. The majority of the bottom gullies are characterized by the longevity of their existence. These are, as a rule, elongated relief forms, with side tributaries and attached gullies, where both erosion and accumulation processes are actively manifested. Therefore, their study, including the use of the newest methods, is of great interest in terms of revealing the direction and intensity of various exogenous processes.
The study was conducted within the Kuitun intermountain depression. This area is a small intermountain basin in the central part of the Selenga middle mountains in the Kuitunka river basin. The basin itself is heterogeneous in relief character, and it is relatively isolated from the surrounding territory by the spurs of the Tsagan–Daban ridge (with absolute heights up to 1200 m, here and further, the Baltic height system is used). The heterogeneity is characterized by two main depressions, where the valleys of the Kuitunka and Kunaleika rivers are located, and numerous associated depressions. The heterogeneity of the relief is also expressed in the fact that slopes with a steepness of 0–3° occupy 655.2 km
2 (54.6% of the study area), 3–5°—181.2 km
2 (15.1%), 5–7°—140.4 km
2 (11.7%), more than 7°—187.2 km
2 (15.6%). The initial data for topographic modeling of the morphometric characteristics of the relief is the digital elevation model SRTM (Shuttle Radar Topographic Mission) [
38].
Geologically, the study area is part of the Kuitun Meso-Cenozoic depression. The gully in the bottom of the depression uncovered native rocks, granites, which lie at a depth of 5–10 m. The rocks are covered with a low-power weathering rind. The loosened sediments in the Lower Bulanka section up to 10 m thick were previously described [
22]; they are of quaternary age and are represented by sand and clay loams. The sediments have mixed genesis; aeolian and proluvial–deluvial predominate. The particle size distribution and structure of thicknesses determine their exposure to erosion.
The features of the relief, light granulometric composition of loose sediments and the erosion–denudation activity of temporary watercourses contributed to the development of a large number of well-expressed erosion formations of the slope type and a significant number of negative relief forms of the bottom type (hollow-gulch subtype), which are box-shaped [
16,
20,
39].
The Kuytunka river basin is characterized by a moderately dissected relief. Relatively flat surfaces adjacent to floodplains and low terraces of the Kuitunka, Kunaleika, Tarbagataika, and other small rivers occupy only 35% of the territory. These areas are zones of aggradation. The rest of the territory is a combination of mountain spurs and depressions with surface slopes from 15° to 35°. In these conditions, the relief of the gully is formed in all cases; therefore, each paddy has elongated erosion forms, which are up to 7–9 km long and have numerous side tributaries. Such gullies have a long history of development during which downcutting phases were replaced by the filling of erosion forms, which is clearly visible in the sediments of the bottom gullies. However, most of the hillside gullies were formed due to the human activity, when there was active ploughing in the 20th century. The hillside gullies were formed on the sediments of light granulometric composition. The composition of sediments is the second reason for the intensive development of water erosion.
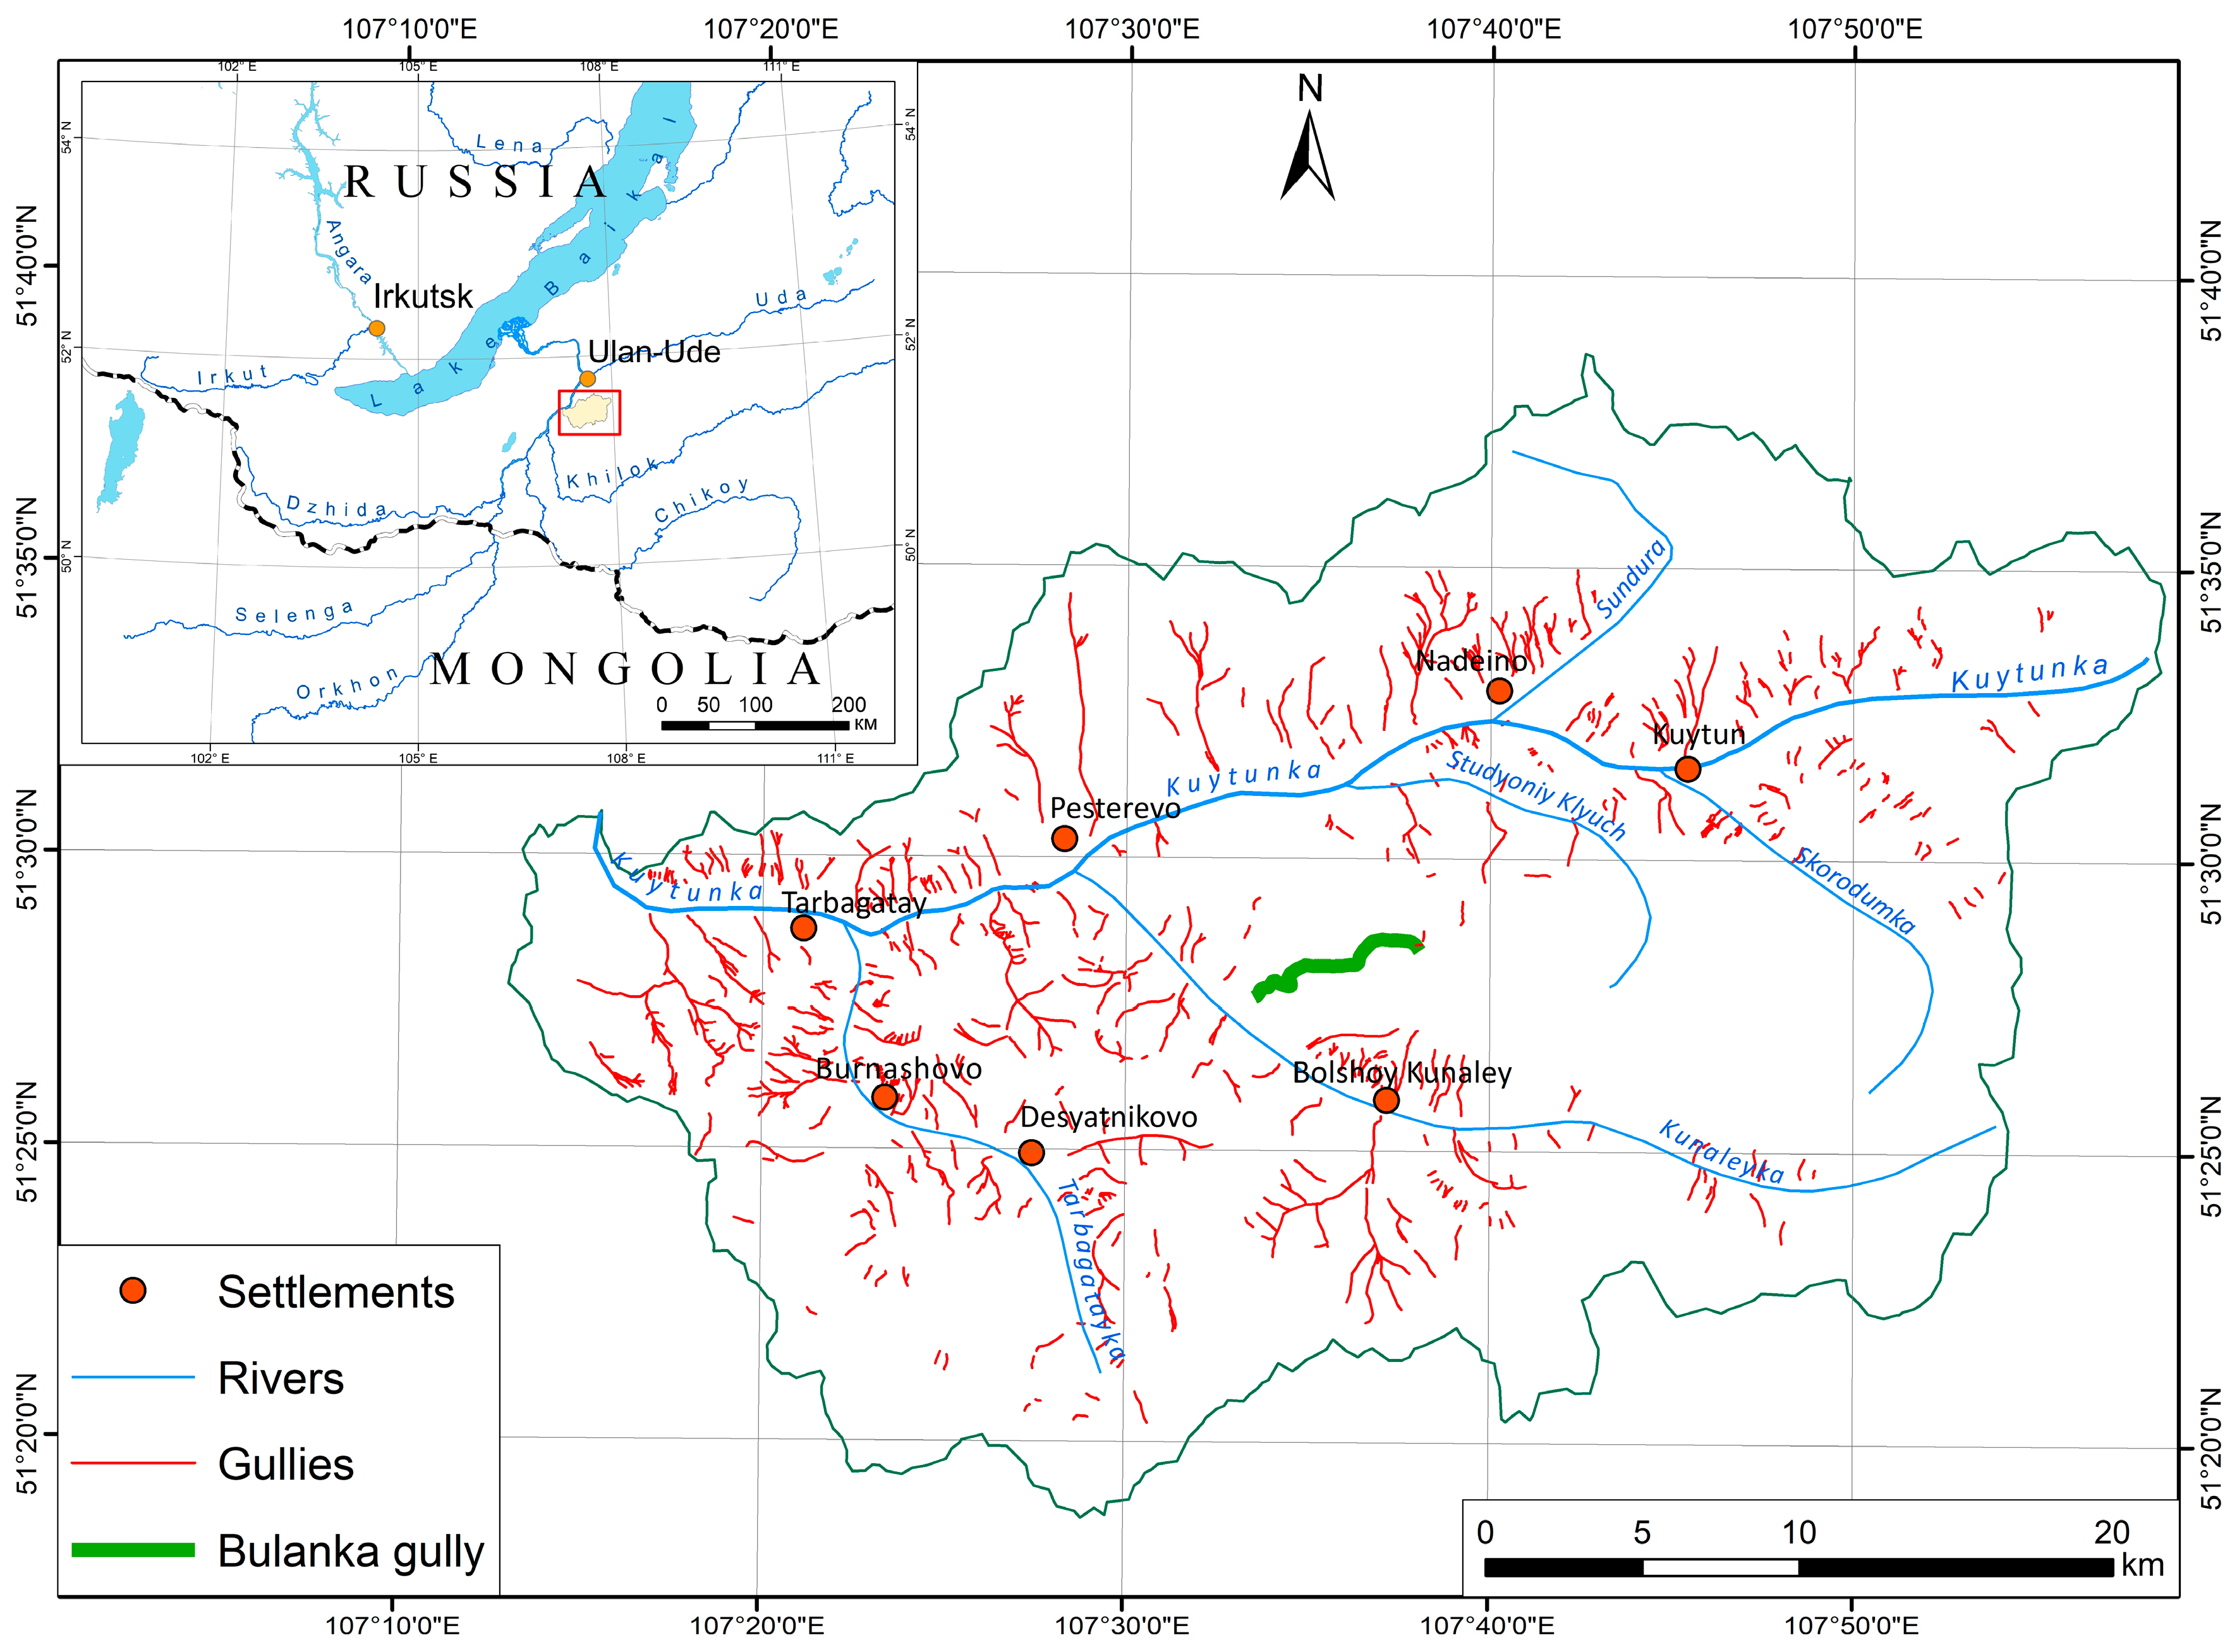
Interest in the study of erosion processes in the Kuitunka river basin is related, among other things, to the high density of the gully network. Thus, 210 gullies are marked on the map compiled with the help of satellite data of high resolution (imagery of Landsat, Sentinel, Google Earth data) (
Figure 1). The total length of the gully network is 202.5 km. Thickness of erosive separation for the whole basin is 0.18 km/km
2.
An example of such erosive forms within the study area is the bottom gully in the Nizhnyaya Bulanka [
40] depression located in the basin of the Kunaleyka river 2 km north of the Bolshoi Kunaley village (Tarbagatai region of the Buryatia Republic) (
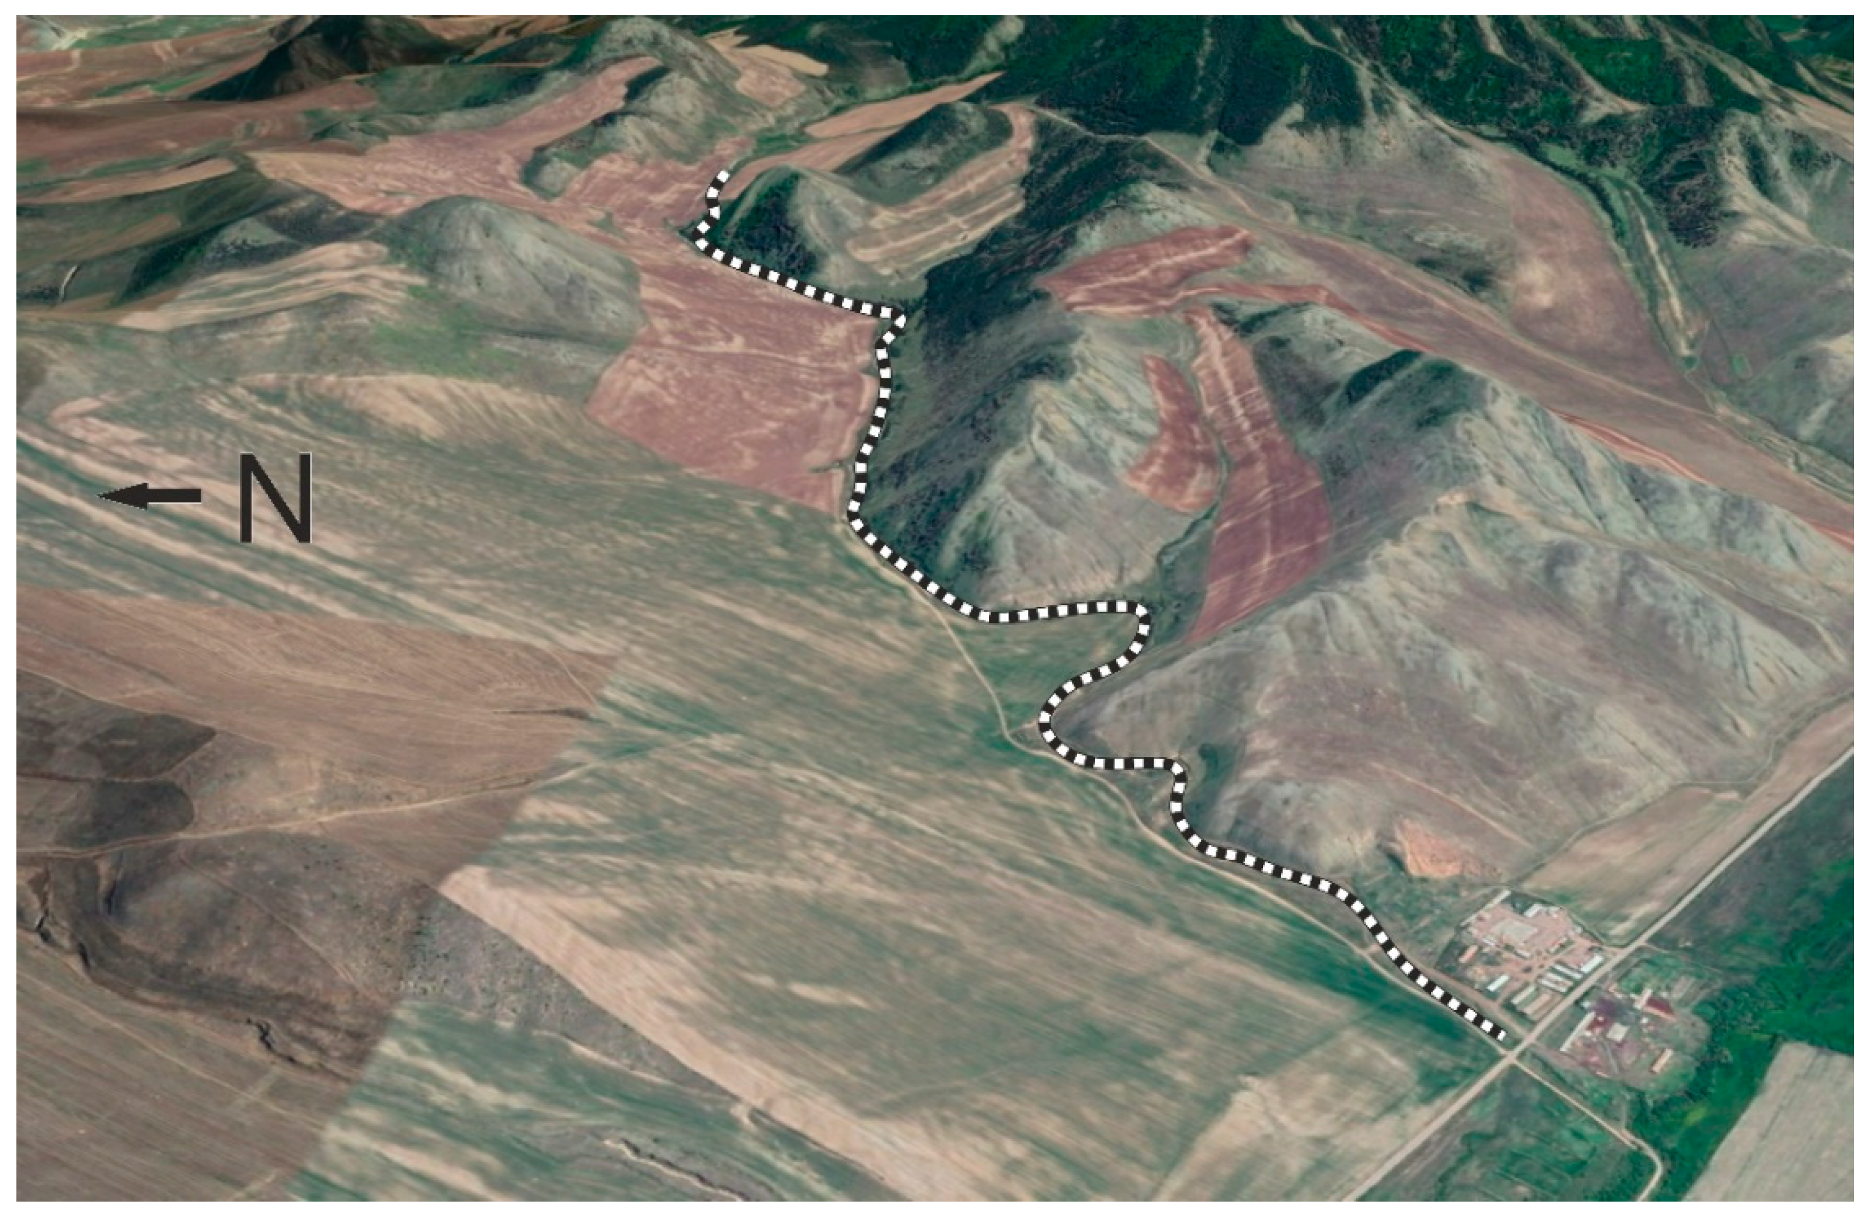
Figure 1). The Nizhnyaya Bulanka depression is one of the intermountain depressions in the eastern spurs of the Tsagan-Daban Range with absolute heights within the bottom of the depression ranging from 750 m in the upper part of the depression to 680 m in its mouth. Absolute heights of the ridges separating the depression from the Kunaleyka river valley are 950–1000 m. The length of the depression from west to east is 6.1 km, while the width along the flanks is from 700 m in the upper part to 1.5 km at the mouth. The depression is asymmetric: the right flank is elongated, the lower part is slightly sloping, the middle and upper parts are steep (surface slopes are within 8–30°), and the left flank is steep (up to 45°). In the bottom of the depression, there is a gully formed by the activity of temporary channel watercourses (
Figure 2).
This area is characterized by specific features of erosive-accumulative processes. The composition, structure, and character of the loosened sediments exposed by the gully at full capacity speak of numerous shut-ins and fillings of erosive forms, which probably existed here for a long time. Buried soils, horizons containing faunal remains, and other evidence of multiple changes of environment by nature are exhibited in the sediments [
13]. The gully is marked on the topographic maps of 1911 of the Military Surveyors Corps of the Russian Imperial Army [
41], and its length, location in the relief, and the nature of erosive processes indicate that it is a natural catchment of the Lower Bulanka Depression and appeared long before the active agricultural development of the territory.
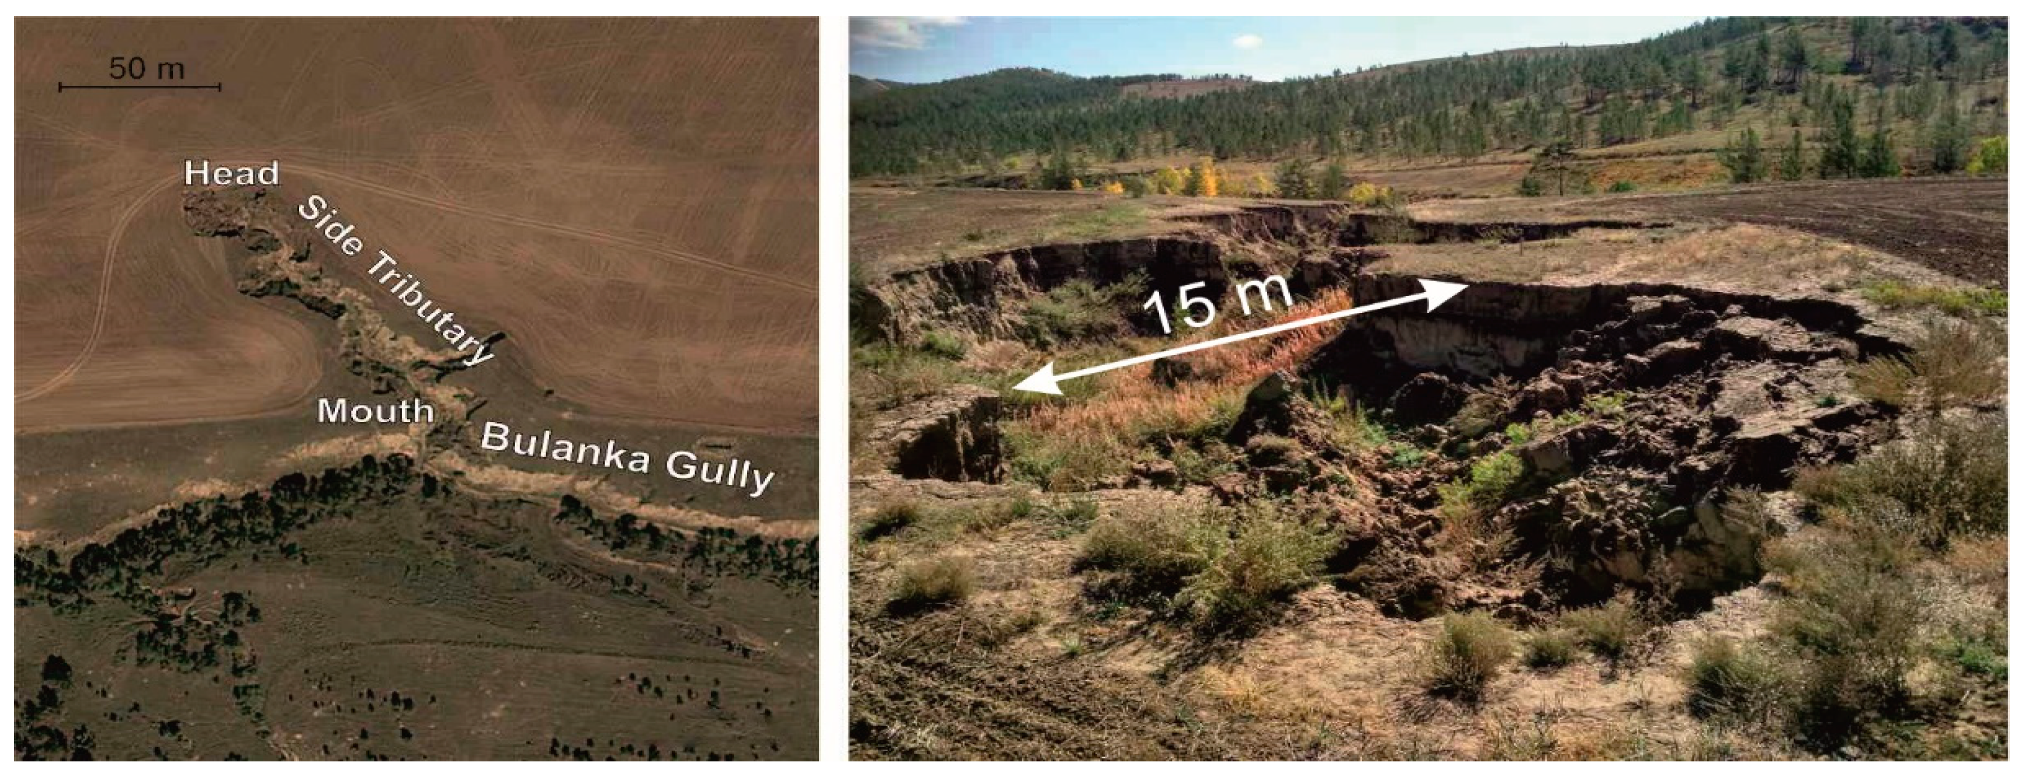
To observe the dynamics of erosion processes in the warm seasons of the year (2016–2018), a key section was chosen as a model—the 139 m long, side tributary of the gully of the Nizhnyaya Bulanka depression, with the absolute heights of the mouth and top parts of 698.7 and 700.6 m, respectively; the slope along the valley bottom is 0.8° on average (
Figure 3). The maximum depth and width of the investigated relief form is 10 and 27 m, respectively. In the mouth part (51°28′16″ N, 107°35′14″ E), a section of loose sediments containing soil-sedimentary series was opened, which served as a material for the study of paleo-geographical settings, in particular, soil formation in the Holocene, with the correlation of data on the composition and structure with the existing in the basin of the Kuitunka River support sections (including the section of the Nizhnyaya Bulanka [
20].
4. Results and Discussion
At the first stage of research, in order to detect the dynamics of erosion processes at the key gully in the Nizhnyaya Bulanka depression, the multi-temporal tacheometric survey was performed on 3 July 2016 and 24 June 2017. As a result of data processing, the electronic versions of topographic maps were obtained. Morphometric characteristics of the gully (length, width, and area) were calculated. The area of the gully has increased by 50 m
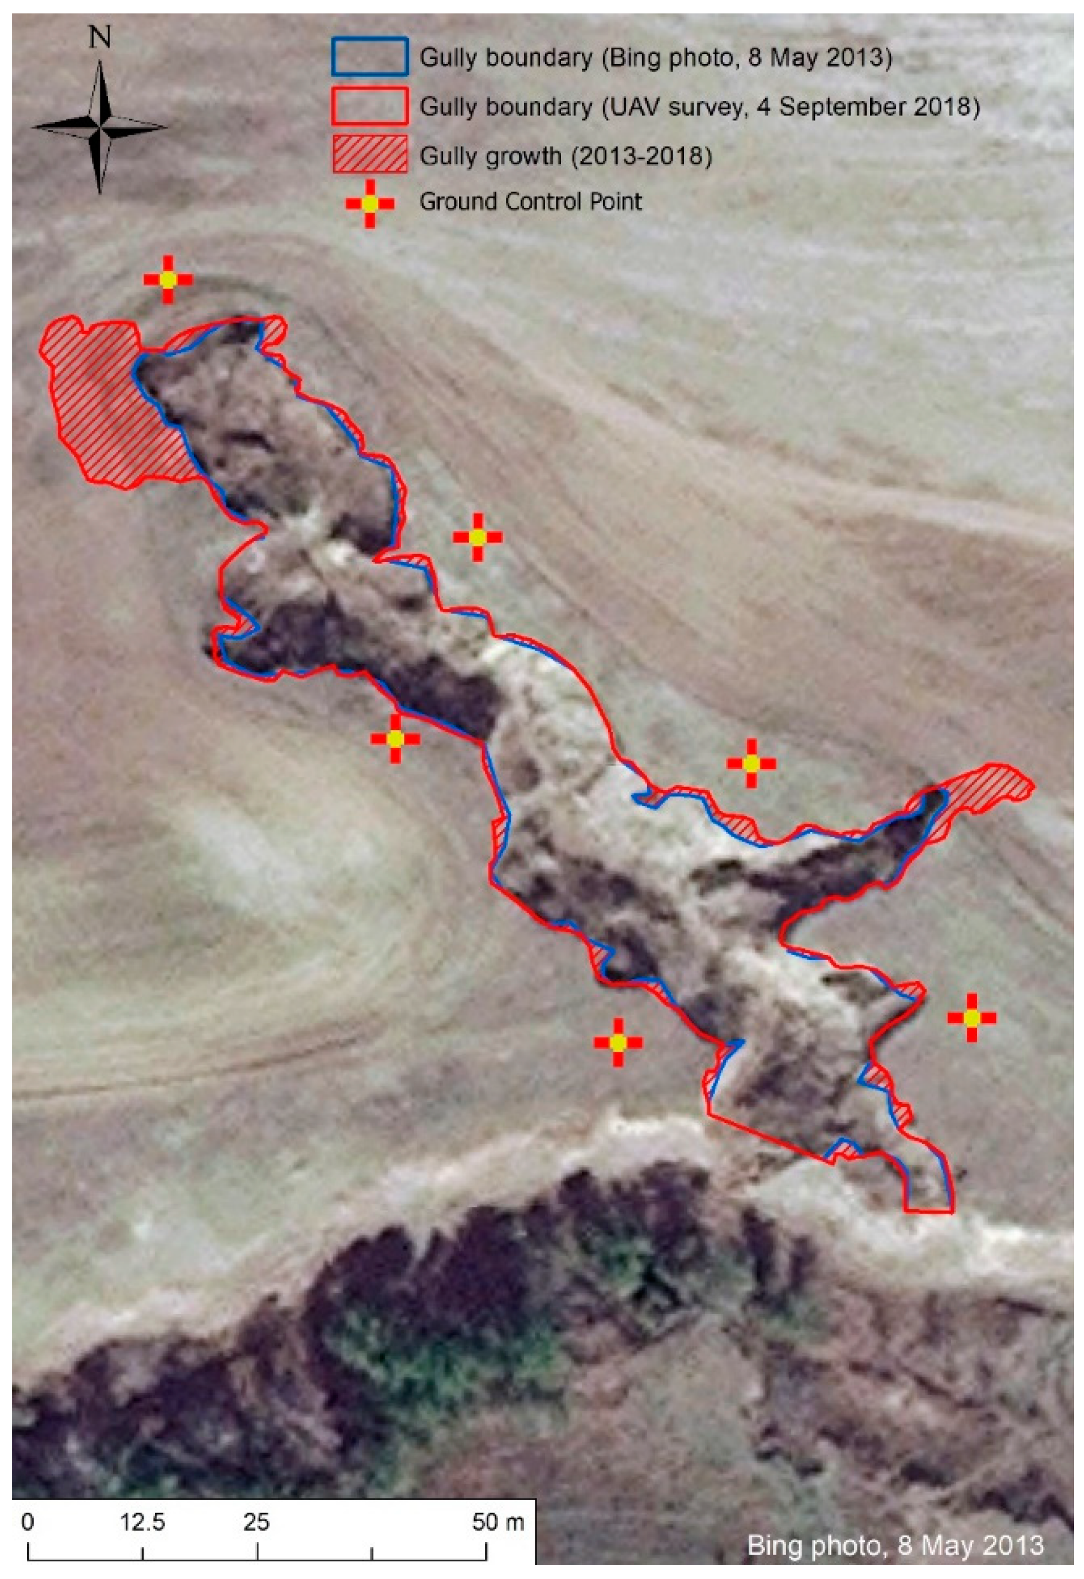
2. As a result of comparing the space image of the Bing Internet service (spatial resolution 0.61 m) dated 8 May 2013 with the orthophotomaps obtained from the UAV board on 4 September 2018, it was determined that within 5 years, the gully head increased by 196 m
2, and in the estuary zone, it had increased by 41 m
2 (
Figure 4). Thus, topsoil losses are 3.18 and 0.67 t/ha, respectively. Annual topsoil losses at the top of the gully reach 0.64 t/ha, and at the mouth, they reach 0.13 t/ha. On this basis, the total annual topsoil loss due to the growth and development of Bulanka gully reaches 0.77 t/ha. It should be taken into account that it is incorrect to compare this space image with UAV orthophotomap (resolution 1.24 cm/pixel), but the authors have no other information about the gully for previous years. However, a general pattern of gully boundaries extension can be traced on received maps.
In the course of further research, high-precision multi-temporal orthophotomaps and a DEM of the gully were created based on the UAV imagery. The surveying dates are 10 October 2016, 25 June 2017, 7 September 2017, and 4 September 2018. One height of 30 m was set to achieve high spatial resolution and the same survey conditions. Orthophotomaps with boundary vectors and DEM with a spatial resolution of 1.24 cm/pixel were obtained. Different color rendering on orthophotomaps images is connected with different survey times.
Approximately in a year, the change of the gully rim projection area to the horizontal plane was 47 m
2 (
Table 1) (compare with the results of multi-temporal tacheometric survey processing, where the gully change is 50 m
2).
Since digital elevation models were obtained at the nodes of the regular grid, the volumes were determined by the discrete integration of height values relative to the gully bottom (gully depth) with subsequent multiplication by the pixel dimension. The gully has increased in volume by approximately 1452 m
3 over 1 year and by 2112 m
3 over 2 years (
Table 1).
Orthophotomap and DEM accuracy assessment is taken from Agisoft PhotoScan software processing reports. Here is the average error of the camera location from 25 June 2017, m: X = 0.596; Y = 0.434; Z = 0.341; total error (square root of the sum of error squares)—0.812.
Labor costs for surveying from the board of the UAV are much lower than the cost of tacheometric survey and, moreover, than the use of linear method of benchmarks. So, the aerial survey of the gully with ultra-high spatial resolution of 1.24 cm/pixel took 20 min and the tacheometric survey with the step of 0.5 m/3 h. Software processing of tacheometric and UAV data takes the same time—30 min, but at the same time, the tacheometric survey allows determining only the area growth of gullies, and aerial survey from the UAV is volumetric.
Under the conditions of drought observed in Transbaikalia over the last 20 years, the intensity of erosion processes has decreased significantly. Thus, according to the data of the “Tarbagatai” meteorological station, the flow of the river Kuitunka, which is formed within the study area, has decreased over the past 20 years from 0.018 to 0.005 km
3. However, the presence of extreme natural meteorological phenomena disturb the dynamic balance of relief forms and determine the erosion acceleration. Such phenomena include heavy thunderstorms, continuous heavy rainfall, and abrupt warming, which is often accompanied by rain and causing rapid snow melting or soil thawing. Overlapping of these phenomena in time and space leads to particularly large changes [
40].
Evidence of the stormy nature of precipitation is the increased amount of precipitation, which contributes to the active development of water erosion processes. It was found that 100% snow cover within the gully surface in 2016 and 2018 was observed until mid-April, and the snow depth was 60 cm in 2016. In summer and autumn of 2016–2018, concentrated precipitation was observed. The number of days with heavy rains for 2016–2018 is equal to 15. The average annual amount of precipitation for the meteorological station in the settlement of Mukhorshibir is equal to 317 mm, and within the gully area, it is equal to 459 mm for 2016 and 2017. Thus, the highest intensity of erosion processes on the territory under the current climatic conditions is associated with extreme rainfalls.
The limiting factor in the development of erosion is the fixed nature of erosive forms by vegetation. Bottom gullies, which have been existing for a long time in the Selenga middle mountain gullies and depressions, are gradually overgrowing, reaching their maximum development. On the surfaces previously exposed to erosion and accumulation processes, the formation of soils is started. If the periods of cutting and subsequent filling alternate millennia, buried soil horizons remain in the sediments.
To clarify the chronological framework for stabilizing the erosive form, soil and geobotanical studies have been conducted. The analysis of the soil cross-sections laid on different relief elements, including the gully in the Nizhnyaya Bulanka depression itself, shows the diversity of soil-forming processes and their significant duration in time. So, in the bottom of the gully, where erosion processes are already slowed down, a primitive profile is being formed, and soil-forming rock is located under the topsoil horizon. On the flanks of the gully, soil horizons that have different lengths are formed. This is primarily due to the lithology, as well as the difference in soil formation processes on different sides of the gully. Besides, two relict profiles of buried soil are marked in the walls of the gully at the depths of 150–164 cm and 180–204 cm. On the vertical wall of the gully tributary of the same gully, from the right flank, there are also buried topsoil horizons at depths of 105–135 cm and 205–275 cm.
As a result of the analysis of the chemical composition of soils selected in the immediate vicinity of the gully in the Nizhnyaya Bulanka depression, data on their composition and characteristics were obtained (
Table 2).
The soil composition is determined in accordance with the state standard (GOST) 26213-91; total absorbed bases according to GOST 26487-85; pH level to GOST 26423-85. The Kirsanov method was used to determine mobile compounds of phosphorus and potassium in the modification of CINAO—GOST R 54650-2011. The ionometric method was used to determine nitrates—GOST 26951-86.
It was found that the SOM content varies from 0.85 to 6.52% (
Table 2). Topsoil horizons are characterized by high and very high amount of absorbed bases, neutral and weakly alkaline reaction of soil medium, and a sufficiently optimal content of moving plant nutrition elements.
The SOM reserves are determined by a formula:
where Q—SOM reserves, t/ha; m—SOM content, %; h—soil horizon power, cm; dv—soil horizon density, g/cm
3.
The total content of SOM in the upper horizon of the soil (0–40 cm) with a volume weight of 1.4 g/cm3 is equal to 172.5 t/ha.
The gully under study washes away loose sediments in the bottom of the depression. It conditionally differentiates vegetation of the surrounding area on the forest and steppe florocenotypes: on the left, on the slopes of the rocky ridge, forest phytocoenoses represented mainly by pine forest formations; on the right, agricultural fields occupied by steppe florocenotypes. The left flank of the gully is more gentle and bears different successional stages of reforestation and forest formation. The top of the flank is covered with adult forest, while the middle part is terraced and covered with shrub vegetation, which has a fixing flank strengthening function. The right flank is characterized by sharp steppe walls with fragments of steppe vegetation. Close to the top of the flank, there are inclined agricultural arable fields sown with wheat. The edges of the gully have preserved the steppe communities of sod and grass-steppe florocoenotype. The bottom is the most humidified part of the gully: it is covered with meadow vegetation, and it is composed mainly of legumes, due to the demolition of their seeds by storm runoff from agricultural fields. The degree of the gully’s overgrowth and the spread of woody and bushy vegetation over the talweg indicates stabilization of the erosive form. Active erosion processes currently occur in the gully in the Nizhnyaya Bulanka Depression in side tributaries. The main gully serves only as a channel for material transport.
Considering the comparative similarity of the relief, the lithology of loose quaternary sediments, and natural and climatic conditions in the Kuitunka river basin, we can conclude that a significant part of the gully-draw network of the territory is characterized by similar features of erosive processes. The same can be said about some other small catchments of the Selenga middle mountains.
Erosion causes significant damage to the national economy, especially to the agriculture: the most fertile soil layer is removed from the fields, plant nutrition elements are removed, and the overall soil fertility is reduced. In this regard, the yields of crops on erosion soils are reduced by 20–50% or more.
Therefore, it is necessary to annually carry out soil-protecting agricultural measures (tillage with leaving of plant residues on the surface, cultivation across slopes and horizontally, stepped tillage; application of paraploughing, inter-row cultivation of tilled crops, snow retention); to introduce soil-protective crop rotations taking into account the relief and erosion features of soils; on slopes over 3°, in addition to agricultural anti-erosion techniques, to create a system of temporary and permanent drainage furrows.
On lands steeper than 1°, soil-protective crop rotations ought to be introduced everywhere. On slopes steeper than 3°, tilled crops should be excluded. On slopes with the steepness of 4–5°, it is necessary to cultivate crops of continuous sowing in combination with the sowing of perennial grasses and master the contour system of land reclamation. Fields steeper than 5° should be used in special soil-protective crop rotations with a high percentage of perennial grasses or taken away for gradual planting. In the conditions of the Baikal region, the farming system of the Selenga middle mountains is oriented toward a wider cultivation of crops capable of using July–August maximum precipitation, in particular, oats, barley, haylage, and grain crops and pasture management development.
Criteria and parameters for soil properties should be developed on the basis of which disturbed lands can be removed from the arable gore. The permissible level of soil erosion for the Baikal region can be determined based on the indicators of the International Union for Conservation of Nature and Natural Resources. According to these indicators of the SOM, losses should not exceed 0.15–0.30 t/ha per year [
12].
The development of agricultural activities associated with the intensification and plowing of slope lands requires the urgent development of effective anti-erosion measures that reduce fertility losses and increase the yield of cultivated crops. Activities in this regard are in progress. Thus, in 2017, plowing was carried out not along, but across the slope, i.e., in accordance with the approved technology of works for slope areas.
To control gully erosion, it is necessary to use hydrotechnical methods. First of all, this is the creation of atomizers of concentrated water mass flows, as well as the construction of water retaining walls with canals and shafts with wide bases [
48]. It is necessary to build a wide base shaft and a shaft with a canal in order to detain water flows in front of the gully top. The shaft with a canal is placed before the top of the gully; less often, it is on a slope. The canal should be 3.5 m wide at the top and 0.5 m wide at the bottom and 1 m deep. At the distance of about 2 m from the canal, a soil bank of 0.75 m high, 3 m wide on the base, and 0.5 m wide on the top is poured down the slope. The shafts with canals and shafts with a wide base should be sown with grass and planted with trees and shrubs to ensure their durability and a better retention of runoff water.
5. Conclusions
The gully in the Nizhnyaya Bulanka depression, which is its natural catchment, opens repeatedly redeposited rocks varying in particle size distribution and genesis, indicating the duration of this linear erosive form. Active erosion processes are observed in the gully’s side tributaries, the morphometry of which changes with the direction of increasing length and area. The longitudinal profile of the model section of the gully (side tributary) is not developed, and its growth continues, especially in the top part.
The gully under study, which is more than 7 km long, is fixed by the vegetation along the main riverbed. The species composition of the Cenoflora, its ecological, biomorphological, geographic, and arealogical structures indicate the duration of the gully overgrowth processes, which testifies to the stabilization of the erosive form in general. The general laws of vegetation distribution are traced depending on the location by mesorelian forms.
The use of the developed method for the estimation of erosion processes’ dynamics on the basis of analysis of multi-temporal orthophotomaps and DEM, obtained as a result of aerial surveying from the UAV board, made it possible to establish the increase of basic morphometric characteristics of the gully tributary. A similar picture is observed in all side gully tributaries in the Nizhnyaya Bulanka depression.
The SOM content of the opened horizons of soils in the Bulanka gully varies from 0.85 to 5.39%. Total SOM reserves in the accumulative horizon of soil reach 162.5 t/ha. Annual losses of SOM from the gully growth and development are 0.77 t/ha, which is higher than the criteria (0.15–0.30 t/ha) established for soil systems by the International Union for Conservation of Nature and Natural Resources (IUCNNR).
Hydraulic methods should be used to control gully formation. The proposed complex methodology for analyzing the dynamics of gully formation made it possible to estimate the morphometric characteristics of the model gully with high precision and to create a new methodological basis for the system for monitoring land degradation and desertification.
In the current situation, further development of agricultural production associated with the intensification and plowing of slope lands requires the urgent development of effective anti-erosion measures, reducing the losses of effective soil fertility and increasing the yield of cultivated crops.

 ,
, 


