PCA-Based Multiple-Trait GWAS Analysis: A Powerful Model for Exploring Pleiotropy

Simple Summary
Abstract
1. Introduction
2. Method
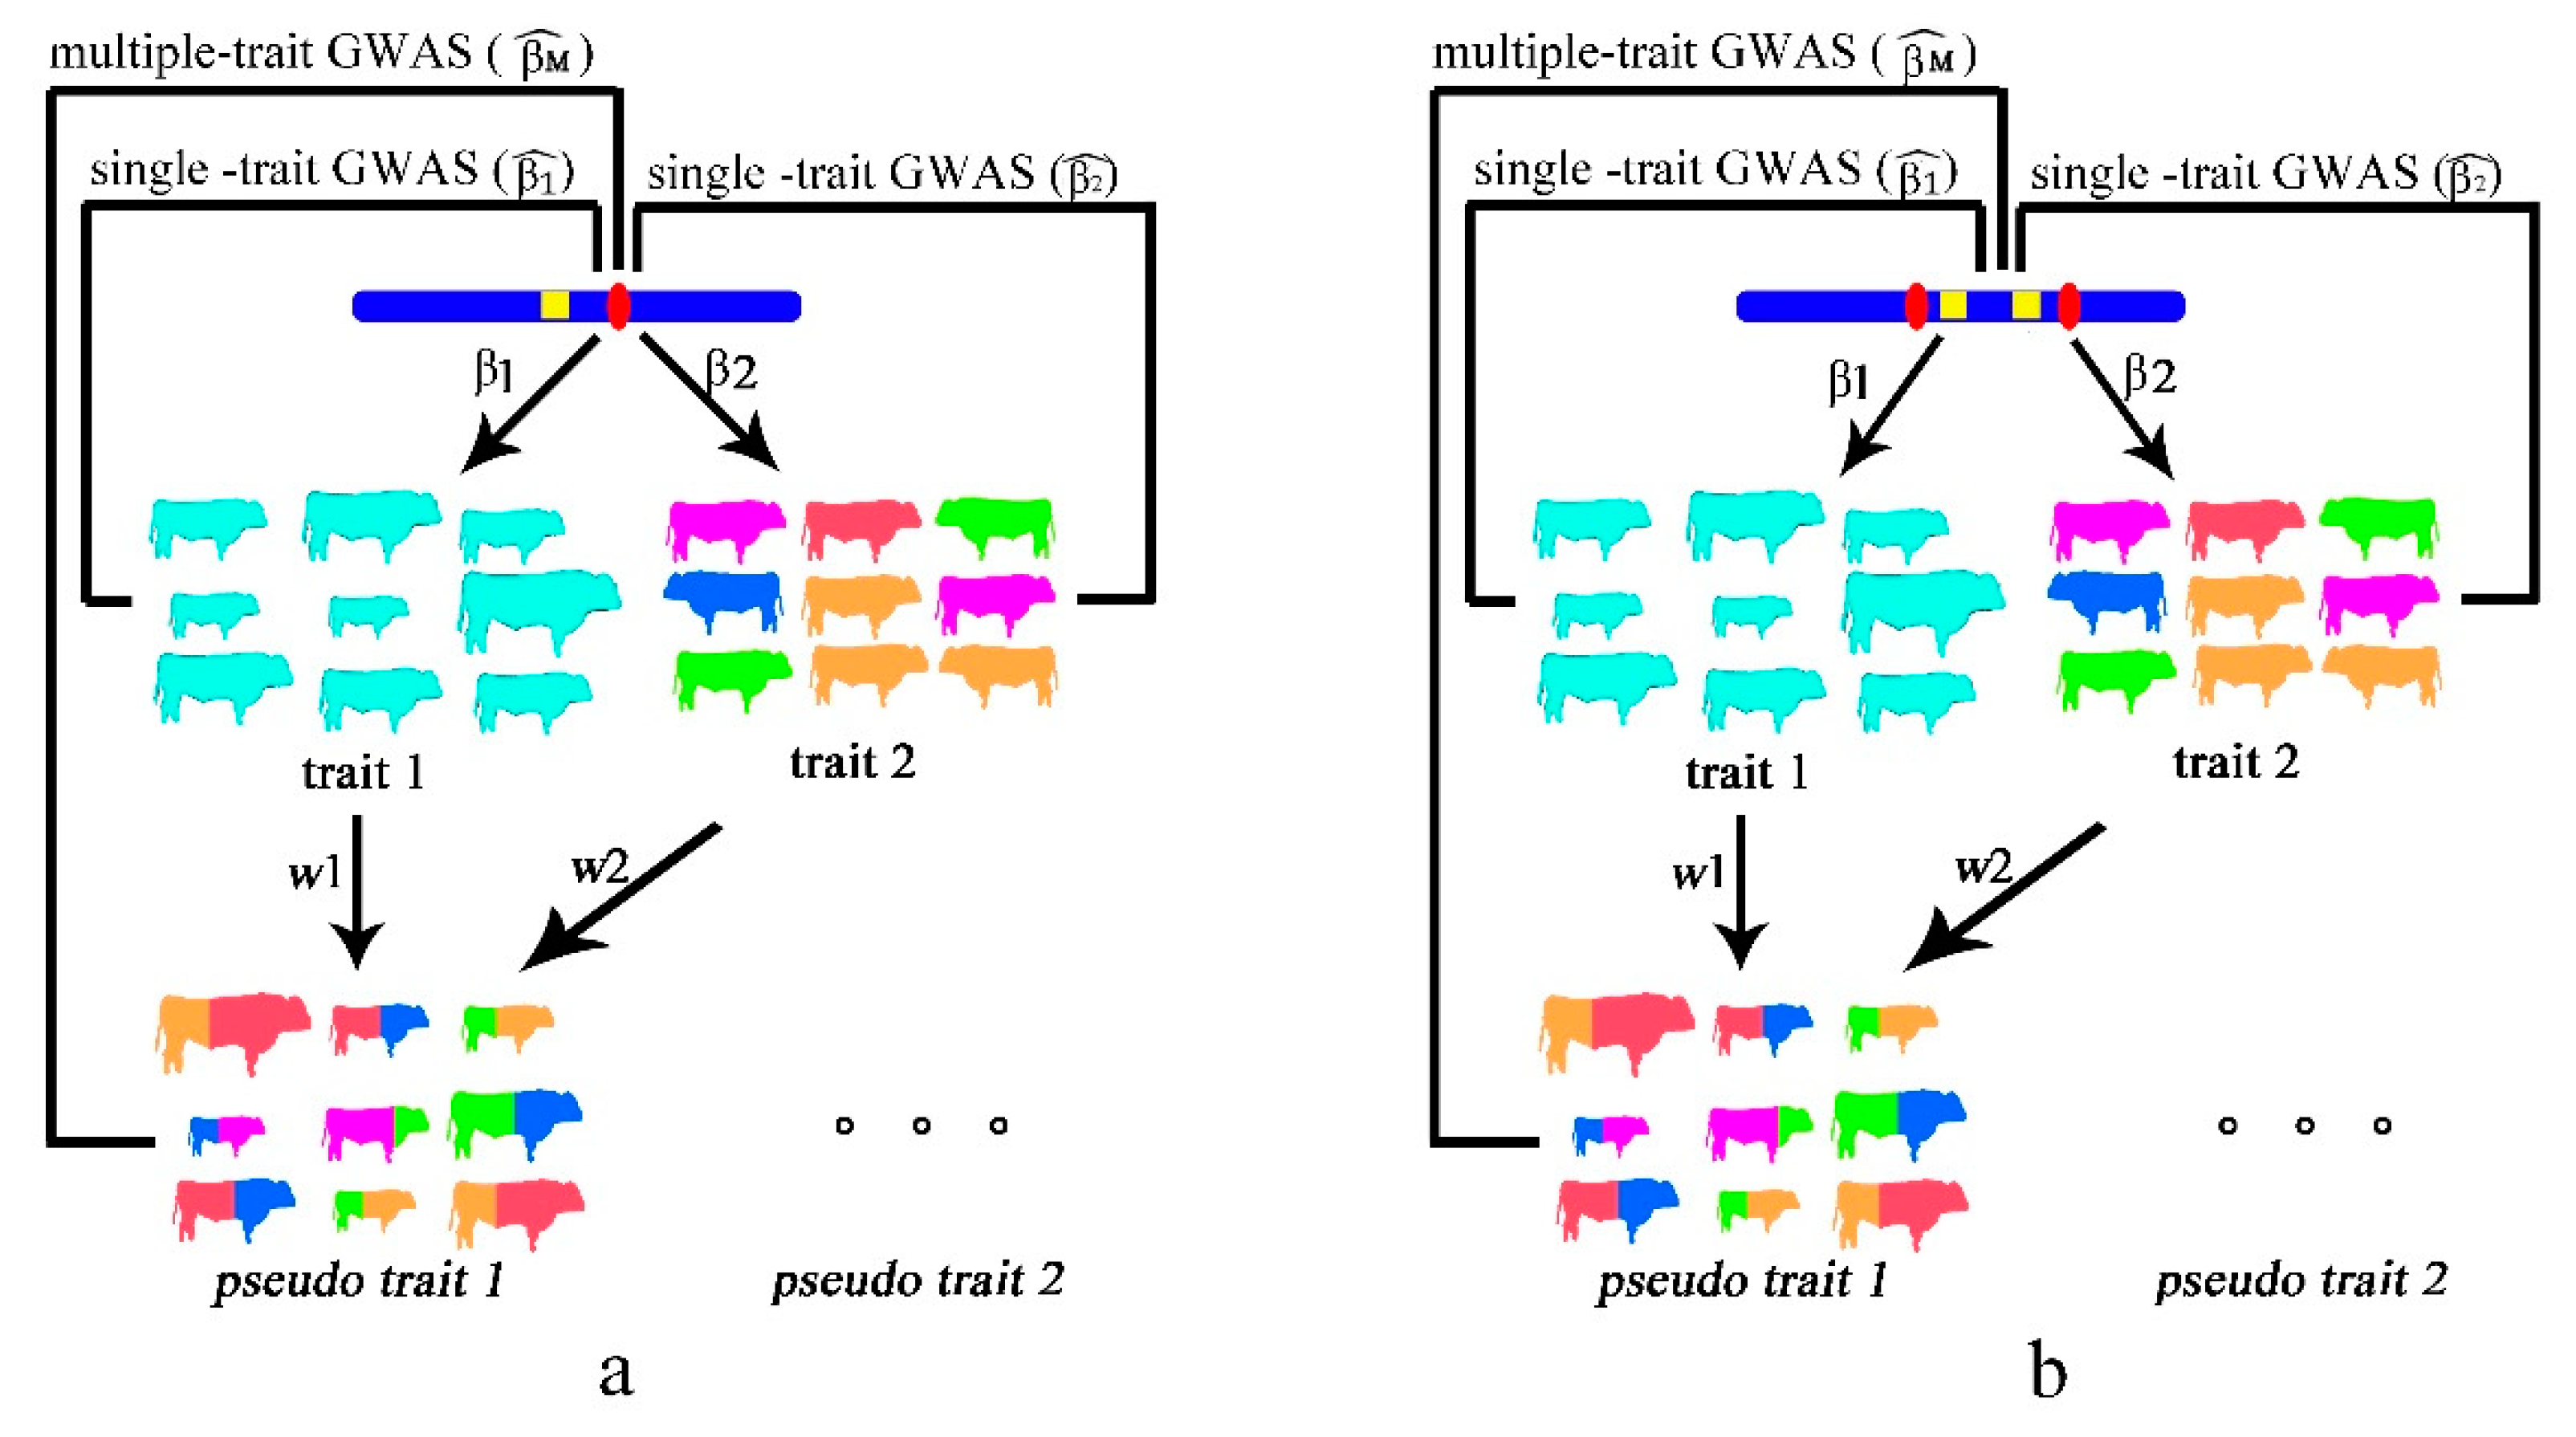
2.1. Single Causal Variant Model
2.2. Colocalizing Effect Model
2.3. Simulated Data
2.4. Real Data
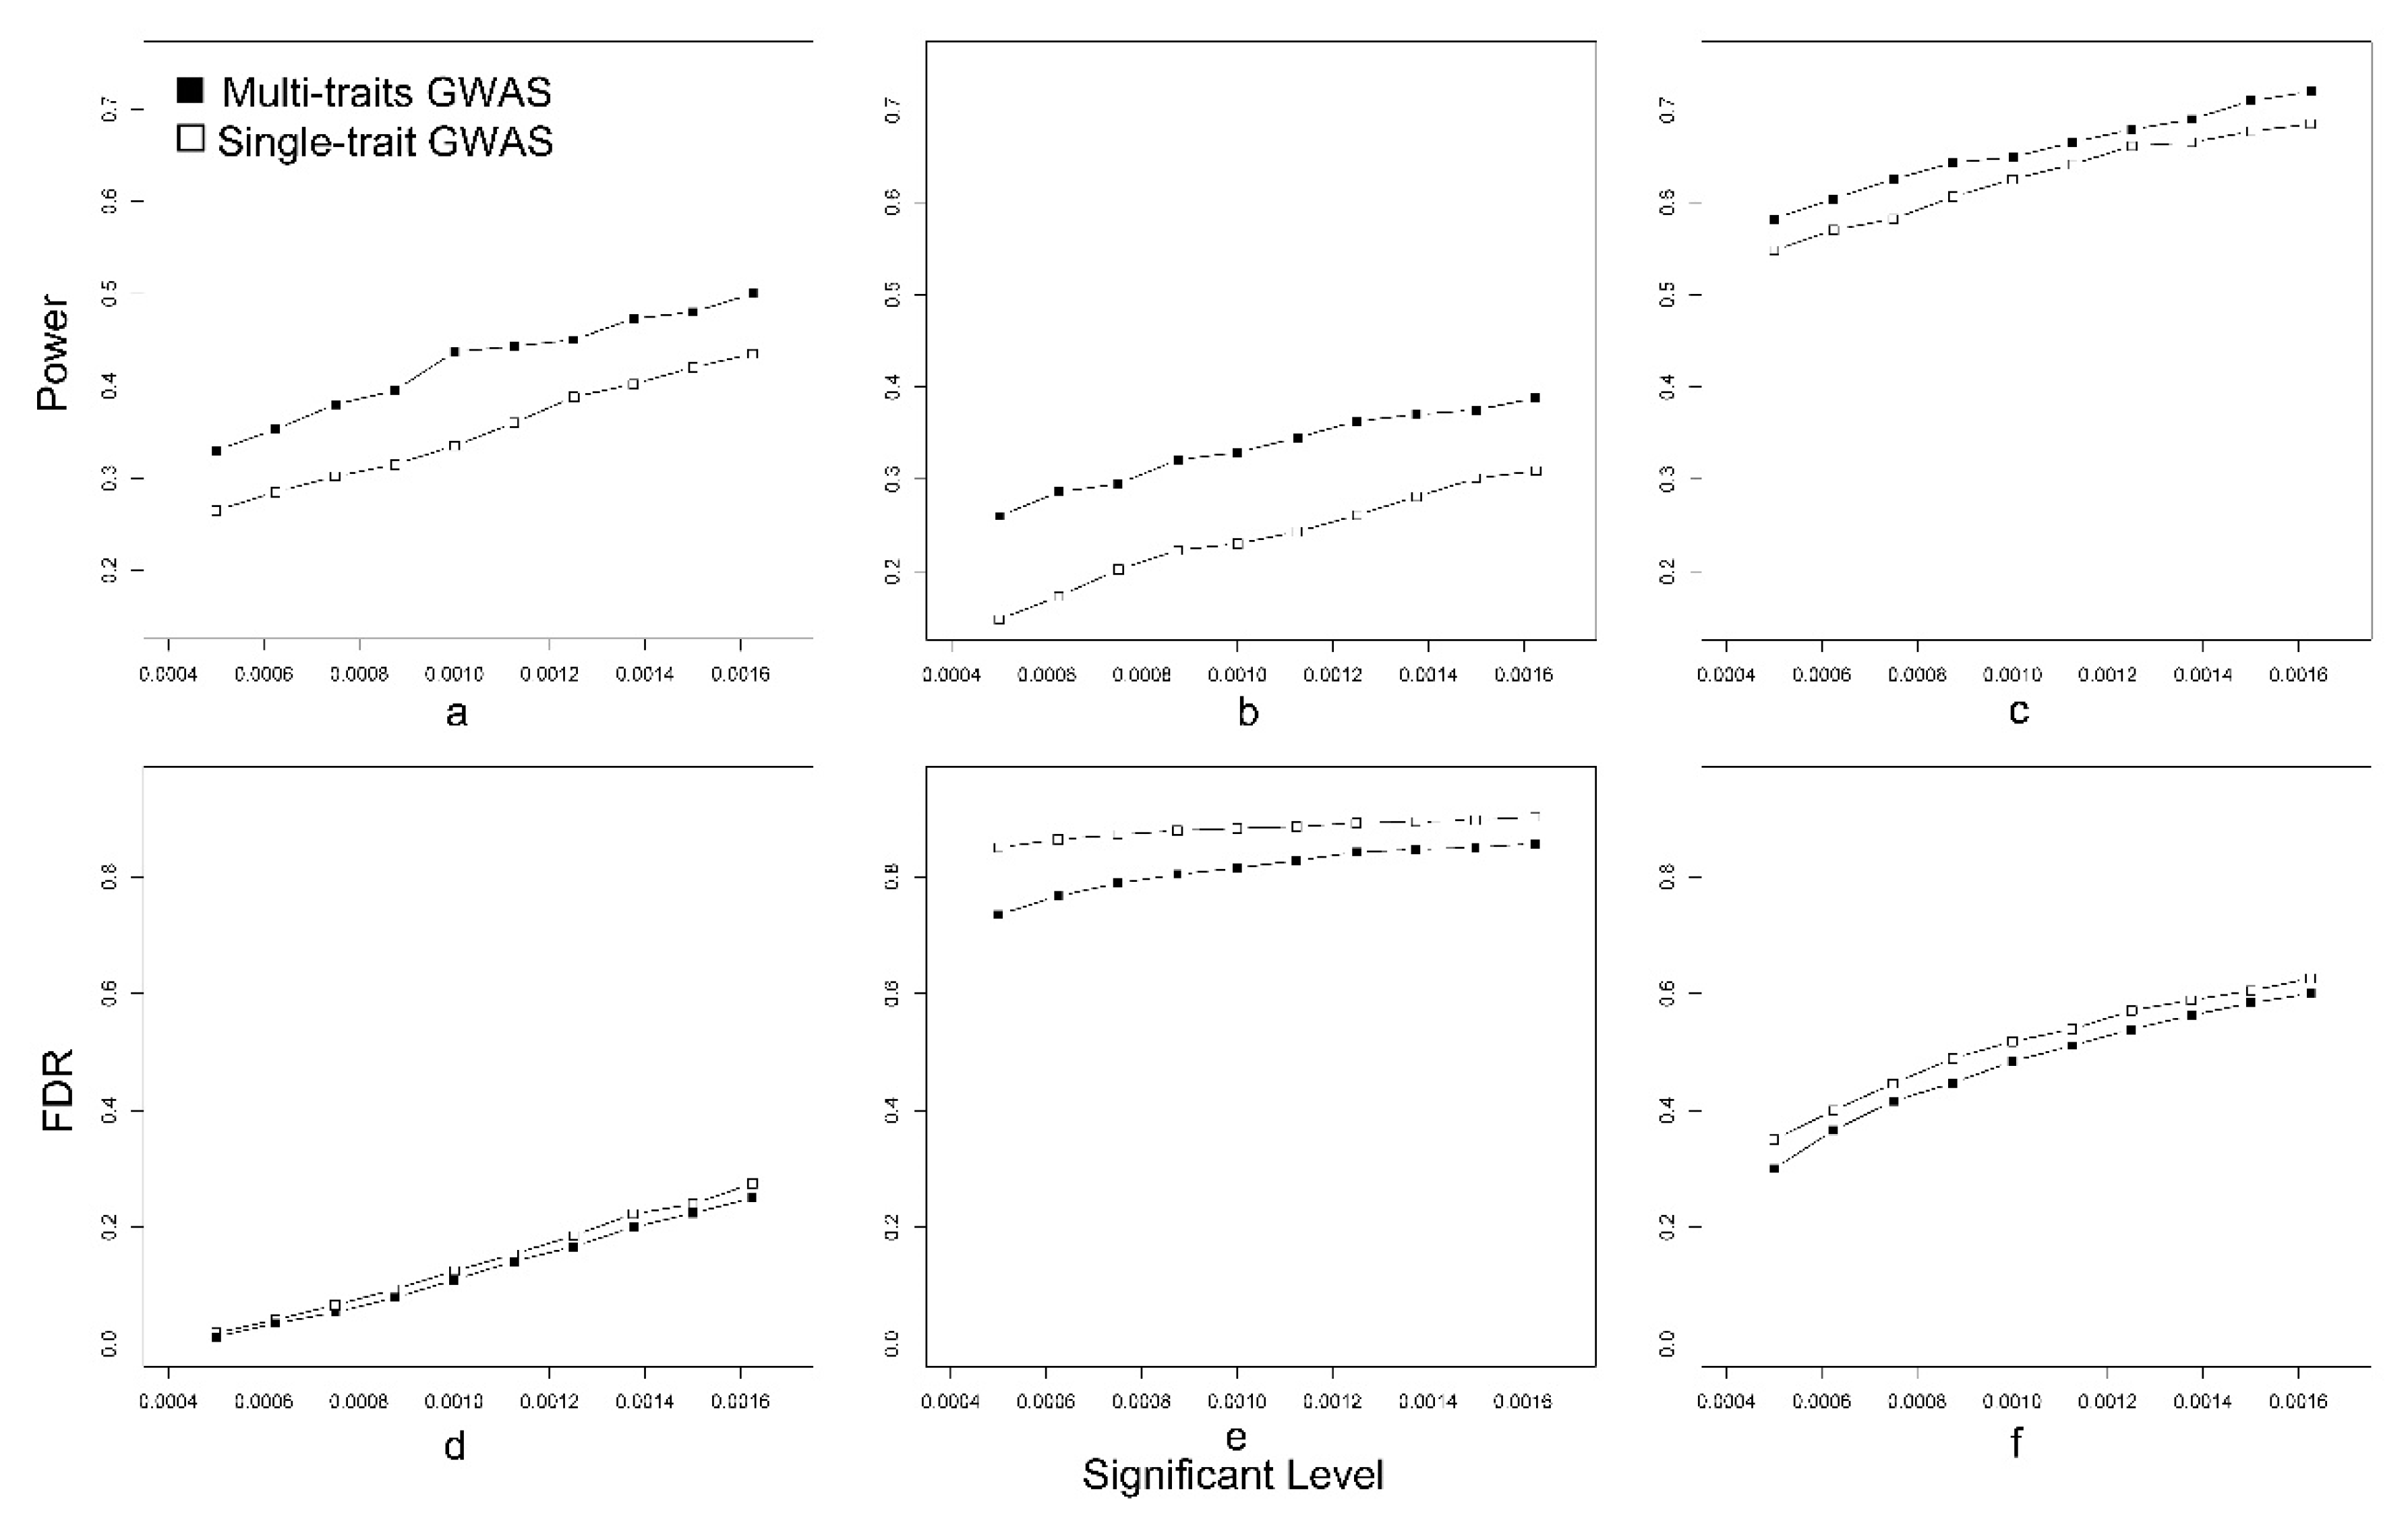
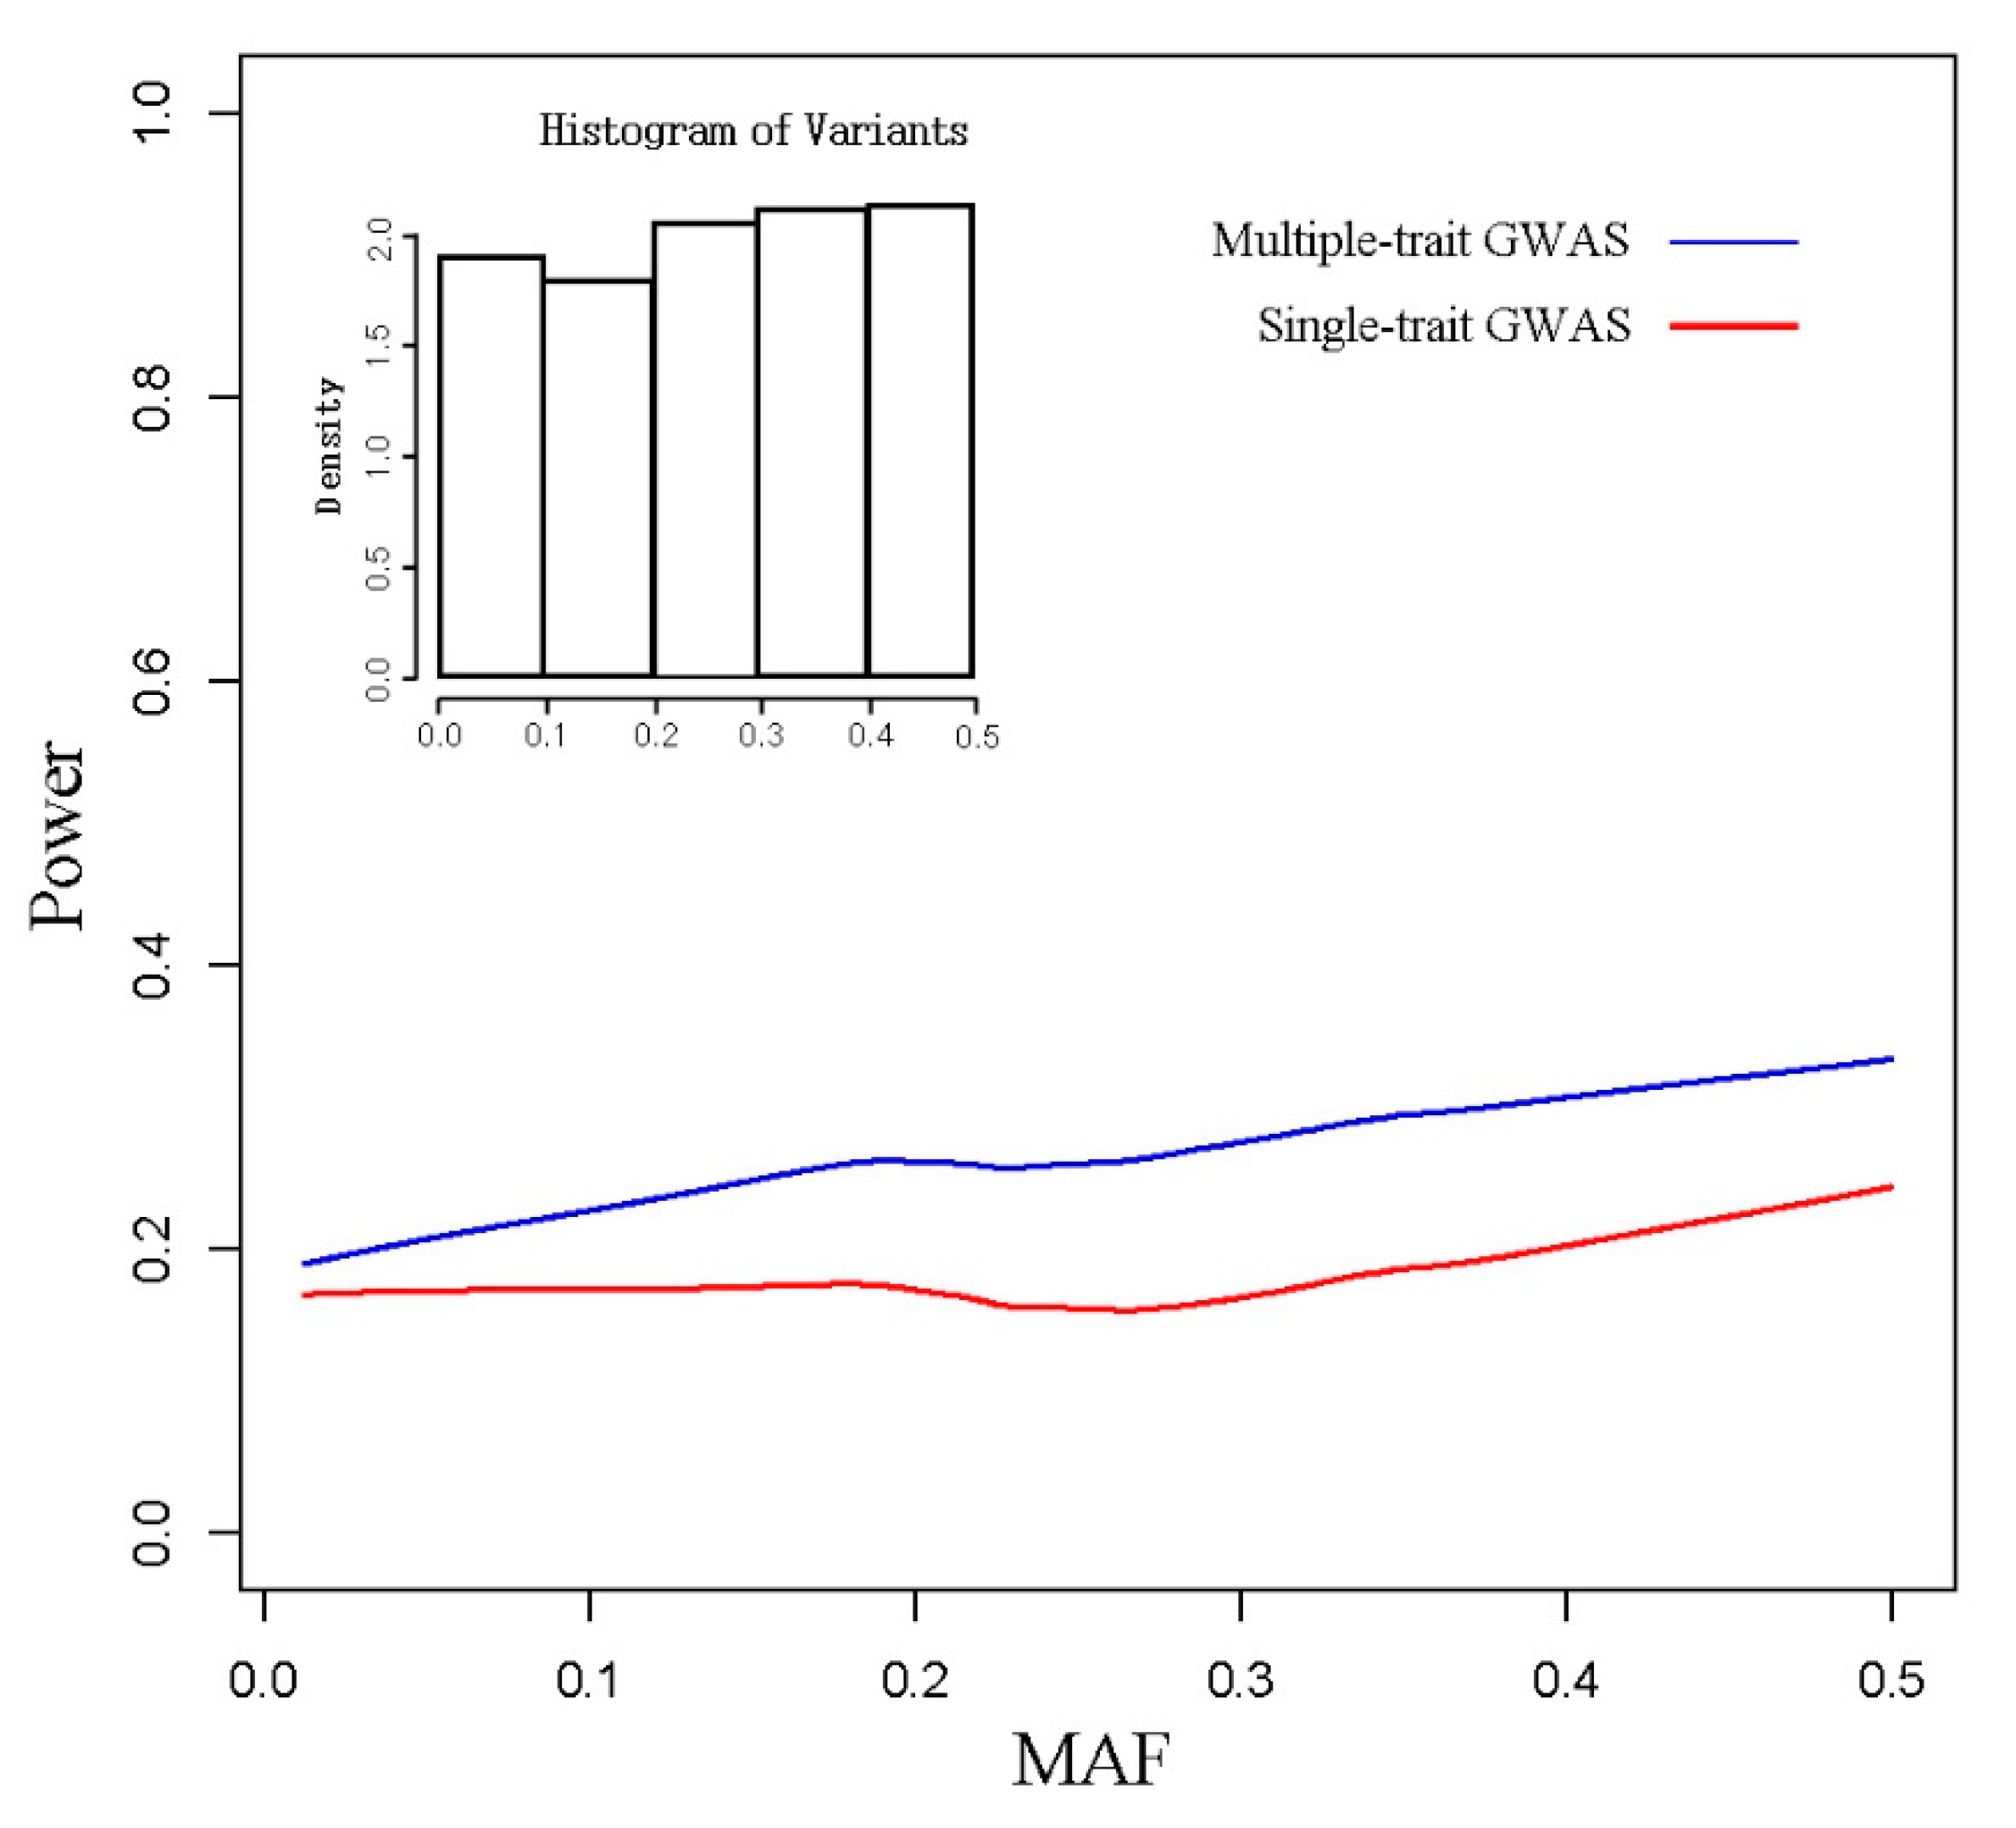
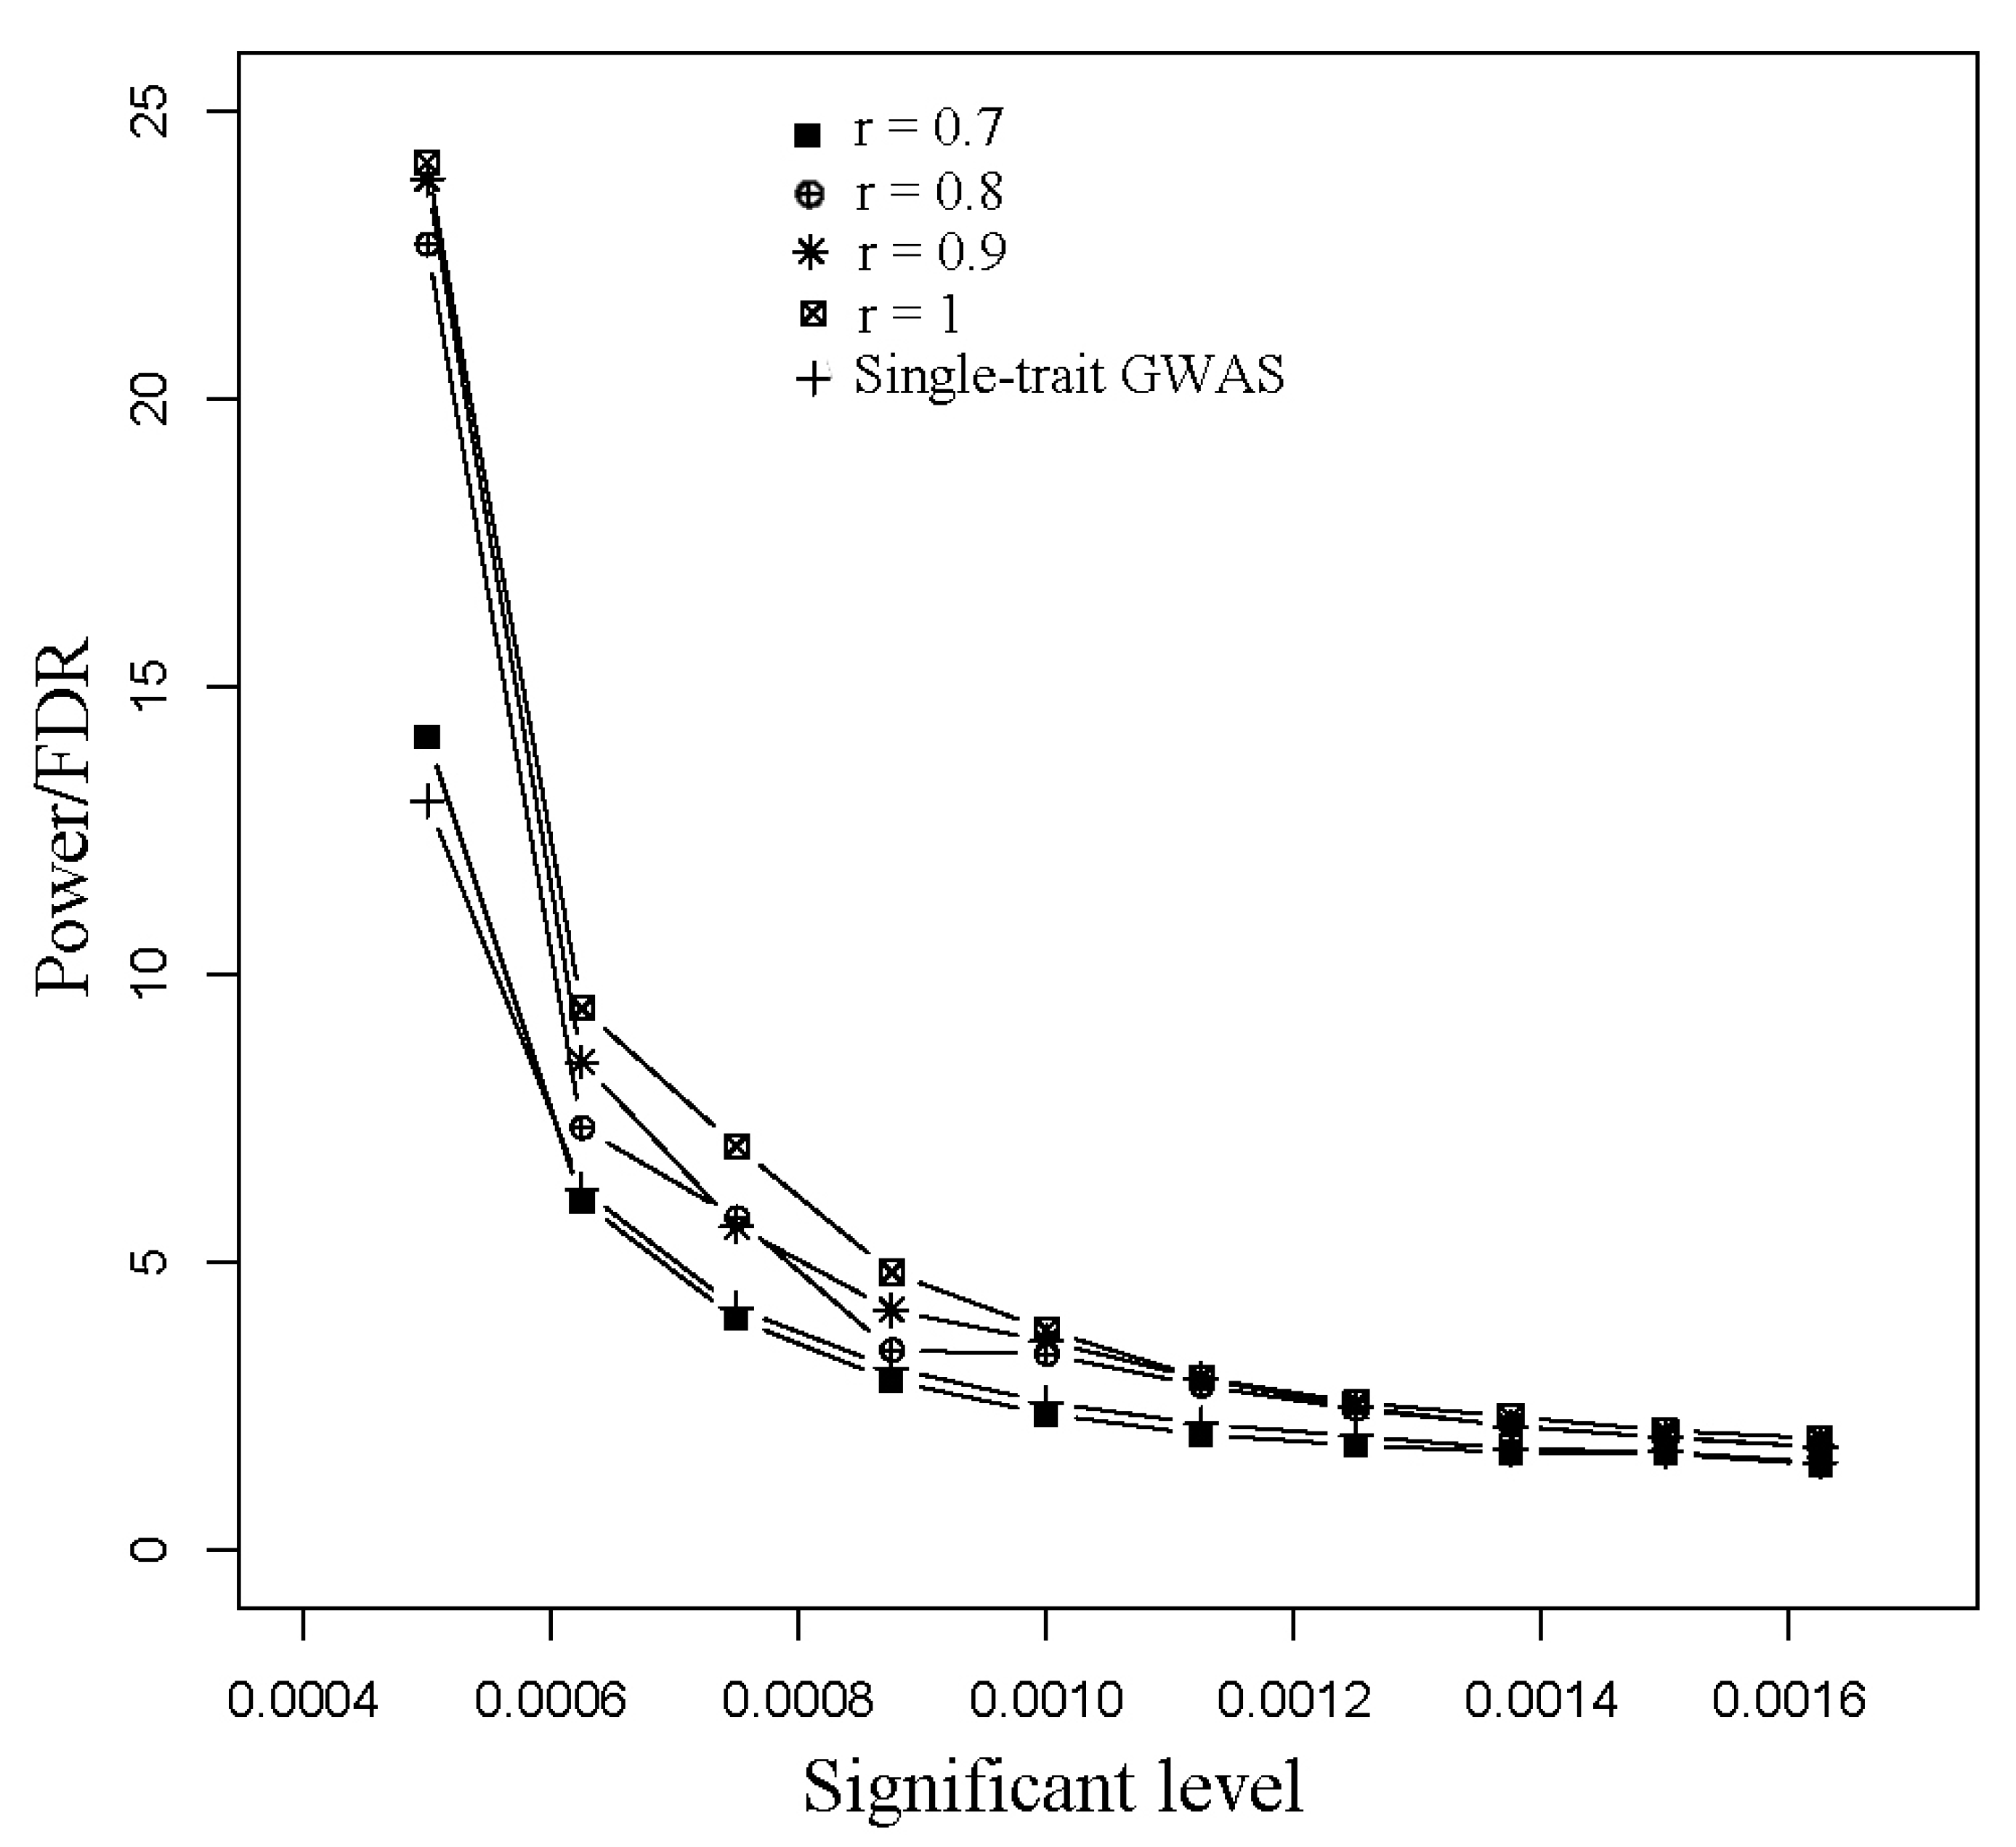
2.5. Power Examination and False Discovery Rate (FDR) Examination
3. Results
3.1. Simulated Data
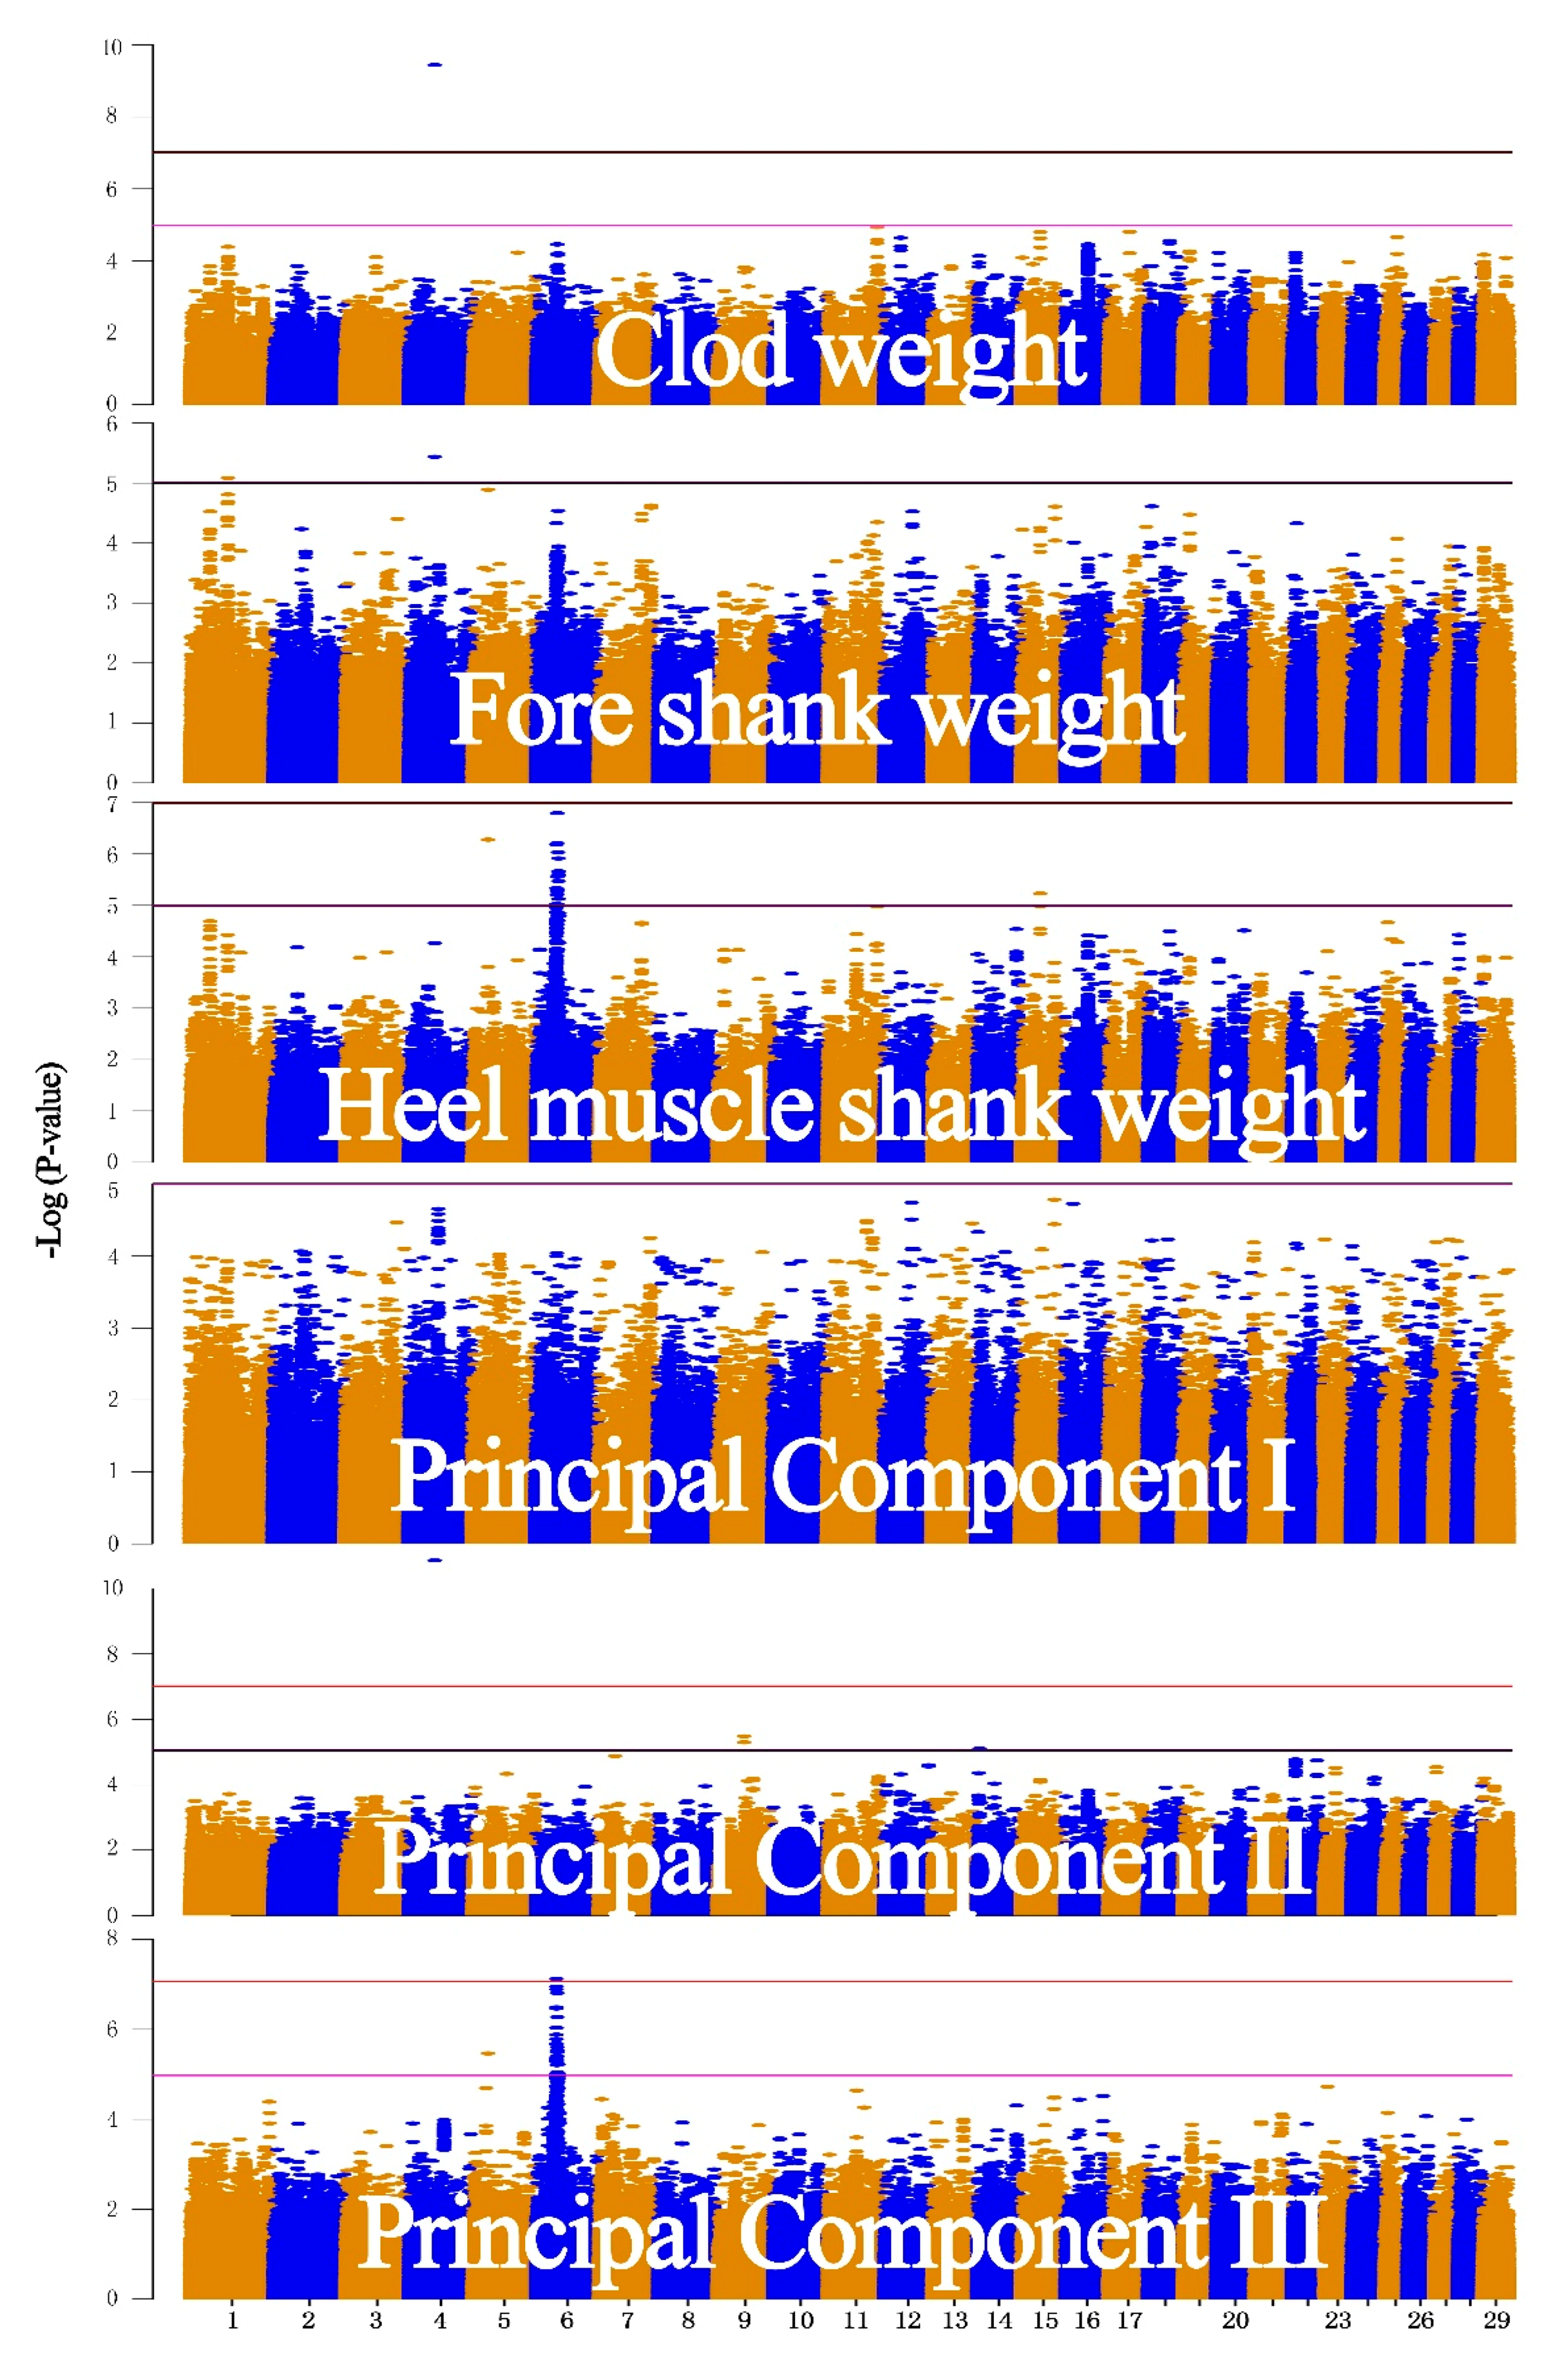
3.2. Real Data
4. Discussion
5. Conclusions
Supplementary Materials
Author Contributions
Funding
Acknowledgments
Conflicts of Interest
References
- Yang, J.; Benyamin, B.; McEvoy, B.P.; Gordon, S.; Henders, A.K.; Nyholt, D.R.; Madden, P.A.; Heath, A.C.; Martin, N.G.; Montgomery, G.W.; et al. Common SNPs explain a large proportion of the heritability for human height. Nat. Genet. 2010, 42, 565–569. [Google Scholar] [CrossRef] [PubMed]
- Visscher, P.M.; Wray, N.R.; Zhang, Q.; Sklar, P.; McCarthy, M.I.; Brown, M.A.; Yang, J. 10 Years of GWAS Discovery: Biology, Function, and Translation. Am. J. Hum. Genet. 2017, 101, 5–22. [Google Scholar] [CrossRef] [PubMed]
- Solovieff, N.; Cotsapas, C.; Lee, P.H.; Purcell, S.M.; Smoller, J.W. Pleiotropy in complex traits: challenges and strategies. Nat. Rev. Genet. 2013, 14, 483–495. [Google Scholar] [CrossRef] [PubMed]
- Sivakumaran, S.; Agakov, F.; Theodoratou, E.; Prendergast, J.G.; Zgaga, L.; Manolio, T.; Rudan, I.; McKeigue, P.; Wilson, J.F.; Campbell, H. Abundant pleiotropy in human complex diseases and traits. Am. J. Hum. Genet. 2011, 89, 607–618. [Google Scholar] [CrossRef] [PubMed]
- Franke, A.; McGovern, D.P.; Barrett, J.C. Genome-wide meta-analysis increases to 71 the number of confirmed Crohn’s disease susceptibility loci. Nat. Genet. 2010, 42, 1118–1125. [Google Scholar] [CrossRef] [PubMed]
- Iles, M.M.; Law, M.H.; Stacey, S.N. A variant in FTO shows association with melanoma risk not due to BMI. Nat. Genet. 2013, 45, 428–432. [Google Scholar] [CrossRef] [PubMed]
- Teixeira-Pinto, A.; Normand, S.L. Correlated bivariate continuous and binary outcomes: Issues and applications. Stat. Med. 2009, 28, 1753–1773. [Google Scholar] [CrossRef]
- Korte, A.; Vilhjalmsson, B.J.; Segura, A.; Long, Q.; Nordborg, M. A mixed-model approach for genome-wide association studies of correlated traits in structured populations. Nat. Genet. 2012, 44, 1066–1071. [Google Scholar] [CrossRef]
- Zhou, X.; Stephens, M. Efficient multivariate linear mixed model algorithms for genome-wide association studies. Nat. Methods 2014, 11, 407–409. [Google Scholar] [CrossRef]
- Furlotte, N.A.; Eskin, E. Efficient Multiple-Trait Association and Estimation of Genetic Correlation Using the Matrix-Variate Linear Mixed Model. Genetics 2015, 200, 59–68. [Google Scholar] [CrossRef] [PubMed]
- Li, C.; Yang, C.; Gelernter, J.; Zhao, H. Improving genetic risk prediction by leveraging pleiotropy. Hum. Genet. 2014, 133, 639–650. [Google Scholar] [CrossRef] [PubMed]
- Shriner, D. Moving toward System Genetics through Multiple Trait Analysis in Genome-Wide Association Studies. Front. Genet. 2012, 3, 1. [Google Scholar] [CrossRef] [PubMed]
- Weller, J.I.; Wiggans, G.R.; Vanraden, P.M.; Ron, M. Application of a canonical transformation to detection of quantitative trait loci with the aid of genetic markers in a multi-trait experiment. Theor. Appl. Genet. 1996, 92, 998–1002. [Google Scholar] [CrossRef] [PubMed]
- Klei, L.; Luca, D.; Devlin, B.; Roeder, K. Pleiotropy and principal components of heritability combine to increase power for association analysis. Genet. Epidemiol. 2008, 32, 9–19. [Google Scholar] [CrossRef] [PubMed]
- Aschard, H.; Vilhjalmsson, B.J.; Greliche, N.; Morange, P.E.; Tregouet, D.A.; Kraft, P. Maximizing the Power of Principal-Component Analysis of Correlated Phenotypes in Genome-wide Association Studies. Am. J. Hum. Genet. 2014, 94, 662–676. [Google Scholar] [CrossRef] [PubMed]
- Bensen, J.T.; Lange, L.A.; Langefeld, C.D.; Chang, B.L.; Bleecker, E.R.; Meyers, D.A.; Xu, J. Exploring pleiotropy using principal components. BMC Genet. 2003, 4, S53. [Google Scholar] [CrossRef] [PubMed]
- Jiang, L.; Liu, J.; Sun, D.; Ma, P.; Ding, X.; Yu, Y.; Zhang, Q. Genome wide association studies for milk production traits in Chinese Holstein population. PLoS One 2010, 5, e13661. [Google Scholar] [CrossRef] [PubMed]
- Rosati, A.; Van Vleck, L.D. Estimation of genetic parameters for milk, fat, protein and mozzarella cheese production for the Italian river buffalo Bubalus bubalis population. Livest. Prod. Sci. 2002, 74, 185–190. [Google Scholar] [CrossRef]
- Wengang, Z.; Lingyang, X.; Huijiang, G.; Yang, W.; Xue, G.; Lupei, Z.; Bo, Z.; Yuxin, S.; Jinshan, B.; Junya, L.; et al. Detection of candidate genes for growth and carcass traits using genome-wide association strategy in Chinese Simmental beef cattle. Anim. Prod. Sci. 2018, 58, 224–233. [Google Scholar]
- Große-Brinkhaus, C.; Storck, L.C.; Frieden, L.; Neuhoff, C.; Schellander, K.; Looft, C.; Tholen, E. Genome-wide association analyses for boar taint components and testicular traits revealed regions having pleiotropic effects. BMC Genet. 2015, 16, 36. [Google Scholar] [CrossRef]
- Yu, J.; Pressoir, G.; Briggs, W.H.; Vroh, B.I.; Yamasaki, M.; Doebley, J.F.; McMullen, M.D.; Gaut, B.S.; Nielsen, D.M.; Holland, J.B.; et al. A unified mixed-model method for association mapping that accounts for multiple levels of relatedness. Nat. Genet. 2016, 38, 203. [Google Scholar] [CrossRef] [PubMed]
- Manly, K.F.; Olson, J.M. Overview of QTL mapping software and introduction to map manager QT. Mamm. Genome. 1999, 10, 327–334. [Google Scholar] [CrossRef] [PubMed]
- Yang, J.; Lee, S.H.; Goddard, M.E.; Visscher, P.M. GCTA: A tool for genome-wide complex trait analysis. Am. J. Hum. Genet. 2011, 88, 76–82. [Google Scholar] [CrossRef] [PubMed]
- Mangin, B.; Thoquet, P.; Grimsley, N. Pleiotropic QTL analysis. Biometrics 1998, 54, 88–99. [Google Scholar] [CrossRef]
- Porter, H.F.; O’Reilly, P.F. Multivariate simulation framework reveals performance of multi-trait GWAS methods. Sci. Rep. 2017, 7, 38837. [Google Scholar] [CrossRef]
- Lindholm-Perry, A.K.; Kuehn, L.A.; Oliver, W.T.; Sexten, A.K.; Miles, J.R.; Rempel, L.A.; Cushman, R.A.; Freetly, H.C. Adipose and Muscle Tissue Gene Expression of Two Genes NCAPG and LCORL Located in a Chromosomal Region Associated with Cattle Feed Intake and Gain. PLoS One 2013, 8, e80882. [Google Scholar] [CrossRef]
- Liu, R.; Sun, Y.; Zhao, G.; Wang, F.; Wu, D.; Zheng, M.; Chen, J.; Zhang, L.; Hu, Y.; Wen, J. Genome-Wide Association Study Identifies Loci and Candidate Genes for Body Composition and Meat Quality Traits in Beijing-You Chickens. PLoS One 2013, 8, e61172. [Google Scholar] [CrossRef]
- Xu, L.; Bickhart, D.M.; Cole, J.B.; Schroeder, S.G.; Song, J.; Tassell, C.P.; Sonstegard, T.S.; Liu, G.E. Genomic Signatures Reveal New Evidences for Selection of Important Traits in Domestic Cattle. Mol. Biol. Evol. 2015, 32, 711–725. [Google Scholar] [CrossRef]
- Jin, C.F.; Chen, Y.J.; Yang, Z.Q.; Shi, K.; Chen, C.K. A genome-wide association study of growth trait-related single nucleotide polymorphisms in Chinese Yancheng chickens. Genet. Mol. Res. 2015, 14, 15783–15792. [Google Scholar] [CrossRef]
- Al-Mamun, H.A.; Kwan, P.; Clark, S.A.; Ferdosi, M.H.; Tellam, R.; Gondro, C. Genome-wide association study of body weight in Australian Merino sheep reveals an orthologous region on OAR6 to human and bovine genomic regions affecting height and weight. Genet. Sel. Evol. 2015, 47, 66. [Google Scholar] [CrossRef] [PubMed]
- Meyre, D.; Lecoeur, C.; Delplanque, J.; Francke, S.; Vatin, V.; Durand, E.; Weill, J.; Dina, C.; Froguel, P. A genome-wide scan for childhood obesity-associated traits in French families shows significant linkage on chromosome 6q22.31-q23.2. Diabetes 2004, 53, 803–811. [Google Scholar] [CrossRef] [PubMed]
- Pareek, C.S.; Smoczyński, R.; Kadarmideen, H.N.; Dziuba, P.; Błaszczyk, P.; Sikora, M.; Walendzik, P.; Grzybowski, T.; Pierzchała, M.; Horbańczuk, J.; et al. Single Nucleotide Polymorphism Discovery in Bovine Pituitary Gland Using RNA-Seq Technology. PLoS One 2016, 11, e0161370. [Google Scholar] [CrossRef] [PubMed]


| Chr a | Pos (bp) | Trait 1 eff | Trait 2 eff | Single-Trait GWAS | Multiple-Trait GWAS | ||||
|---|---|---|---|---|---|---|---|---|---|
| −log(p) t1 | se eff | −log(p) t2 | se eff | −log(p) mt | se eff | ||||
| 1 | 5167453 | 1.18 | 1.66 | 3.63 | 0.06 | 1.87 | 0.09 | 3.19 | 0.01 |
| 1 | 126001364 | 1.34 | 1.93 | 4.38 | 0.03 | 3.45 | 0.04 | 4.65 | 0.01 |
| 1 | 128776905 | 1.83 | 2.51 | 1.13 | 0.13 | 1.17 | 0.18 | 1.33 | 0.03 |
| 1 | 132347489 | 1.21 | 1.91 | 4.57 | 0.13 | 5.85 | 0.18 | 6.16 | 0.03 |
| 1 | 135921964 | 0.89 | 1.43 | 1.73 | 0.06 | 4.70 | 0.08 | 3.53 | 0.01 |
| 4 | 28841329 | 0.93 | 1.47 | 1.10 | 0.04 | 3.68 | 0.05 | 2.54 | 0.01 |
| 4 | 65810279 | 1.82 | 2.38 | 5.24 | 0.11 | 5.22 | 0.16 | 6.24 | 0.02 |
| 4 | 80902019 | 3.41 | 5.71 | 17.55 | 0.06 | 30.18 | 0.08 | 28.08 | 0.01 |
| 4 | 115266053 | 2.20 | 3.94 | 10.05 | 0.06 | 16.65 | 0.08 | 15.70 | 0.01 |
| 5 | 6270944 | 0.84 | 0.94 | 2.48 | 0.04 | 0.87 | 0.05 | 1.87 | 0.01 |
| Scenario | Heritability | Environmental Correlation | PC1 | PC2 | ||
|---|---|---|---|---|---|---|
| Phenotypic Variance (SD a) | Heritability Explained (SD) | Phenotypic Variance (SD) | Heritability Explained (SD) | |||
| 1 | 0.5 | 0 | 75.98 (25.12) | 0.534 (0.04) | 14.96 (4.34) | 0.271 (0.03) |
| 2 | 0.05 | 0 | 56.78 (17.22) | 0.052 (0.01) | 39.81 (10.23) | 0.035 (0.01) |
| 3 | 0.5 | 0.25 | 89.12 (30.09) | 0.580 (0.04) | 9.80 (2.11) | 0.130 (0.07) |
| Trait | Number of Samples | Mean (Kg) (SD) | Heritability | CW | FSW | HMSW |
|---|---|---|---|---|---|---|
| Clod weight (CW) | 1111 | 5.06 (0.88) | 0.57 | 1 | 0.82 a | 0.79 |
| Fore shank weight (FSW) | 1111 | 17.03 (3.15) | 0.56 | 0.90 b | 1 | 0.76 |
| Heel muscle shank weight (HMSW) | 1111 | 1.07 (0.19) | 0.62 | 0.93 | 0.94 | 1 |
© 2018 by the authors. Licensee MDPI, Basel, Switzerland. This article is an open access article distributed under the terms and conditions of the Creative Commons Attribution (CC BY) license (http://creativecommons.org/licenses/by/4.0/).
Share and Cite
Zhang, W.; Gao, X.; Shi, X.; Zhu, B.; Wang, Z.; Gao, H.; Xu, L.; Zhang, L.; Li, J.; Chen, Y. PCA-Based Multiple-Trait GWAS Analysis: A Powerful Model for Exploring Pleiotropy. Animals 2018, 8, 239. https://doi.org/10.3390/ani8120239
Zhang W, Gao X, Shi X, Zhu B, Wang Z, Gao H, Xu L, Zhang L, Li J, Chen Y. PCA-Based Multiple-Trait GWAS Analysis: A Powerful Model for Exploring Pleiotropy. Animals. 2018; 8(12):239. https://doi.org/10.3390/ani8120239
Chicago/Turabian StyleZhang, Wengang, Xue Gao, Xinping Shi, Bo Zhu, Zezhao Wang, Huijiang Gao, Lingyang Xu, Lupei Zhang, Junya Li, and Yan Chen. 2018. "PCA-Based Multiple-Trait GWAS Analysis: A Powerful Model for Exploring Pleiotropy" Animals 8, no. 12: 239. https://doi.org/10.3390/ani8120239
APA StyleZhang, W., Gao, X., Shi, X., Zhu, B., Wang, Z., Gao, H., Xu, L., Zhang, L., Li, J., & Chen, Y. (2018). PCA-Based Multiple-Trait GWAS Analysis: A Powerful Model for Exploring Pleiotropy. Animals, 8(12), 239. https://doi.org/10.3390/ani8120239