3.1. Cattle Location within the Pasture as Recorded by Global Positioning System Collars
Cattle in 2BARR spent less time in the RP than 3NOBARR cattle at the Killarney site in Period 1 (
p = 0.0002) and Period 3 (
p < 0.0001), as indicated in
Table 2. This result is in agreement with the general expectation that cattle kept in an area with natural barrier (2BARR) would spend a lesser or similar amount of time in the RP compared with their counterparts kept in an area without any barrier (3NOBARR). Alternatively, cattle in 2BARR spent more time in the RP than 3NOBARR cattle at the Souris site in Period 1 (
p < 0.0001), while the opposite occurred in Period 2, where 2BARR cattle spent less time in the RP than 3NOBARR cattle (
p < 0.0001;
Table 2).
Table 2.
The mean percentage of time cattle fitted with GPS collars spent in the riparian polygon in Period 1, 2, and 3 throughout 2009.
Table 2.
The mean percentage of time cattle fitted with GPS collars spent in the riparian polygon in Period 1, 2, and 3 throughout 2009.
| | Killarney | | Souris |
|---|
| Period 1 | Period 2 | Period 3 | | Period 1 | Period 2 | Period 3 |
|---|
| 2BARR | 4.8 (0.8) 1 | 4.3 (0.8) | 0.8 (0.2) | | 5.4 (1.2) | 1.1 (0.3) | 2.1 (0.5) |
| 3NOBARR | 7.6 (1.3) | 5.3 (1.0) | 4.0 (0.7) | | 1.3 (0.4) | 2.8 (0.6) | 1.7 (0.4) |
| p-Value | 0.0002 | 0.1116 | <0.0001 | | <0.0001 | 0.0002 | 0.5633 |
Without GPS data from 1CONT, it may not be possible to conclusively determine if the OSW was successful at decreasing the amount of time that cattle spent in the RP. However, the data does provide some indication of the efficacy of the natural barriers on deterring cattle from the RP. As cattle in 3NOBARR at the Killarney site spent a greater proportion of time in the RP throughout all three periods, it suggests that the implementation of the barrier in 2BARR was effective in deterring cattle from remaining in the RP. However, these results are inconsistent with Souris, where cattle in 2BARR were found to spend a greater proportion of time in the RP in Periods 1, while cattle in 3NOBARR spent a greater proportion of time in Period 2.
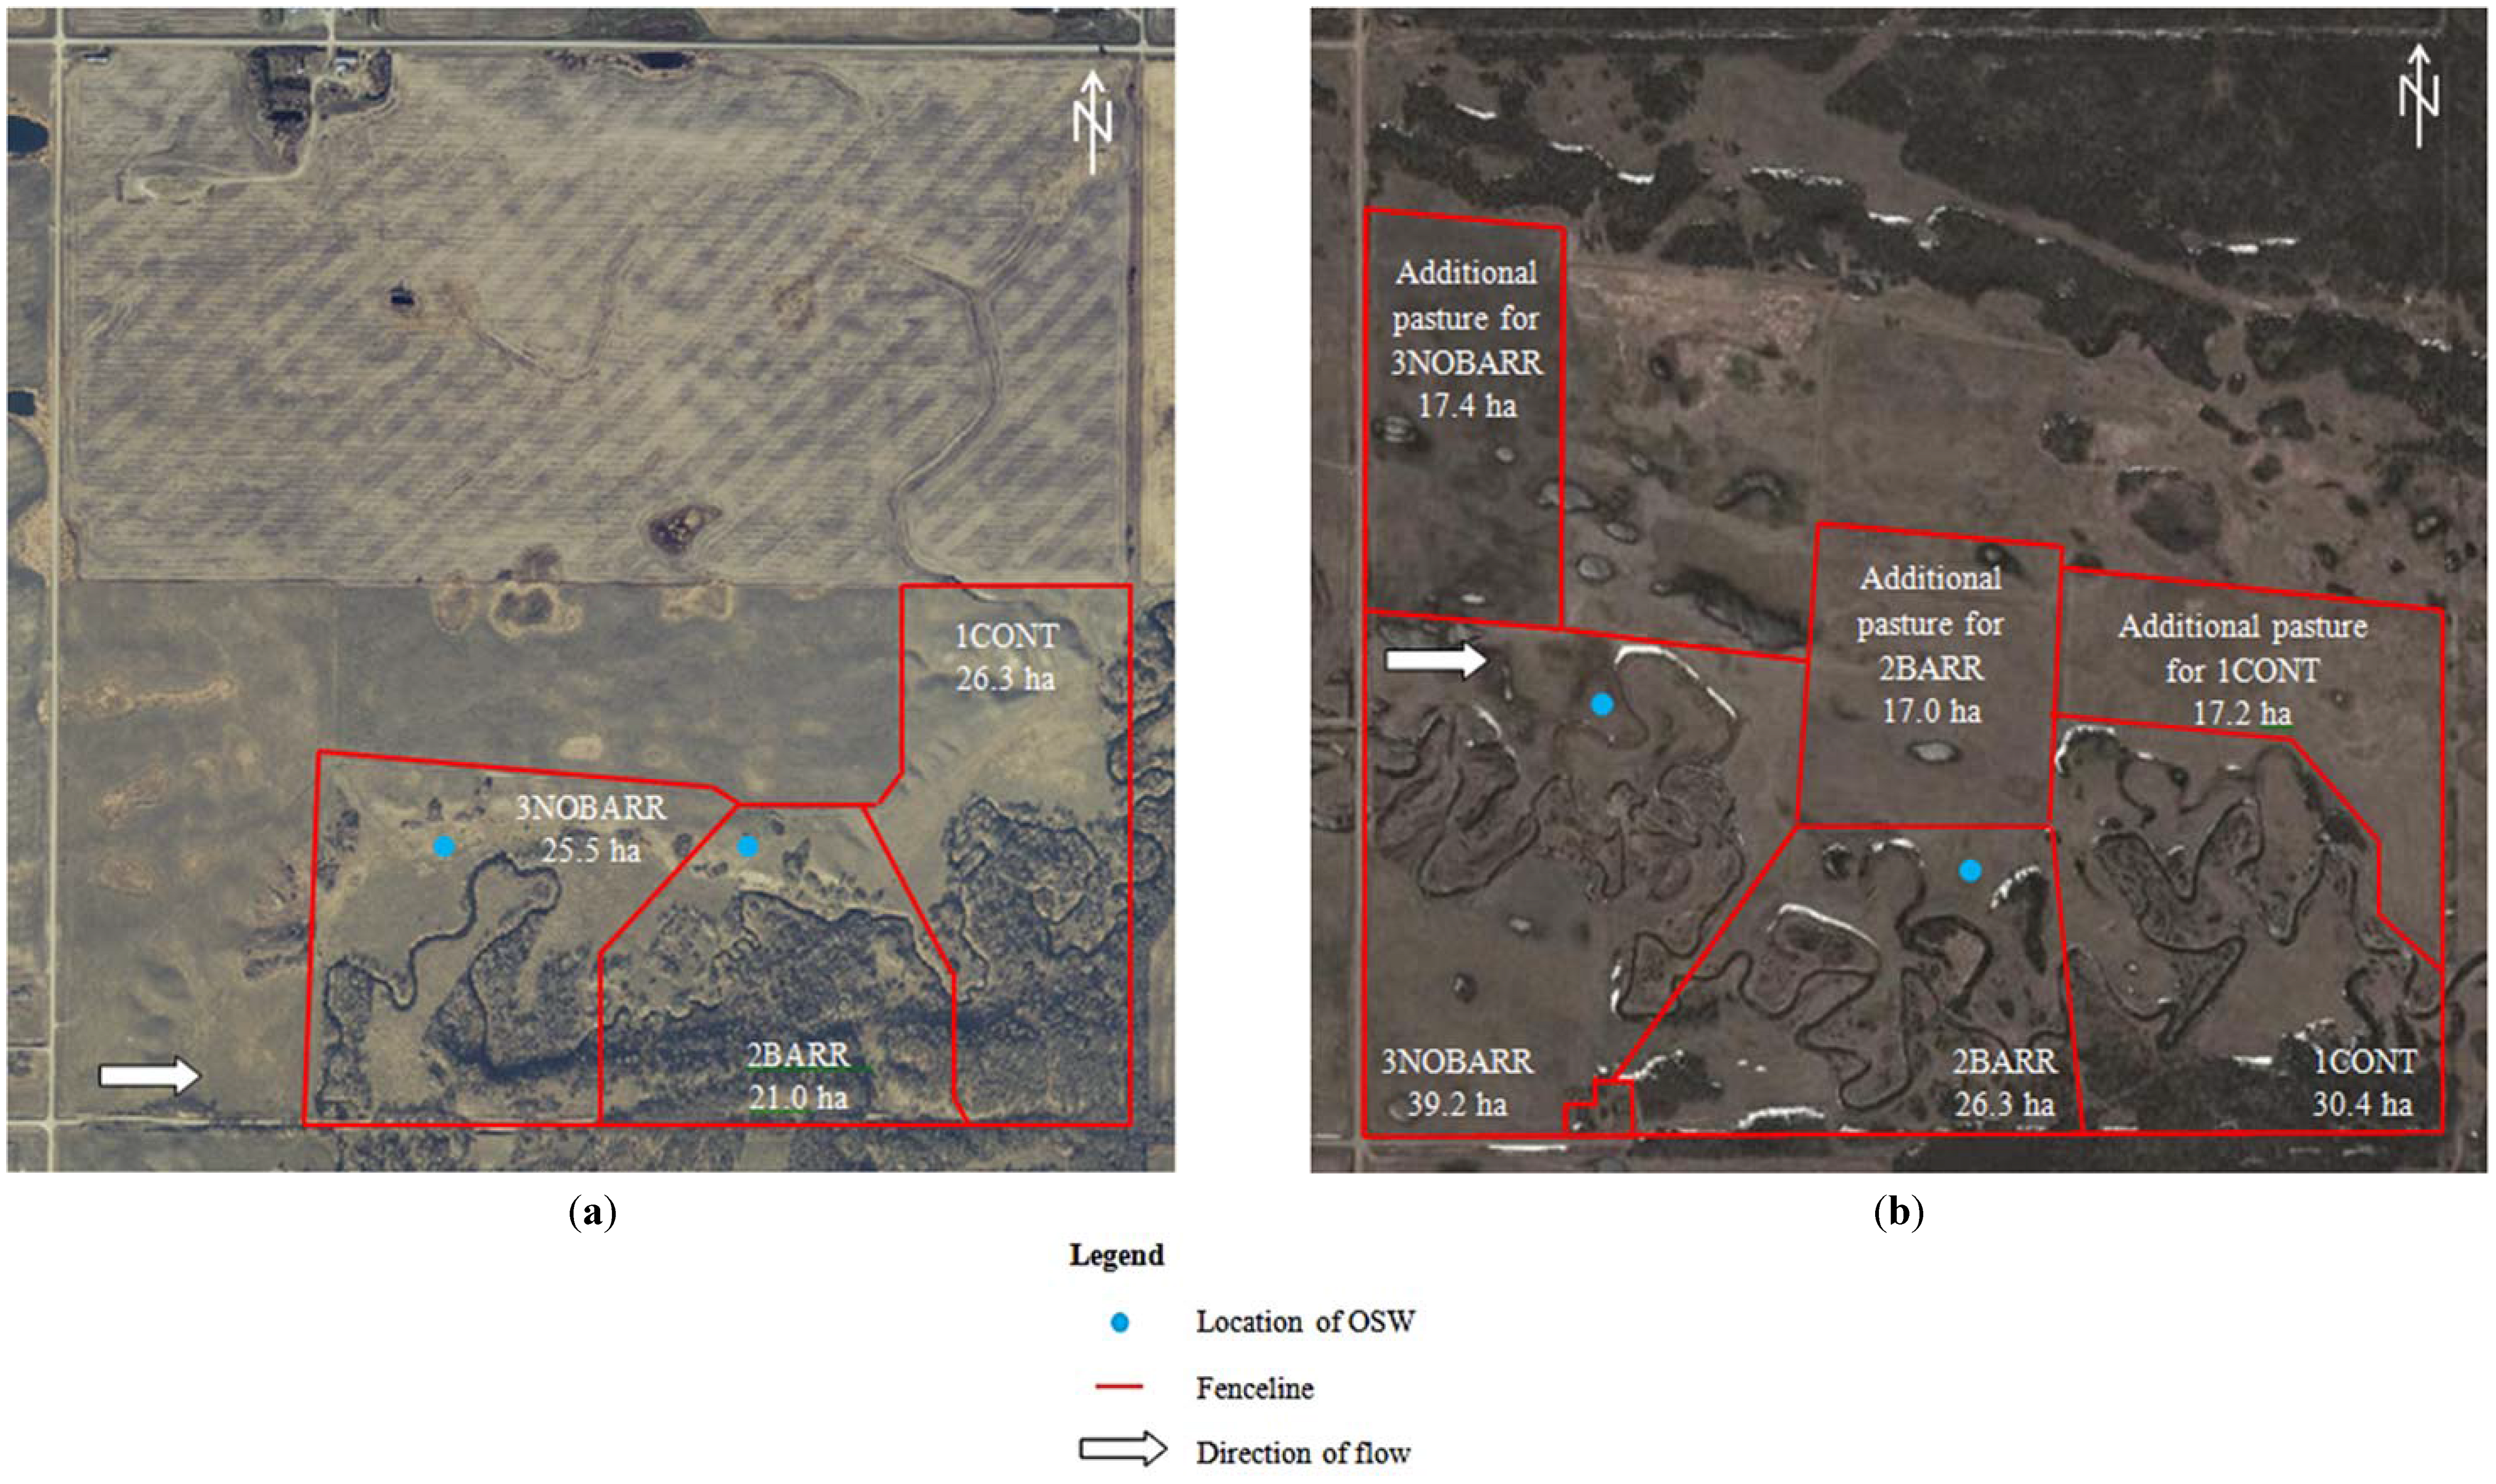
At the Souris site, the grazing areas for 3NOBARR, 2BARR and 1CONT were 39.2, 26.3 and 30.4 ha, respectively. The size of 3NOBARR was 49% bigger than 2BARR. One criterion for deciding the size of grazing area at the beginning of the study was carrying capacity of the pasture; for example, the forage biomass of the upland pasture in 2BARR was 51% higher than 3NOBARR. This variation in the allocated size of pasture may have influenced the behavior of the animals and thereby caused the observed discrepancy at Souris. In the later stage of the grazing season, the animals accessed supplementary pastures (of roughly similar sizes) and that might have changed biomass availability. Cattle at the Souris site spent less time in RP than did the cattle at the Killarney site. The cows at the Souris site were generally older than their counterparts at Killarney. In a study conducted in Oregon, DelCurto
et al. [
23] reported that older cows spent less time in riparian areas than two-year old cows which was attributed to greater familiarity of the terrain.
These mixed results may also indicate that natural and constructed barriers such as those utilized in the current study, may not be sufficient to consistently discourage cattle from spending time within the RP. More specifically, the barriers may not have been large enough to deter cattle from the RP, and if the barrier did serve as a deterrent, cattle may have moved further along the RP to an area without a barrier. It has been suggested that dense or thorny hedges which are unpalatable to cattle (hawthorns or rose bushes) may serve as effective barriers [
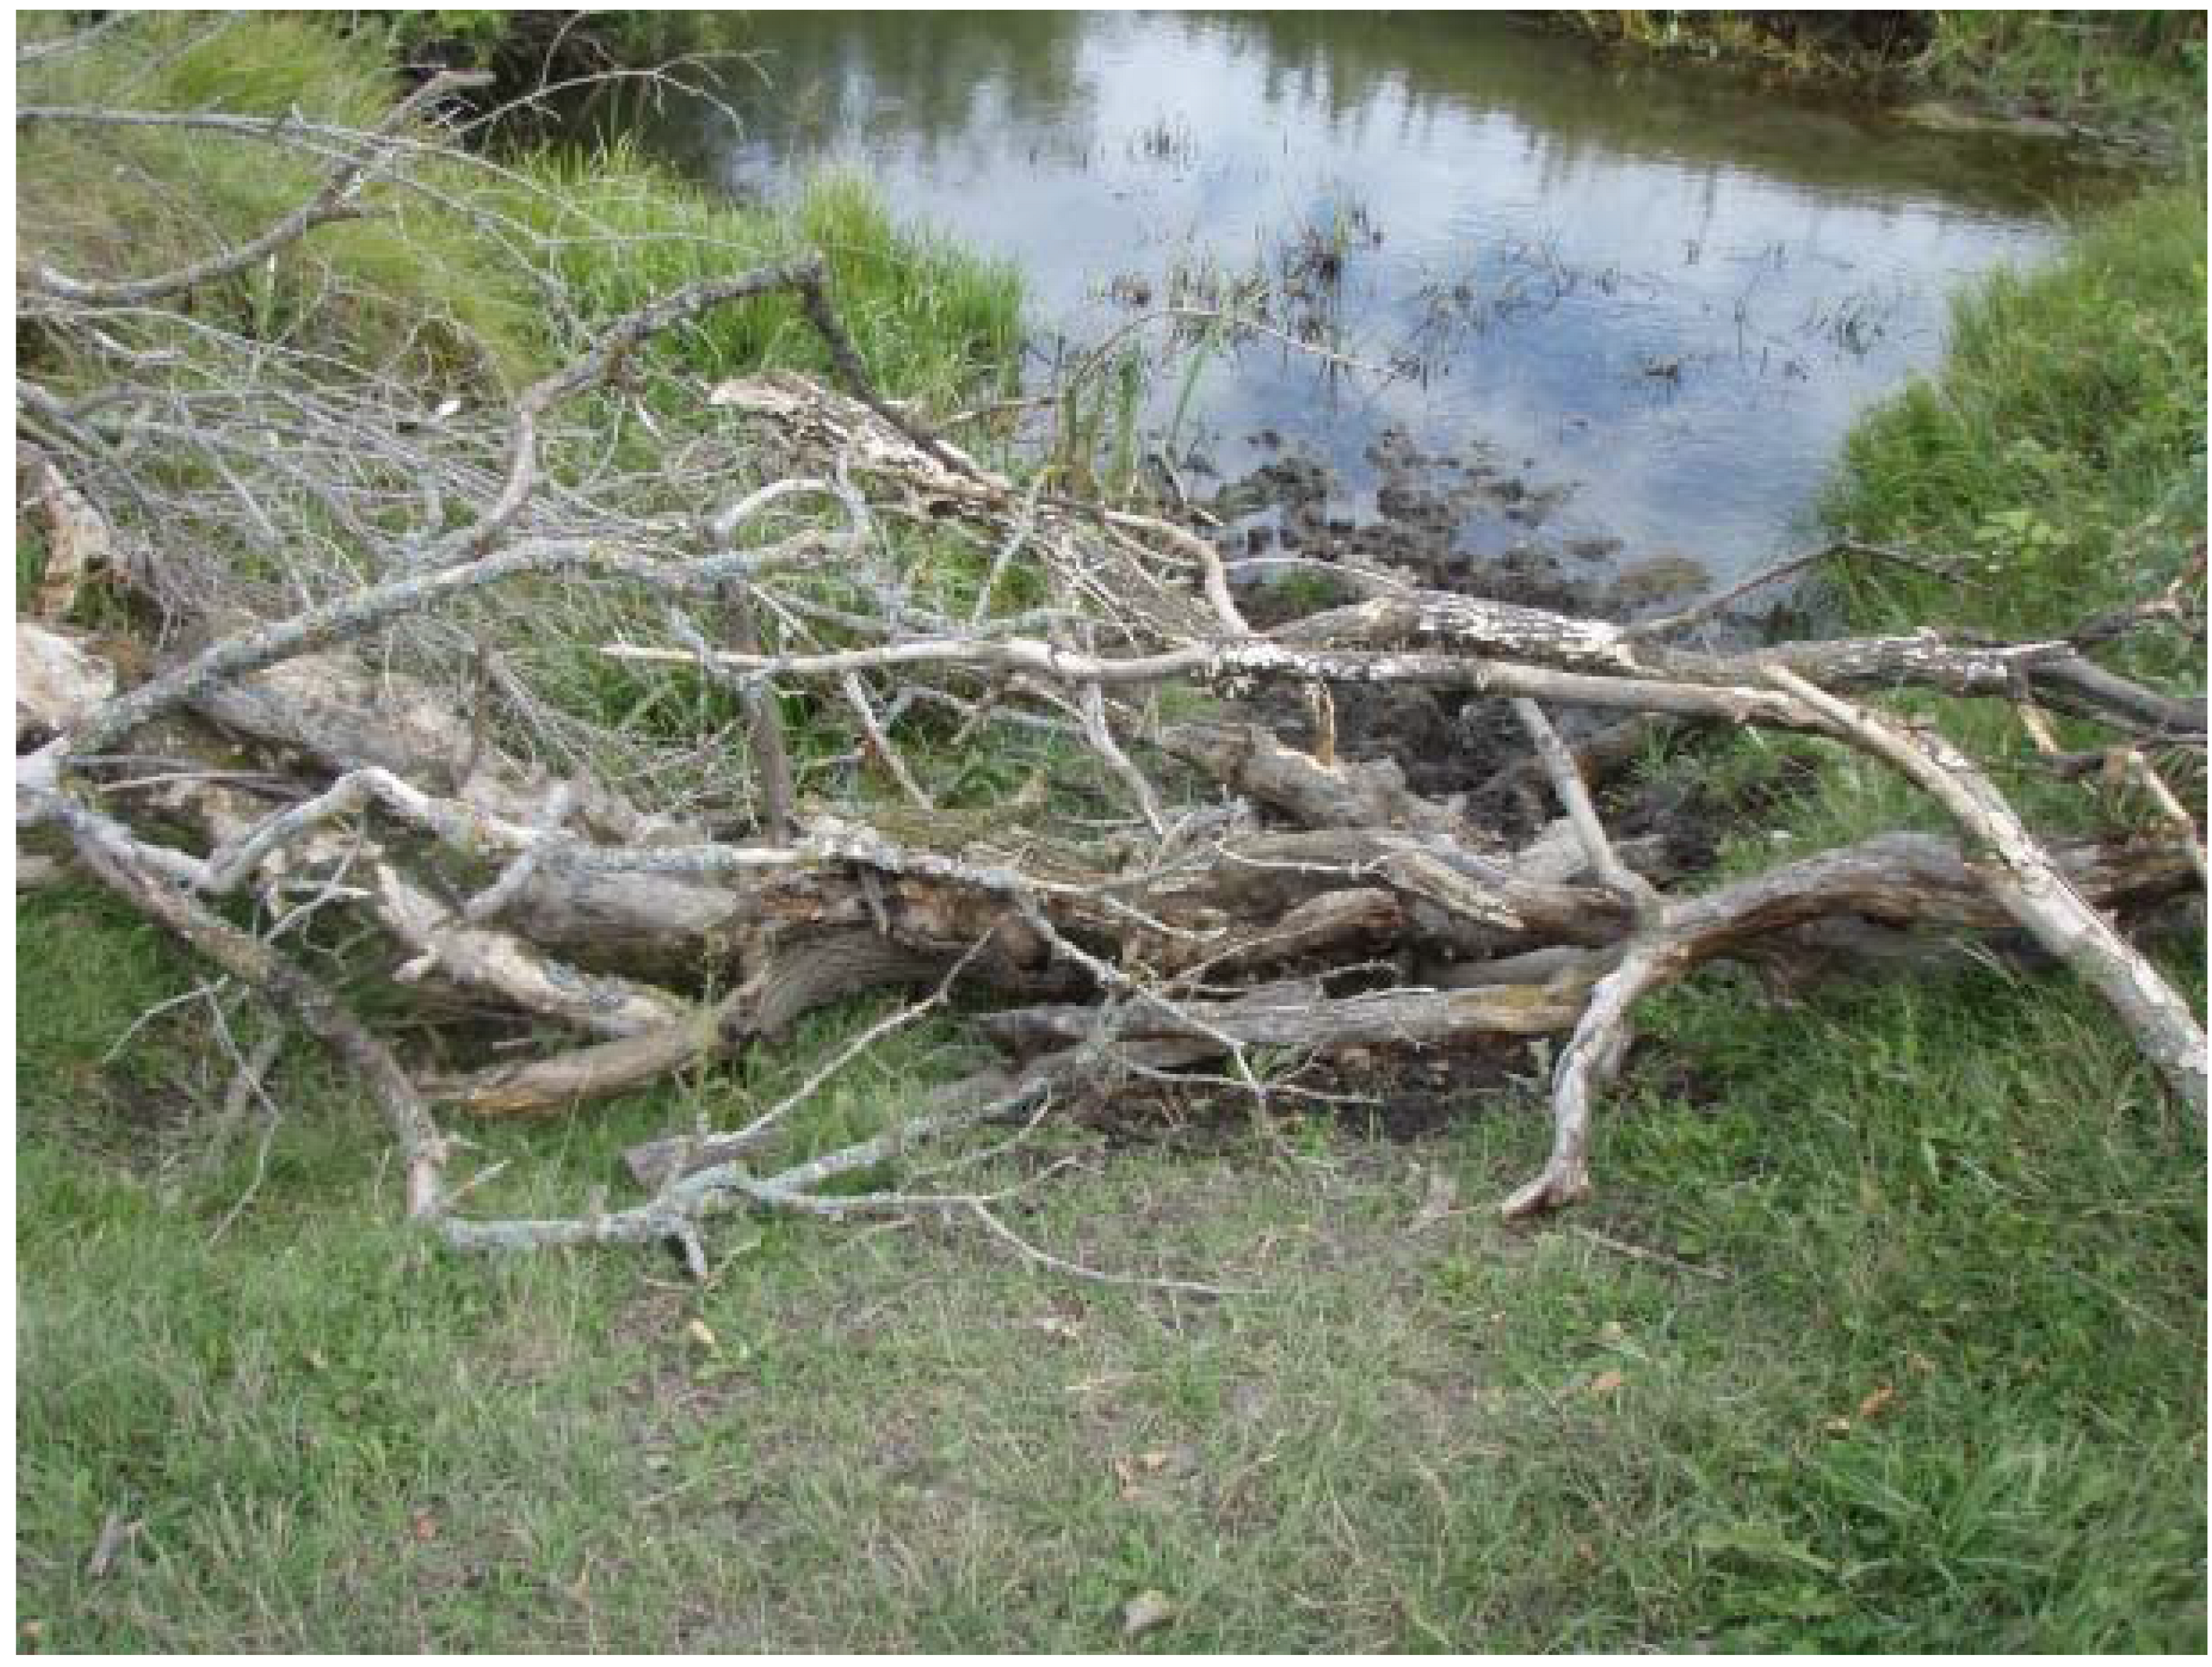
14]. In the present study, using natural deadfall was not consistently successful as the barriers were also time consuming to maintain and cattle seemed to maneuver through the barrier if they entered the stream from the opposite side. Examining the effectiveness of different types of barrier material, such as hedges or strategic fences, may serve to improve the effectiveness of barriers in deterring cattle from watering at the stream, thus encouraging usage of the OSW. The economic implication of the time required to maintain the structures should also be taken into account as it could offset the benefit of using inexpensive materials to construct the barriers. The use of natural barriers, particularly fallen trees, may only be feasible in areas of forested to partly forested riparian areas. In areas with only scattered riparian forests, as is common in arid areas, the use of natural barriers may not be feasible. Other strategies such as placing salt/mineral blocks next to OSW (as was done in this study) is also expected to further attract cattle into the uplands.
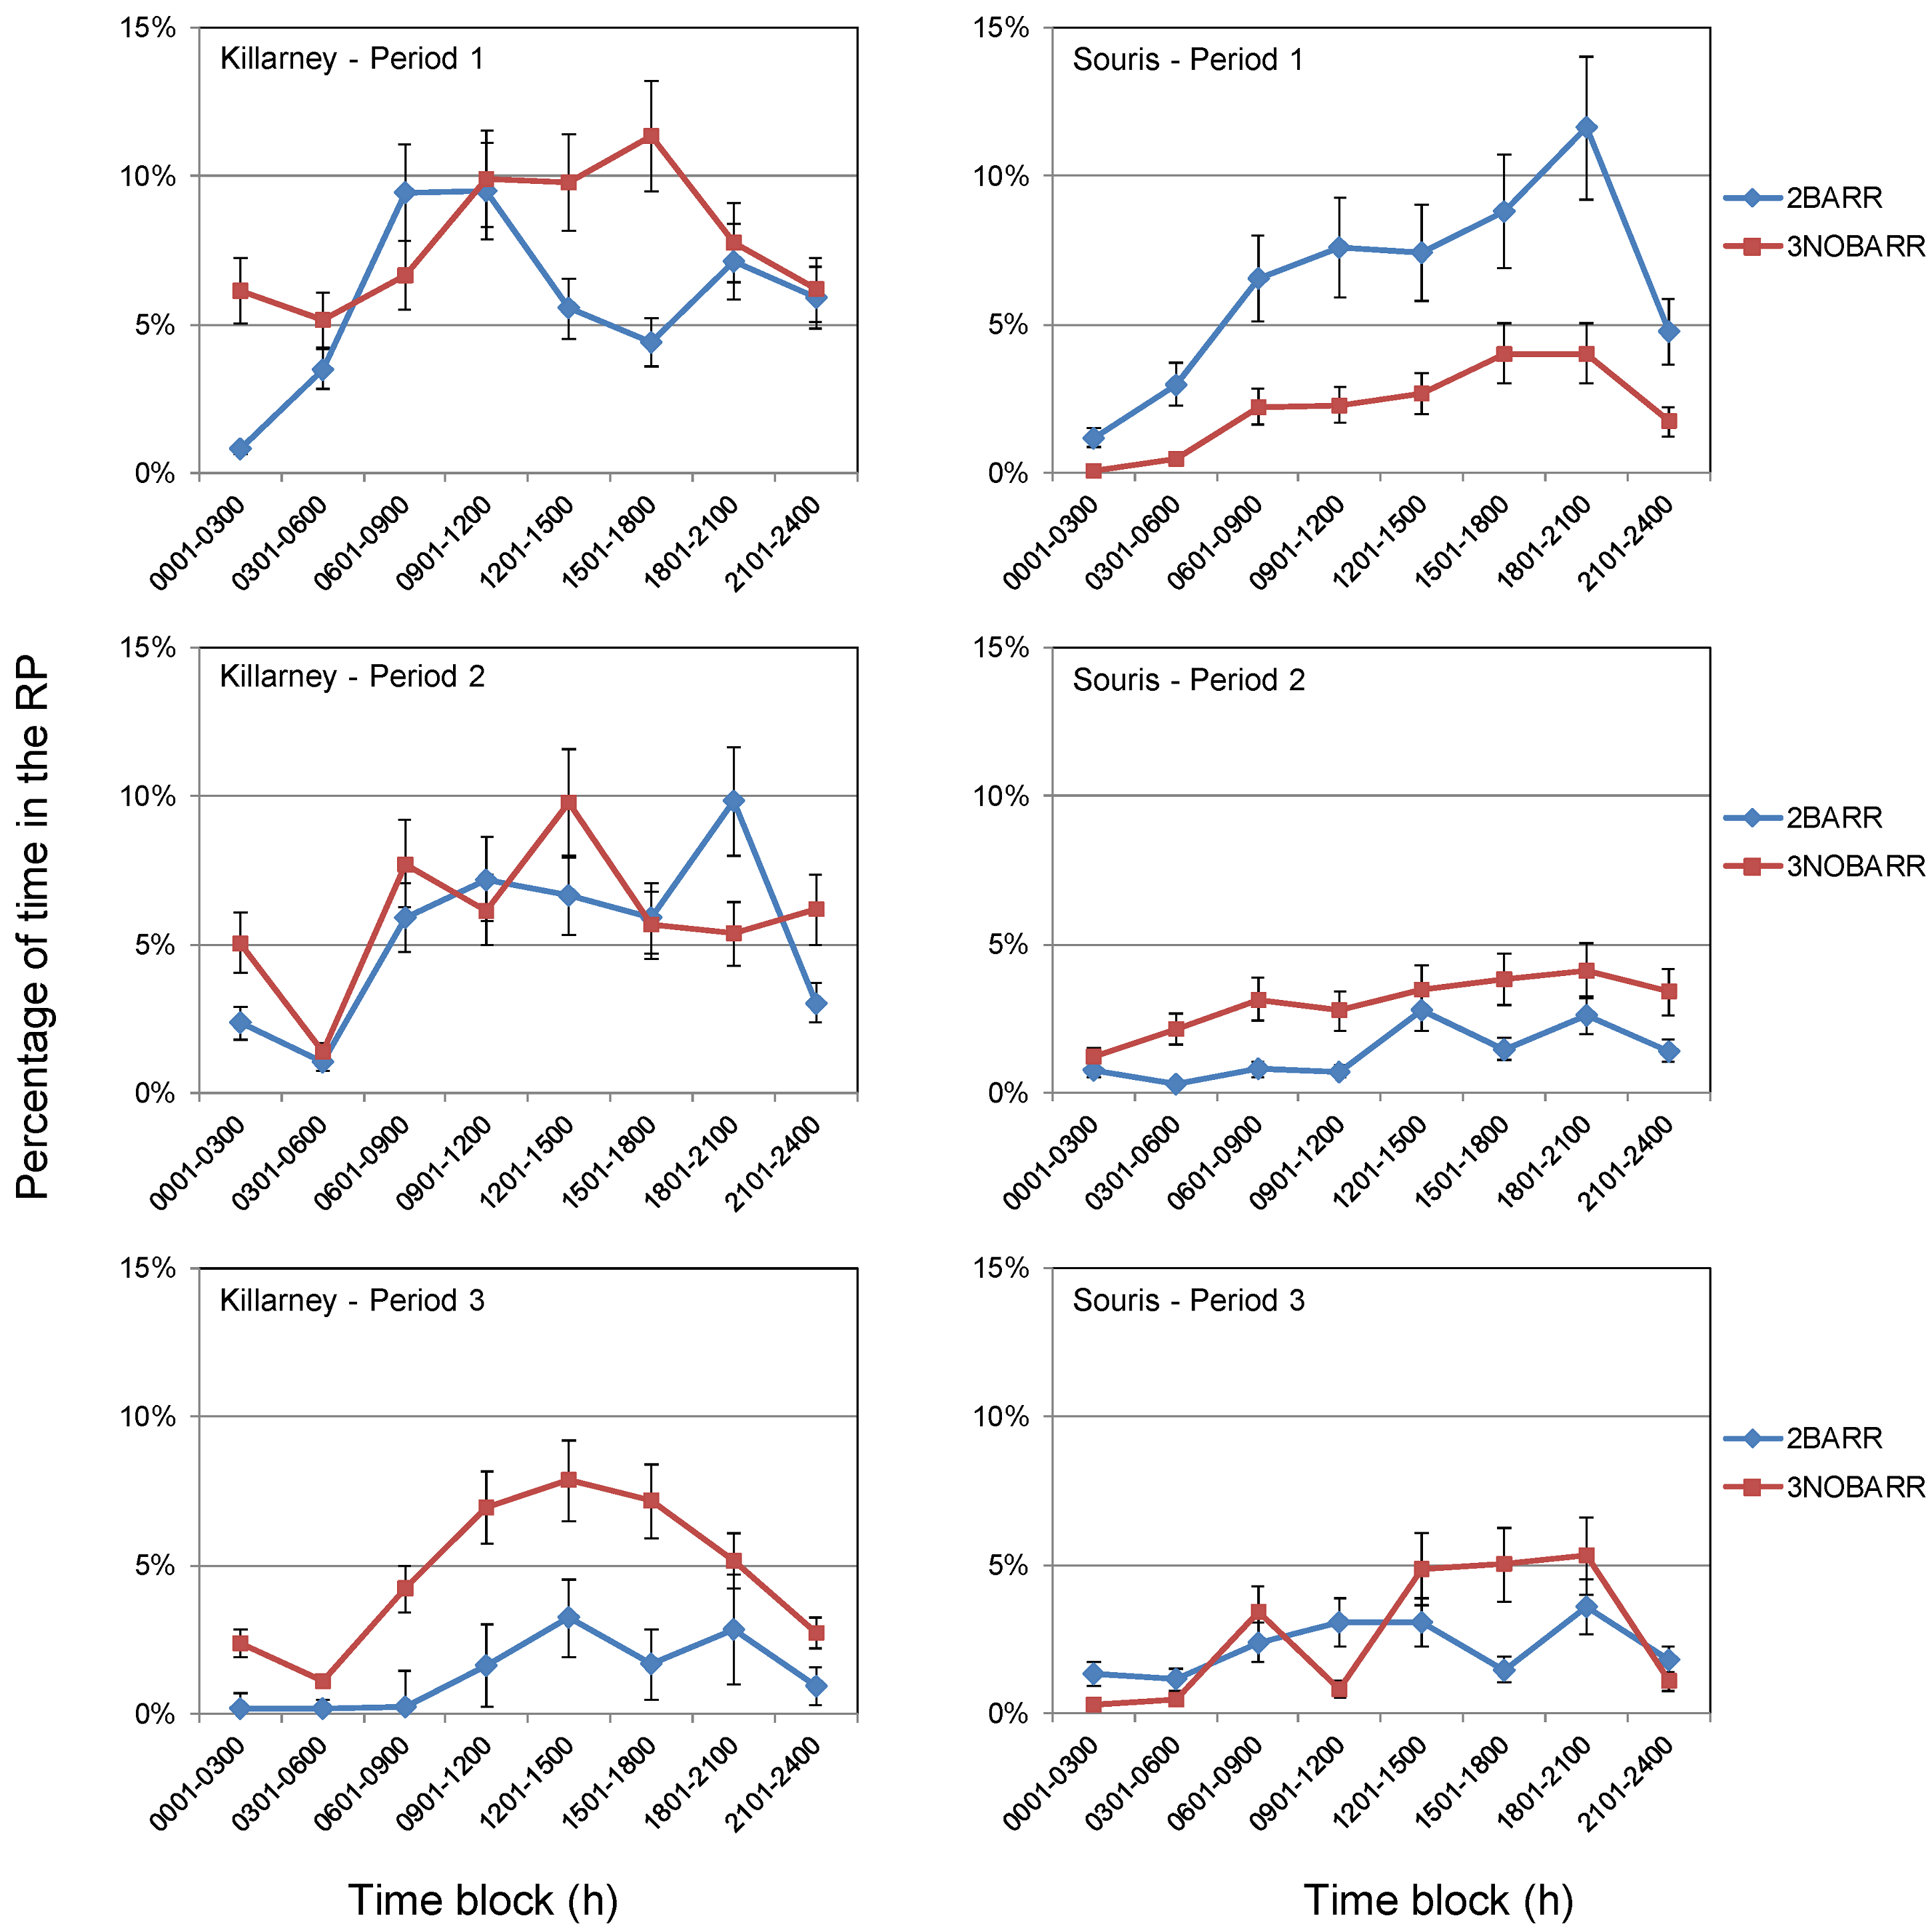
A consistent pattern regarding time spent in the RP was evident as cattle spent the lowest percentage of time in the RP overnight, but a greater percentage of time in the RP as the day progressed, as depicted in
Figure 3. Cattle in 2BARR at the Killarney site spent the greatest percentage of time within the RP from 0901 h to 1200 h, 1801 h to 2100 h, and 1201 h to 1500 h in Periods 1, 2, and 3, respectively. Cattle in 3NOBARR spent the greatest percentage of time in the RP from 1501 h to 1800 h, 1201 h to 1500 h, and 1201 h to 1500 h in Periods 1, 2, and 3, respectively. Cattle in 2BARR appeared to begin the day (0001 to 0600) further from the stream than cattle in 3NOBARR, but the disparity diminished in the first two periods as the day progressed.
Cattle in 2BARR at the Souris site spent the greatest percentage of time within the RP from 1801 h to 2100 h, 1201 h to 1500 h, and 1801 h to 2100 h in Periods 1, 2, and 3, respectively (
Figure 3). Cattle in 3NOBARR spent the greatest percentage of time the RP from 1501 h to 2100 h, 1801 h to 2100 h, and 1801 h to 2100 h in Periods 1, 2, and 3, respectively.
The percentage of time in the RP in each time block fluctuated between periods. However, irrespective of the presence of barriers, a general trend was apparent in that the percentage of time that cattle spent in the RP was limited during the night and early morning (0001 h to 0600 h), increased throughout the late morning (0901 h to 1200 h), remained high throughout the afternoon, and decreased again during the evening (2101 h to 2400 h). This trend is similar to that reported by Gillen
et al. [
24] and Porath
et al. [
22] and follows a similar pattern to that observed for daily temperature. As the temperature increased during the day, cattle spent an increased percentage of time in the RP. Cattle actively seek shade during the hottest part of the day [
25]; therefore, cattle may have spent a greater percentage of time in the RP during the afternoon as they were seeking shade for relief from heat.
In addition to the time of the day effects on the percentage of time cattle spent in the RP, seasonal impacts on distribution were also apparent. The percentage of time 2BARR and 3NOBARR cattle spent within the RP at the Killarney site declined as the grazing season progressed (
Table 2). Cattle in 2BARR spent a greater percentage of time within the RP early in the grazing season at the Souris site, and spent less time as the season progressed.
Cattle at the Killarney site spent more time in the RP in the first two periods, potentially grazing riparian vegetation heavily in the earlier part of the season and moving into the upland pasture in search of more vegetation as the season progressed. The authors cannot conclusively explain the unusual pattern in Souris, but speculate that the cattle were spending more time in the supplemental pastures, allowing for recovery of the main pastures. Porath
et al. [
22] hypothesized that due to the higher rate of forage utilization in the riparian area during the early part of the grazing season, cattle had to travel further from the stream later on in the season in order to find adequate vegetation, which is similar to the behavior observed in 2BARR and 3NOBARR at the Killarney site, and in 2BARR at the Souris site.
Figure 3.
Percent of time cattle at the Killarney and Souris sites spent in the riparian polygon for each time block during Period 1, 2, and 3.
Figure 3.
Percent of time cattle at the Killarney and Souris sites spent in the riparian polygon for each time block during Period 1, 2, and 3.
3.2. Watering Location as Recorded by Visual Observations
At the Killarney site, 100%, 93%, and 100% of observed watering events for the collared cows in 2BARR occurred at the OSW in Periods 1, 2, and 3, respectively (
Figure 4). In 3NOBARR, 50%, 38%, and 40% of observed watering events for collared cows occurred at the OSW in Periods 1, 2, and 3, respectively.
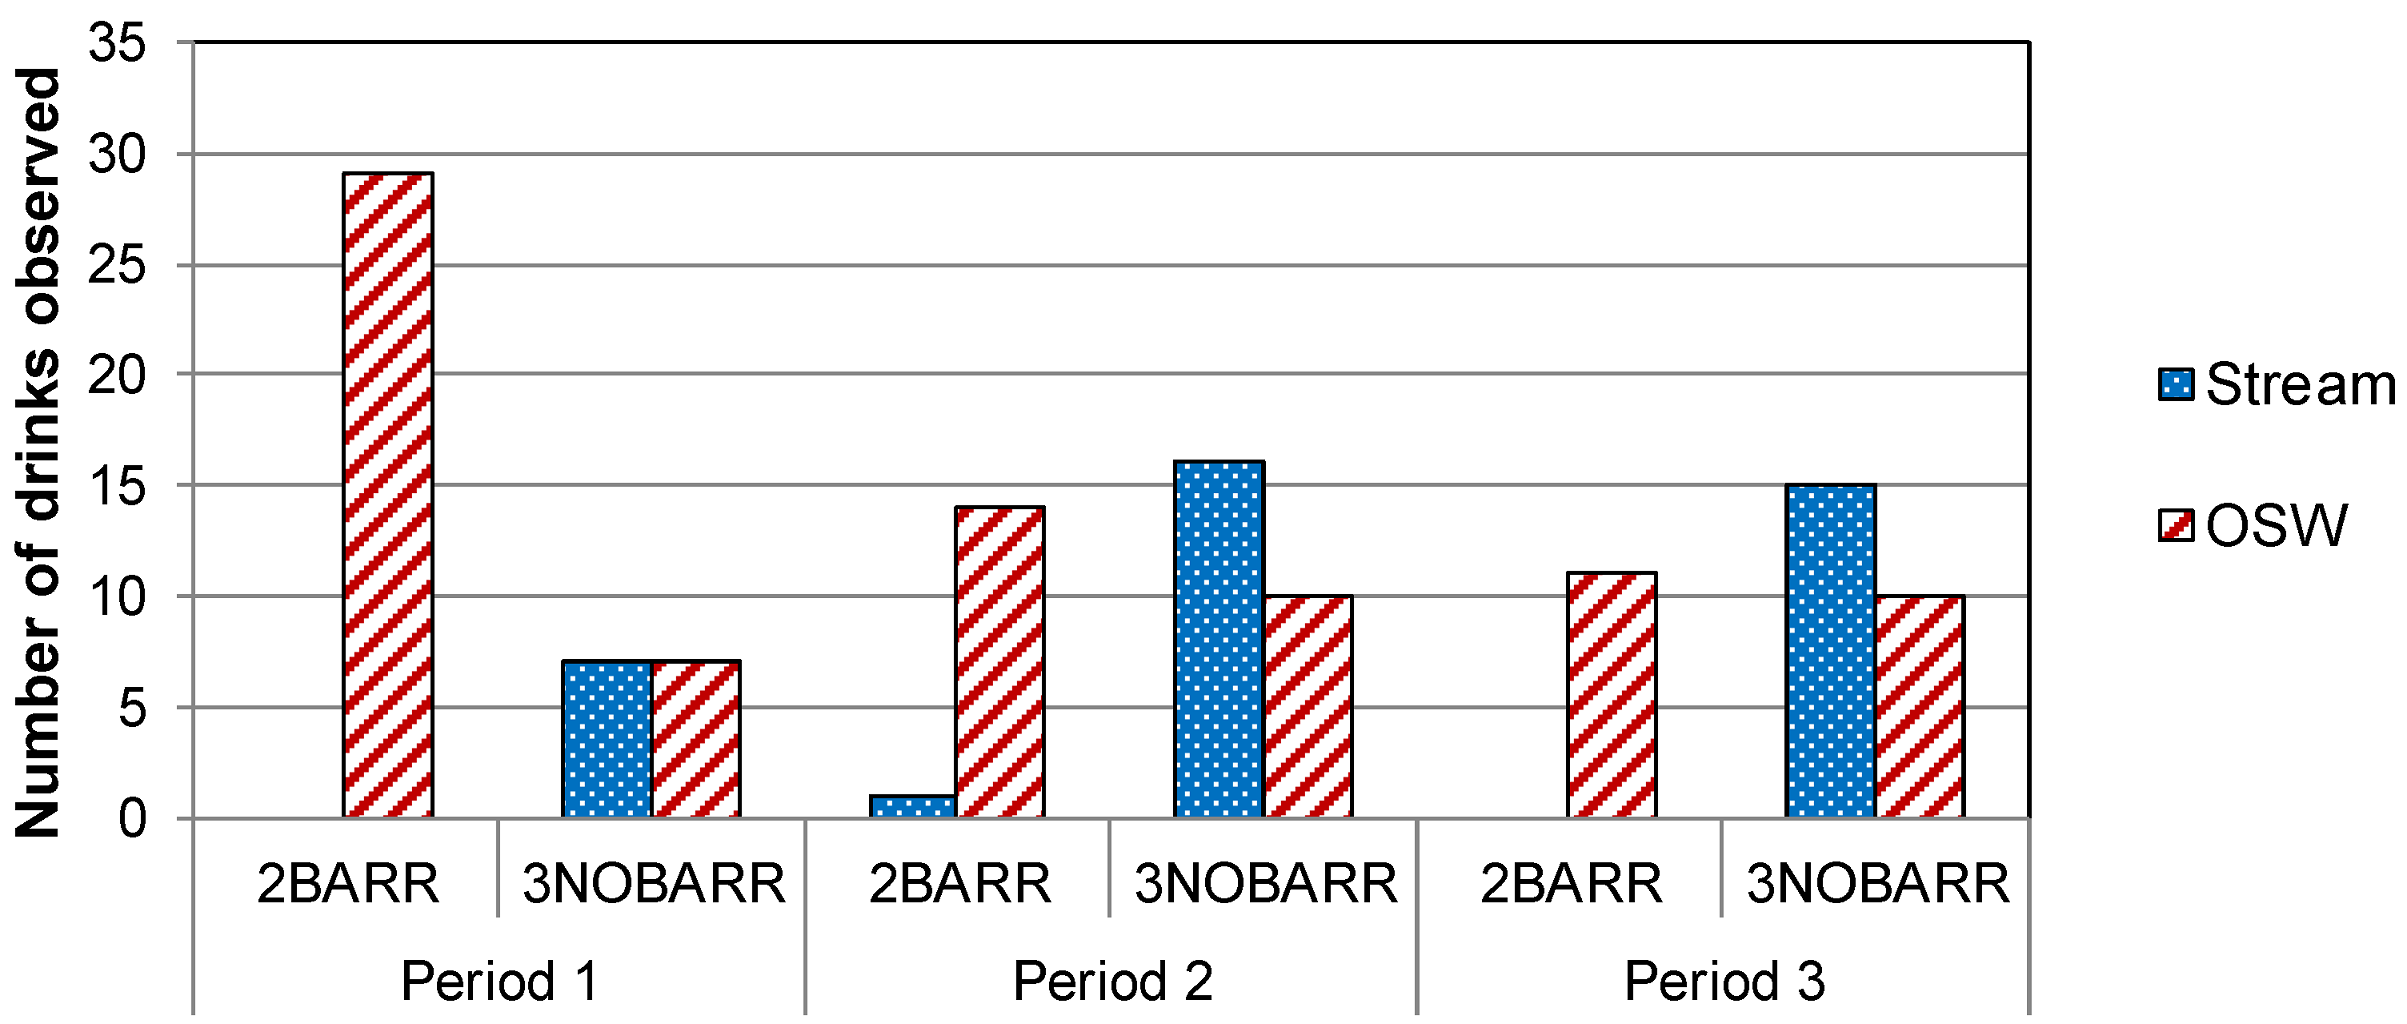
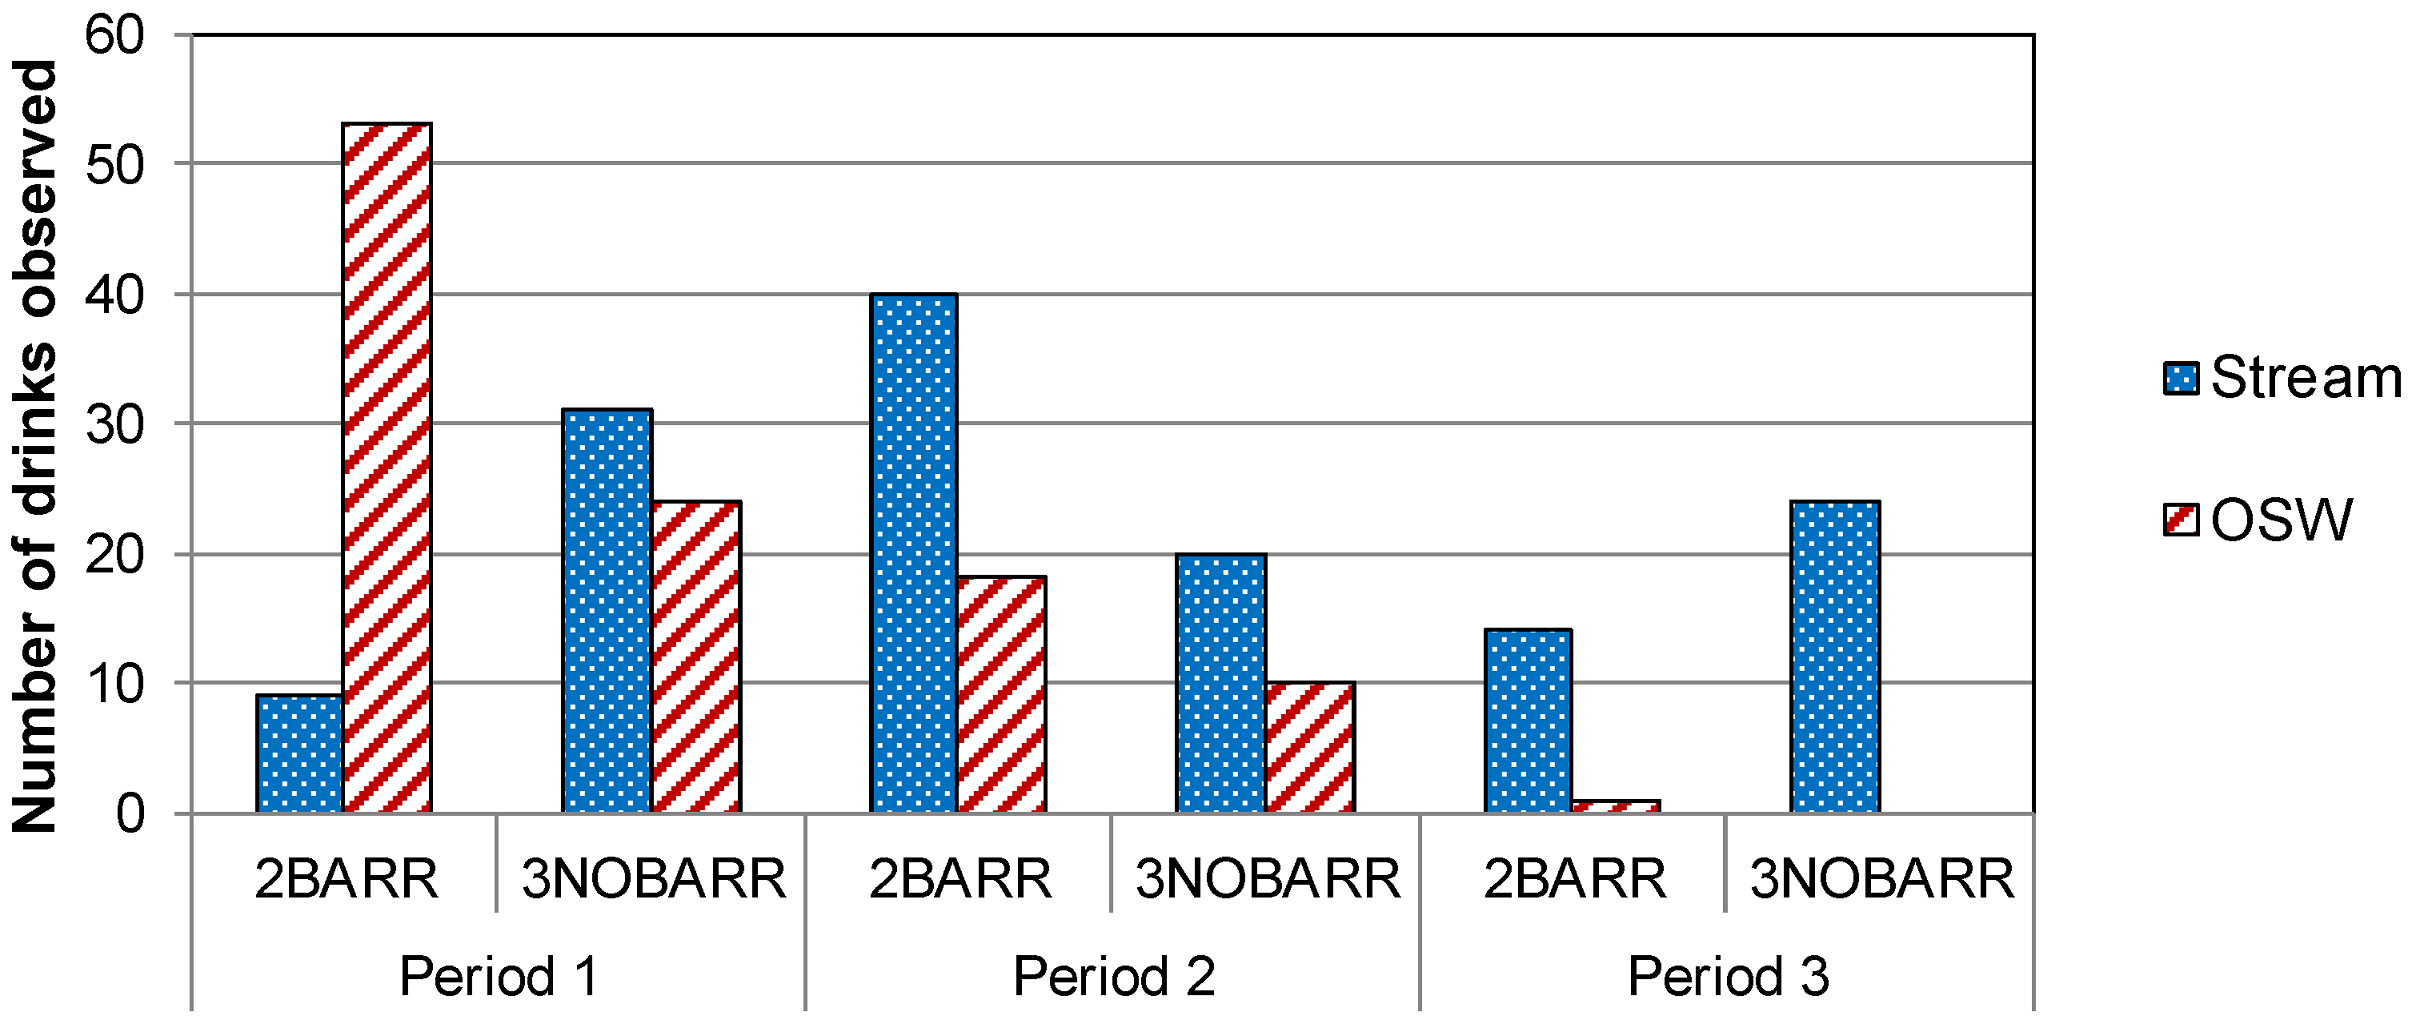
At the Souris site, 85%, 31%, and 7% of observed watering events for the collared cows in 2BARR occurred at the OSW in Periods 1, 2, and 3, respectively (
Figure 5). In 3NOBARR, 44%, 33%, and 0% of observed watering events for collared cows occurred at the OSW in Periods 1, 2, and 3, respectively. The very low percentage of observed watering events at OSW in Period 3 may be partly attributable to the fact that the animals at the Souris site had access to supplementary pastures later in the season, which was comparatively far from the OSW.
Many researchers have found that cattle prefer to water at an OSW compared to a stream when an OSW is available [
8,
10,
13]. In contrast, our results are similar to Bagshaw
et al. [
26], who found that cattle watered at the OSW, but the availability of the OSW did not decrease watering at the stream or time spent in the riparian area. Our results indicate that cattle did water at the OSW; however, they did not use it exclusively. Watering at the stream continued despite the availability of OSW, with the exception of 2BARR at the Killarney, where cattle were consistently observed watering at the OSW.
Figure 4.
Watering location used by collared cows over four days at the Killarney site during Period 1, 2, and 3.
Figure 4.
Watering location used by collared cows over four days at the Killarney site during Period 1, 2, and 3.
Figure 5.
Watering location used by collared cows over four days at the Souris site during Period 1, 2, and 3.
Figure 5.
Watering location used by collared cows over four days at the Souris site during Period 1, 2, and 3.
The observed differences in watering behavior may be attributed to several factors. Veira and Liggins [
13] suggested that dry, firm, and level soil surrounding the OSW provided better footing than watering locations along the stream. In addition, the location of the OSW may also be a critical factor which affects usage. Sheffield
et al. [
10] compared two periods, a pre-BMP period with access to stream only and a post-BMP period with access to stream and OSW (with the OSW located adjacent to the stream), to examine OSW usage in three pastures which were 14.2 ha, 16.6 ha, and 22.3 ha in size. Their results indicated that when given the choice, cattle watered at the OSW 92% of the time compared to the stream. Bryant [
27] examined the impact of placement of an OSW in a 344.8 ha pasture, where the OSW was located 1.5 km upslope from the stream. They observed that exclusive use of the OSW or the stream depended on proximity of cattle to either source within the pasture. This implies that the distance that cattle must travel to their water source will significantly influence the likelihood of usage of an alternative water source, such as an OSW. Pasture size in the current study ranged from 21.0 ha to 39.2 ha with an OSW located exclusively on the north side of the stream in 2BARR and 3NOBARR. Although cattle did water at the OSW, they continued to water at the stream as well, using the OSW as a supplemental source rather than as the primary water source. As observed by Bryant [
27], cattle in the current study likely selected their watering location based on proximity. If cattle were a substantial distance from the OSW, such as the south side of the stream, they were likely unmotivated to travel the distance to the OSW when they could access water from the closer stream source. The size of the pastures in the current study may not be large enough to effectively analyze the impact of placement of an OSW and provide conclusive results. Installing an OSW on both sides of the stream would ensure that cattle had easy access to the OSW, without having to travel further or cross the stream, potentially increasing usage of the OSW. However, installing multiple OSW within a pasture is costly, thus its feasibility is limited.
In some periods, the total number of watering events recorded for individual cows is less than the average number of one to four drinks per day, as reported by Hafez and Bouissou [
28]. Some watering events may have been missed by the observers given the topography and the prominent bush present at the site. Pandey
et al. [
29] found that observations may be missed due to observer fatigue, or from observer proximity effects on livestock.
Placement of OSW may significantly impact the grazing behavior of animals, and thereby the vegetation cover of riparian areas. Rigge
et al. [
30] investigated the optimal placement of OSW using satellite imagery time series of western South Dakota mixed-grass prairie. Their findings suggest that placement of OSW between 200 m and 1250 m from streams provided optimal results in the sites studied. In the present study, the OSW were placed 60 m–120 m from the streams. As optimal placement of OSW was not one of the factors under investigation, site-specific investigation of optimal placement of OSW in commercial scale pastures that contain riparian areas is warranted.
3.3. Temperature-Humidity Index (THI)
Heat stress, as measured by THI, may be classified as follows: THI ≤ 74, normal; 74 < THI < 79, alert; and 79 ≤ THI < 84, danger; and THI ≥ 84, emergency [
19]. Other studies using cow/calf pairs have lowered the threshold for heat stress to account for the heat produced by the lactating cow, thus identifying cattle as heat stressed when the THI exceeds 72 [
31,
32]. The mean, standard deviation (SD), minimum, and maximum THI values were calculated for each 3 h time block in a 24 h period when cattle were fitted with GPS collars (
Table 3).
Mean THI typically increased in the morning, remained highest between 1200 h and 1800 h, and then decreased in the evening. In the current study, the mean THI does not exceed 72 at any point in the day during Period 1, 2, and 3 in 2009. However, the maximum THI exceeded 72 during the 3 h block on a number of days at each site. At the Killarney site, the THI did not exceed 72 in Periods 1 and 2, but did for 7 out of 12 days in Period 3. At the Souris site, the THI of 72 was exceeded five out of 11 days, 5 out of 12 days, and 2 out of 13 days in Period 1, 2, and 3, respectively.
Cattle may be attracted to riparian areas to seek relief when heat stressed [
18,
25]. Franklin
et al. [
32] found that cattle in the Georgia Piedmont region spent a greater proportion of time in the riparian area and the stream when the THI was high (72–84). The overall mean THI in the study by Franklin
et al. [
32] was significantly higher (75) than that observed at Killarney and Souris, which ranged from 60 to 64.
Table 3.
Temperature-humidity index (THI) by time block and period over days when cattle were fitted with GPS collars in Killarney and Souris.
Table 3.
Temperature-humidity index (THI) by time block and period over days when cattle were fitted with GPS collars in Killarney and Souris.
| Site | Period 1 | | Period 2 | | Period 3 |
|---|
| Time Block | Mean | SD | Min | Max | | Mean | SD | Min | Max | | Mean | SD | Min | Max |
|---|
| Killarney |
| 0001–0300 | 53 | 4 | 47 | 60 | | 54 | 6 | 46 | 64 | | 58 | 5 | 48 | 63 |
| 0301–0600 | 52 | 4 | 44 | 58 | | 54 | 7 | 44 | 62 | | 57 | 6 | 46 | 65 |
| 0601–0900 | 57 | 3 | 52 | 62 | | 56 | 4 | 49 | 63 | | 58 | 4 | 52 | 62 |
| 0901–1200 | 63 | 3 | 59 | 67 | | 62 | 2 | 59 | 67 | | 68 | 4 | 61 | 74 |
| 1201–1500 | 66 | 3 | 62 | 69 | | 65 | 3 | 61 | 71 | | 71 | 5 | 64 | 77 |
| 1501–1800 | 66 | 3 | 59 | 69 | | 66 | 3 | 58 | 71 | | 71 | 5 | 63 | 77 |
| 1801–2100 | 64 | 3 | 57 | 68 | | 63 | 3 | 56 | 68 | | 66 | 5 | 58 | 72 |
| 2101–2400 | 57 | 4 | 48 | 64 | | 57 | 4 | 50 | 65 | | 60 | 6 | 51 | 67 |
| Overall mean | 60 | 3 | 44 | 69 | | 60 | 4 | 44 | 71 | | 64 | 5 | 46 | 77 |
| Souris |
| 0001–0300 | 59 | 4 | 51 | 65 | | 56 | 7 | 45 | 66 | | 56 | 7 | 42 | 66 |
| 0301–0600 | 57 | 5 | 51 | 65 | | 53 | 6 | 43 | 62 | | 54 | 8 | 39 | 63 |
| 0601–0900 | 61 | 4 | 55 | 67 | | 58 | 4 | 52 | 64 | | 56 | 5 | 46 | 64 |
| 0901–1200 | 67 | 4 | 61 | 73 | | 68 | 2 | 65 | 71 | | 63 | 5 | 54 | 72 |
| 1201–1500 | 69 | 3 | 64 | 74 | | 71 | 3 | 67 | 74 | | 67 | 5 | 57 | 74 |
| 1501–1800 | 70 | 3 | 65 | 75 | | 71 | 3 | 68 | 75 | | 68 | 5 | 57 | 76 |
| 1801–2100 | 68 | 3 | 64 | 73 | | 69 | 3 | 64 | 74 | | 65 | 5 | 57 | 74 |
| 2101–2400 | 62 | 3 | 56 | 66 | | 61 | 5 | 51 | 68 | | 58 | 6 | 46 | 68 |
| Overall mean | 64 | 4 | 51 | 75 | | 63 | 4 | 43 | 75 | | 61 | 6 | 39 | 76 |
It is possible that the THI observed at Killarney and Souris was not consistently high enough to have a significant impact on cattle behavior [
26]. Furthermore, as previously mentioned, the THI increased between 1200 h and 1800 h, and then decreased the remainder of the day, indicating that cattle at both Killarney and Souris experience night cooling. Previous research has demonstrated that cattle are dependent on cooler night temperatures as it allows them to dissipate the heat they have accumulated throughout the day [
33,
34]. Without night cooling as a means to dissipate heat accumulated throughout the day, cattle may be more attracted to the riparian area to seek out shade or enter the stream to find relief from heat. Cattle in the current study experienced night cooling at both locations, and as such, were presumably able to dissipate the heat they accumulated throughout the day, and thus may not have relied on the riparian area for relief from heat.
3.4. Forage Biomass
Forage biomass at the Killarney site was significantly greater in the riparian area than the upland in 3NOBARR (
p < 0.0001) during Period 1, as well as 1CONT (
p = 0.01) and 2BARR (
p = 0.0002) in Period 2 (
Table 4). The amount of forage biomass available in the upland decreased as the grazing season progressed in 1CONT, 2BARR, and 3NOBARR. However, the amount of forage biomass in the riparian area remained consistent throughout the grazing season in 1CONT, while forage biomass decreased in 2BARR and 3NOBARR. The reduction of the amount of forage biomass in the riparian area of 3NOBARR in Period 3 was relatively large. Although it may be speculated that this is the effect of the natural barrier (partial exclusion), a comparative decline in forage biomass was not observed in 1CONT. From the biomass values (2030.8 kg/ha in 1CONT and 5124.8 kg/ha in 3NOBARR), the riparian area in 3NOBARR might have appeared more attractive for the animals than riparian area in 1CONT. At the Souris site, the accumulation of riparian forage biomass in the second period was sizeable for the 3NOBARR (compared to other systems). This might again be attributable to the size of the grazing area.
Table 4.
Forage biomass (kg/ha) in the riparian and upland areas at the Killarney and Souris sites.
Table 4.
Forage biomass (kg/ha) in the riparian and upland areas at the Killarney and Souris sites.
| Site | Period | Treatment | Forage Biomass (kg/ha) |
|---|
| Upland | Riparian | Significance of parameters |
|---|
| Killarney | 1 | 1CONT | 1565.5 | 2030.8 | 0.29 |
| 2BARR | 1806.0 | 2623.6 | 0.09 |
| 3NOBARR | 2070.5 | 5124.8 | <0.0001 |
| 2 | 1CONT | 1045.9 | 2198.2 | 0.01 |
| 2BARR | 468.9 | 1750.8 | 0.0002 |
| 3NOBARR | 1408.8 | 1289.7 | 0.70 |
| 3 | 1CONT | 985.2 | 2069.6 | 0.21 |
| 2BARR | 849.5 | 935.7 | 0.80 |
| 3NOBARR | 1326.8 | 1317.4 | 0.99 |
| Souris | 1 | 1CONT | 799.8 | 622.8 | 0.48 |
| 2BARR | 780.5 | 1163.4 | 0.22 |
| 3NOBARR | 517.7 | 792.8 | 0.13 |
| 2 | 1CONT | 453.5 | 325.4 | 0.42 |
| 2BARR | 589.0 | 1277.3 | 0.04 |
| 3NOBARR | 356.2 | 1381.6 | 0.01 |
| 3 | 1CONT | 760.0 | 997.0 | 0.42 |
| 2BARR | 845.2 | 1442.5 | 0.22 |
| 3NOBARR | 472.1 | 1676.4 | 0.003 |
Forage biomass at the Souris site was significantly greater in the riparian area than the upland in 2BARR (
p = 0.04) and 3NOBARR (
p = 0.01) during Period 2, as well as 3NOBARR (
p = 0.003) in Period 3 (
Table 4). The amount of forage biomass available in the upland pasture decreased as the grazing season progressed in 1CONT and 3NOBARR, while forage biomass increased in 2BARR. However, the amount of forage biomass in the riparian area increased over the grazing season in 1CONT, 2BARR, and 3NOBARR. Forage biomass was greater in the riparian area compared to upland pasture for the majority of observations from both sites.
The types of vegetation found in Manitoba are typically cool-season or warm-season species. Cool-season species grow early in the spring when more moisture is available, before becoming dormant during the heat of summer. Warm-season species break dormancy later in spring and are able to continue to grow throughout the hot, dry summer months [
35]. Although percent cover of individual grass species was not recorded, the majority of the dominant grass species are cool season, indicating that forage biomass would likely decrease throughout the upland pasture as summer temperatures increased. Forage within riparian areas tends to remain more productive throughout the grazing season as result of the higher water table adjacent to the river or stream [
6]. Results from a study conducted in the neighboring province of Ontario indicated that the nutritional quality and botanical composition of diverse grass-legume pasture varied during the grazing season [
36]. According to Marshall
et al. [
36], the crude protein content began to increase during July through to the end of the grazing season and surpassed levels seen in the beginning of the grazing season (May) while fiber content increased from May to late June and were lowest in the cooler spring and fall months. These fluctuations are partly attributable to the varying growth patterns of complex grass-legume mixtures and climatic factors.
3.5. Animal Performance
As a consequence of differences in animal population, site topography, and precipitation, the weight gain of cows and calves in the two treatments with OSW (2BARR and 3NOBARR) was compared to that for cows and calves in the control treatment (1CONT) at each site. For each class of animal (calves and cows), the significance of treatment, period, and the associated interaction at both sites are provided in
Table 5.
Table 5.
The effect of treatment, period, and their interaction on weight of calves and cows at the Killarney and Souris sites (P-values for each effect from the ANOVA).
Table 5.
The effect of treatment, period, and their interaction on weight of calves and cows at the Killarney and Souris sites (P-values for each effect from the ANOVA).
| Site | Calves/cows | Significance of parameters |
|---|
| Treatment | Period | Treatment × Period |
|---|
| Killarney | Calves | 0.5523 | <0.0001 | 0.1088 |
| Cows | 0.9032 | <0.0001 | <0.0001 |
| Souris | Calves | 0.1454 | <0.0001 | 0.0177 |
| Cows | 0.8891 | <0.0001 | <0.0001 |
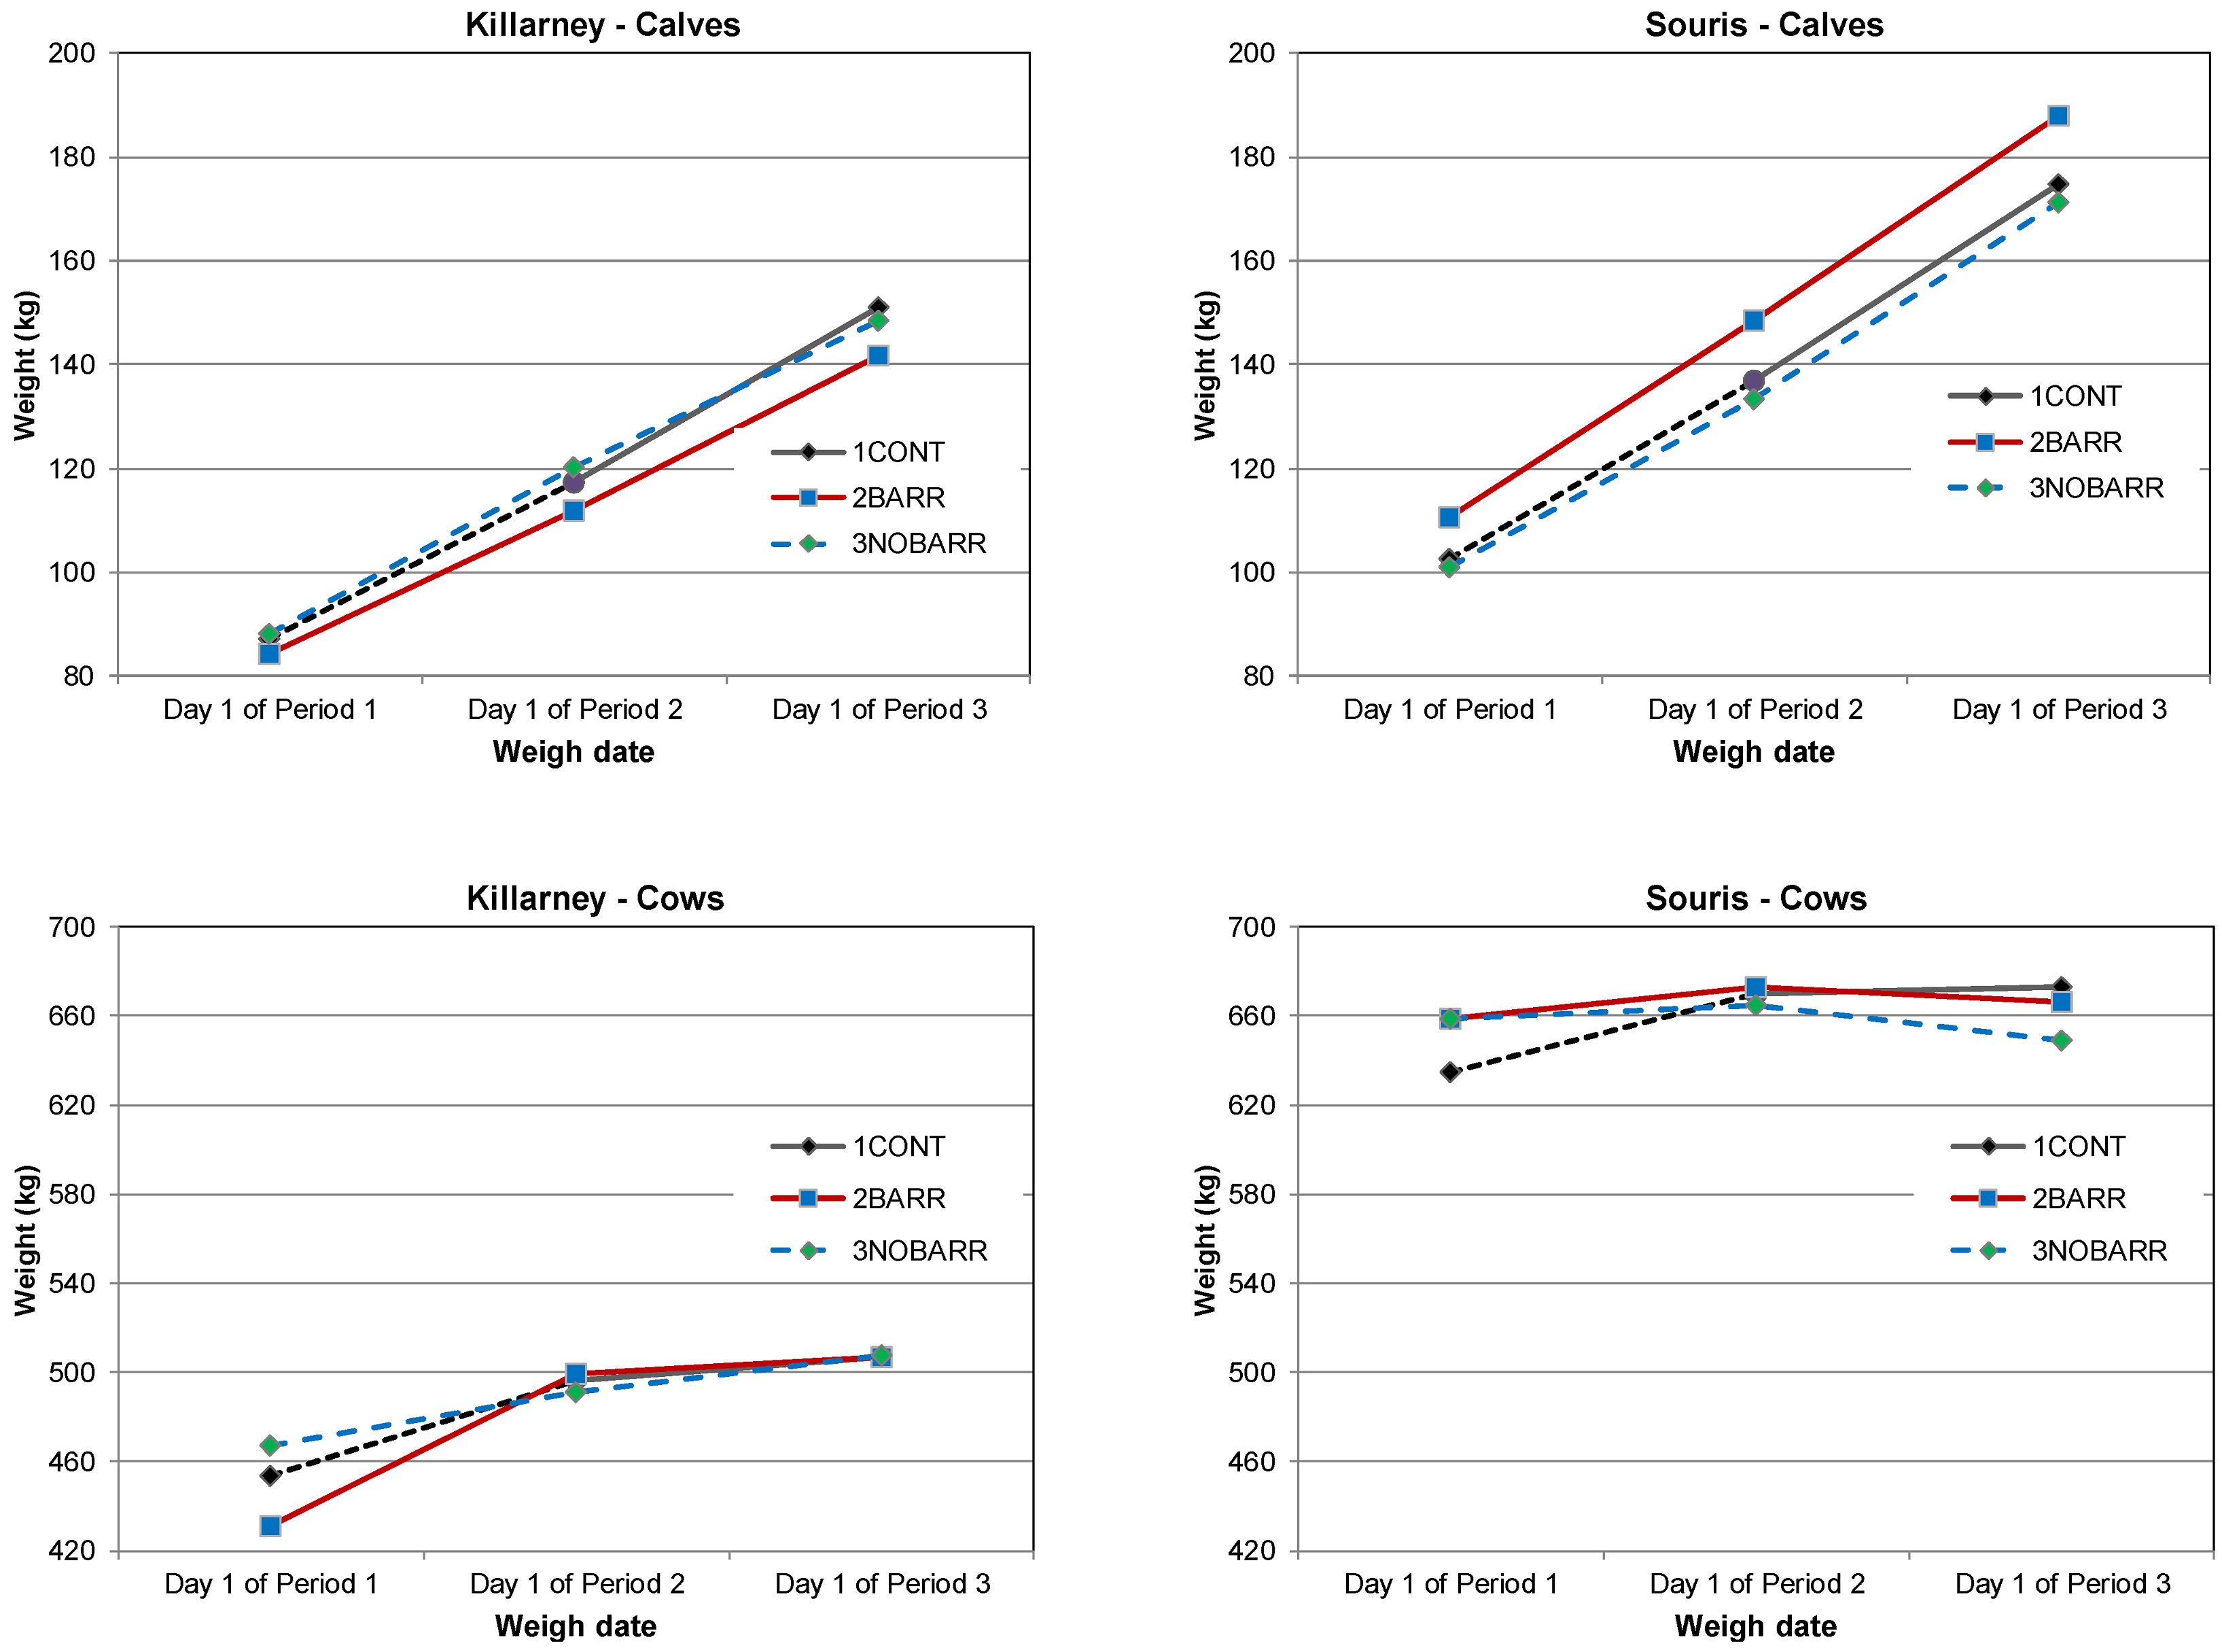
The initial weight of the calves and cows recorded on P1-D1 was used as a reference for treatment differences in subsequent periods, as treatment effects, if important, should appear over time. Treatment differences at the end of the first and second period were compared to differences present at the beginning of the first period (which may be present as a result of random chance). There was no change in weight gain in 2BARR calves from P1-D1 to P2-D1 (
p = 0.4042) compared to weight change realized by 1CONT calves at the Killarney site (
Table 6). However, significant weight change (
p = 0.0242) amongst 2BARR calves did occur from P3-D1 relative to P1-D1, with lower weight gain in 2BARR compared to 1CONT calves (
Figure 6).
Cows in 2BARR at Killarney had significantly greater weight gain compared to 1CONT cows in P2-D1 relative to P1-D1 (
p < 0.0001) and P3-D1 relative to P1-D1 (
p = 0.0001). The positive differences in weight gain between 2BARR cows and 1CONT cows, and the negative differences between 3NOBARR cows and 1CONT suggest the presence of the OSW had an impact on weight gain (
Table 6). However, as the variation in weights was no longer apparent as the season progressed (
Figure 6), the observed differences in weight gain cannot be only attributed to the OSW.
Table 6.
Change in weight of calves and cows over the grazing season at the Killarney and Souris sites.
Table 6.
Change in weight of calves and cows over the grazing season at the Killarney and Souris sites.
| Site | Calves/cows | Treatment compared | Weigh dates | Significance of parameters | Weight change (kg) 1 | Weight change in favour of OSW |
|---|
| Killarney | Calves | 2BARR vs. 1CONT | P2-D1 vs. P1-D1 | 0.4042 | −2.6 (3.1) | − |
| 2BARR vs. 1CONT | P3-D1 vs. P1-D1 | 0.0242 | −6.2 (2.7) | No |
| 3NOBARR vs. 1CONT | P2-D1 vs. P1-D1 | 0.4821 | 2.0 (2.8) | − |
| 3NOBARR vs. 1CONT | P3-D1 vs. P1-D1 | 0.2469 | −3.2 (2.8) | − |
| Cows | 2BARR vs. 1CONT | P2-D1 vs. P1-D1 | <0.0001 | 24.6 (5.7) | Yes |
| 2BARR vs. 1CONT | P3-D1 vs. P1-D1 | 0.0001 | 20.3 (5.1) | Yes |
| 3NOBARR vs. 1CONT | P2-D1 vs. P1-D1 | 0.0003 | −18.9 (5.1) | No |
| 3NOBARR vs. 1CONT | P3-D1 vs. P1-D1 | 0.0058 | −14.2 (5.1) | No |
| Souris | Calves | 2BARR vs. 1CONT | P2-D1 vs. P1-D1 | 0.0937 | 3.7 (2.2) | − |
| 2BARR vs. 1CONT | P3-D1 vs. P1-D1 | 0.0183 | 5.3 (2.2) | Yes |
| 3NOBARR vs. 1CONT | P2-D1 vs. P1-D1 | 0.4326 | −1.7 (2.2) | − |
| 3NOBARR vs. 1CONT | P3-D1 vs. P1-D1 | 0.3966 | −1.9 (2.2) | − |
| Cows | 2BARR vs. 1CONT | P2-D1 vs. P1-D1 | 0.0010 | −21.3 (6.3) | No |
| 2BARR vs. 1CONT | P3-D1 vs. P1-D1 | <0.0001 | −31.2 (6.4) | No |
| 3NOBARR vs. 1CONT | P2-D1 vs. P1-D1 | <0.0001 | −29.4 (6.4) | No |
| 3NOBARR vs. 1CONT | P3-D1 vs. P1-D1 | <0.0001 | −48.0 (6.4) | No |
There was no change in weight gain in 2BARR calves from P1-D1 to P2-D1 (
p = 0.0937) compared to weight change realized by 1CONT calves at the Souris site. However, significant, positive weight change (
p = 0.0183) in 2BARR calves did occur from P3-D1 relative to P1-D1 (
Table 6). Cows in 2BARR had significantly lower weight gain compared to 1CONT cows in P2-D1 relative to P1-D1 (
p = 0.0010) and P3-D1 relative to P1-D1 (
p < 0.0001), as depicted in
Figure 6. Similarly, 3NOBARR cows had significantly lower weight gain compared to 1CONT cows in P2-D1 relative to P1-D1 (
p < 0.0001) and P3-D1 relative to P1-D1 (
p < 0.0001). The negative differences in weight gain between 2BARR and 3NOBARR cows relative to 1CONT cows may suggest the availability of OSW, or other factors such as forage biomass or climate reduced animal performance. However, in view of differences in the size of the grazing areas, forage biomass and the use of supplementary pastures at the Souris site, it was very unlikely that the presence of OSW negatively affected animal performance. Body condition scores (BCS) of all treatment groups fell in between 3 and 3.5 (as per the 5-point BCS system) indicating the cows maintained BCS that would reasonably support reproductive function under western Canadian conditions.
Figure 6.
Average weights of calves and cows at the Killarney and Souris sites.
Figure 6.
Average weights of calves and cows at the Killarney and Souris sites.
Research by Porath
et al. [
22] showed that access to OSW and salt improved the average daily gain (ADG) of cows and calves as compared to those animals that did not have access to OSW or salt. Our results indicated that OSW may improve gains but that improvement is not consistent throughout the grazing season. In some instances, the presence of an OSW may act in favor of animal performance; however, other factors, such as management, available forage biomass, and temperature also impact gain.


