Article

Multi-Omics Analysis Reveals the Negative Effects of High-Concentrate Diets on the Colonic Epithelium of Dumont Lambs

1
Animal Nutrition and Feed Science, Inner Mongolia Agricultural University, Hohhot 010018, China
2
Food Science, Inner Mongolia Agricultural University, Hohhot 010018, China
3
Veterinary Research Institute, Inner Mongolia Academy of Agricultural & Animal Husbandry Sciences, Hohhot 010018, China
*
Author to whom correspondence should be addressed.
Animals 2025, 15(5), 749; https://doi.org/10.3390/ani15050749
Submission received: 13 February 2025 / Revised: 3 March 2025 / Accepted: 3 March 2025 / Published: 5 March 2025

Simple Summary

There are limited systematic studies on the effects of high-concentrate (HC) diets on the colonic health of ruminants. Our study found that HC diets induced a decrease in colonic pH and the accumulation of volatile fatty acids (VFAs), leading to dysbiosis of the microbiota characterized by a reduced abundance of cellulolytic bacteria and an increased abundance of starch-degrading bacteria and opportunistic pathogens. Abnormal metabolites associated with colonic epithelial injury were significantly enriched, and a transcriptomic analysis revealed the inhibition of glutathione metabolism and peroxisome-based antioxidant defense systems, accompanied by an aberrant activation of cytokine receptor interaction pathways. Colonic epithelial integrity was compromised with inflammatory infiltration in the HC group, and serum antioxidant enzyme activity was reduced. These findings suggest that HC diets disrupt colonic microbiome–metabolome homeostasis, impair mucosal barrier function, and induce oxidative stress, ultimately threatening the colonic stability and health of ruminants.

Abstract

Feeding HC diets has been found to induce metabolic dysregulation in the colon. However, the mechanisms by which changes in colonic flora and metabolites damage the colonic epithelium are poorly studied. Therefore, the present experiment used a multi-omics technique to investigate the mechanism of colonic injury induced by high-concentrate diets in lambs. Twelve male Dumont lambs were randomly split into two groups: a low-concentrate diet (LC = concentrate/forage = 30:70) group and a high-concentrate diet (HC = concentrate/forage = 70:30) group. The results showed that the HC group presented significantly increased lipopolysaccharide (LPS) concentrations in the colonic epithelium and significantly decreased serum total cholesterol (TC), superoxide dismutase (SOD), and glutathione peroxidase (GSH-Px) levels (p < 0.05), which led to cavities and inflammatory cell infiltration in the colonic epithelium. The HC group had significantly lower pH and less VFAs in colon contents, as well as a significantly increased abundance of bacteria of the genera [Eubacterium]_coprostanoligenes_group, Rikenellaceae_RC9_gut_group, Treponema, Clostridia_UCG-014, Alistipes, Ruminococcus, Christensenellaceae_R-7_group, UCG-002, Bacteroidales_RF16_group and Lachnospiraceae_AC2044_group compared to the LC diet group. These microorganisms significantly increased the level of metabolites of cholic acid, chenodeoxycholic acid, LysoPA (P-16:0/0:0), methapyrilene, and fusaric acid. A transcriptome analysis showed that cytokine–cytokine receptor interaction, glutathione metabolism, and the peroxisome signaling pathway were downregulated in the colon epithelium of the lambs fed the HC diet. Therefore, the HC diet caused epithelial inflammation and oxidative damage by affecting the interaction between the microbial flora of the colon and metabolites and the host epithelium, which eventually disrupted colon homeostasis and had a negative impact on sheep health.

1. Introduction

Feeding HC diets to satisfy the increased nutritional demands of high-production ruminants is a common practice in livestock management. However, this dietary composition alteration often increases the incidence of nutritional metabolic disorders [1]. Digestion in the hindgut is essential for ruminants; approximately 17% of digestible cellulose is metabolized in the cecum and 13% is metabolized in the colon [2], resulting in the production of around 12% of VFAs [3] and contributing about 8% to the metabolic energy requirements of sheep [4]. When ruminants consume a high proportion of grain feed and a small amount of forage, the VFA and lactic acid concentrations in the rumen increase and the pH decreases, inducing subacute ruminal acidosis (SARA), which causes metabolic disorders of rumen microorganisms and reduces the absorption and barrier ability of rumen epithelial cells [1]. At the same time, the amount of rumen bypass starch entering the hindgut increases [5,6,7]. Due to the absence of saliva and protozoan buffering in the hindgut, coupled with the presence of a mucus layer in the intestinal lumen, which leads to a decrease in pH, VFA absorption is not promoted, causing hindgut acidosis [8,9]. Furthermore, the hindgut epithelium is a monolayer columnar epithelium, which renders the permeability and integrity of the hindgut mucosa more susceptible to compromise [1].
The cecum and colon are colonized by a rich and complex microbiome, dominated by bacteria (more than 95%), including archaea [10]. During digestion and metabolism, intestinal microorganisms communicate with host cells via the production of metabolites and signaling molecules, which affect the metabolism and immunity of the host [11]. Intestinal microorganisms are influenced by many factors, such as diet [12,13,14], feeding method [15], season [16] and genetics [17]. HC diets have been shown to significantly reduce microbial diversity and richness in the ruminant hindgut [12], accompanied by a marked decline in the relative abundance of fibrinolytic bacteria [18] and an increase in amylolytic and pathogenic bacteria, which ultimately affects the intestinal health of the host [19,20]. However, most current studies examining the effects of HC diets on ruminants have primarily focused on the rumen, with less information on metabolic dysregulation in the colon and even less still on the interactions of changes in colon flora and metabolites induced by HC diets with the host epithelium. Therefore, this experiment investigated the interactions of colonic microorganisms and their metabolites with the host on an HC diet.

2. Materials and Methods

2.1. Animal Feeding and Experimental Design

An experiment was conducted at Hailutu Farming Base (40°40′30″ N, 111°21′34″ E) with 12 male Dumont lambs (who had an average weight of 26.37 ± 2.29 kg and were 3 months old). The lambs, sourced from Inner Mongolia Sino Breeding Sheep Technology Co., Ltd (Ulanqab, Inner Mongolia, China). were randomly assigned to two groups. The lambs were housed in individual metabolic cages (1.5 m × 1 m × 1 m) with ad libitum access to water and fed twice daily at 08:00 and 18:00. The control group received a low-concentrate diet (LC = concentrate/forage = 30:70), while the experimental group received an HC diet (HC = concentrate/forage = 70:30). The pre-feeding period lasted 15 days, followed by a 60-day experimental period. Diet composition and nutritional details are provided in Table A1.

2.2. Sample Collection

After the experiment, blood was collected from the jugular vein of the lambs immediately post-mortem (the LC group’s average weight was 36.70 ± 1.20 kg, and the HC group’s average weight was 41.79 ± 3.89 kg). Lambs were exsanguinated according to the Interim Regulations on the Management of Livestock and Poultry Slaughtering in Hohhot issued by the People’s Government of Hohhot, China. Colonic contents were collected for pH measurement. Furthermore, the colon tissue was washed with PBS post-mortem. Approximately 1 cm of the intestinal segment of the colon was collected and fixed using a 4% paraformaldehyde solution for a histological analysis. Colon contents were collected with a sterile medicine spoon and placed into a freezing tube for quick freezing with liquid nitrogen. Colonic epithelial tissues were rinsed with pre-cooled phosphate-buffered saline (PBS) and then epithelium was separated from underlying layers by scraping using a coverslip, and the cells were frozen in a tube containing 0.5 mL RNase inhibitor (BeyotimeBiotechnology, Shanghai, China) and subsequently stored at −80 °C.

2.3. Histological Analysis of Colon Tissue

The fixed colon tissues were subjected to paraffin sectioning and hematoxylin–eosin (HE) staining according to conventional methods. Colon morphology was observed under a microscope (Nikon, Minato-ku, Tokyo Metropolis, Japan).

2.4. Measurement of Colonic Epithelial LPS Content and Serum Parameters

Serum total protein (TP), albumin (ALB), globulin (GLB), glucose (GLU), total cholesterol (TC), and triglyceride (TG) levels were measured using a biochemical analyzer, with kits supplied by Lepu Diagnostic Technology Co., Ltd., (Beijing, China). The kits for serum immunoglobulin A (IgA), immunoglobulin M (IgM), immunoglobulin G (IgG), serum smyloid A (SAA), interleukin-1β (IL-1β), tumor necrosis factor–α (TNF-α), interleukin–6 (IL-6), superoxide dismutase (SOD), glutathione peroxidase (GSH-Px), and colon LPS concentrations were provided by Wuhan Gene Biotechnology Co., Ltd., (Wuhan, Hubei, China).

2.5. Quantitative Real-Time PCR Analysis

Total colonic RNA was extracted using Trizol (TaKaRa Bio, Kyoto, Kyoto Prefecture, Japan) and reverse-transcribed into cDNA after confirming the concentration and purity using a Nanodrop 2000 (Thermo Scientific, Waltham, MA, USA). The primer sequences are listed in Table A2. qRT-PCR was performed, with β-actin and glyceraldehyde-3-phosphate dehydrogenase (GAPDH) as the internal references. The amplification conditions were 95 °C for 30 s (pre-denaturation), followed by 40 cycles of 95 °C for 5 s and 60 °C for 20 s. Gene expression was calculated using the 2−ΔΔCt method.

2.6. Measurement of VFA Concentration

The VFA concentrations in the colon were analyzed using gas chromatography, following the method of Tao et al. [7]. First, 2.0 g of the colon content was mixed with 2 mL of distilled water, thawed at 4 °C, and vortexed. After centrifugation at 10,000× g for 20 min at 4 °C, 1.5 mL of the supernatant was mixed with 200 μL of 2-EB, vortexed, and filtered through a 0.22 μm membrane into a sample vial. An analysis was performed using a Shimadzu GC-2014C gas chromatograph (Shimadzu, Kyoto, Kyoto Prefecture, Japan), equipped with a DB-FFAP capillary column (30 m × 0.50 μm × 0.250 mm). The chromatographic conditions were as follows: The injection port and detector temperatures were set to 220 °C and 250 °C, respectively. The column temperature was maintained at 60 °C for 1 min and then increased to 115 °C at 5 °C/min, followed by a rise to 180 °C at 15 °C/min. The VFA concentrations were determined by measuring the peak areas and comparing them to a standard curve.

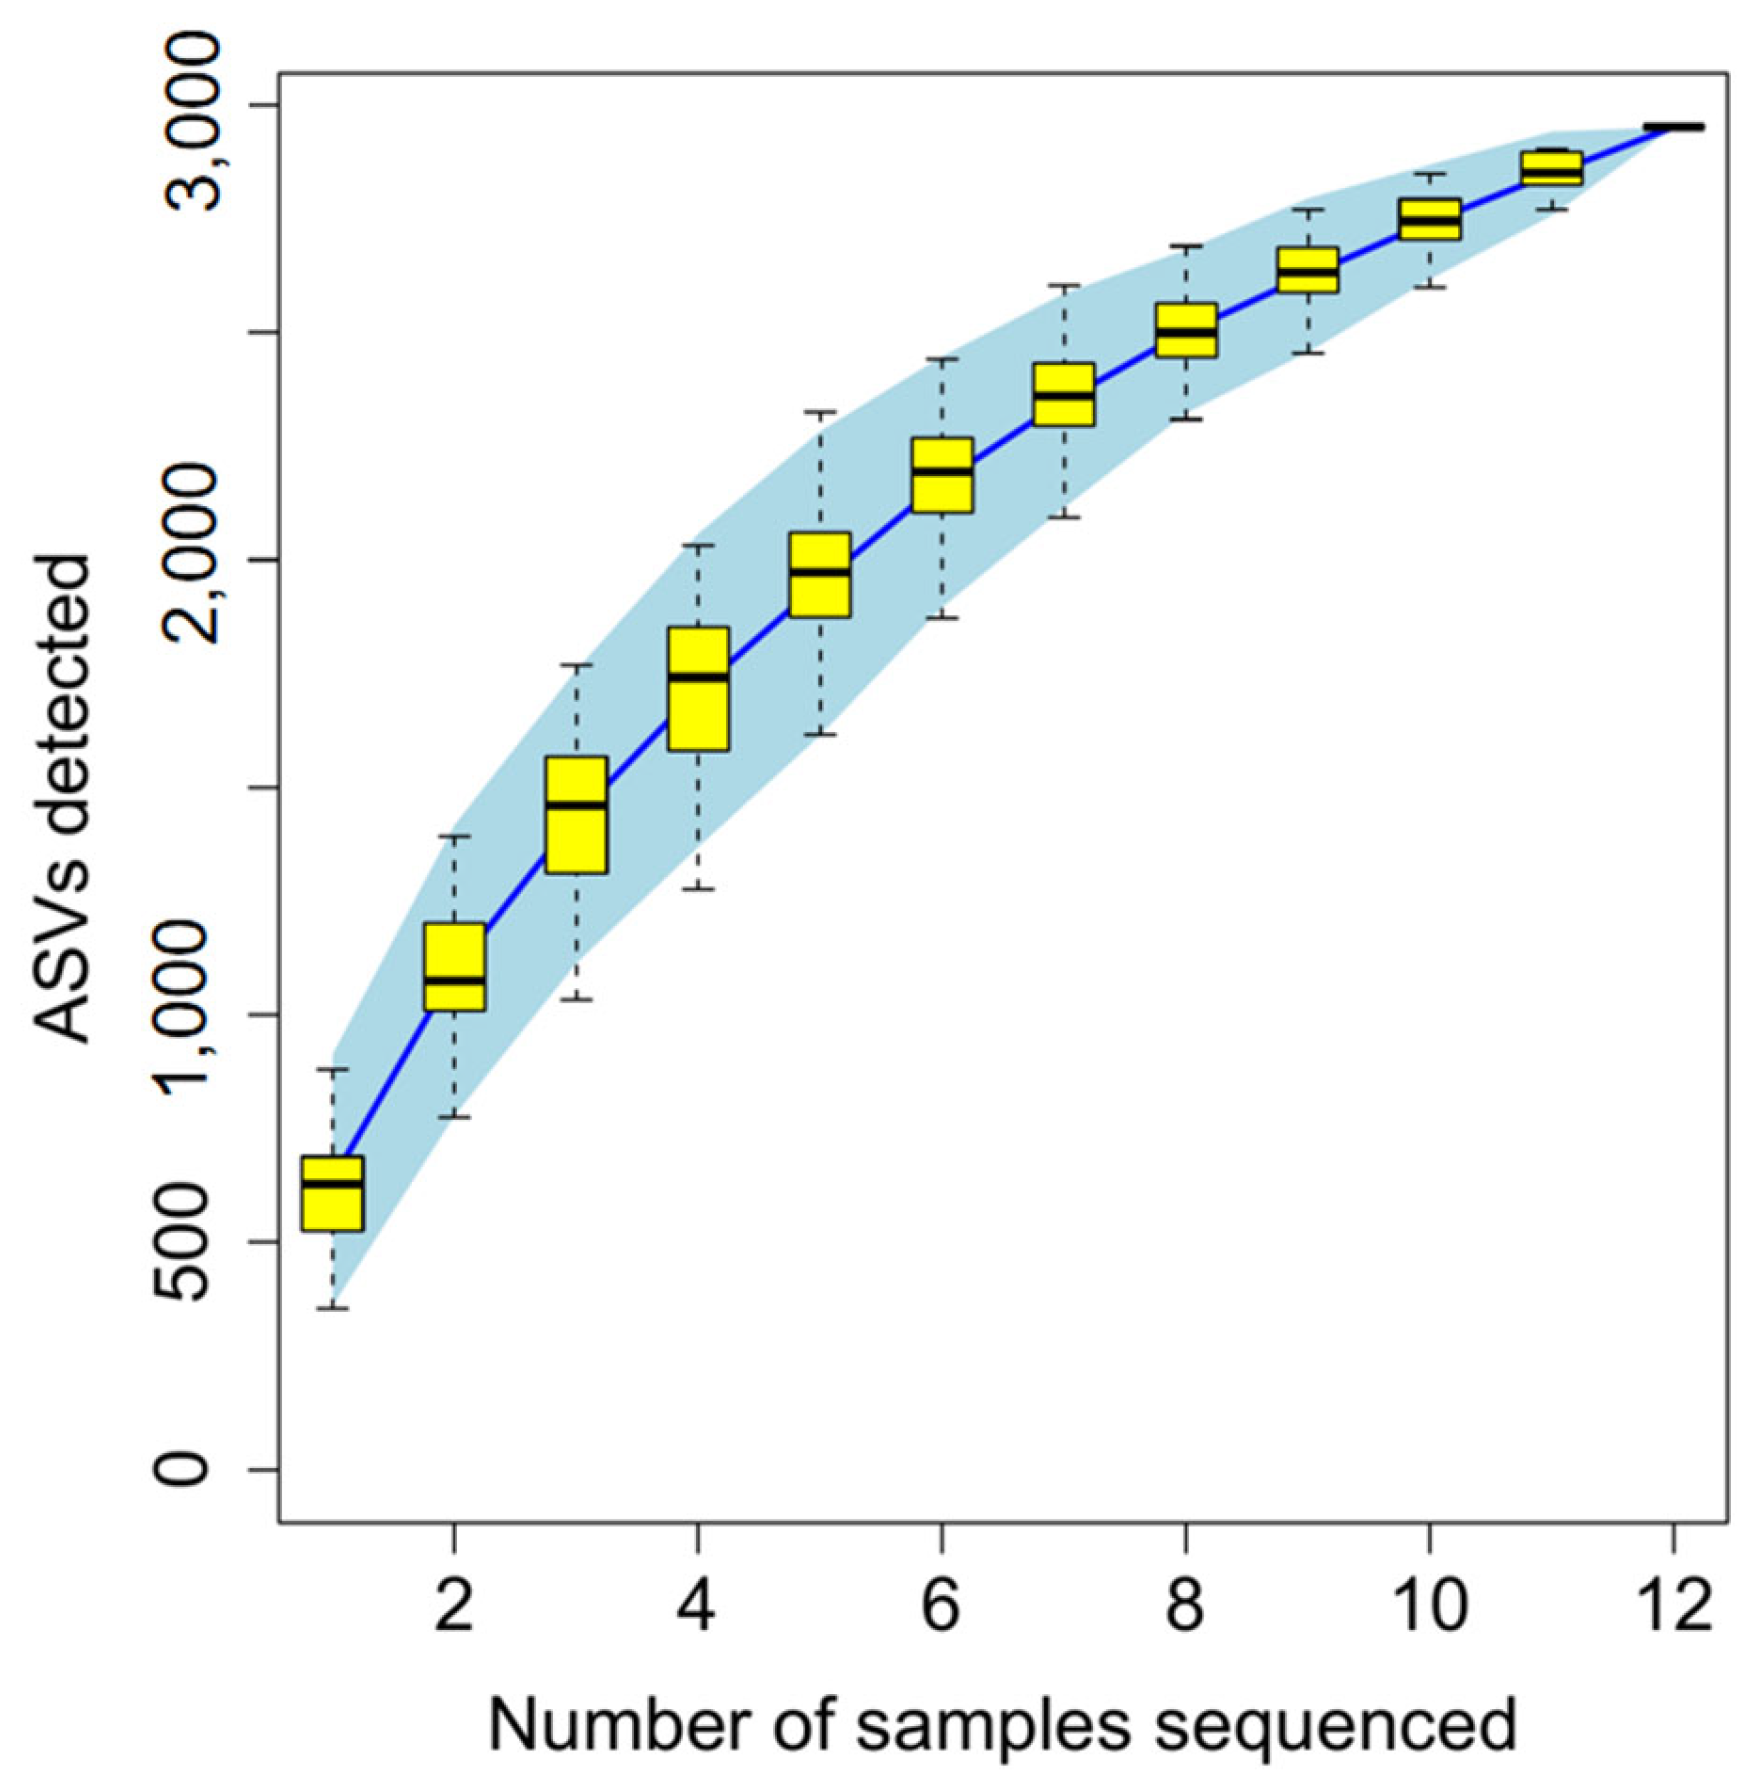
2.7. Colon Microbial Diversity Analysis

Total DNA from the colonic content was extracted using a Magen kit (Guangzhou Magen Biotechnology Co., Ltd., Guangzhou, Guangdong, China). PCR amplification was performed using the primers 343 f (5′-tagggragcag-3′) and 798 r (5′-agggtattctactt-3′) after confirming the concentration and purity. The sequencing was performed by Shanghai OE Biotechnology Co., Ltd. on an Illumina MiSeq platform (Illumina, CA, USA). Raw fastq data were processed with Cutadapt for adapter removal, followed by DADA2 in QIIME2 for quality filtering, denoising, read merging, and chimeric sequence removal [21]. Representative sequences and an ASV abundance table were generated. Alpha diversity (Chao, Shannon, Simpson, and observed indices) indices were calculated using QIIME2’s core-diversity plugin [22]. Beta diversity was calculated using the principal coordinate analysis (PCoA) approach. Important bacterial taxa among the groups were identified using LEfSe (LDA ≥ 4). Bioinformatics analyses were performed on the OE Cloud platform (Available online: https://cloud.oebiotech.com/#/home).

2.8. Metabolomics Analysis of Colon Content

Furthermore, 30 mg of colon contents was mixed with 400 ul methanol aqueous solution (1:4, v/v), frozen at −20°C for 2 h, then ground for 2 min. Ultrasonic extraction was performed in an ice–water bath for 10 min, followed by centrifugation at 12,000× g for 10 min at 4 °C to collect the supernatant. The collected supernatant was analyzed by Shanghai OE Biotechnology Co., Ltd (Shanghai, China). using LC-MS/MS. The original LC-MS data were processed with Progenesis QI V2.3 software (Nonlinear Dynamics, Newcastle, UK) for baseline filtering, peak identification, integration, retention time correction, peak alignment, and normalization. A qualitative analysis was performed using the Human Metabolome Database (HMDB), Lipidmaps (V2.3), Metlin, EMDB, PMDB, and a self-built database to further obtain metabolite information. Metabolites were analyzed using a KEGG pathway enrichment analysis and MetaboAnalyst 4.0 (Available online: http://www.metaboanalyst.ca/) to identify key biochemical and signaling pathways.

2.9. Colon Transcriptome Sequencing

Total RNA was isolated from the colon tissue using Trizol reagent (TaKaRa Bio, Kyoto, Kyoto Prefecture, Japan)), and RNA concentration and purity (A260/A280) were assessed with a Nanodrop 2000. The sequencing was performed on an Illumina NovaSeq 6000 platform (Illumina, San Diego, CA, USA) by Shanghai OE Biotechnology Co., Ltd. The raw fastq reads were processed using Fastp, and low-quality reads were removed to obtain clean reads. These clean reads were mapped to the reference sheep genome (Available online: https://www.ncbi.nlm.nih.gov/datasets/genome/?taxon=9940 (accessed on 6 April 2023) using HISAT2. The FPKM values of each gene were calculated, and read counts were generated using HTSeq-count. Differential gene expression was analyzed using DESeq, with p < 0.05 and FoldChange > 1.5 set as the thresholds for identifying significantly different genes between groups. The functional enrichment and signaling pathways of the differentially expressed genes were analyzed using the KEGG database. All bioinformatics analyses were conducted on the OE Cloud platform (Available online: https://cloud.oebiotech.com/#/home).

2.10. Statistical Analyses

Analyses of the data on serum biochemical, immune, and antioxidant indices, colon pH, and VFA content were conducted using the t-test based on SPSS 23 (IBM Corporation, Armonk, NY, USA). Violin plots were generated using GraphPad Prism (V 8.0.1, GraphPad, San Diego, CA, USA). p < 0.05 was considered significantly different, and p < 0.01 was considered highly significantly different.
For a microbial analysis, the Wilcoxon rank-sum test was employed to compare the relative abundances of the colon microbiota at the phylum and genus levels. FDR-adjusted p < 0.05 was considered significantly different. Spearman’s correlation coefficient was used to evaluate the relationship between the colon bacterial composition and VFAs, with significant correlations of p < 0.05 and R > 0.60.
OPLS-DA analyses were performed using the “ropls” package in R (Version 1.6.2). A two-tailed Student’s t-test was used to calculate the p-values for the differential metabolites between the LC and HC groups. Metabolites with VIP > 1 and p < 0.05 were considered significantly different. Spearman’s correlation coefficient was used to evaluate the relationship between the colon bacterial composition and differential metabolites, with significant correlations of p < 0.05 and R > 0.60.

3. Results

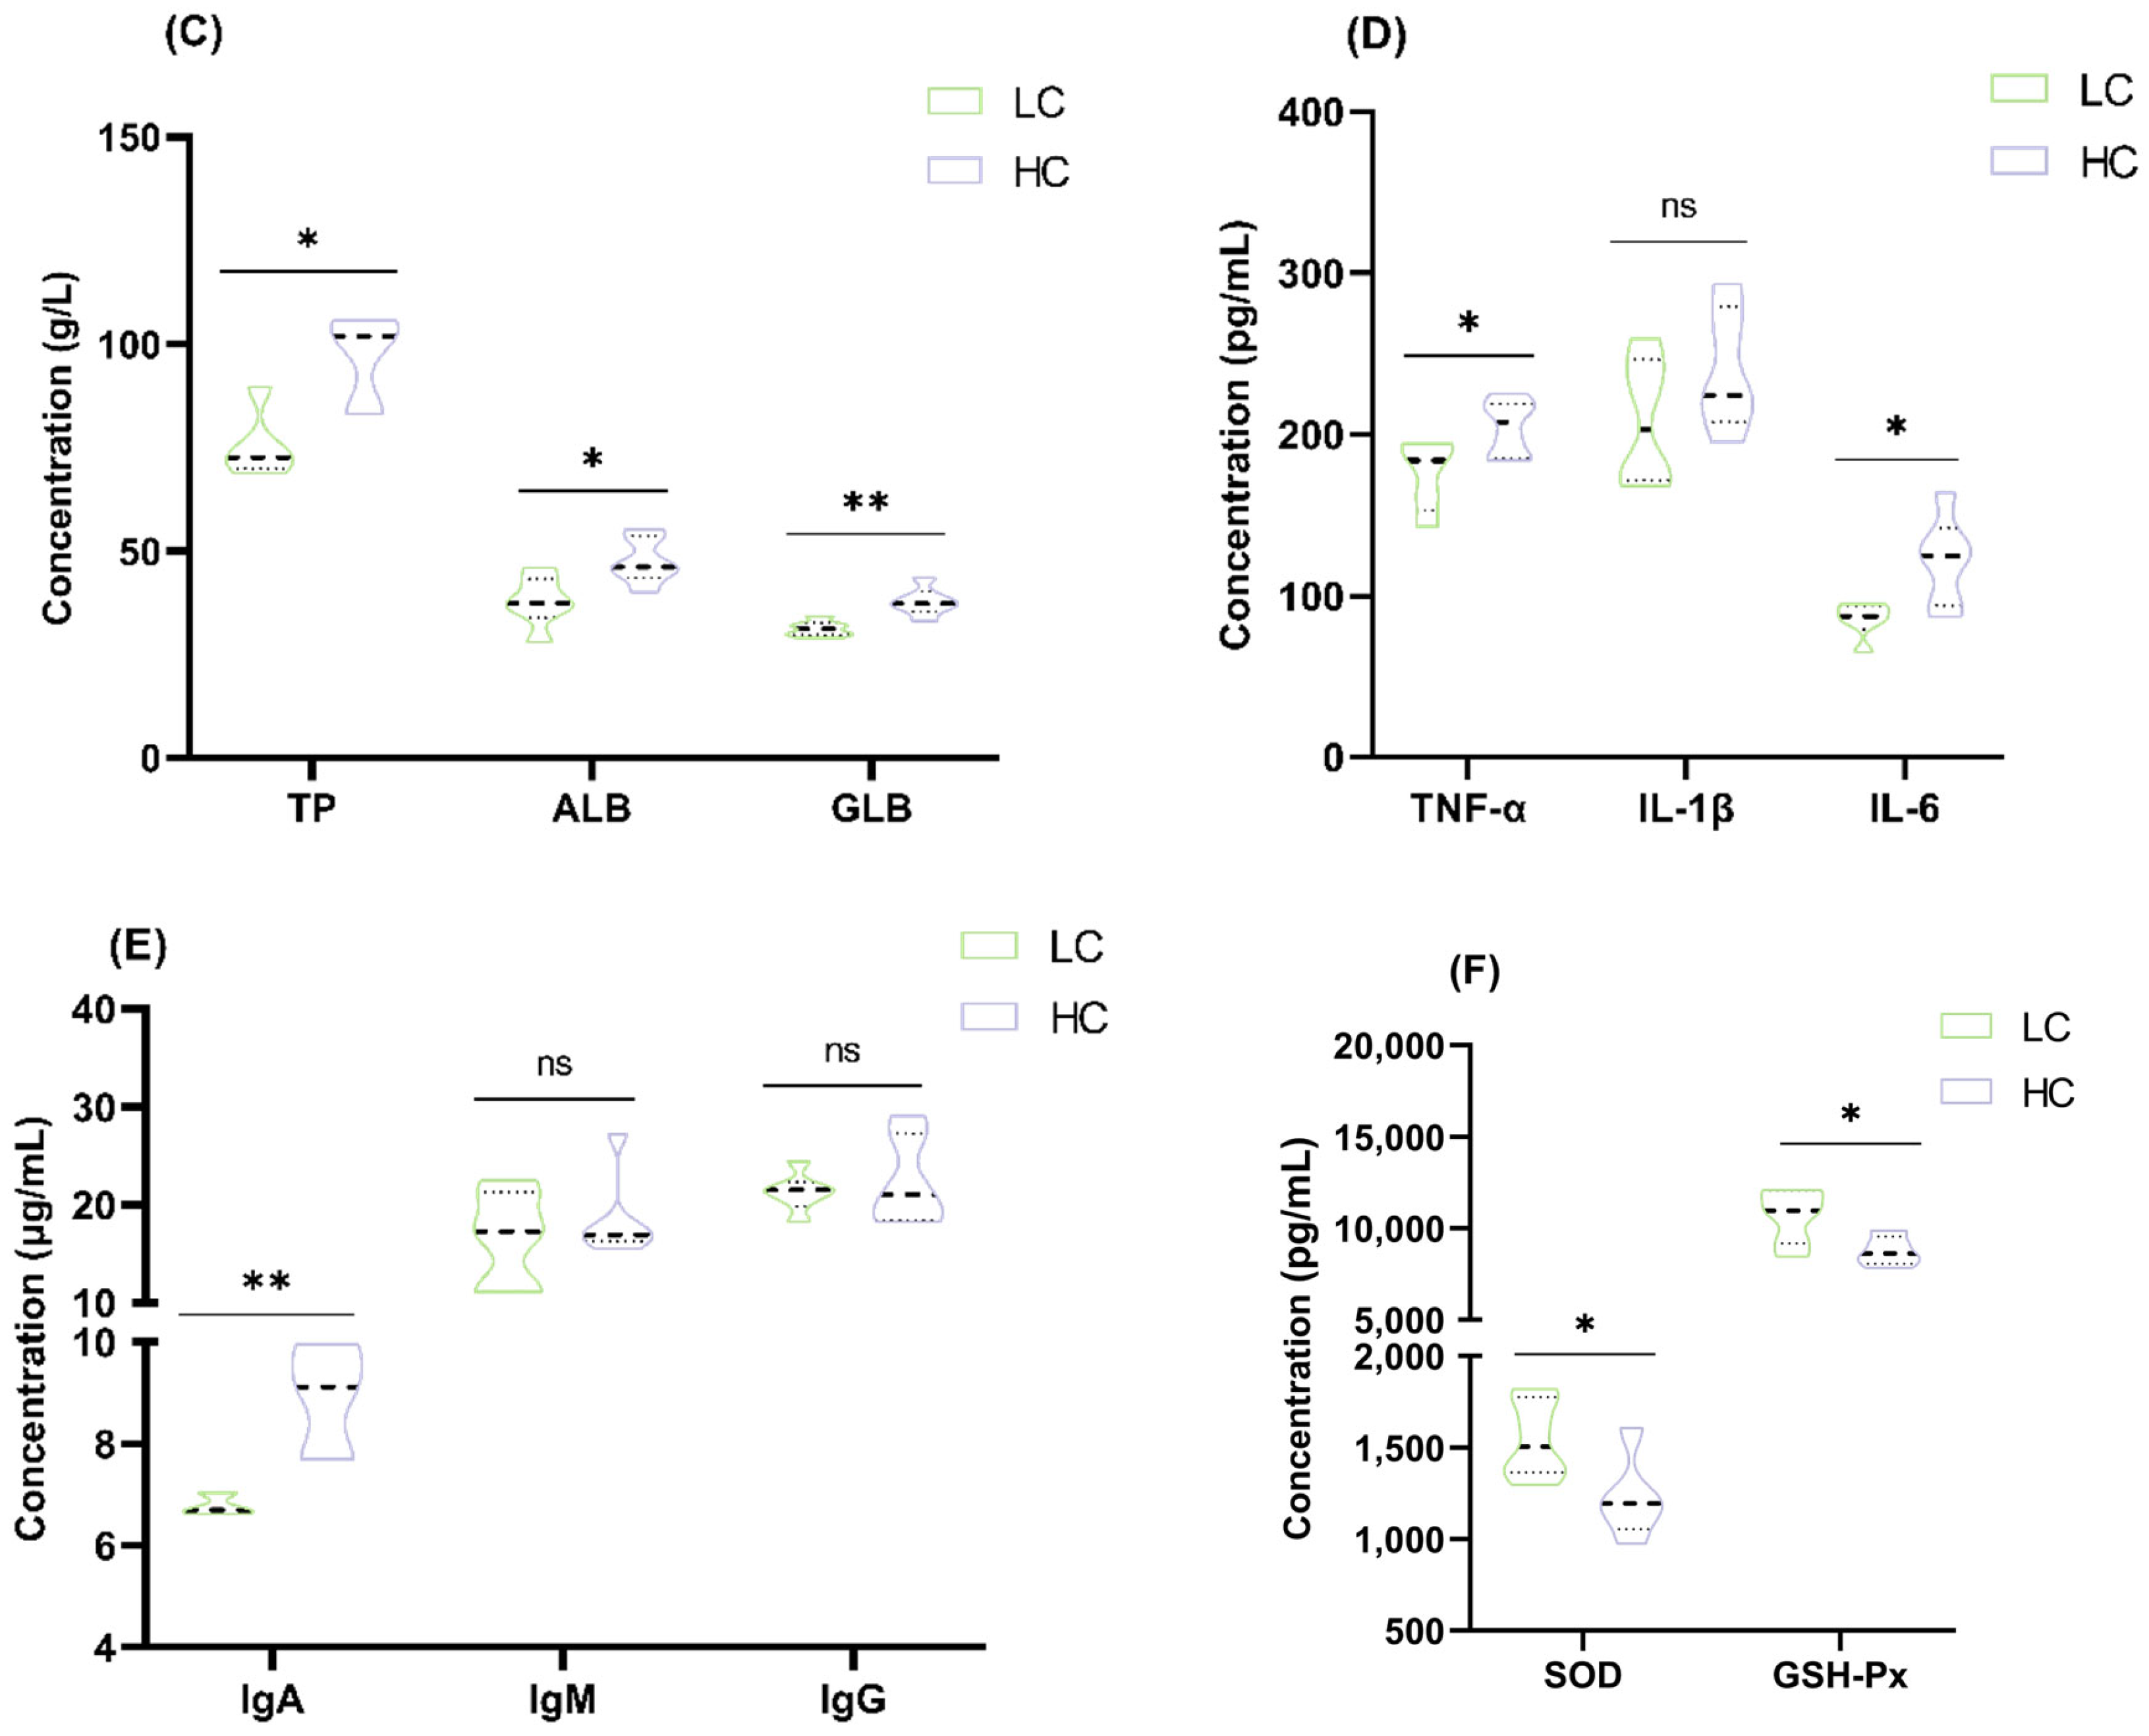
3.1. Effect of HC Diet on Colon Epithelial Lipopolysaccharide Content and Serum Parameters in Dumont Lambs

Colonic epithelial LPS concentrations were significantly elevated in the HC group (p < 0.05; Figure 1A). GLU, TP, ALB, and GLB levels were significant higher in the HC group, while TG was lower compared to the LC group (p < 0.05 or p < 0.01; Figure 1B,C). Additionally, TNF-α, IL-6, and IgA concentrations increased, while serum SOD and GSH-Px levels decreased in the HC group (p < 0.05 or p < 0.01; Figure 1D–F).

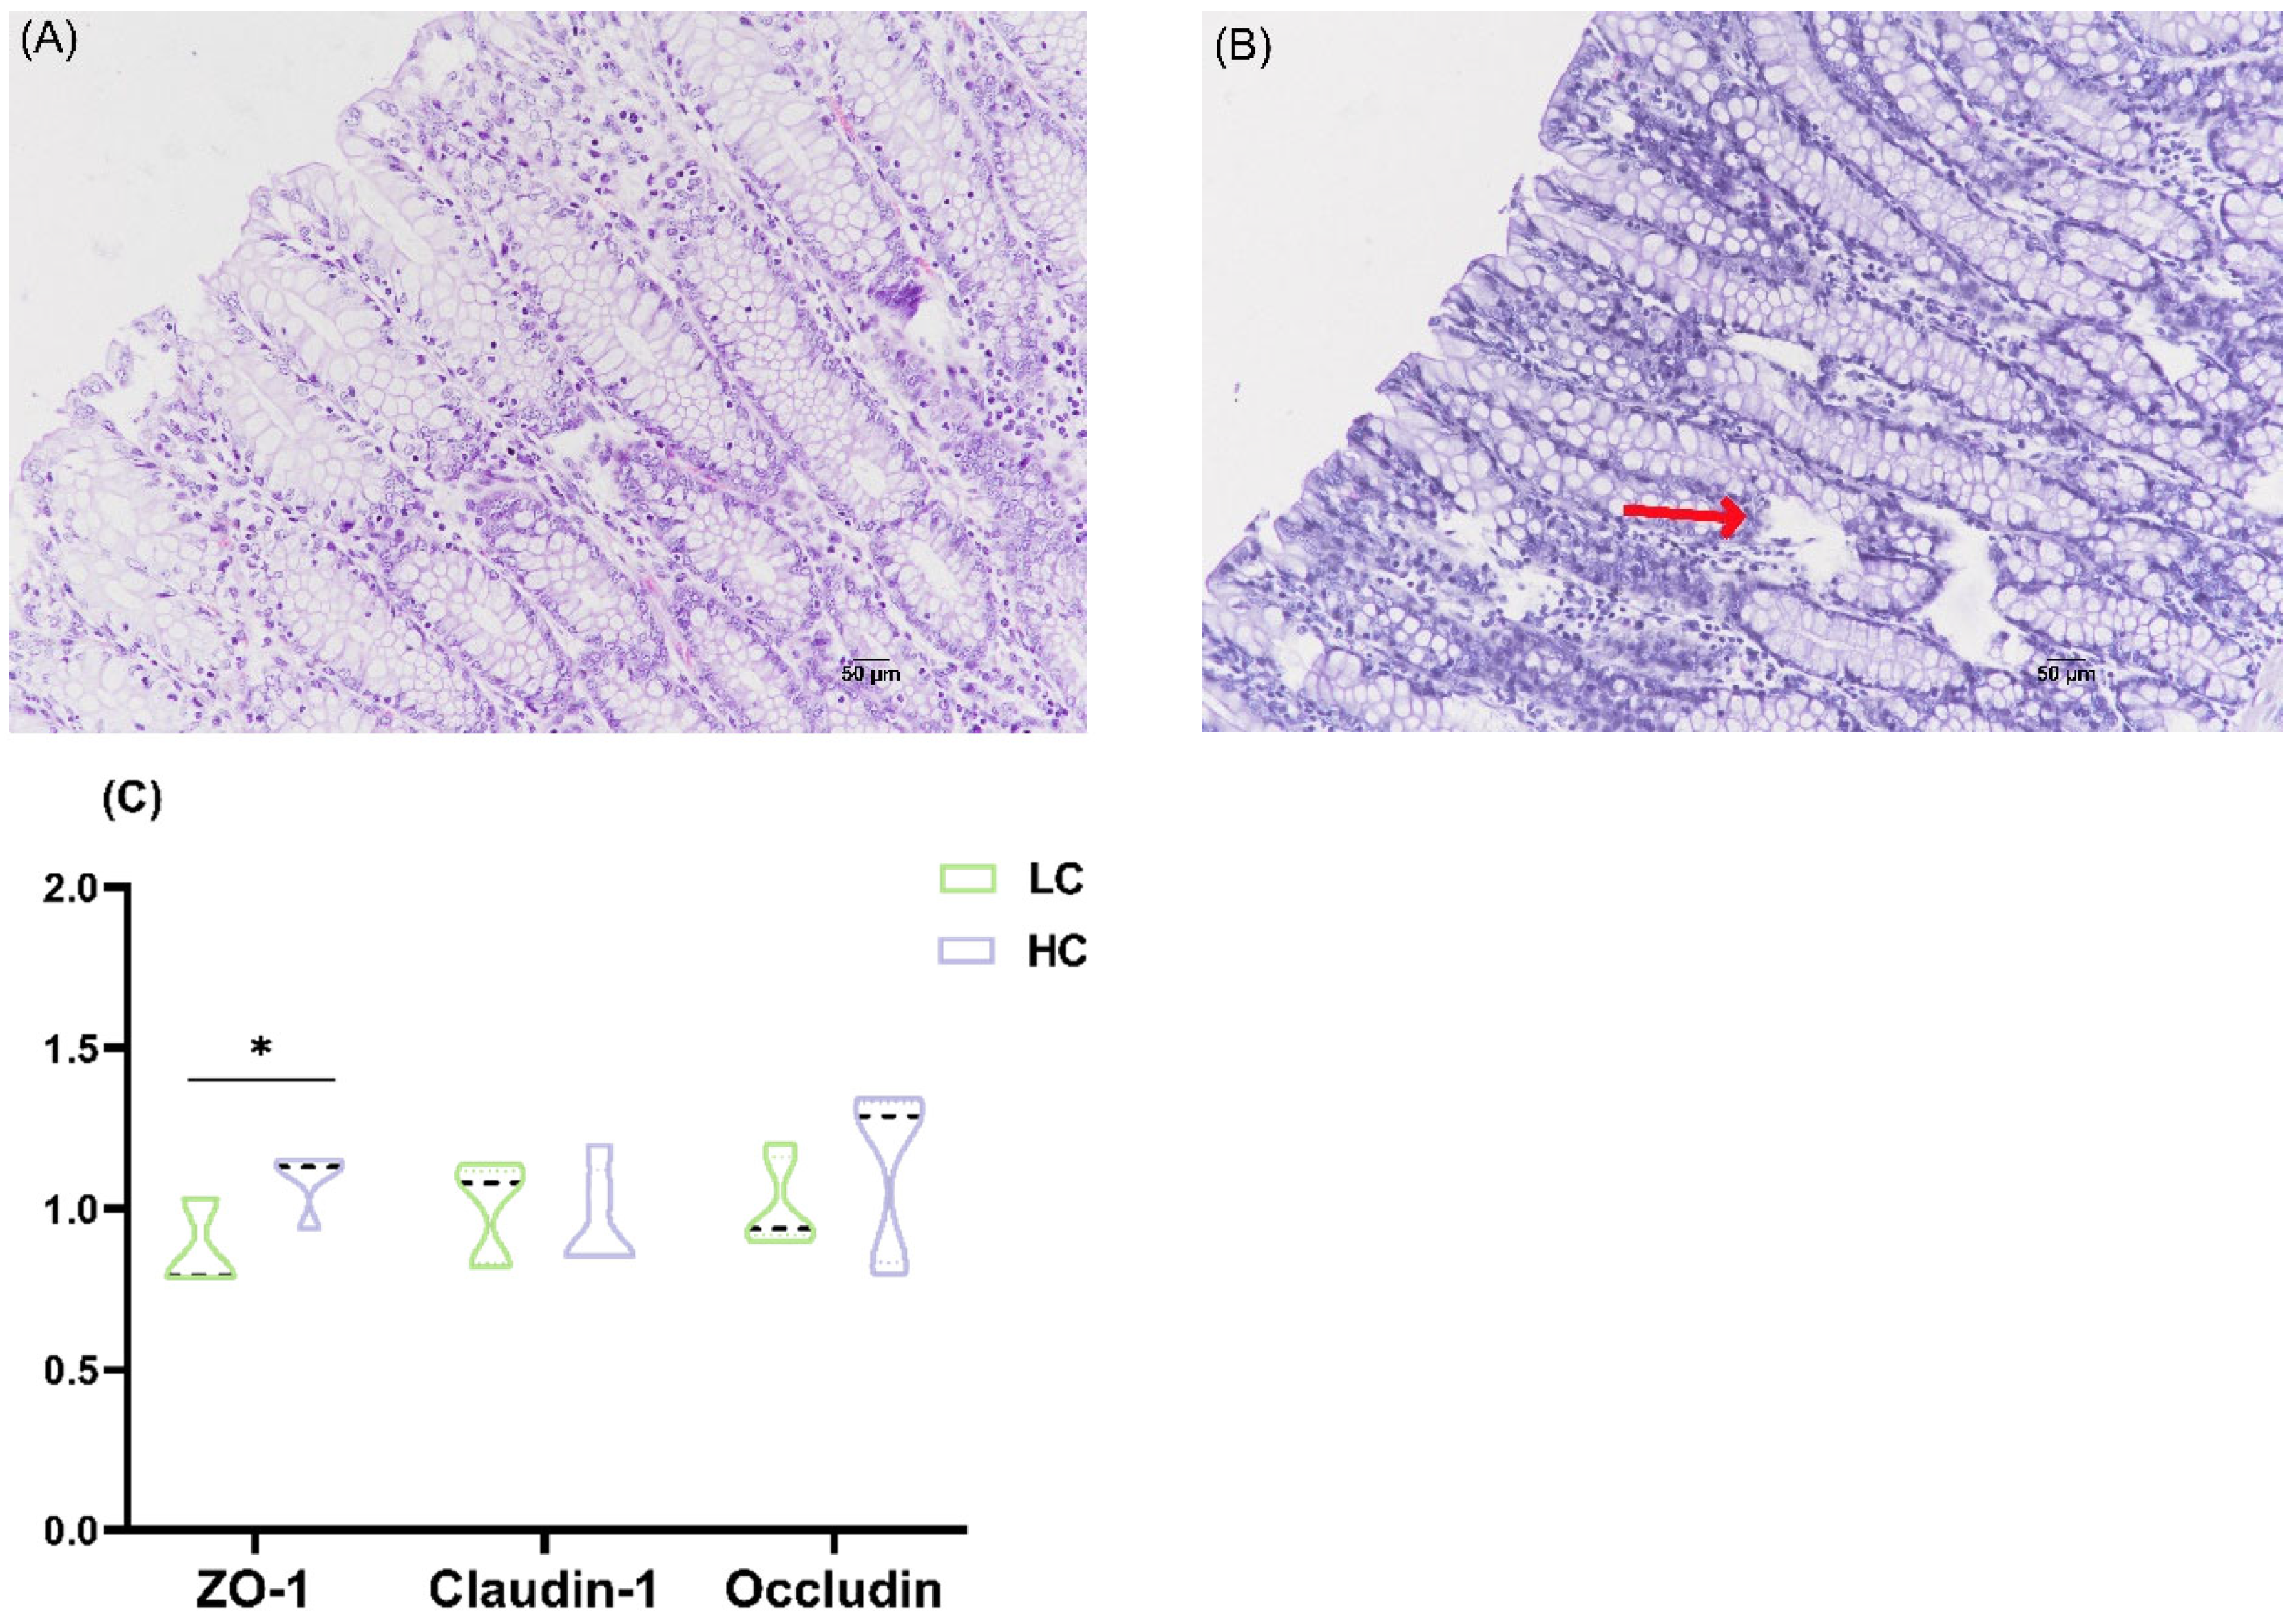
3.2. Effects of HC Diet on Colonic Epithelium Morphology and Tight Junction mRNA Expression in Dumont Lambs

We found that, in the HC group, the colonic epithelium showed cavities and inflammatory cell infiltration (Figure 2B). In the HC group, zo-1 mRNA expression increased significantly (p < 0.05; Figure 2C).

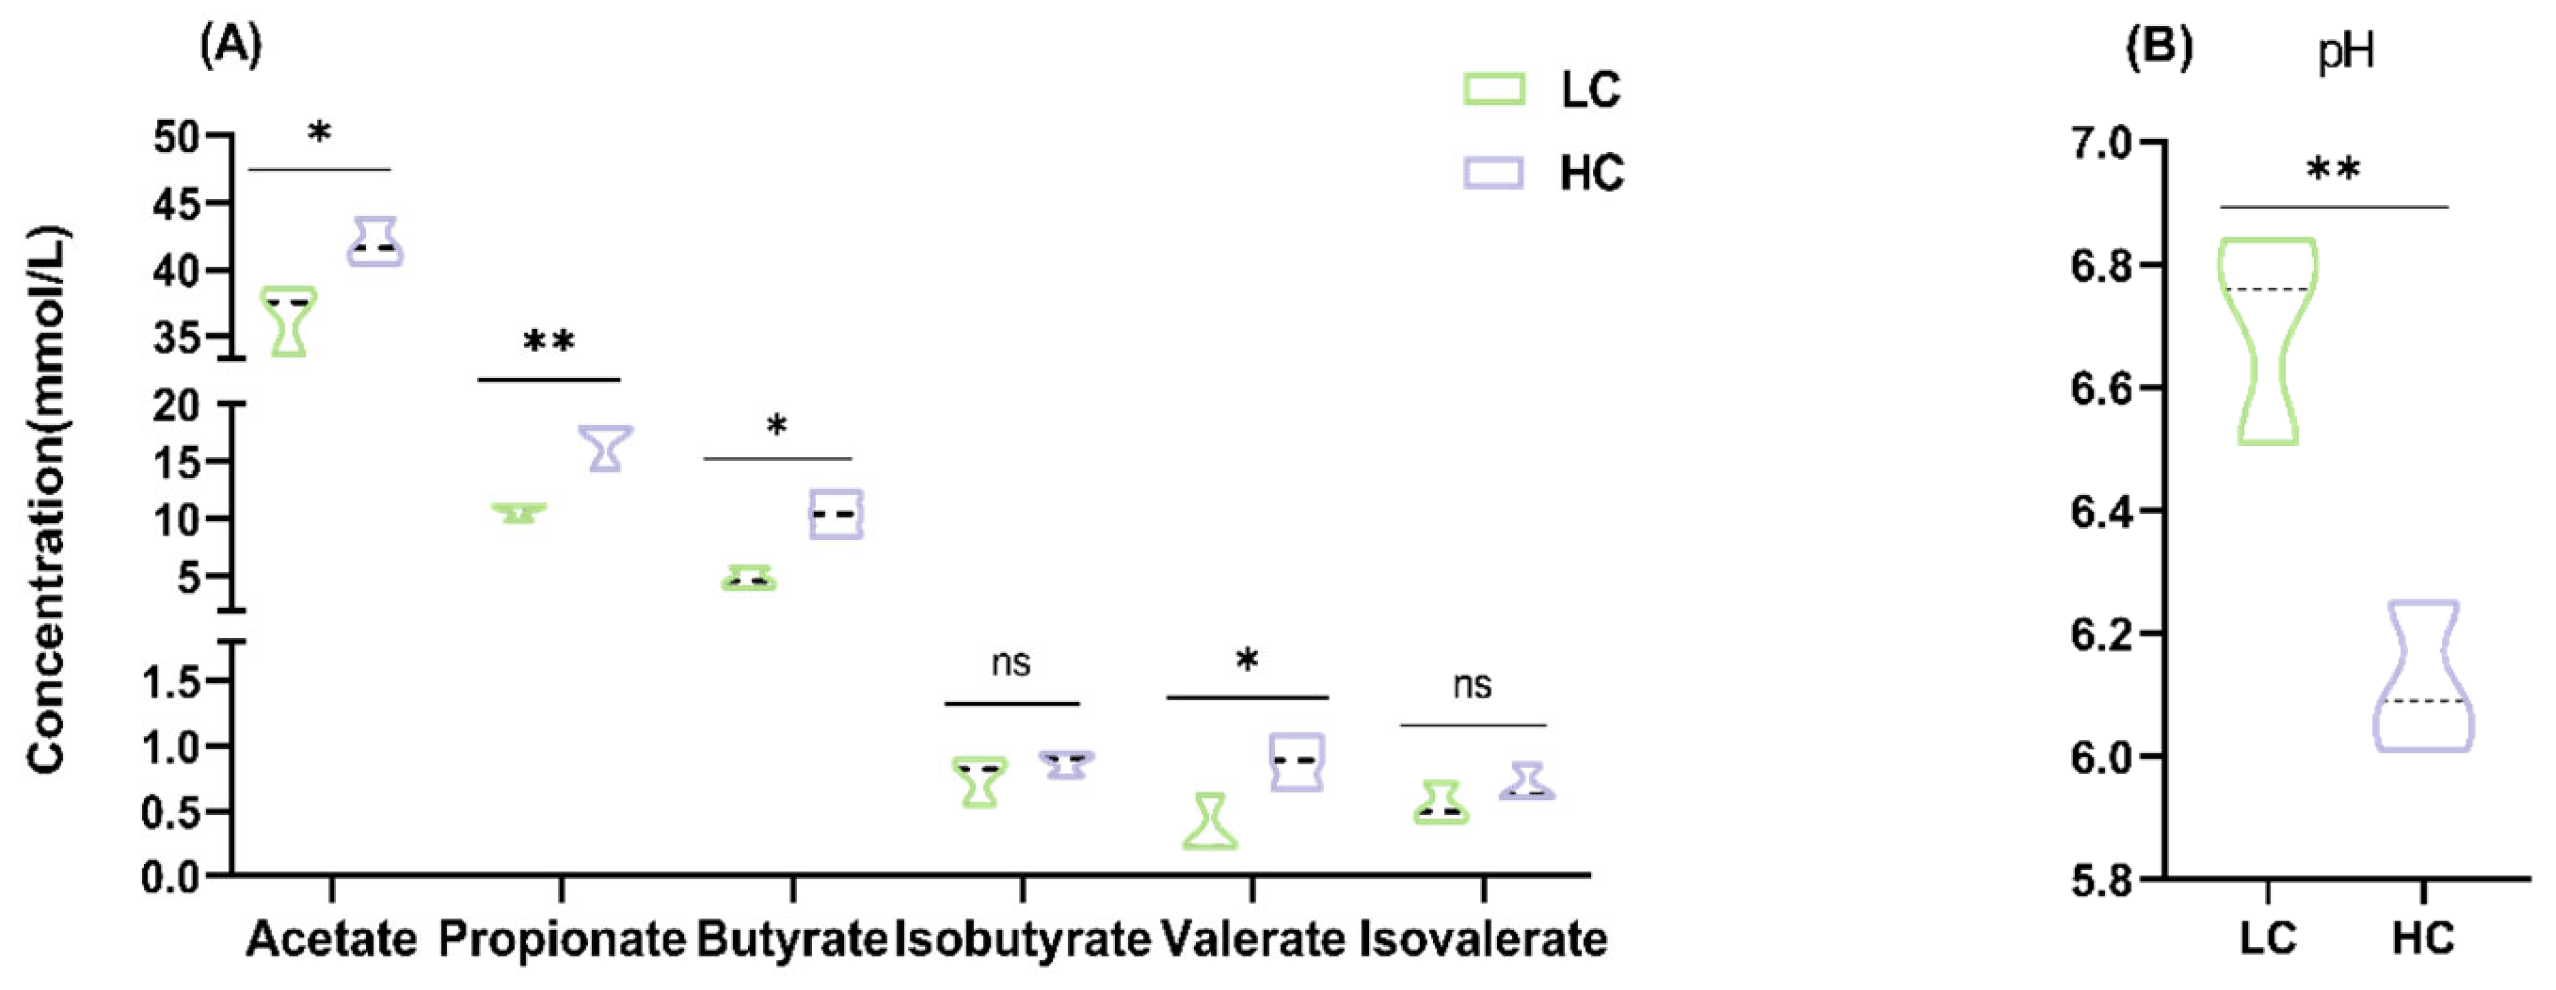
3.3. Effect of HC Diet on Colon Fermentation Parameters and Microbial Composition in Dumont Lambs

Compared to the LC group, the acetate, propionate, butyrate, and valerate concentrations were significantly higher (p < 0.05 or p < 0.01), while pH was significantly lower in the colonic content of the HC group (p < 0.01; Figure 3A,B).
According to the 16S rRNA sequencing results, 956,037 raw reads and 845,953 high-quality sequences were obtained from the two groups of lamb colon contents, and 2952 amplicon sequence variants (ASVs) were generated following quality control. Sample species accumulation curves showed that the sampling was reasonable and sufficient (Figure A1). The effect of the high-concentration diet on colonic microbial diversity was assessed via α-diversity and β-diversity. The results showed no significant change in α-diversity (Figure A2), but significant microorganisms were separated between the two groups (Figure 4A).
At the phylum level, eight dominant phyla were identified (≥0.1% relative abundance in at least one group, Figure 4B). Firmicutes and Bacteroidota were the main phyla in the LC and HC groups, accounting for 53.2% and 24.9% in the LC group and 57.9% and 34.5% in the HC group, respectively. An abundance difference analysis at the phylum level showed that the relative abundances of Bacteroidota (p < 0.05), Spirochaetota (p < 0.01), and Actinobacteriota (p < 0.01) in the HC group were significantly higher than those in the LC group (Figure 4D). At the genus level, 26 dominant genera were identified (≥1% relative abundance in at least one group) (Figure 4C). An abundance difference analysis at the genus level showed that, in the HC group, the relative abundances of [Eubacterium]_coprostanoligenes_group (p < 0.01), Rikenellaceae_RC9_gut_group (p < 0.01), Treponema (p < 0.01), Clostridia_UCG-014 (p < 0.01), Alistipes (p < 0.05), Ruminococcus (p < 0.01), Christensenellaceae_R-7_group (p < 0.01), UCG-002 (p < 0.05), Bacteroidales_RF16_group (p < 0.05), and Lachnospiraceae_AC2044_group (p < 0.01) increased significantly, while the relative abundances of Lachnospiraceae_NK4A136_group (p < 0.05) and Clostridium_sensu_stricto_1 (p < 0.05) decreased significantly (Figure 4E).
An LEfSe analysis identified 31 biomarkers with significant differences between the LC and HC groups (LDA score > 3.5). The cladogram in Figure 5A clearly shows the distribution of differentially abundant taxa across different taxonomic levels. The purple branches represent the taxa enriched in the HC group, while the green branches represent those enriched in the control group. Figure 5B presents the LDA scores of the identified biomarkers.
Spearman’s correlation was used to evaluate the relationship between bacterial abundance and fermentation parameters (Figure 6). The heat map revealed positive correlations between [Eubacterium]_coprostanoligenes_group, Treponema, Clostridia_UCG-014, and Rikenellaceae_RC9_gut_group and acetate, propionate, butyrate, and valerate (p < 0.05 or p < 0.01). Alistipes were positively correlated with acetate butyrate and valerate (p < 0.05 or p < 0.01). Additionally, Alistipes, Clostridia_UCG-014, and Rikenellaceae_RC9_gut_group showed negative correlations with pH (p < 0.05 or p < 0.01).

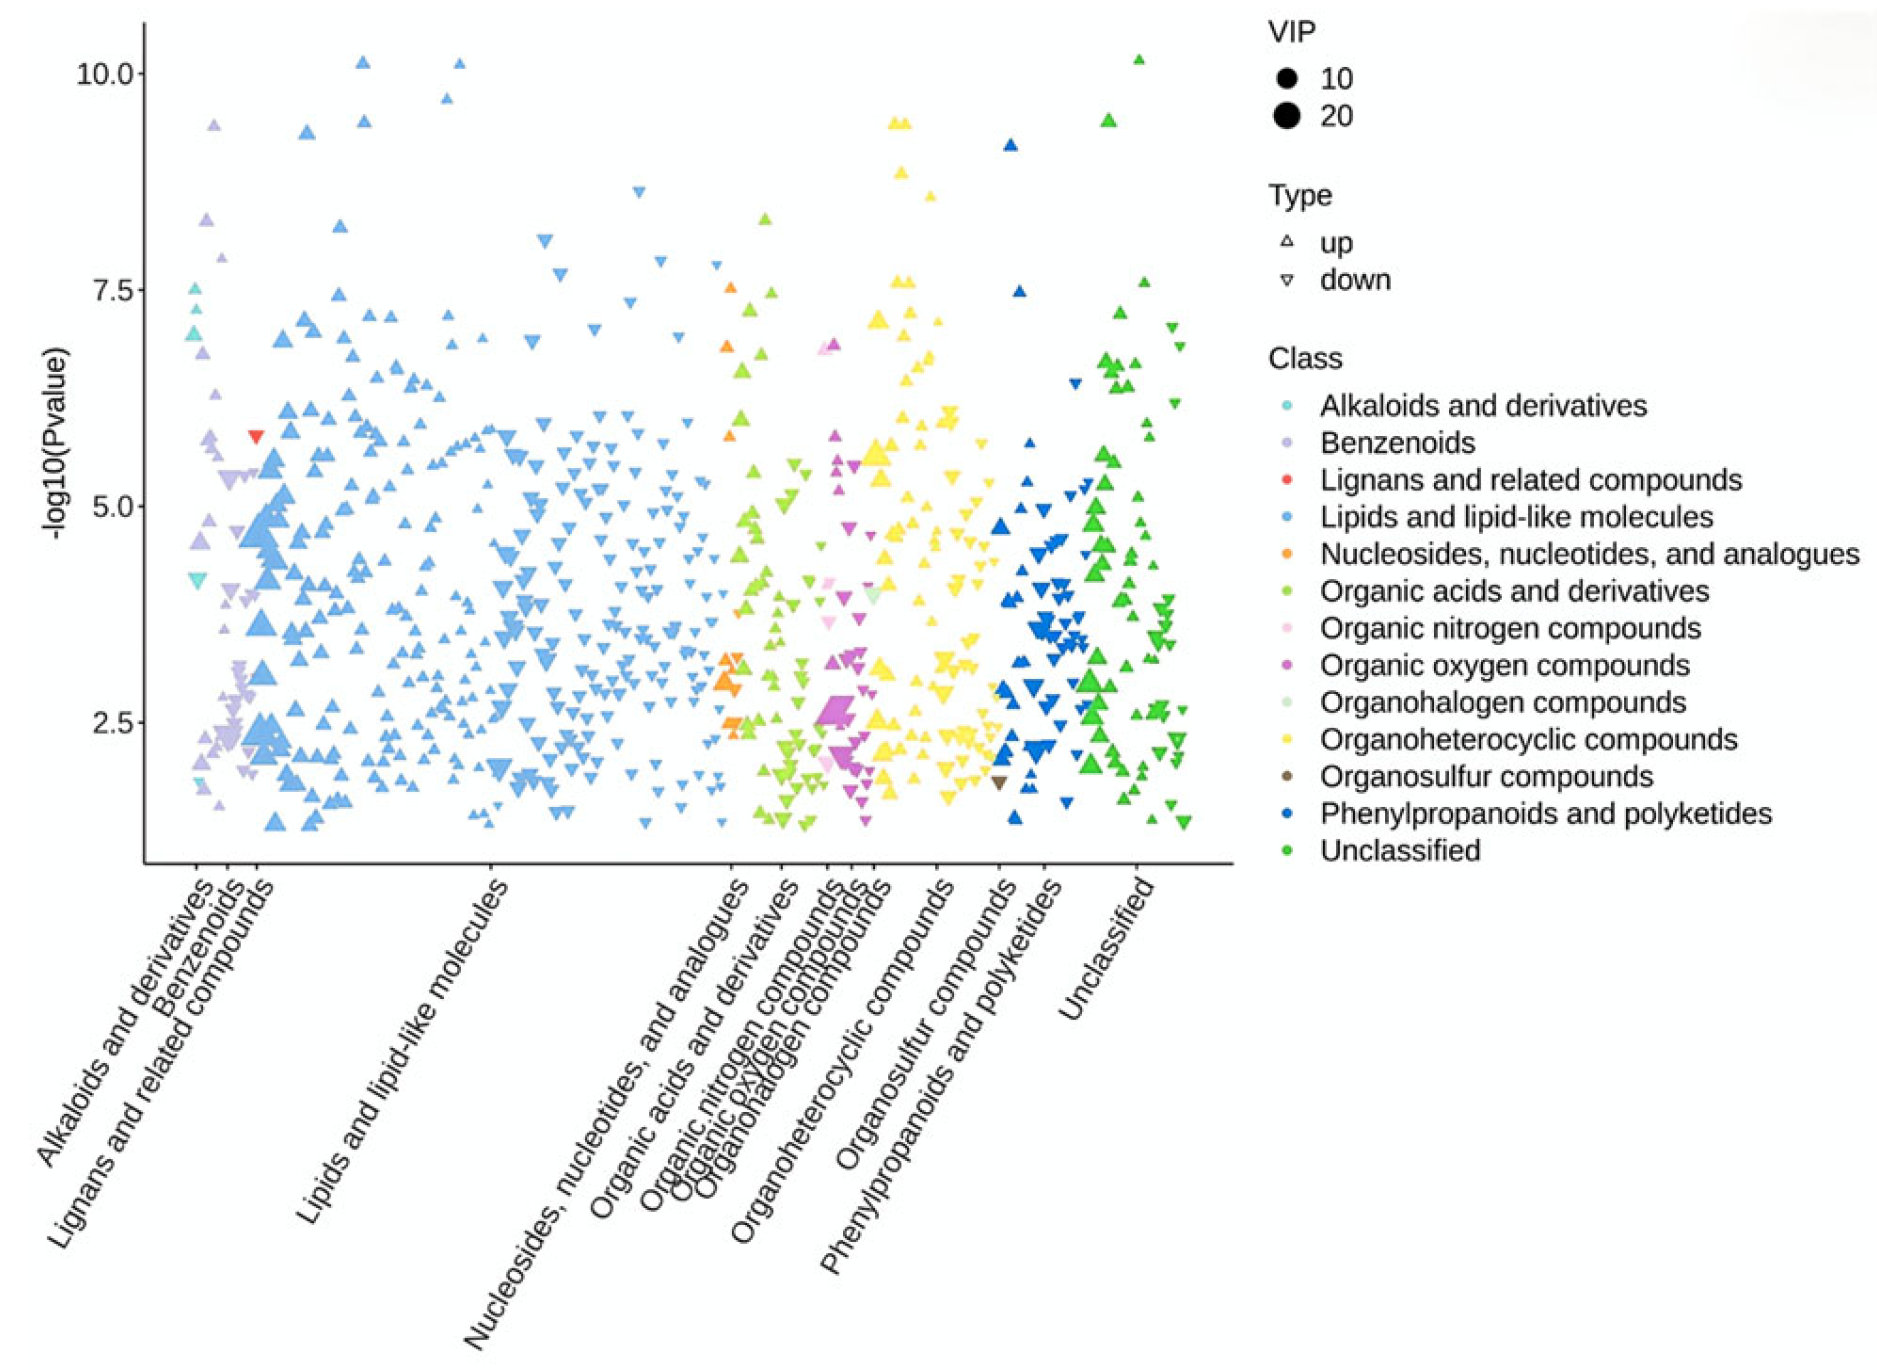
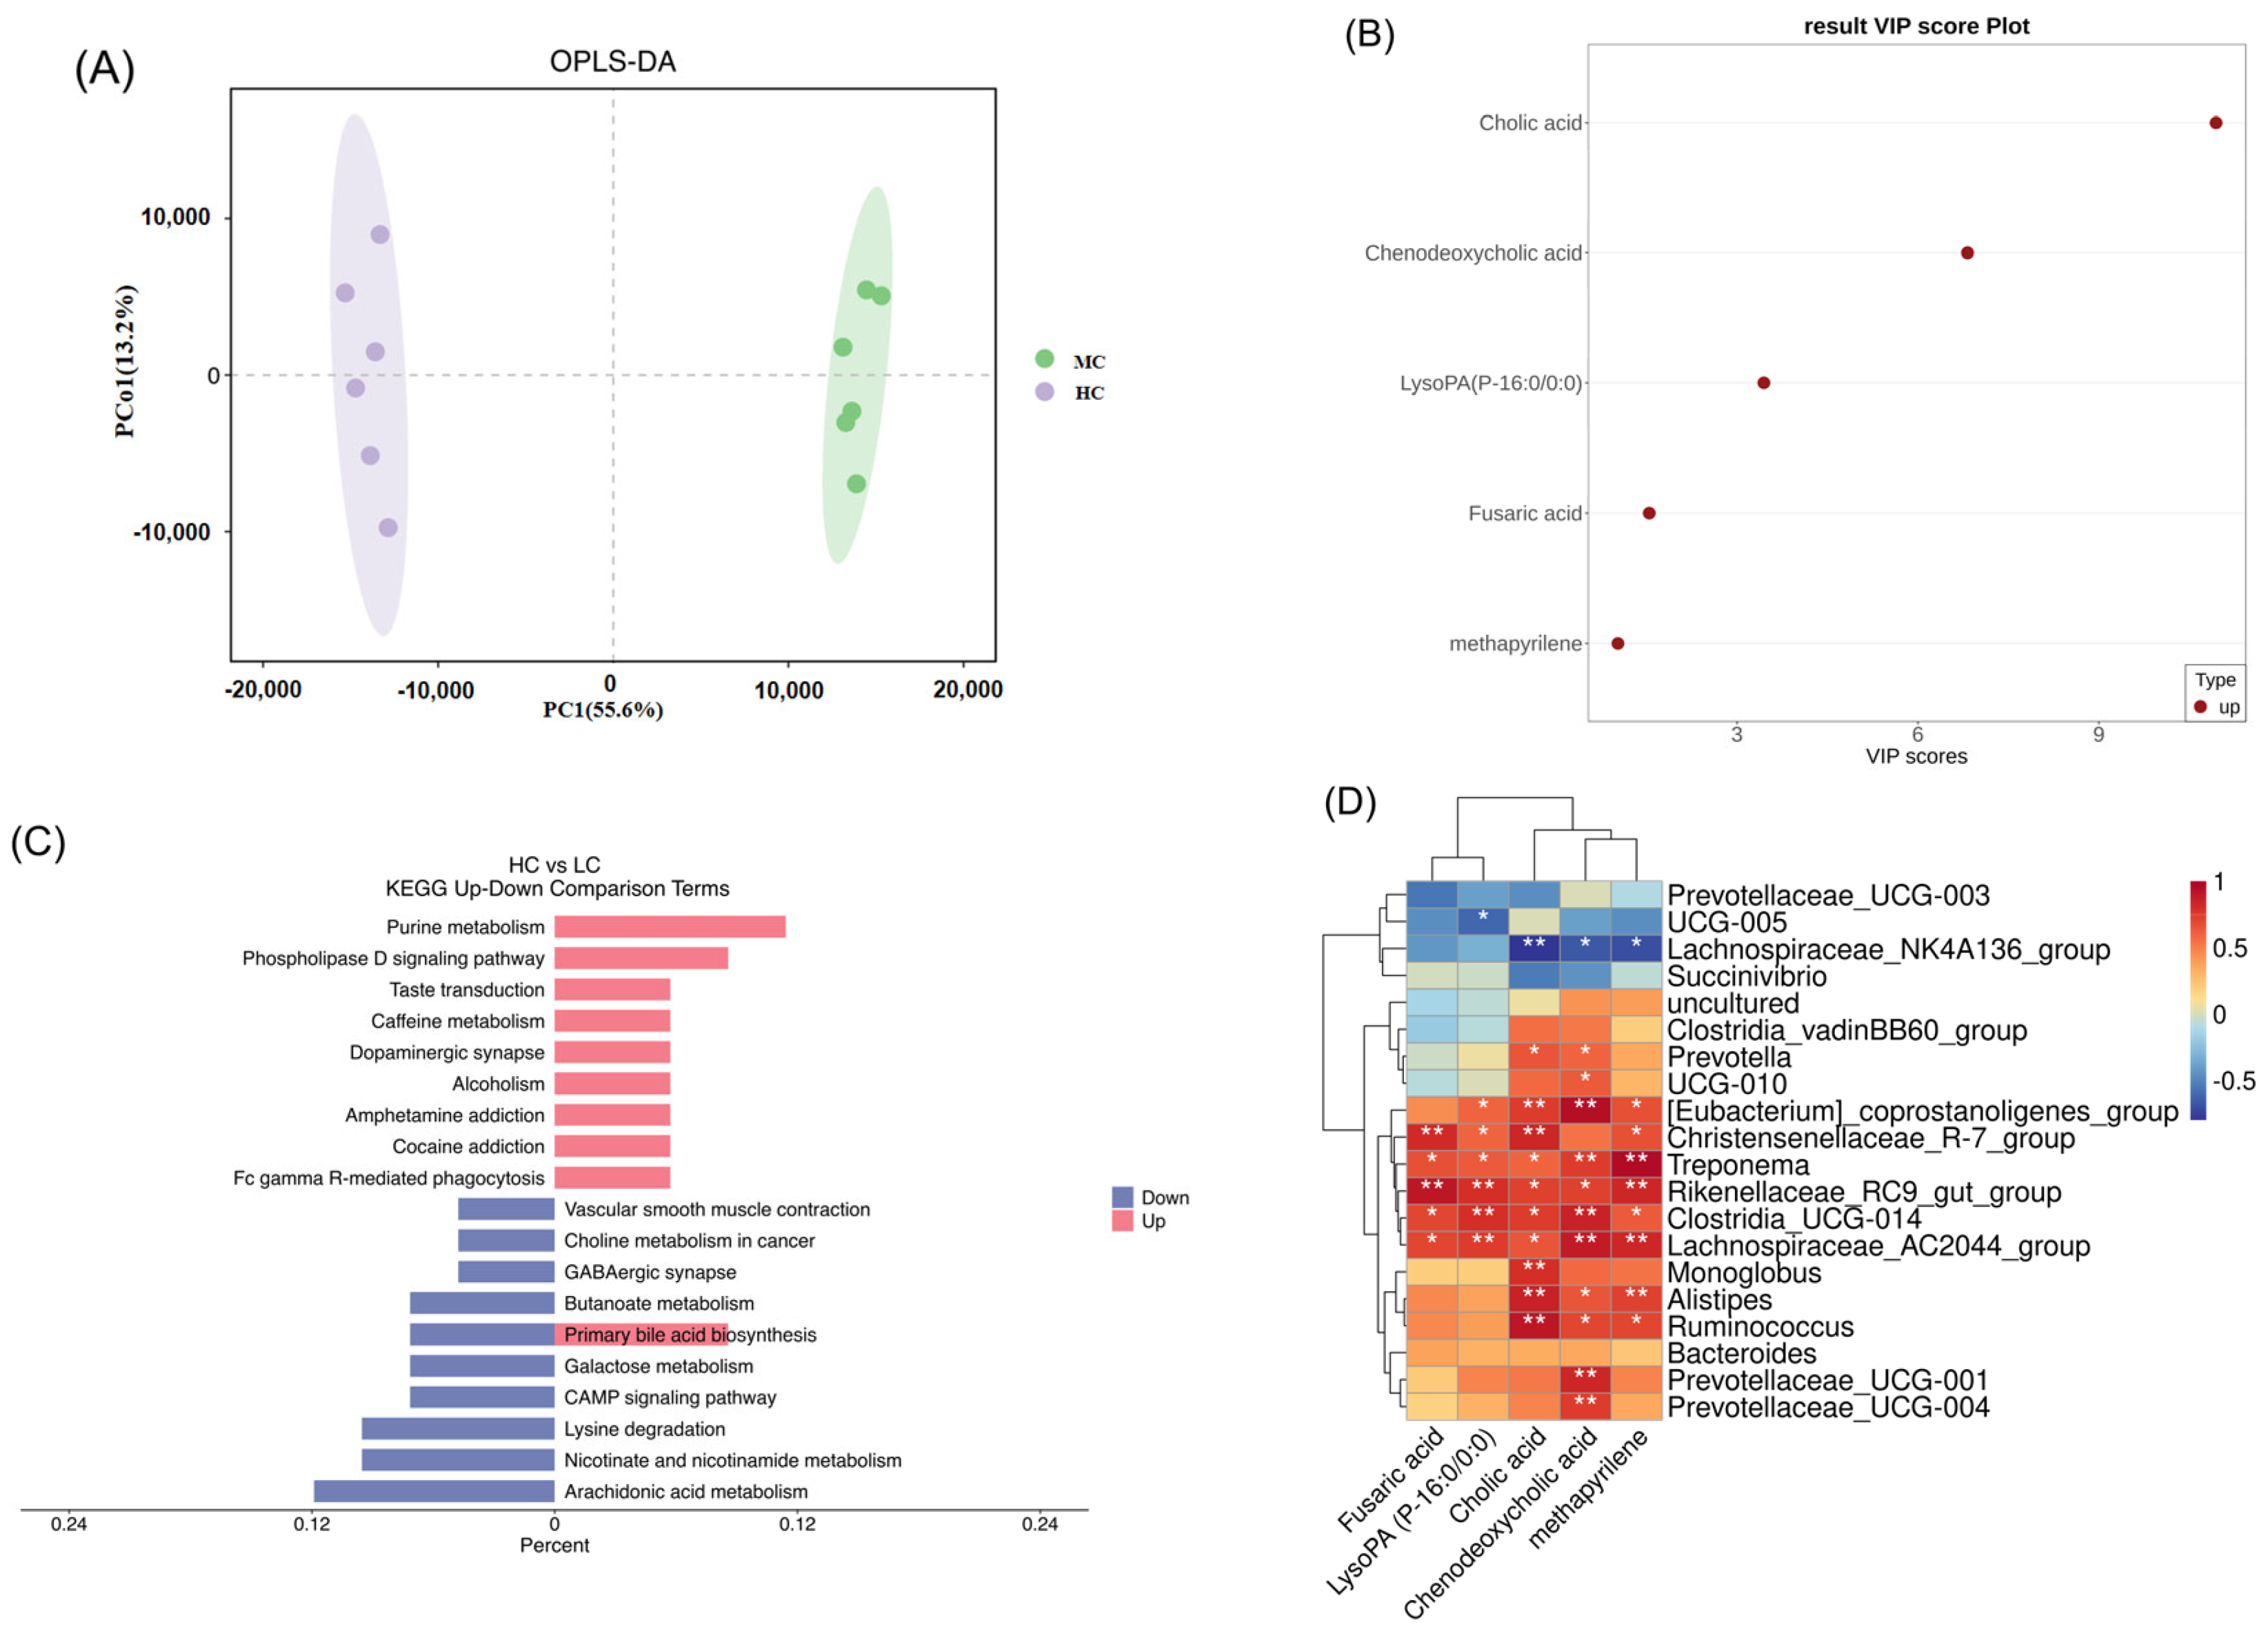
3.4. Effect of HC Diet on Metabolites in Colon Content of Dumont Lambs

A non-targeted metabolomic analysis of the colon content was performed using an LC-MS system, and 1019 metabolites were detected. OPLS-DA revealed significant metabolite differences between the two groups (Figure 7A), identifying 779 differential metabolites with VIP > 1 and p < 0.05, primarily consisting of lipids, lipid-like molecules, and organoheterocyclic compounds (Figure A3). Among these, 396 metabolites were upregulated, and 383 were downregulated. Among the upregulated differential metabolites, we screened five differential metabolites that may have adverse effects on the colon: cholic acid, chenodeoxycholic acid, LysoPA (P-16:0/0:0), methapyrilene, and fusaric acid (Figure 7B).
The KEGG pathway enrichment analysis showed that the differential metabolites were mainly enriched in purine metabolism, primary bile acid biosynthesis, the phospholipase D signaling pathway, arachidonic acid metabolism, nicotinate and nicotinamide metabolism, lysine degradation, and butanoate metabolism (Figure 7C). A correlation analysis revealed that Ruminococcus and Alistipes were significantly positively correlated with methapyrilene, cholic acid, and chenodeoxycholic acid. Treponema, Rikenellaceae_RC9_gut_group, Clostridia_UCG-014, and Lachnospiraceae_AC2044_group were significantly positively correlated with LysoPA (P-16:0/0:0), fusaric acid, methapyrilene, cholic acid, and chenodeoxycholic acid. Lachnospiraceae_NK4A136_group was significantly positively correlated with cholic acid, chenodeoxycholic acid, and methapyrilene. UCG-005 was significantly negatively correlated with LysoPA (P-16:0/0/0:0) (Figure 7D).

3.5. Effect of HC Diet on the Transcription Profile of the Colon Epithelium

To further investigate the effects of colon microorganisms and metabolites on substance metabolism and the signal transduction of host epithelial cells, we sequenced the transcriptome of the colon epithelial samples. The sequencing results showed that 44.46 Gb of raw data was obtained from six colon epithelial samples, with a Q30 percentage > 95%.
From the two groups, 1084 differentially expressed genes (DEGs) were identified, with 755 being upregulated and 329 being downregulated (Figure 8A). Among them, we screened out 18 DEGs related to immunity, antioxidation, and epithelial cell repair. The upregulated DEGs included CD93, HSPB7, CD84, HSPA1A, MMP25 Level, CXCL10, HSPB6, IL 1R1, and TLR2, while the downregulated DEGs comprised TXN, CXCL8, CDX2, MMP28, GPX4, Bax, MMP9, CXCL1, and GSS (Figure 8A). All DEGs were enriched in 286 KEGG pathways, among which 20 pathways were screened. Significantly enriched pathways with up-regulated genes included focal adhesion, cytokine–cytokine receptor interaction, bacterial invasion of epithelial cells, and inflammatory mediator regulation of TRP channels; the significantly downregulated pathways included cysteine and methionine metabolism, glutathione metabolism, and peroxisome (Figure 8B).

4. Discussion

The colon contains many microorganisms, which ferment carbohydrates, protein, and amino acids such as those from the rumen to form short-chain fatty acids, hydrogen sulfide, and other metabolites [23,24]. When ruminants eat a high-grain-concentrate diet and a small amount of forage, carbohydrates flow into the small intestine and hindgut [5,6,7]; carbohydrates in the presence of hindgut microorganisms produce VFAs, lactic acid, and metabolites that trigger inflammation and immune responses, affecting host intestinal health [25,26]. In this study, the negative effects of an HC diet on the colon epithelium were discussed by analyzing the bacterial community, the metabonomics of the colon content, and the transcriptome of the colon epithelium.
Normally, in the hingut are undigested polymers such as lignin and crystalline starch that is incompeletly digested in the rumenand small intestine. In addition host-secreted mucins and sed cells contribute to digestible substrates available in the colon. In addition, host-secreted mucins and sed cells contribute to digestible substrates available in the colon. When the dietary structure changes, such as when high-yielding animals consume a high proportion of grains and a small amount of forage, this results in more fermentable substrate flowing into the hindgut [7], which leads to the accumulation of organic acids, a decrease in pH, and even hindgut acidosis [8,27,28]. This study found that an HC diet increased the acetate, propionate, butyrate, and valerate concentrations in the colonic content and decreased the pH compared to an LC diet. These results are similar to those of Chen et al. [12], Lin et al. [14] and Tao et al. [19].
A decreased gut pH causes the death and lysis of acid-sensitive Gram-negative bacteria, leading to the release of large amounts of LPS. LPS can be recognized by immune cells or intestinal epithelial cells [29,30]; when the intestinal epithelium is damaged, LPS undergoes translocation into the bloodstream and activates NF-κB through the LPS/Toll-like receptor 4 (TLR4) signaling pathway, triggering local or systemic inflammation [31,32]. Previous studies found that LPS concentrations in portal vein serum and colon content significantly increased following an HC diet, along with an elevated expression of pro-inflammatory cytokines in the colon epithelium [12]. This indicates that feeding a high-concentrate diet causes colonic epithelial inflammation. This study found that the LPS concentration in the colon epithelium increased in the HC group, but serum LPS and SAA exhibited no significant changes. Although serum LPS did not significantly change in this study, our previous study found that high-concentrate diets significantly increased serum LBP, TNF-α, and IL-6 concentrations, suggesting a shift in LPS levels [33,34]. SAA is a marker of acute inflammation, and there was no significant change in SAA when lambs were fed with a high-concentrate diet for 60 days. In addition, we also found that the colon epithelium in the HC group showed cavities and severe cell damage. Interestingly, the HC diet was associated with an increased expression of zo-1mRNA in the colon epithelium. The expression of ZO-1 is related to tight junction permeability, and it is generally believed that its increase represents a decrease in permeability [35]. Therefore, the relationship between the damage to the colon epithelium and the increase in zo-1 expression needs to be verified by quantitation of changes in the abundance of the zo-1 protein.
Intestinal microorganisms play a vital role in nutrient degradation, utilization, and immune regulation [16], and they are influenced by various factors such as diet [13], feeding mode [15], season [36,37] and heredity [17]. Intestinal microorganisms change in microbial flora populations and metabolism with diet composition [38]. Studies indicate that an HC diet significantly alters ruminants’ hindgut microbiota, which are usually characterized by changes in the dominant flora at the phylum level and a reduced diversity of bacterial communities [12,14,18]. This study found that the α-diversity (examined via the Chao, Shannon, Simpson, and observation indices) did not significantly change, but a PCoA and Adonis analysis showed that the HC diet altered the microbiological composition of the colon, indicating that the diversity of colonic flora was closely related to the diet structure. At the phylum level, the HC group exhibited a significantly higher relative abundance of Bacteroidota, Spirochaetota, and Actinobacteriota. Bacteroides secretes many enzymes related to carbohydrate fermentation [39], which can utilize a variety of carbohydrates from food and the host; acetate, propionate and butyrate being the primary metabolites [40,41]. This is consistent with the increase in the proportion of acetate, propionate, and butyrate in the HC group colon content. This study’s results align with those of Chen et al. [12], who found that an HC diet increased the abundance of Spirochaetota. Although Actinobacteriota account for a relatively small proportion, they may be crucial for intestinal balance [42].
Among the dominant genus with relative abundance ≥ 1%, HC significantly enhanced the abundance of Rikenellaceae_RC9_gut_group, Alistipes, Treponema, [Eubacterium]_coprostanoligenes_group, Ruminococcus, Christensenellaceae_R-7_group, UCG-002, Lachnospiraceae_AC2044_group, Bacteroidales_RF16_group and Clostridia_UCG-014, while significantly decreasing the Lachnospiraceae_NK4A136_group and Clostridium_sensu_stricto_1 abundance compared to LC diet. Rikenellaceae_RC9_gut_group is involved in carbohydrate degradation [43]. Eubacterium_coprostanoligenes can convert cholesterol into phytosterol, which helps reduce serum cholesterol and may produce short-chain fatty acids (SCFAs) to enhance intestinal health [44]. This might explain why the HC group had lower serum cholesterol than the LC group. Christensenellaceae_R-7 group is involved in the degradation of cellulose in the intestine [45]. However, in this study, the abundance of Christensenellaceae_R-7 group was negatively correlated with the cellulose content in the diet. Clostridia_UCG-014 is usually regarded as a pathogen, and its increased abundance is closely related to a variety of diseases [46,47,48]. Alistipes, a Gram-negative bacterium from the Bacteroides group, primarily produces succinic acid [49]. Treponema, the dominant bacteria in the sheep intestine, is closely related to the diet’s ratio of concentrate to roughage. Zhou et al. found [50] that treponema bacteria in the pig intestine are rich in a large number of polysaccharide-degrading enzyme genes. In addition, Treponema includes pathogenic bacteria [51,52], and an increase in its abundance under the conditions of an HC diet may have adverse effects on intestinal health. Ruminococcus, a typical anaerobic bacterium in the ruminant gastrointestinal tract, primarily participates in cellulose decomposition and fermentation [53] and it plays a key role in regulating the intestinal microecological balance [54]. Ruminococcus abundance increases in Crohn’s disease patients, and its metabolite glucorhamnan can induce dendritic cells to secrete the inflammatory cytokine TNF-α [55]. Lachnospiraceae_NK4A136 group can ferment indigestible carbohydrates, such as cellulose and hemicellulose, and it contributes to the maintenance of a healthy intestinal environment; its relative abundance is correlated with the ratio of dietary concentrate to coarseness [56,57]. The decrease in Lachnospiraceae_NK4A136 abundance may be related to the lower cellulose content in the HC group. This contradicts the findings of Chen et al. [12], who reported that an HC diet increased the abundance of Lachnospiraceae_NK4A136 group in the colon. The metabolites of Clostridium sensu stricto 1 are acetate, propionate, and butyrate [58], and some members of Clostridium sensu stricto 1 may participate in the regulation of the inflammatory response and help maintain the intestinal microecological balance [59]. In conclusion, these results demonstrate that the HC diet caused disorders of colon digestion and metabolism, and they explain the changes in colon fermentation parameters.
The metabolome results showed that the highly concentrated diet significantly increased the CA and CDCA concentrations. CDCA and CA are the main primary bile acids in humans, synthesized from cholesterol in hepatocytes. They undergo 7α-dehydroxylation by intestinal microorganisms to form secondary bile acids [60]. Both primary and secondary bile acids regulate host metabolism and immune responses [61]. Bacteroides [62], Clostridium perfringens [63], and Ruminococcus [64] are involved in converting primary bile acids into secondary bile acids. In this study, the increase in primary bile acid abundance in the HC group may be linked to the diet’s high starch content, leading to more concentrate entering the colon, consistent with previous findings [65]. Additionally, bile acid abundance was significantly positively correlated with Ruminococcus, Alistipes, [Eubacterium]_coprostanoligenes_ group, Clostridia_UCG-014, and Treponema, and it was significantly negatively correlated with Lachnospiraceae_NK4A136_group. Bile acids can reduce the triglyceride content in serum [66,67,68]. The decrease in triglycerides in the serum of the lambs in the HC group may be related to the increase in the bile acid concentration. This is consistent with the research of Yang et al. [69], who found that bile acid supplementation reduced serum triglyceride levels in chickens. In addition, bile acids function as inflammatory agents, stimulating the production of pro-inflammatory mediators through both Egr-1-dependent and -independent mechanisms [70]. Thus, bile acids play a key role in regulating inflammatory responses. In colitis patients, cholic acids inhibit peroxisome proliferator-activated receptor α, impairing fatty acid oxidation and intestinal stem cell renewal, which leads to increased epithelial damage [71]. Zheng et al. [72] found that the increase in bile acid caused by a short-term high-fat diet can aggravate colitis symptoms. lysoPA is an important inflammatory marker that directly induces cytokine and chemokine secretion and promotes inflammation [73,74]. In addition, lysoPA leads to impaired barrier function, and it has been found that tight junction protein expression is reduced in lysoPA-treated cells [75]. Therefore, the balance of intestinal lysoPA is essential for intestinal health. Methapyrilene is a hepatic toxin capable of causing increased levels of NADP+ and decreased levels of glutathione, causing oxidative stress [76]. Fusaric acid, a mycotoxin derived from the genus Fusarium, can cause apoptosis and increased inflammation [77], as well as inducing DNA damage [78] and lipid peroxidation [79]. Therefore, in this experiment, the damage caused by the high-concentrate diet to the colon may be related to the increase in the concentrations of the abovementioned metabolites.
It is well known that gastrointestinal microbes and metabolite alterations affect host metabolism and immunity [80,81,82]. Studies have found that an HC diet alters the microbial composition and structure in the gastrointestinal tract, leading to increased permeability and impaired barrier function, as well as gastrointestinal epithelial inflammation [12,82]. GPX4 and GSS are involved in glutathione metabolism. GPX4 can oxidize GSH to oxidized glutathione, thereby reducing peroxides to their corresponding alcohols and mitigating oxidative damage [83]. TRX contains redox-active disulfide bonds, which regulate the reduction/oxidation balance by scavenging active oxygen and play a vital role in the antioxidant system [84,85]. We found that the HC diet significantly inhibited the expression of GPX4, GSS, and TXN, indicating that feeding an HC diet decreases the expression of antioxidant-related genes, which may lead to oxidative damage to the colon epithelium. CDX2 is crucial for maintaining the homeostasis of intestinal epithelial cells and is involved in their regeneration and differentiation. The expression of CDX2 is decreased in ulcerative colitis [86], and the absence of CDX2 in intestinal epithelial cells also leads to macrophage infiltration, which results in chronic inflammation [87]. TLR2 and CXCL10 participate in the Toll-like receptor signaling pathway. TLR2 can recognize a wide range of pathogens [88]. A previous study showed that TLR2 silencing significantly reduced inflammatory factor expression and oxidative stress in LPS-induced granulosa cells, while TLR2 overexpression promoted inflammation and oxidative stress [89]. CXCL10 is a pro-inflammatory cytokine with increased expression in the colonic epithelium of mice with colitis [90]. IL-1R exists in two forms, namely, IL-1R1 and IL-1R2, with IL-1R1 being the primary receptor, and IL-1R signaling directly induces chemokine expression and reactive oxygen species-generating genes, which have detrimental effects during epithelial injury-induced colitis [91]. The results showed an increased expression of TLR2, CXCL10, and IL-1R1 in the HC group, while CDX2 expression decreased. The above indicates that an HC diet leads to oxidative stress and inflammatory responses in the colonic epithelium.

5. Conclusions

In conclusion, we found that an HC diet induces cavitation and inflammatory cell infiltration in the colonic epithelium, promotes the expression of serum inflammatory factors, and reduces antioxidant capacity. The HC diet altered the colonic microbial community structure in lambs, leading to increased VFA levels and a decreased pH. In addition, the HC diet increased the levels of pro-inflammatory metabolites. The HC diet led to colonic epithelial inflammatory damage and a reduced antioxidant capacity by affecting cytokine–cytokine receptor interactions, glutathione metabolism, and peroxisome signaling pathways. In summary, the high-concentrate diet caused epithelial inflammation and oxidative damage by affecting the interaction between the microbial flora in the lamb colon and metabolites and the host epithelium, which eventually disrupted colon homeostasis and had a negative impact on sheep health.

Author Contributions

S.L.: Writing—original draft, Visualization, Methodology, Investigation, Formal analysis. H.W.: Funding acquisition, Project administration, Writing—review and editing, Supervision, Resources, Investigation, Data curation, Conceptualization. B.L.: Investigation, Formal analysis. H.L.: Investigation, Formal analysis. J.Z.: Methodology, Investigation, Formal analysis. A.G.: Supervision, Resources, Conceptualization. J.Y.: Supervision, Resources, Conceptualization. Y.A.: Writing—review and editing, Methodology, Investigation, Formal analysis. T.M.: Investigation, Formal analysis. All authors have read and agreed to the published version of the manuscript.

Funding

This research was supported by the National Natural Science Foundation of China (NSFC) (32460853), the Inner Mongolia Education Department Special Research Project for First-Class Disciplines (YLXKZX-NND-007), and the Basic Research Fund for Universities in Inner Mongolia Autonomous Region (BR22-13-13).

Institutional Review Board Statement

All animal experimentation protocols were approved by the Specialized Committee on Scientific Research and Academic Ethics and Morality of Inner Mongolia Agricultural University ([2019] 034) and followed IMAU’s guidelines for experimental animal management. The study was carried out in compliance with the ARRIVE guidelines. The study was carried out in compliance with the ARRIVE guidelines. The study was carried out in compliance with the ARRIVE guidelines.

Informed Consent Statement

Not applicable.

Data Availability Statement

The datasets presented in this study can be found in online repositories. The name of the repository and accession number can be found below: NCBI: PRJNA1165956 and PRJNA1166455.

Conflicts of Interest

The authors declare no conflicts of interest.

Abbreviations

The following abbreviations are used in this manuscript:
VFAsVolatile fatty acids
ASVsAmplicon sequence variants
PCoAPrincipal coordinate analysis
LEfSeLinear discriminant analysis (LDA) coupled with effect size measurements
OPLS-DAOrthogonal partial least squares discrimination analysis
VIPVariable important in projection
KEGGKyoto encyclopedia of genes and genomes
DEGs Differentially expressed genes

Appendix A

Appendix A.1

Table A1. Composition and nutritional status of the experimental diets (%).
ItemsLCHC
Ingredients (% of DM)
Mixed hay70.0030.00
Corn28.8053.00
Soybean meal0.0014.9
Calcium phosphate dibasic 0.000.10
Salt0.700.50
Premix10.500.50
Sodium bicarbonate0.001.00
Total100.00100.00
Nutrient levels (%)
Crude protein10.7014.40
Soluble carbohydrates37.5049.90
Neutral detergent fiber36.9023.30
Calcium1.400.70
Phosphorus0.300.30
Acid detergent fiber27.9015.00
Soluble carbohydrates/NDF ratio1.022.14
Metabolizable energy (MJ/kg)9.0010.40
Provided per kg of premix: Fe 25 mg; Zn 35 mg; Cu 9 mg; Co 0.1 mg; I 0.9 mg; Se 0.25 mg; Mn 19.5 mg; nicotinic acid 60 mg; vitamin E 15 U; vitamin A 3000 U; vitamin D3 1000 U. Metabolizable energy is a calculated value, and the rest of the nutritional indicators are measured values.

Appendix A.2

Table A2. PCR primer sequences of the target genes.
GenesPrimer sequence (5′-3′)Product Size/bpTm/°C
Claudin-1F: GTGGATGTCGTGCGTGTC
R: TAGTCCCAGCAGGATGCC
12758
OccludinF: AGCAGCAGTGGTAACTTGG
R: TCCCGTCGTGTAGTCTGTT
11158
ZO-1F: CGAGCAGACGCAGAAAA
R: GGCAGAAGATTGTGGTTGA
12355
β-actinF: CATCGTCCACCGCAAAT
R: GCCATGCCAATCTCATCTC
10356
GAPDHF: GGTCGGAGTGAACGGATTTG
R: TGGCAACGATGTCCACTTTG
8359

Appendix B

Figure A1. Species accumulation curve. The horizontal axis represents the sample size and the vertical axis represents the number of ASVs detected.
Animals 15 00749 g0a1
Figure A2. The comparison of α-diversity (Chao, Shannon, Simpson and observation index) of bacterial communities at ASVs level. LC and HC represent diets with concentrate/forage ratios of 30:70 and 70:30. Not significantly different (ns.) p > 0.05.
Animals 15 00749 g0a2
Figure A3. Classification of significantly different metabolites.
Animals 15 00749 g0a3

References

  1. Plaizier, J.C.; Danesh Mesgaran, M.; Derakhshani, H.; Golder, H.; Khafipour, E.; Kleen, J.L.; Lean, I.; Loor, J.; Penner, G.; Zebeli, Q. Review: Enhancing gastrointestinal health in dairy cows. Anim. Int. J. Anim. Biosci. 2018, 12, s399–s418. [Google Scholar] [CrossRef] [PubMed]
  2. Gray, F.V. The digestion of cellulose by sheep; the extent of cellulose digestion at successive levels of the alimentary tract. J. Exp. Biol. 1947, 24, 15–19. [Google Scholar] [CrossRef] [PubMed]
  3. Myers, L.L.; Jackson, H.D.; Packett, L.V. Absorption of volatle fatty acids from the cecum of sheep. J. Anim. Sci. 1967, 26, 1450–1458. [Google Scholar] [CrossRef] [PubMed]
  4. Bergman, E.N. Energy contributions of volatile fatty acids from the gastrointestinal tract in various species. Physiol. Rev. 1990, 70, 567–590. [Google Scholar] [CrossRef]
  5. Matthé, A.; Lebzien, P.; Hric, I.; Flachowsky, G. Influence of prolonged adaptation periods on starch degradation in the digestive tract of dairy cows. Anim. Feed. Sci. Technol. 2003, 103, 15–27. [Google Scholar] [CrossRef]
  6. Plascencia, A.; Bermúdez, R.M.; Cervantes, M.; Corona, L.; Dávila-Ramos, H.; López-Soto, M.A.; May, D.; Torrentera, N.G.; Zinn, R.A. Influence of processing method on comparative digestion of white corn versus conventional steam-flaked yellow dent corn in finishing diets for feedlot cattle. J. Anim. Sci. 2011, 89, 136–141. [Google Scholar] [CrossRef]
  7. Tao, S.; Duanmu, Y.; Dong, H.; Tian, J.; Ni, Y.; Zhao, R. A high-concentrate diet induced colonic epithelial barrier disruption is associated with the activating of cell apoptosis in lactating goats. BMC Vet. Res. 2014, 10, 235. [Google Scholar] [CrossRef]
  8. Gressley, T.F.; Hall, M.B.; Armentano, L.E. Ruminant Nutrition Symposium: Productivity, digestion, and health responses to hindgut acidosis in ruminants. J. Anim. Sci. 2011, 89, 1120–1130. [Google Scholar] [CrossRef]
  9. McNeil, N.I.; Ling, K.L.; Wager, J. Mucosal surface pH of the large intestine of the rat and of normal and inflamed large intestine in man. Gut 1987, 28, 707–713. [Google Scholar] [CrossRef]
  10. Jose, V.L.; Appoothy, T.; More, R.P.; Arun, A.S. Metagenomic insights into the rumen microbial fibrolytic enzymes in Indian crossbred cattle fed finger millet straw. AMB Express 2017, 7, 13. [Google Scholar] [CrossRef]
  11. Rooks, M.G.; Garrett, W.S. Gut microbiota, metabolites and host immunity. Nat. Rev. Immunol. 2016, 16, 341–352. [Google Scholar] [CrossRef] [PubMed]
  12. Chen, M.; Xie, W.; Zhou, S.; Ma, N.; Wang, Y.; Huang, J.; Shen, X.; Chang, G. A high-concentrate diet induces colonic inflammation and barrier damage in Hu sheep. J. Dairy Sci. 2023, 106, 9644–9662. [Google Scholar] [CrossRef]
  13. Liu, J.; Xu, T.; Zhu, W.; Mao, S. High-grain feeding alters caecal bacterial microbiota composition and fermentation and results in caecal mucosal injury in goats. Br. J. Nutr. 2014, 112, 416–427. [Google Scholar] [CrossRef]
  14. Lin, L.; Trabi, E.B.; Xie, F.; Mao, S. Comparison of the fermentation and bacterial community in the colon of Hu sheep fed a low-grain, non-pelleted, or pelleted high-grain diet. Appl. Microbiol. Biotechnol. 2021, 105, 2071–2080. [Google Scholar] [CrossRef]
  15. Wang, B. Effects of Feeding Regimens on Gastrointestinal Microbiota, FattyAcid Metabolism and Meat Quality of Sunit Sheep and Its Underlying Mechanism. Ph.D. Dissertation, Inner Mongolia Agricultural University, Hohhot, China, 2019. [Google Scholar]
  16. Lyte, M.; Villageliú, D.N.; Crooker, B.A.; Brown, D.R. Symposium review: Microbial endocrinology-Why the integration of microbes, epithelial cells, and neurochemical signals in the digestive tract matters to ruminant health. J. Dairy Sci. 2018, 101, 5619–5628. [Google Scholar] [CrossRef]
  17. Spor, A.; Koren, O.; Ley, R. Unravelling the effects of the environment and host genotype on the gut microbiome. Nat. Rev. Microbiol. 2011, 9, 279–290. [Google Scholar] [CrossRef]
  18. Jin, W.; Li, Y.; Cheng, Y.; Mao, S.; Zhu, W. The bacterial and archaeal community structures and methanogenic potential of the cecal microbiota of goats fed with hay and high-grain diets. Antonie Van Leeuwenhoek 2018, 111, 2037–2049. [Google Scholar] [CrossRef]
  19. Tao, S.; Tian, P.; Luo, Y.; Tian, J.; Hua, C.; Geng, Y.; Cong, R.; Ni, Y.; Zhao, R. Microbiome-Metabolome Responses to a High-Grain Diet Associated with the Hind-Gut Health of Goats. Front. Microbiol. 2017, 8, 1764. [Google Scholar] [CrossRef]
  20. Diez-Gonzalez, F.; Callaway, T.R.; Kizoulis, M.G.; Russell, J.B. Grain feeding and the dissemination of acid-resistant Escherichia coli from cattle. Science 1998, 281, 1666–1668. [Google Scholar] [CrossRef]
  21. Bolyen, E.; Rideout, J.R.; Dillon, M.R.; Bokulich, N.A.; Abnet, C.C.; Al-Ghalith, G.A.; Alexander, H.; Alm, E.J.; Arumugam, M.; Asnicar, F.; et al. Reproducible, interactive, scalable and extensible microbiome data science using QIIME 2. Nat. Biotechnol. 2019, 37, 852–857. [Google Scholar] [CrossRef]
  22. Hall, M.; Beiko, R.G. 16S rRNA Gene Analysis with QIIME2. Methods Mol. Biol. 2018, 1849, 113–129. [Google Scholar] [CrossRef] [PubMed]
  23. Yang, Y.X.; Dai, Z.L.; Zhu, W.Y. Important impacts of intestinal bacteria on utilization of dietary amino acids in pigs. Amino Acids 2014, 46, 2489–2501. [Google Scholar] [CrossRef]
  24. Hoover, W.H. Digestion and absorption in the hindgut of ruminants. J. Anim. Sci. 1978, 46, 1789–1799. [Google Scholar] [CrossRef]
  25. LI, H.; Liu, J.; Huo, W.; Zhu, W.; Mao, S. Effects of high concentrate diet on microbial fermentation and biogenic amine formation and absorption in the rumen and cecum of goats. Acta Pratacult. Sin. 2017, 26, 210–216. [Google Scholar]
  26. Ye, H.; Liu, J.; Feng, P.; Zhu, W.; Mao, S. Grain-rich diets altered the colonic fermentation and mucosa-associated bacterial communities and induced mucosal injuries in goats. Sci. Rep. 2016, 6, 20329. [Google Scholar] [CrossRef]
  27. Petri, R.M.; Aditya, S.; Humer, E.; Zebeli, Q. Effect of an intramammary lipopolysaccharide challenge on the hindgut microbial composition and fermentation of dairy cattle experiencing intermittent subacute ruminal acidosis. J. Dairy Sci. 2021, 104, 5417–5431. [Google Scholar] [CrossRef]
  28. Plaizier, J.C.; Li, S.; Le Sciellour, M.; Schurmann, B.L.; Górka, P.; Penner, G.B. Effects of duration of moderate increases in grain feeding on endotoxins in the digestive tract and acute phase proteins in peripheral blood of yearling calves. J. Dairy Sci. 2014, 97, 7076–7084. [Google Scholar] [CrossRef]
  29. Stephens, M.; von der Weid, P.Y. Lipopolysaccharides modulate intestinal epithelial permeability and inflammation in a species-specific manner. Gut Microbes 2020, 11, 421–432. [Google Scholar] [CrossRef]
  30. Han, X.; Lei, X.; Yang, X.; Shen, J.; Zheng, L.; Jin, C.; Cao, Y.; Yao, J. A Metagenomic Insight Into the Hindgut Microbiota and Their Metabolites for Dairy Goats Fed Different Rumen Degradable Starch. Front. Microbiol. 2021, 12, 651631. [Google Scholar] [CrossRef]
  31. Opal, S.M. The host response to endotoxin, antilipopolysaccharide strategies, and the management of severe sepsis. Int. J. Med. Microbiol. IJMM 2007, 297, 365–377. [Google Scholar] [CrossRef]
  32. Lu, Y.C.; Yeh, W.C.; Ohashi, P.S. LPS/TLR4 signal transduction pathway. Cytokine 2008, 42, 145–151. [Google Scholar] [CrossRef] [PubMed]
  33. Ma, T.; Gao, Z.; Yang, X.; Guo, S.; Li, S.; Wang, H. Effects of Forage with Varied Concentrate/Roughage Ratios on Growth, Serum Biochemistry, and Immunity of Dumeng Lambs. Fujian J. Agric. Sci. 2022, 37, 1519–1527. [Google Scholar] [CrossRef]
  34. Yang, X. Effect of Adding Sophora alopecuroides L. in High-Concentration Diet on Growth Performance, Serum Biochemical and Immune Indexes of Mongolian Lambs. Master’s Thesis, Inner Mongolia University, Hohhot, China, 2021. [Google Scholar]
  35. Ibrahim, S.; Zhu, X.; Luo, X.; Feng, Y.; Wang, J. PIK3R3 regulates ZO-1 expression through the NF-kB pathway in inflammatory bowel disease. Int. Immunopharmacol. 2020, 85, 106610. [Google Scholar] [CrossRef]
  36. Shi, H.; Sha, Y.; Wei, H.; Lv, H.; Wen, Y.; Liu, X.; Luo, Y.; Wang, J.; Li, S.; Hu, J. Interaction between Rumen Microbial Density and Short Chain Fatty Acid Concentration in Tibetan Sheep during Warm and Cold Seasons. Chin. J. Anim. Nutr. 2021, 33, 1191–1200. [Google Scholar]
  37. Fan, Q.; Cui, X.; Wang, Z.; Chang, S.; Wanapat, M.; Yan, T.; Hou, F. Rumen Microbiota of Tibetan Sheep (Ovis aries) Adaptation to Extremely Cold Season on the Qinghai-Tibetan Plateau. Front. Vet. Sci. 2021, 8, 673822. [Google Scholar] [CrossRef]
  38. Riva, A.; Kuzyk, O.; Forsberg, E.; Siuzdak, G.; Pfann, C.; Herbold, C.; Daims, H.; Loy, A.; Warth, B.; Berry, D. A fiber-deprived diet disturbs the fine-scale spatial architecture of the murine colon microbiome. Nat. Commun. 2019, 10, 4366. [Google Scholar] [CrossRef]
  39. Thomas, F.; Hehemann, J.H.; Rebuffet, E.; Czjzek, M.; Michel, G. Environmental and gut bacteroidetes: The food connection. Front. Microbiol. 2011, 2, 93. [Google Scholar] [CrossRef]
  40. Magne, F.; Gotteland, M.; Gauthier, L.; Zazueta, A.; Pesoa, S.; Navarrete, P.; Balamurugan, R. The Firmicutes/Bacteroidetes Ratio: A Relevant Marker of Gut Dysbiosis in Obese Patients? Nutrients 2020, 12, 1474. [Google Scholar] [CrossRef]
  41. Kim, Y.S.; Milner, J.A. Dietary modulation of colon cancer risk. J. Nutr. 2007, 137, 2576s–2579s. [Google Scholar] [CrossRef]
  42. Binda, C.; Lopetuso, L.R.; Rizzatti, G.; Gibiino, G.; Cennamo, V.; Gasbarrini, A. Actinobacteria: A relevant minority for the maintenance of gut homeostasis. Dig. Liver Dis. 2018, 50, 421–428. [Google Scholar] [CrossRef]
  43. Pitta, D.W.; Pinchak, E.; Dowd, S.E.; Osterstock, J.; Gontcharova, V.; Youn, E.; Dorton, K.; Yoon, I.; Min, B.R.; Fulford, J.D.; et al. Rumen bacterial diversity dynamics associated with changing from bermudagrass hay to grazed winter wheat diets. Microb. Ecol. 2010, 59, 511–522. [Google Scholar] [CrossRef] [PubMed]
  44. Freier, T.A.; Beitz, D.C.; Li, L.; Hartman, P.A. Characterization of Eubacterium coprostanoligenes sp. nov., a cholesterol-reducing anaerobe. Int. J. Syst. Bacteriol. 1994, 44, 137–142. [Google Scholar] [CrossRef] [PubMed]
  45. Evans, N.J.; Brown, J.M.; Murray, R.D.; Getty, B.; Birtles, R.J.; Hart, C.A.; Carter, S.D. Characterization of novel bovine gastrointestinal tract Treponema isolates and comparison with bovine digital dermatitis treponemes. Appl. Environ. Microbiol. 2011, 77, 138–147. [Google Scholar] [CrossRef]
  46. Marizzoni, M.; Mirabelli, P.; Mombelli, E.; Coppola, L.; Festari, C.; Lopizzo, N.; Luongo, D.; Mazzelli, M.; Naviglio, D.; Blouin, J.L.; et al. A peripheral signature of Alzheimer’s disease featuring microbiota-gut-brain axis markers. Alzheimer’s Res. Ther. 2023, 15, 101. [Google Scholar] [CrossRef] [PubMed]
  47. Yan, F.; Zhang, Q.; Shi, K.; Zhang, Y.; Zhu, B.; Bi, Y.; Wang, X. Gut microbiota dysbiosis with hepatitis B virus liver disease and association with immune response. Front. Cell. Infect. Microbiol. 2023, 13, 1152987. [Google Scholar] [CrossRef]
  48. Leibovitzh, H.; Lee, S.H.; Xue, M.; Raygoza Garay, J.A.; Hernandez-Rocha, C.; Madsen, K.L.; Meddings, J.B.; Guttman, D.S.; Espin-Garcia, O.; Smith, M.I.; et al. Altered Gut Microbiome Composition and Function Are Associated with Gut Barrier Dysfunction in Healthy Relatives of Patients with Crohn’s Disease. Gastroenterology 2022, 163, 1364–1376.e1310. [Google Scholar] [CrossRef]
  49. Parker, B.J.; Wearsch, P.A.; Veloo, A.C.M.; Rodriguez-Palacios, A. The Genus Alistipes: Gut Bacteria with Emerging Implications to Inflammation, Cancer, and Mental Health. Front. Immunol. 2020, 11, 906. [Google Scholar] [CrossRef]
  50. Zhou, S.; Luo, R.; Gong, G.; Wang, Y.; Gesang, Z.; Wang, K.; Xu, Z.; Suolang, S. Characterization of Metagenome-Assembled Genomes and Carbohydrate-Degrading Genes in the Gut Microbiota of Tibetan Pig. Front. Microbiol. 2020, 11, 595066. [Google Scholar] [CrossRef]
  51. Mamuad, L.L.; Seo, B.J.; Faruk, M.S.A.; Espiritu, H.M.; Jin, S.J.; Kim, W.I.; Lee, S.S.; Cho, Y.I. Treponema spp., the dominant pathogen in the lesion of bovine digital dermatitis and its characterization in dairy cattle. Vet. Microbiol. 2020, 245, 108696. [Google Scholar] [CrossRef]
  52. Paraschou, G.; Cook, J.M.; Priestnall, S.L.; Evans, N.J.; Staton, G.J.; Paterson, G.K.; Winkler, B.; Whitbread, T.J. Treponema spp. spirochetes and keratinopathogenic fungi isolated from keratomas in donkeys. Vet. Pathol. 2023, 60, 190–198. [Google Scholar] [CrossRef]
  53. Liang, J.; Fang, W.; Chang, J.; Zhang, G.; Ma, W.; Nabi, M.; Zubair, M.; Zhang, R.; Chen, L.; Huang, J.; et al. Long-term rumen microorganism fermentation of corn stover in vitro for volatile fatty acid production. Bioresour. Technol. 2022, 358, 127447. [Google Scholar] [CrossRef] [PubMed]
  54. La Reau, A.J.; Suen, G. The Ruminococci: Key symbionts of the gut ecosystem. J. Microbiol. 2018, 56, 199–208. [Google Scholar] [CrossRef]
  55. Henke, M.T.; Kenny, D.J.; Cassilly, C.D.; Vlamakis, H.; Xavier, R.J.; Clardy, J. Ruminococcus gnavus, a member of the human gut microbiome associated with Crohn’s disease, produces an inflammatory polysaccharide. Proc. Natl. Acad. Sci. USA 2019, 116, 12672–12677. [Google Scholar] [CrossRef]
  56. Liu, Y.; Wu, H.; Chen, W.; Liu, C.; Meng, Q.; Zhou, Z. Rumen Microbiome and Metabolome of High and Low Residual Feed Intake Angus Heifers. Front. Vet. Sci. 2022, 9, 812861. [Google Scholar] [CrossRef]
  57. Pang, K.; Dai, D.; Yang, Y.; Wang, X.; Liu, S.; Huang, W.; Xue, B.; Chai, S.; Wang, S. Effects of high concentrate rations on ruminal fermentation and microbiota of yaks. Front. Microbiol. 2022, 13, 957152. [Google Scholar] [CrossRef] [PubMed]
  58. Qian, W.; Lu, Z.; Chai, L.; Zhang, X.; Xu, P.; Li, Q.; Wang, S.; Shen, C.; Shi, J.; Xu, Z. Differences of the structure, succession and function of Clostridial communities between jiupei and pit mud during Luzhou-flavour baijiu fermentation. Chin. J. Biotechnol. 2020, 36, 1190–1197. [Google Scholar] [CrossRef]
  59. Rajilić-Stojanović, M.; de Vos, W.M. The first 1000 cultured species of the human gastrointestinal microbiota. FEMS Microbiol. Rev. 2014, 38, 996–1047. [Google Scholar] [CrossRef]
  60. Wahlström, A.; Sayin, S.I.; Marschall, H.U.; Metabolism, F.B.J.C. Intestinal Crosstalk between Bile Acids and Microbiota and Its Impact on Host Metabolism. Cell Metab. 2016, 24, 41–50. [Google Scholar] [CrossRef]
  61. de Aguiar Vallim, T.Q.; Tarling, E.J.; Edwards, P.A.; Metabolism, E.J.C. Pleiotropic Roles of Bile Acids in Metabolism. Cell Metab. 2013, 17, 657–669. [Google Scholar] [CrossRef]
  62. Stellwag, E.J.; Hylemon, P.B. Purification and characterization of bile salt hydrolase from Bacteroides fragilis subsp. fragilis. Biochim. Et Biophys. Acta 1976, 452, 165–176. [Google Scholar] [CrossRef]
  63. Coleman, J.P.; Hudson, L.L. Cloning and characterization of a conjugated bile acid hydrolase gene from Clostridium perfringens. Appl. Environ. Microbiol. 1995, 61, 2514–2520. [Google Scholar] [CrossRef] [PubMed]
  64. Doden, H.L.; Wolf, P.G.; Gaskins, H.R.; Anantharaman, K.; Alves, J.M.P.; Ridlon, J.M. Completion of the gut microbial epi-bile acid pathway. Gut Microbes 2021, 13, 1907271. [Google Scholar] [CrossRef] [PubMed]
  65. Gebeyew, K.; Chen, K.; Wassie, T.; Azad, M.A.K.; He, J.; Jiang, W.; Song, W.; He, Z.; Tan, Z. Dietary Amylose/Amylopectin Ratio Modulates Cecal Microbiota and Metabolites in Weaned Goats. Front. Nutr. 2021, 8, 774766. [Google Scholar] [CrossRef] [PubMed]
  66. Jain, A.K.; Stoll, B.; Burrin, D.G.; Holst, J.J.; Moore, D.D. Enteral bile acid treatment improves parenteral nutrition-related liver disease and intestinal mucosal atrophy in neonatal pigs. Am. J. Physiol. Gastrointest. Liver Physiol. 2012, 302, G218–G224. [Google Scholar] [CrossRef]
  67. Bilz, S.; Samuel, V.; Morino, K.; Savage, D.; Choi, C.S.; Shulman, G.I. Activation of the farnesoid X receptor improves lipid metabolism in combined hyperlipidemic hamsters. Am. J. Physiol. Endocrinol. Metab. 2006, 290, E716–E722. [Google Scholar] [CrossRef]
  68. Krauss, R.M.; Blanche, P.J.; Rawlings, R.S.; Fernstrom, H.S.; Williams, P.T. Separate effects of reduced carbohydrate intake and weight loss on atherogenic dyslipidemia. Am. J. Clin. Nutr. 2006, 83, 1025–1031. [Google Scholar] [CrossRef]
  69. Yang, B.; Huang, S.; Zhao, G.; Ma, Q. Dietary supplementation of porcine bile acids improves laying performance, serum lipid metabolism and cecal microbiota in late-phase laying hens. Anim. Nutr. 2022, 11, 283–292. [Google Scholar] [CrossRef]
  70. Zhang, X.; Choi, F.F.; Zhou, Y.; Leung, F.P.; Tan, S.; Lin, S.; Xu, H.; Jia, W.; Sung, J.J.; Cai, Z.; et al. Metabolite profiling of plasma and urine from rats with TNBS-induced acute colitis using UPLC-ESI-QTOF-MS-based metabonomics—A pilot study. FEBS J. 2012, 279, 2322–2338. [Google Scholar] [CrossRef]
  71. Chen, L.; Jiao, T.; Liu, W.; Luo, Y.; Wang, J.; Guo, X.; Tong, X.; Lin, Z.; Sun, C.; Wang, K.; et al. Hepatic cytochrome P450 8B1 and cholic acid potentiate intestinal epithelial injury in colitis by suppressing intestinal stem cell renewal. Cell Stem Cell 2022, 29, 1366–1381.e1369. [Google Scholar] [CrossRef]
  72. Zheng, M.; Zhai, Y.; Yu, Y.; Shen, J.; Chu, S.; Focaccia, E.; Tian, W.; Wang, S.; Liu, X.; Yuan, X.; et al. TNF compromises intestinal bile-acid tolerance dictating colitis progression and limited infliximab response. Cell Metab. 2024, 36, 2086–2103.e2089. [Google Scholar] [CrossRef]
  73. Tan, S.T.; Ramesh, T.; Toh, X.R.; Nguyen, L.N. Emerging roles of lysophospholipids in health and disease. Prog. Lipid Res. 2020, 80, 101068. [Google Scholar] [CrossRef] [PubMed]
  74. Cao, X.; van Putten, J.P.M.; Wösten, M. Biological functions of bacterial lysophospholipids. Adv. Microb. Physiol. 2023, 82, 129–154. [Google Scholar] [CrossRef] [PubMed]
  75. Yang, J.; Wei, H.; Zhou, Y.; Szeto, C.H.; Li, C.; Lin, Y.; Coker, O.O.; Lau, H.C.H.; Chan, A.W.H.; Sung, J.J.Y.; et al. High-Fat Diet Promotes Colorectal Tumorigenesis Through Modulating Gut Microbiota and Metabolites. Gastroenterology 2022, 162, 135–149.e132. [Google Scholar] [CrossRef] [PubMed]
  76. Ratra, G.S.; Morgan, W.A.; Mullervy, J.; Powell, C.J.; Wright, M.C. Methapyrilene hepatotoxicity is associated with oxidative stress, mitochondrial disfunction and is prevented by the Ca2+ channel blocker verapamil. Toxicology 1998, 130, 79–93. [Google Scholar] [CrossRef]
  77. Dolenšek, T.; Švara, T.; Knific, T.; Gombač, M.; Luzar, B.; Jakovac-Strajn, B. The Influence of Fusarium Mycotoxins on the Liver of Gilts and Their Suckling Piglets. Animals 2021, 11, 2534. [Google Scholar] [CrossRef]
  78. Ghazi, T.; Nagiah, S.; Tiloke, C.; Sheik Abdul, N.; Chuturgoon, A.A. Fusaric Acid Induces DNA Damage and Post-Translational Modifications of p53 in Human Hepatocellular Carcinoma (HepG(2)) Cells. J. Cell. Biochem. 2017, 118, 3866–3874. [Google Scholar] [CrossRef]
  79. Sheik Abdul, N.; Nagiah, S.; Chuturgoon, A.A. Fusaric acid induces mitochondrial stress in human hepatocellular carcinoma (HepG2) cells. Toxicon 2016, 119, 336–344. [Google Scholar] [CrossRef]
  80. Zhang, K.; Xu, Y.; Yang, Y.; Guo, M.; Zhang, T.; Zong, B.; Huang, S.; Suo, L.; Ma, B.; Wang, X.; et al. Gut microbiota-derived metabolites contribute negatively to hindgut barrier function development at the early weaning goat model. Anim. Nutr. 2022, 10, 111–123. [Google Scholar] [CrossRef]
  81. Mu, Y.; Qi, W.; Zhang, T.; Zhang, J.; Mao, S. Multi-omics Analysis Revealed Coordinated Responses of Rumen Microbiome and Epithelium to High-Grain-Induced Subacute Rumen Acidosis in Lactating Dairy Cows. mSystems 2022, 7, e0149021. [Google Scholar] [CrossRef]
  82. Ramos, S.C.; Jeong, C.D.; Mamuad, L.L.; Kim, S.H.; Kang, S.H.; Kim, E.T.; Cho, Y.I.; Lee, S.S.; Lee, S.S. Diet Transition from High-Forage to High-Concentrate Alters Rumen Bacterial Community Composition, Epithelial Transcriptomes and Ruminal Fermentation Parameters in Dairy Cows. Animals 2021, 11, 838. [Google Scholar] [CrossRef]
  83. Forcina, G.C.; Dixon, S.J. GPX4 at the Crossroads of Lipid Homeostasis and Ferroptosis. Proteomics 2019, 19, e1800311. [Google Scholar] [CrossRef] [PubMed]
  84. Balsera, M.; Buchanan, B.B. Evolution of the thioredoxin system as a step enabling adaptation to oxidative stress. Free Radic. Biol. Med. 2019, 140, 28–35. [Google Scholar] [CrossRef] [PubMed]
  85. Powis, G.; Montfort, W.R. Properties and biological activities of thioredoxins. Annu. Rev. Biophys. Biomol. Struct. 2001, 30, 421–455. [Google Scholar] [CrossRef] [PubMed]
  86. Coskun, M. The role of CDX2 in inflammatory bowel disease. Dan. Med. J. 2014, 61, B4820. [Google Scholar]
  87. Chewchuk, S.; Jahan, S.; Lohnes, D. Cdx2 regulates immune cell infiltration in the intestine. Sci. Rep. 2021, 11, 15841. [Google Scholar] [CrossRef]
  88. Kirschning, C.J.; Schumann, R.R. TLR2: Cellular sensor for microbial and endogenous molecular patterns. Curr. Top. Microbiol. Immunol. 2002, 270, 121–144. [Google Scholar] [CrossRef]
  89. Yuan, B.; Luo, S.; Feng, L.; Wang, J.; Mao, J.; Luo, B. Resveratrol regulates the inflammation and oxidative stress of granulosa cells in PCOS via targeting TLR2. J. Bioenerg. Biomembr. 2022, 54, 191–201. [Google Scholar] [CrossRef]
  90. Walrath, T.; Malizia, R.A.; Zhu, X.; Sharp, S.P.; D’Souza, S.S.; Lopez-Soler, R.; Parr, B.; Kartchner, B.; Lee, E.C.; Stain, S.C.; et al. IFN-γ and IL-17A regulate intestinal crypt production of CXCL10 in the healthy and inflamed colon. Am. J. Physiol. Gastrointest. Liver Physiol. 2020, 318, G479–G489. [Google Scholar] [CrossRef]
  91. Overcast, G.R.; Meibers, H.E.; Eshleman, E.M.; Saha, I.; Waggoner, L.; Patel, K.N.; Jain, V.G.; Haslam, D.B.; Alenghat, T.; VanDussen, K.L.; et al. IEC-intrinsic IL-1R signaling holds dual roles in regulating intestinal homeostasis and inflammation. J. Exp. Med. 2023, 220, e20212523. [Google Scholar] [CrossRef]
Figure 1. Effect of HC diet on colon epithelial lipopolysaccharide content and serum parameters in Dumont lambs. (A) The concentrations of colonic epithelial LPS, serum LPS, and SAA. (B) The concentrations of serum TG, TC, and GLU. (C) The concentrations of serum TP, ALB, and GLB. (D) The concentrations of serum TNF-α, IL-1β, and IL-6. (E) The concentrations of serum IgA, IgM, and IgG. (F) The concentrations of serum SOD and GSH-Px. LC and HC represent diets with concentrate/forage ratios of 30:70 and 70:30. Not significantly different (ns.) p > 0.05, * p < 0.05, ** p < 0.01.
Animals 15 00749 g001aAnimals 15 00749 g001b
Figure 2. Effects of HC diet on the morphology of the colonic epithelium and tight junction mRNA expression in Dumont lambs. (A) LC group, cavities and inflammatory cell infiltration appeared. (B) HC group. (C) The expression of ZO-1, Cloudin-1, and Occludin mRNA. LC and HC represent diets with concentrate/forage ratios of 30:70 and 70:30. Significantly * p < 0.05.
Animals 15 00749 g002
Figure 3. Effect of HC diet on colonic fermentation parameters of Dumont lambs (colon contents collected post-mortem). (A) VFAs in the colon content. (B) Colon pH. LC and HC represent diets with concentrate/forage ratios of 30:70 and 70:30. Not significantly different (ns.) p > 0.05, * p < 0.05, ** p < 0.01.
Animals 15 00749 g003
Figure 4. Effect of HC diet on microbial composition in colon of Dumont lambs. (A) PCoA plot. (B) Bacterial phylum with relative abundance ≥ 0.1%. (C) Bacterial genus with relative abundance ≥ 0.1%. (D) Comparison of bacterial phylum abundance with relative abundance ≥ 0.1% between LC and HC groups. Bacterial abundance at phylum level. (E) Comparison of bacterial genus abundance with relative abundance ≥ 1% between LC and HC groups. LC and HC represent diets with concentrate/forage ratios of 30:70 and 70:30. * p < 0.05, ** p < 0.01.
Animals 15 00749 g004aAnimals 15 00749 g004b
Figure 5. LEfSe analysis of microbial community in colon of lambs in LC and HC groups. (A) Cladogram of LDA scores. (B) Bar graph of the LDA value distribution.
Animals 15 00749 g005
Figure 6. Correlation analysis between the relative abundances of colonic microbial genera and colonic fermentation parameters. Spearman’s correlation between VFAs and top 10 genera; * p < 0.05, ** p < 0.01, R > 0.60.
Animals 15 00749 g006
Figure 7. Effect of high-concentrate diet on metabolites in colon content of Dumont lambs. (A) OPLS-DA based on the metabolite matrix of colon content. (B) Differential metabolite VIP value of LC and HC groups. (C) KEGG enrichment analysis of differential metabolites of LC and HC groups, where red represents upregulated, and blue represents downregulated. (D) Correlation network analysis between metabolites and the top 20 bacterial genera showed positive correlations (red squares) and negative correlations (blue squares). A significant correlation was defined as R > 0.6, * p < 0.05, ** p < 0.01. LC and HC represent diets with concentrate/forage ratios of 30:70 and 70:30.
Animals 15 00749 g007
Figure 8. Effect of a high-concentrate diet on transcriptional profile of colon epithelium in Dumont lambs. (A) Volcano plots from RNA-seq analysis of the HC and LC groups show upregulated DEGs in red and downregulated DEGs in blue. (B) The KEGG enrichment analysis of DEGs of LC and HC groups. GPX4 = glutathione peroxidase 4; IL1R1 = interleukin 1 receptor type 1; TLR2 = Toll-like receptor 2; MMP25 = matrix metalloproteinase 25; CXCL10 = chemokine (C-X-C motif) ligand 10; MMP9 = matrix metalloproteinase 9; MMP28 = matrix metallopeptidase 28; HSPA1A = heat shock protein 1A; TXN = thioredoxin; CXCL8 = chemokine (C-X-C motif) ligand 8; HSPB6 = heat shock protein beta 6; CDX2 = caudal-type homeobox 2; HSPB7 = heat shock protein beta 7; CD93 = cluster of differentiation 93; CXCL1 = chemokine (C-X-C motif) ligand 1; CD84 = cluster of differentiation 84; GSS = glutathione synthetase; BAX = Bcl-2-associated X protein. LC and HC represent diets with concentrate/forage ratios of 30:70 and 70:30.
Animals 15 00749 g008
Disclaimer/Publisher’s Note: The statements, opinions and data contained in all publications are solely those of the individual author(s) and contributor(s) and not of MDPI and/or the editor(s). MDPI and/or the editor(s) disclaim responsibility for any injury to people or property resulting from any ideas, methods, instructions or products referred to in the content.

