

Modelling the Spread of Foot and Mouth Disease in Different Livestock Settings in Italy to Assess the Cost Effectiveness of Potential Control Strategies
 , , ,
, , ,  and
and
Simple Summary
Abstract
1. Introduction
2. Materials and Methods
2.1. Source of Data
2.2. Between-Farm Infection Dynamics
2.2.1. Susceptibility and Infectivity of Farms According to Their Attributes
2.2.2. Dynamic Network
2.2.3. SEIR Model
2.3. Areas Included in the Study
- Densely Populated Livestock Area (DPLA), which includes the administrative province of Brescia, Mantua, and Cremona in the region of Lombardy; > 450 animals/km2;
- Medium Populated Livestock Area (MPLA), which includes the administrative province of Pavia and Lodi in the region of Lombardy; >51 animals/km2;
- Sparsely Populated Livestock Area (SPLA), which includes the administrative provinces of Grosseto and Siena in the region of Tuscany; ≤ 50 animals/km2.
2.4. Strategies of FMD Control and Model Simulations
- Stamping-out (SO)
- Pre-emptive culling (PC) of 50 farms at risk of being contaminated or likely to contribute to the spread of the infection within a radius of 5 km;
- Ring vaccination (V) within a radius of 5 km. Vaccine efficacy was set at 40%.
2.5. Direct Costs of FMD Control and Model Simulations
2.6. Software
3. Results
3.1. SPLA
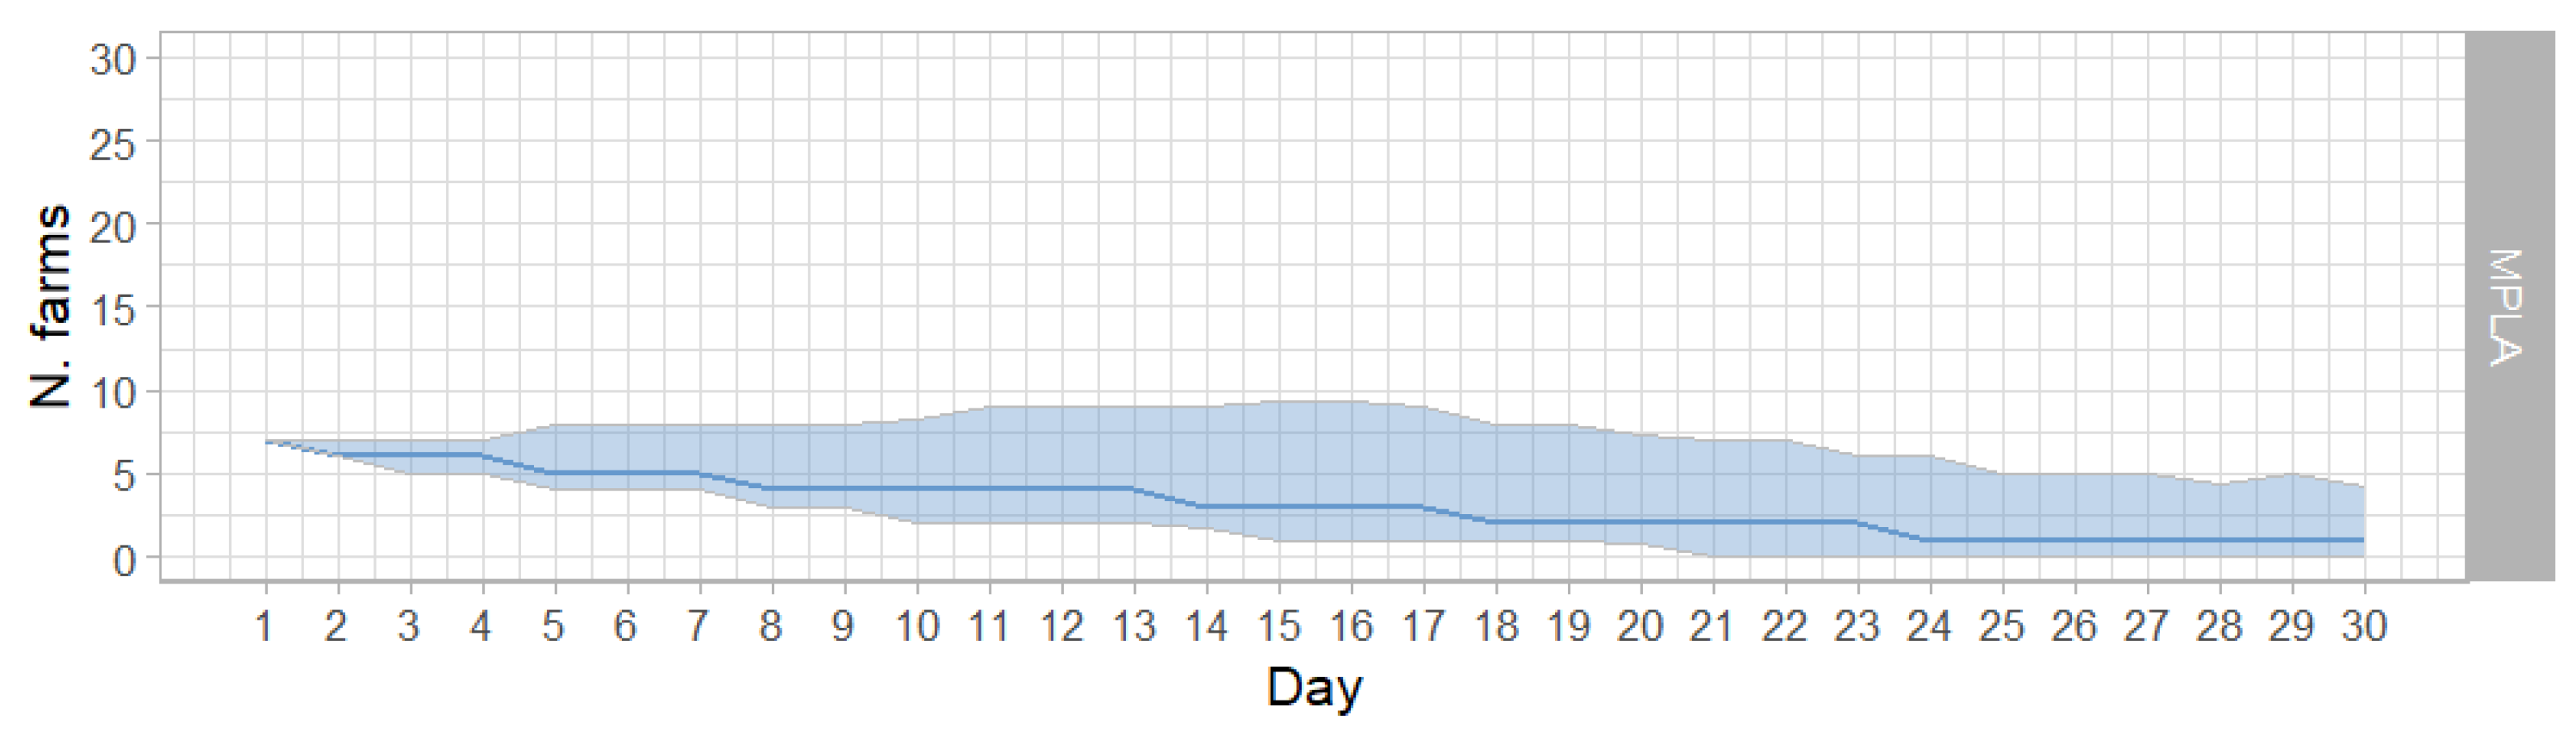
3.2. MPLA
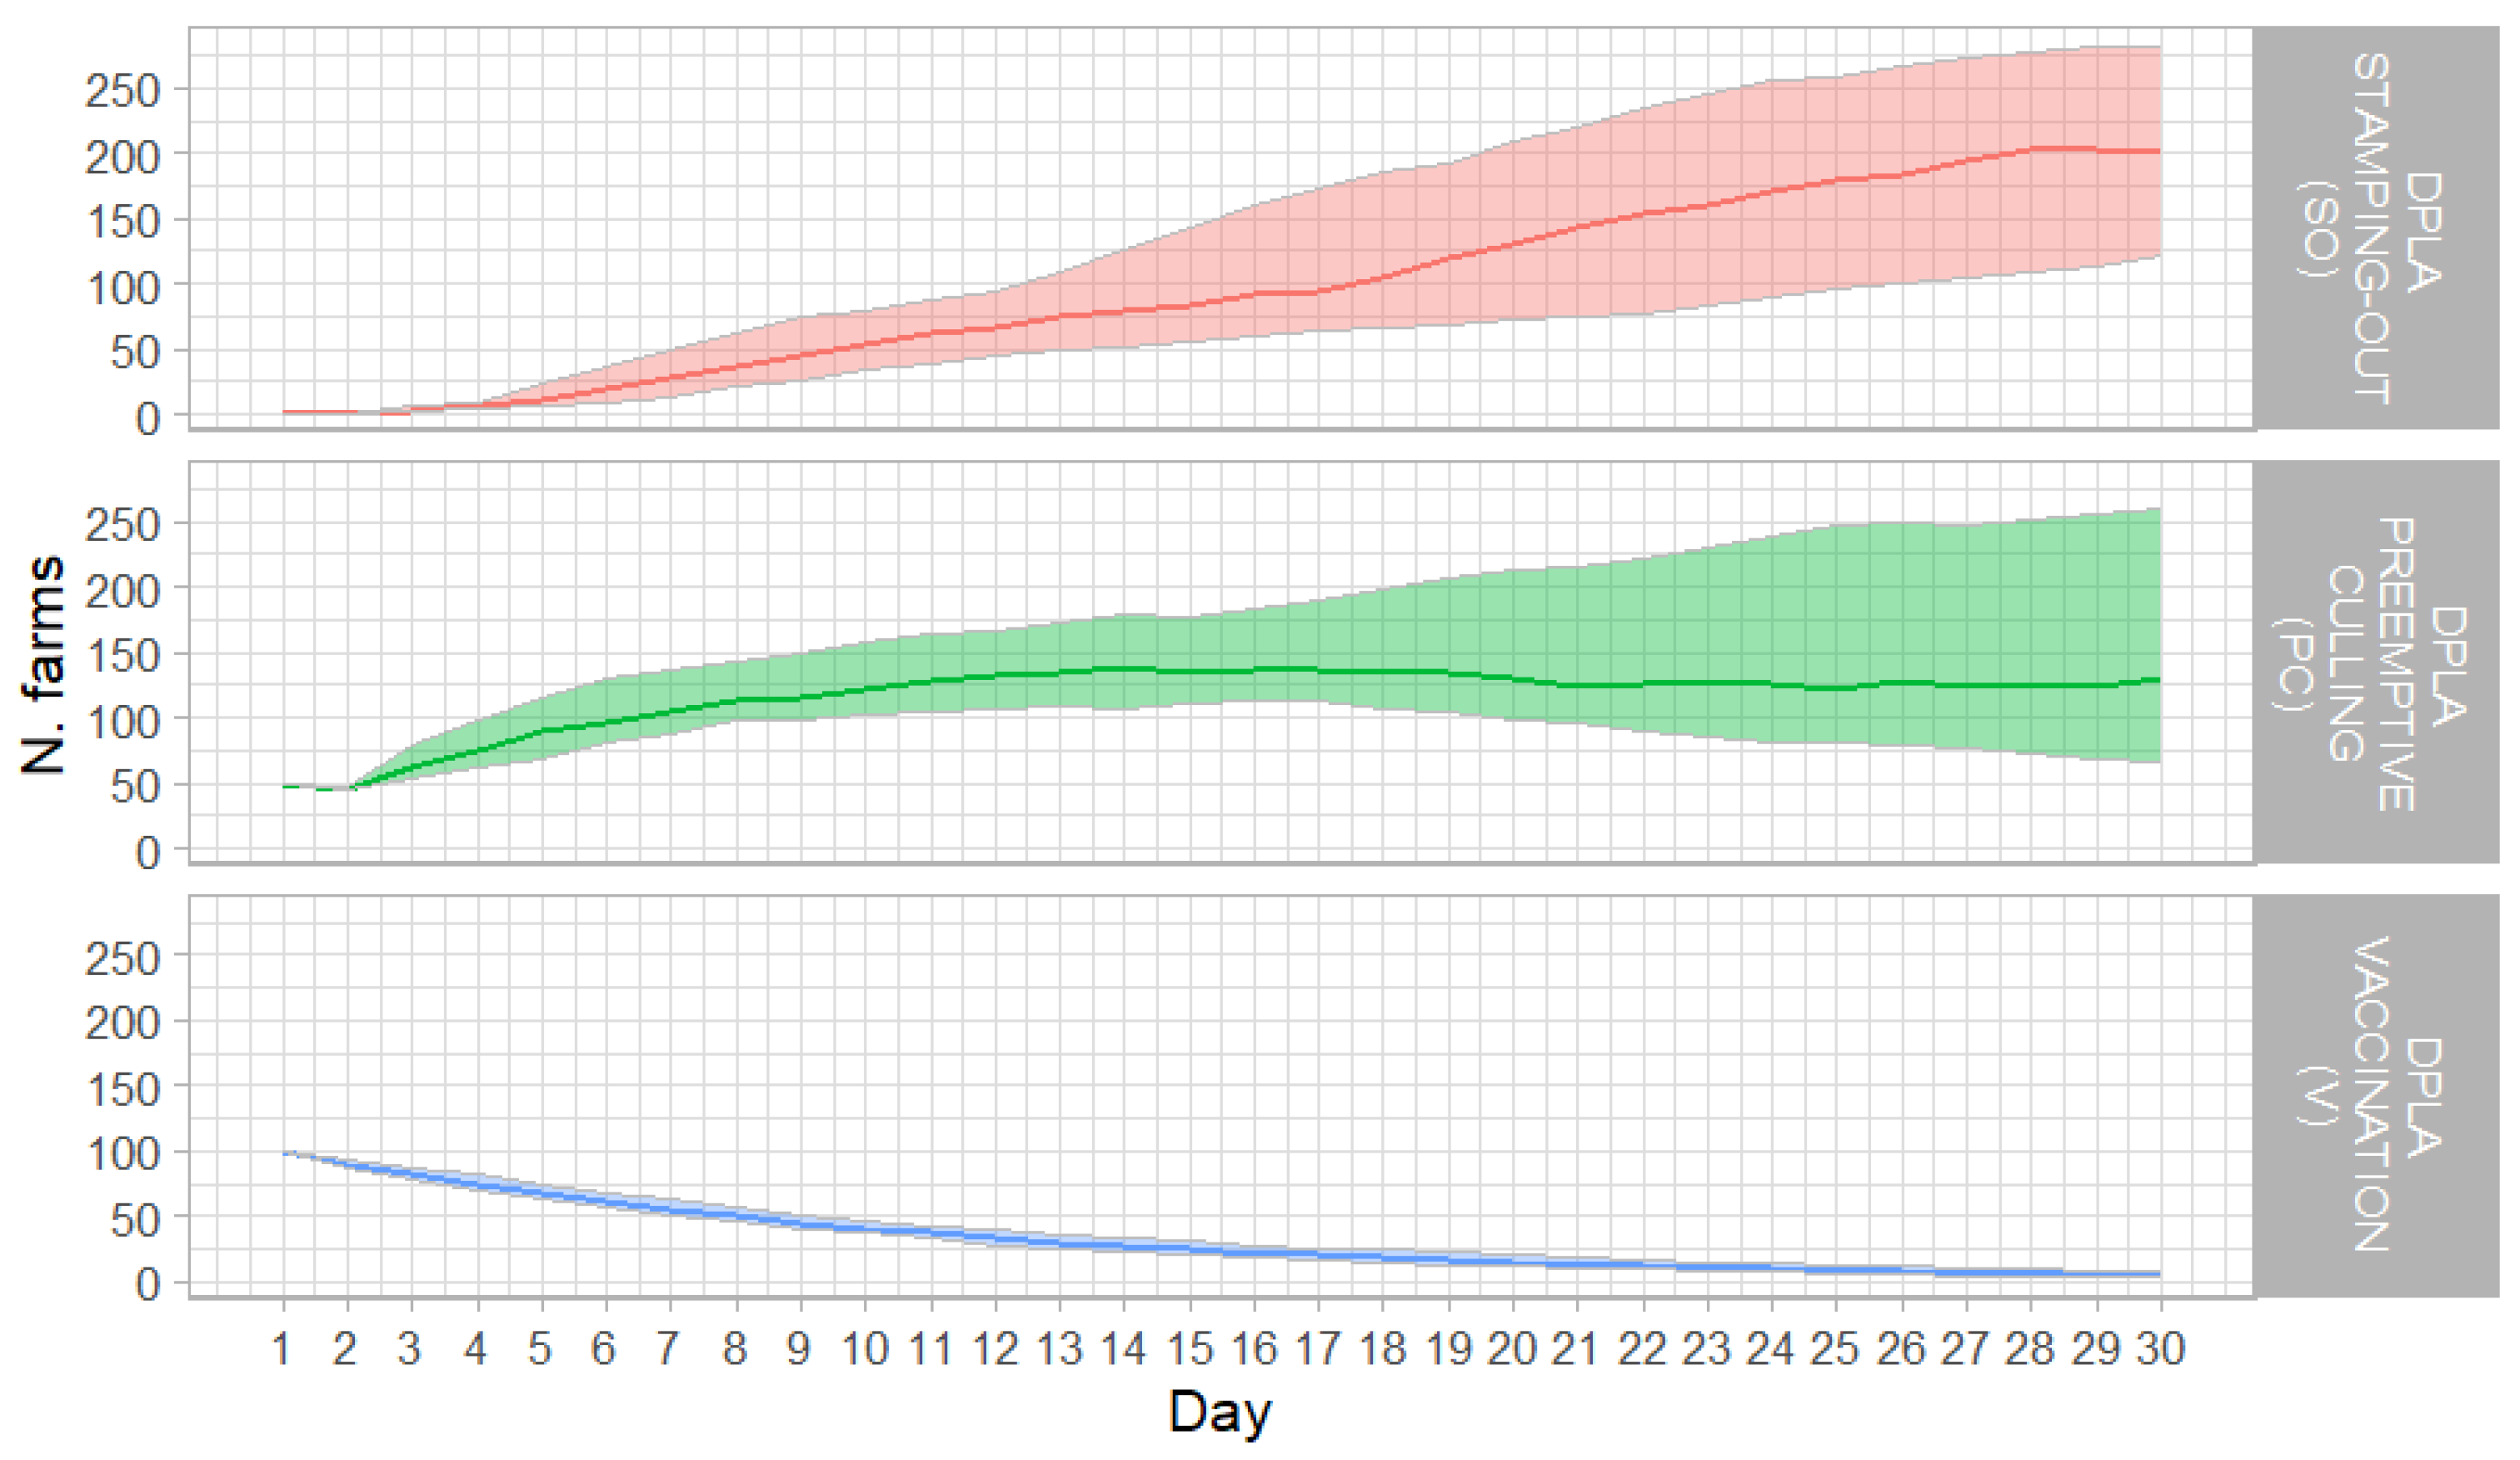
3.3. DPLA
3.3.1. DPLA and Stamping-Out (SO)
3.3.2. DPLA and Preventive Culling (PC)
3.3.3. DPLA and Vaccination (V)
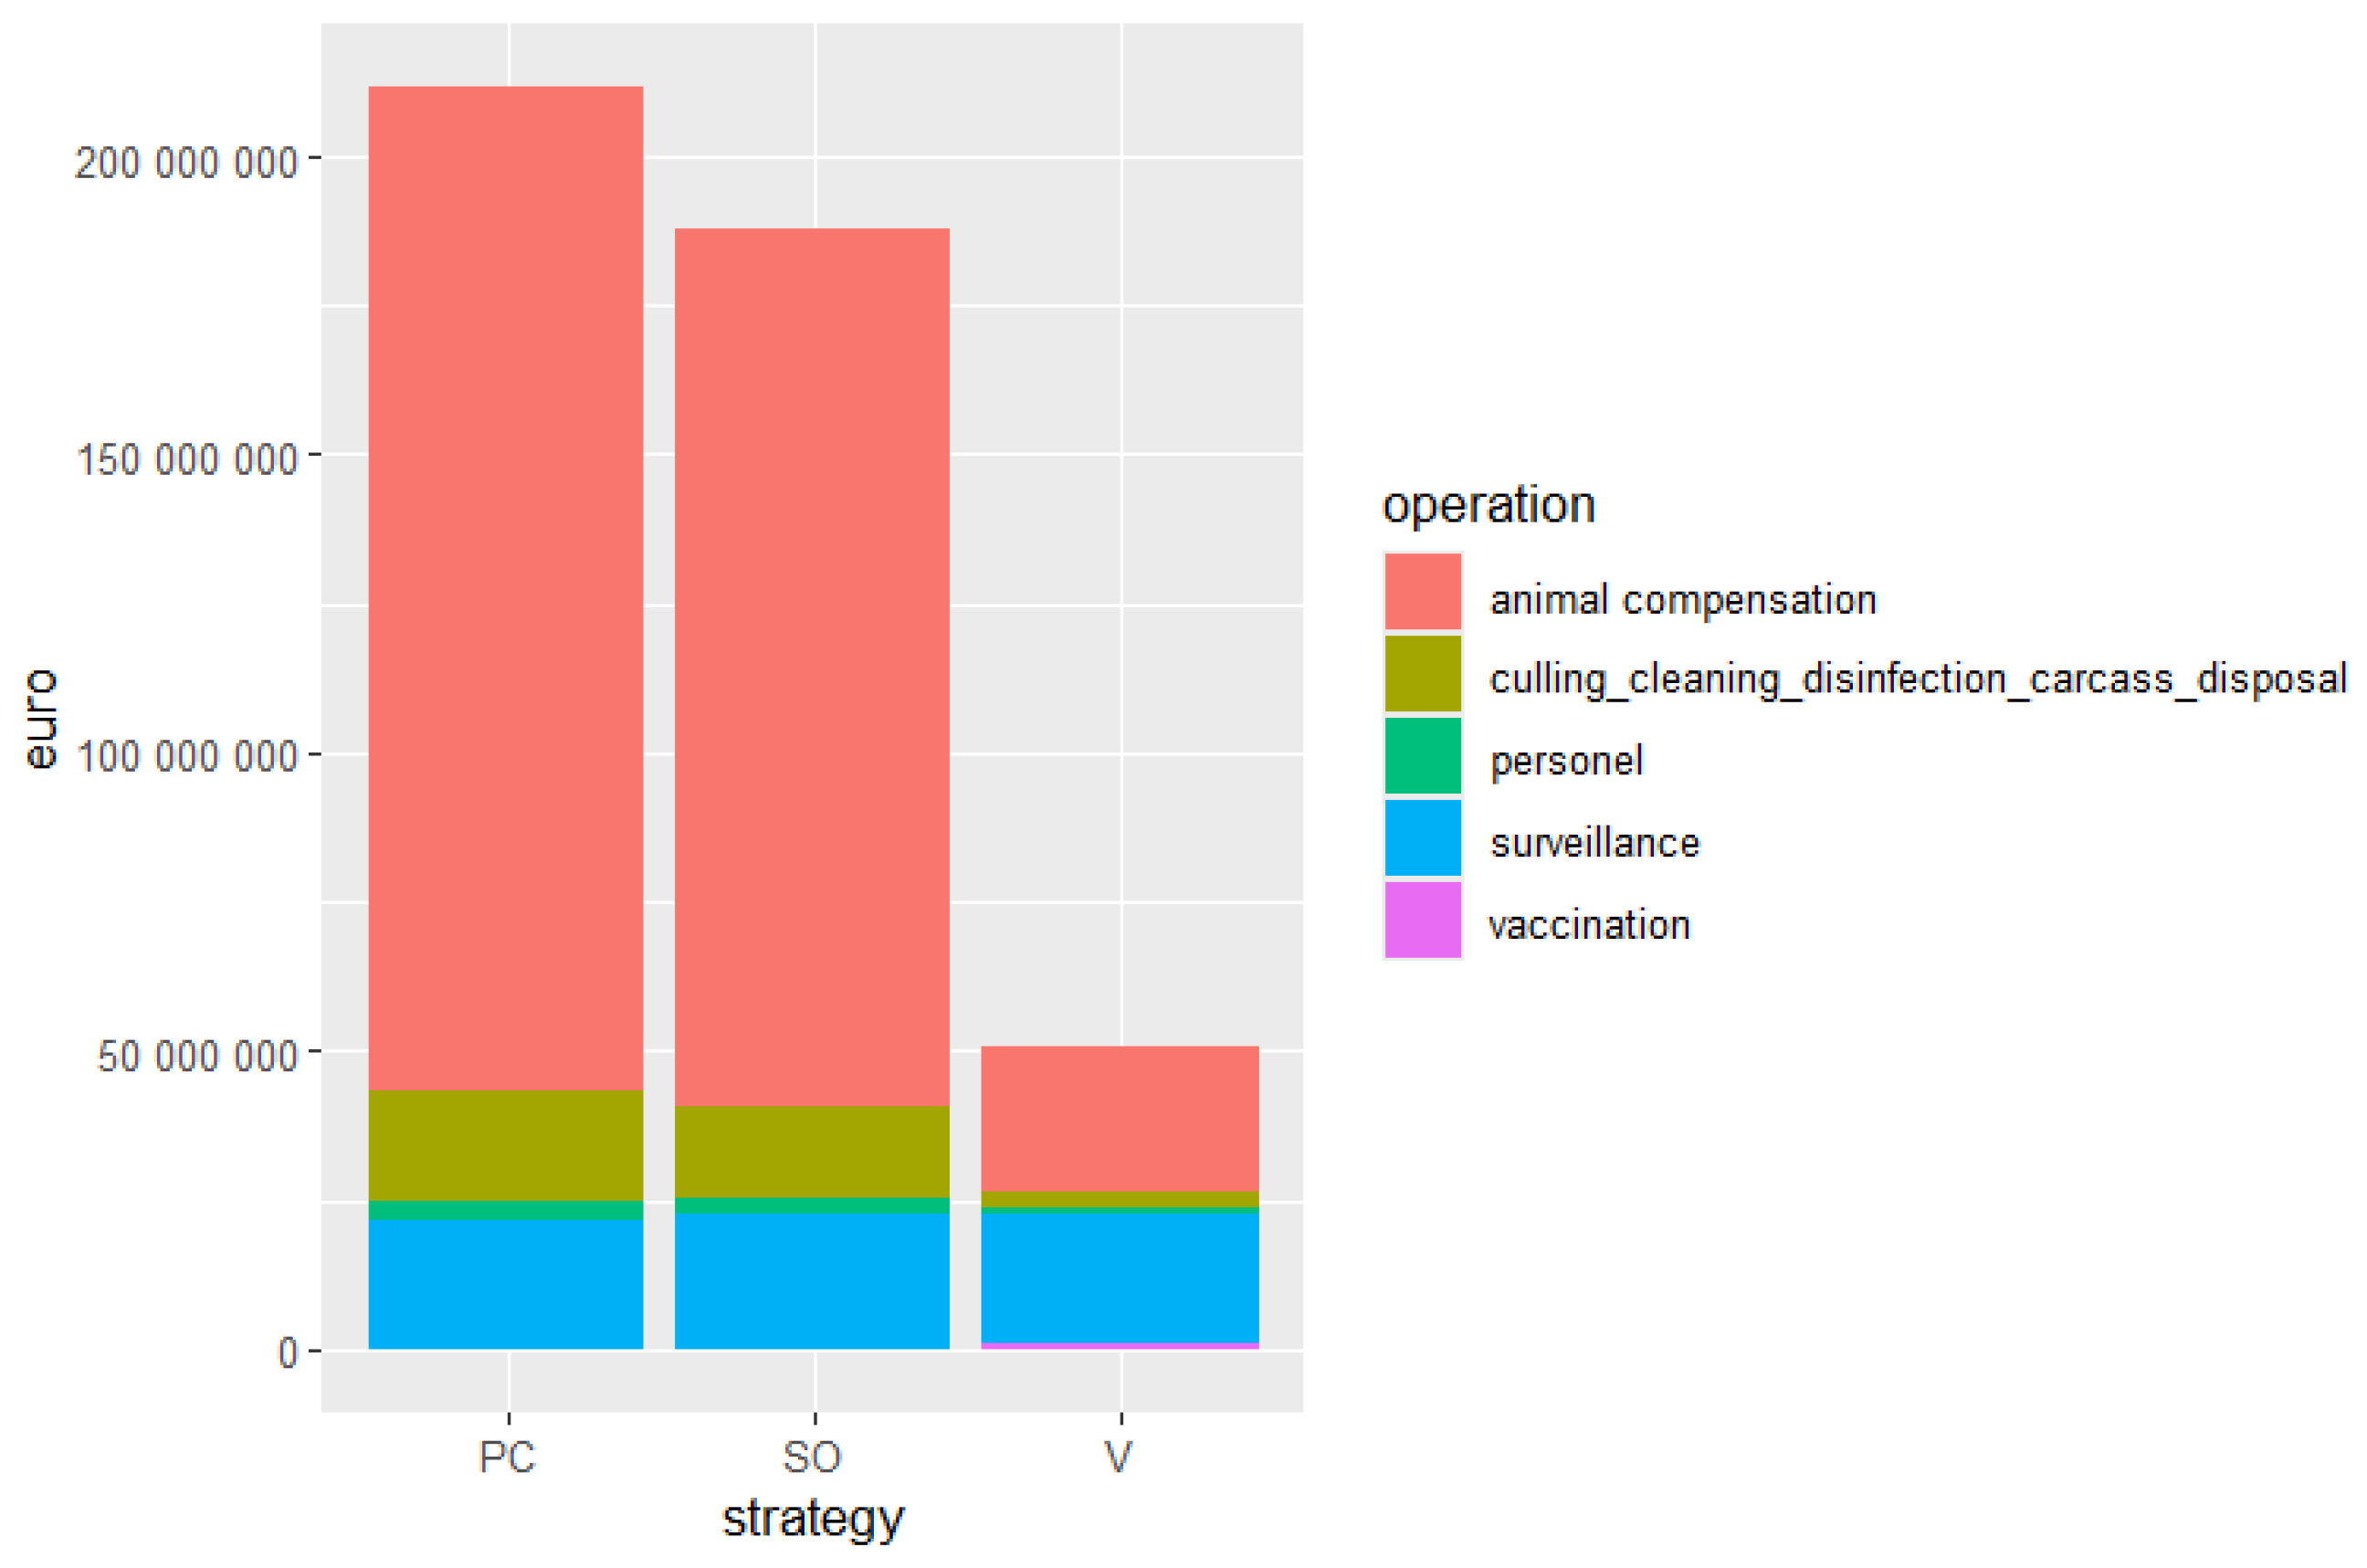
3.4. Direct Costs of FMD Control in the DPLA
4. Discussion
5. Conclusions
Supplementary Materials
Author Contributions
Funding
Institutional Review Board Statement
Informed Consent Statement
Data Availability Statement
Conflicts of Interest
References
- Gibbs, P. The Foot-and-Mouth Disease Epidemic of 2001 in the UK: Implications for the USA and the “War on Terror”. J. Vet. Med. Educ. 2003, 30, 121–132. [Google Scholar] [CrossRef]
- Valdazo-González, B.; Polihronova, L.; Alexandrov, T.; Normann, P.; Knowles, N.J.; Hammond, J.M.; Georgiev, G.K.; Özyörük, F.; Sumption, K.J.; Belsham, G.J.; et al. Reconstruction of the Transmission History of RNA Virus Outbreaks Using Full Genome Sequences: Foot-and-Mouth Disease Virus in Bulgaria in 2011. PLoS ONE 2012, 7, e49650. Available online: https://www.scopus.com/inward/record.uri?eid=2-s2.0-84870652831&doi=10.1371%2fjournal.pone.0049650&partnerID=40&md5=e587de6bd40aa8c42006d53f87a3176b (accessed on 12 May 2024). [CrossRef] [PubMed]
- Brusa, V.; Durrieu, M.; Van Gelderen, C.J.; Signorini, M.L.; Schudel, A. Quantitative risk assessment of FMDV introduction in a FMD free country through bone-in beef and offal importation from a FMD free with vaccination country/zone. Prev. Vet. Med. 2023, 218, 105995. [Google Scholar] [CrossRef]
- McLaws, M.; Ahmadi, B.V.; Condoleo, R.; Limon, G.; Kamata, A.; Arshed, M.; Rozstalnyy, A.; Rosso, F.; Dhingra, M. Risk of Foot-and-Mouth Disease SAT2 Introduction and Spread in Countries in the Near East and West Eurasia; FAO: Rome, Italy, 2023. [Google Scholar]
- Hernández-Jover, M.; Schembri, N.; Holyoake, P.K.; Toribio, J.L.M.L.; Martin, P.A.J. A Comparative Assessment of the Risks of Introduction and Spread of Foot-and-Mouth Disease among Different Pig Sectors in Australia. Front. Vet. Sci. 2016, 3, 85. Available online: https://www.frontiersin.org/articles/10.3389/fvets.2016.00085 (accessed on 15 May 2024). [CrossRef] [PubMed]
- Keeling, M.J. Models of foot-and-mouth disease. Proc. Biol. Sci. 2005, 272, 1195–1202. Available online: https://www.ncbi.nlm.nih.gov/pmc/articles/PMC1564112/ (accessed on 15 May 2024). [CrossRef] [PubMed]
- Garner, M.G.; Beckett, S.D. Modelling the spread of foot-and-mouth disease in Australia. Aust. Vet. J. 2005, 83, 758–766. [Google Scholar] [CrossRef]
- Capon, T.R.; Garner, M.G.; Tapsuwan, S.; Roche, S.; Breed, A.C.; Liu, S.; Miller, C.; Bradhurst, R.; Hamilton, S. A Simulation Study of the Use of Vaccination to Control Foot-and-Mouth Disease Outbreaks Across Australia. Front. Vet. Sci. 2021, 8, 648003. [Google Scholar] [CrossRef]
- Bradhurst, R.; Garner, G.; Hóvári, M.; de la Puente, M.; Mintiens, K.; Yadav, S.; Federici, T.; Kopacka, I.; Stockreiter, S.; Kuzmanova, I.; et al. Development of a transboundary model of livestock disease in Europe. Transbound Emerg. Dis. 2022, 69, 1963–1982. [Google Scholar] [CrossRef]
- Sistema Informativo Veterinario. Available online: https://www.vetinfo.it/sso_portale/accesso.pl (accessed on 9 December 2024).
- Rossetti, G.; Milli, L.; Rinzivillo, S.; Sîrbu, A.; Pedreschi, D.; Giannotti, F. NDlib: A python library to model and analyze diffusion processes over complex networks. Int. J. Data Sci. Anal. 2018, 5, 61–79. [Google Scholar] [CrossRef]
- Seibel, R.L.; Meadows, A.J.; Mundt, C.; Tildesley, M. Modeling target-density-based cull strategies to contain foot-and-mouth disease outbreaks. PeerJ 2024, 12, e16998. [Google Scholar] [CrossRef]
- Hayama, Y.; Yamamoto, T.; Kobayashi, S.; Muroga, N.; Tsutsui, T. Potential impact of species and livestock density on the epidemic size and effectiveness of control measures for foot-and-mouth disease in Japan. J. Vet. Med. Sci. 2016, 78, 13–22. [Google Scholar] [CrossRef] [PubMed]
- EFSA Panel on Animal Health and Welfare, (AHAW); Nielsen, S.S.; Alvarez, J.; Bicout, D.J.; Calistri, P.; Canali, E.; Drewe, J.A.; Garin-Bastuji, B.; Gonzales Rojas, J.L.; Gortázar Schmidt, C.; et al. Scientific Opinion on the assessment of the control measures for category A diseases of Animal Health Law: Foot and Mouth Disease. EFSA J. 2021, 19, e06632. [Google Scholar] [CrossRef]
- Boender, G.J.; van Roermund, H.J.W.; de Jong, M.C.M.; Hagenaars, T.J. Transmission risks and control of foot-and-mouth disease in The Netherlands: Spatial patterns. Epidemics 2010, 2, 36–47. [Google Scholar] [CrossRef] [PubMed]
- Backer, J.A.; Hagenaars, T.J.; Nodelijk, G.; van Roermund, H.J.W. Vaccination against foot-and-mouth disease I: Epidemiological consequences. Prev. Vet. Med. 2012, 107, 27–40. [Google Scholar] [CrossRef]
- Bates, T.W.; Thurmond, M.C.; Carpenter, T.E. Description of an epidemic simulation model for use in evaluating strategies to control an outbreak of foot-and-mouth disease. Am. J. Vet. Res. 2003, 64, 195–204. [Google Scholar] [CrossRef]
- Boklund, A.; Halasa, T.; Christiansen, L.E.; Enøe, C. Comparing control strategies against foot-and-mouth disease: Will vaccination be cost-effective in Denmark? Prev. Vet. Med. 2013, 111, 206–219. Available online: https://www.sciencedirect.com/science/article/pii/S0167587713001712 (accessed on 8 April 2024). [CrossRef]
- Tadesse, B.; Molla, W.; Mengsitu, A.; Jemberu, W.T. Transmission dynamics of foot and mouth disease in selected outbreak areas of northwest Ethiopia. Epidemiol. Infect. 2019, 147, e189. Available online: https://www.ncbi.nlm.nih.gov/pmc/articles/PMC6518559/ (accessed on 8 April 2024). [CrossRef]
- Jemberu, W.T.; Molla, W.; Fentie, T. A randomized controlled field trial assessing foot and mouth disease vaccine effectiveness in Gondar Zuria district, Northwest Ethiopia. Prev. Vet. Med. 2020, 183, 105136. [Google Scholar] [CrossRef]
- Keeling, M.J.; Rohani, P. Modeling Infectious Diseases in Humans and Animals; Princeton University Press: Princeton, NJ, USA, 2008. [Google Scholar]
- Huirne, R.B.M.; Winhorst, H.W. Development of Prevention and Control Strategies to Address Animal Health and Related Problems in Densely Populated Livestock Areas of the Community; Office for Official Publications of the European Communities: Luxembourg, 2003; p. 1, online resource (PDF, 245 pagina’s): Illustraties. [Google Scholar]
- McReynolds, S.W.; Sanderson, M.W.; Reeves, A.; Hill, A.E. Modeling the impact of vaccination control strategies on a foot and mouth disease outbreak in the Central United States. Prev. Vet. Med. 2014, 117, 487–504. Available online: https://www.sciencedirect.com/science/article/pii/S0167587714003213 (accessed on 11 April 2024). [CrossRef]
- Regulation (EU) 2016/429 of the European Parliament and of the Council of 9 March 2016 on Transmissible Animal Diseases and Amending and Repealing Certain Acts in the Area of Animal Health (Animal Health Law) (Text with EEA Relevance). 2016. Available online: http://data.europa.eu/eli/reg/2016/429/2021-04-21/eng (accessed on 10 April 2024).
- Commission Delegated Regulation (EU) 2020/687 of 17 December 2019 supplementing Regulation (EU) 2016/429 of the European Parliament and the Council, as regards rules for the prevention and control of certain listed diseases (Text with EEA relevance). 2019. Available online: https://eur-lex.europa.eu/legal-content/EN/TXT/PDF/?uri=CELEX:32020R0687 (accessed on 10 April 2024).
- Casal, J.; Tago, D.; Pineda, P.; Tabakovski, B.; Santos, I.; Benigno, C.; Huynh, T.; Ciaravino, G.; Beltran-Alcrudo, D. Evaluation of the economic impact of classical and African swine fever epidemics using OutCosT, a new spreadsheet-based tool. Transbound Emerg. Dis. 2022, 69, e2474–e2484. [Google Scholar] [CrossRef]
- Van Rossum, G.; Drake, F.L., Jr. Python Reference Manual; Centrum voor Wiskunde en Informatica: Amsterdam, The Netherlands, 1995. [Google Scholar]
- R Core Team. R: A Language and Environment for Statistical Computing; R Foundation for Statistical Computing: Vienna, Austria, 2022; Available online: https://www.R-project.org/ (accessed on 10 April 2024).
- Chanchaidechachai, T.; Saatkamp, H.W.; Hogeveen, H.; de Jong, M.C.M.; Fischer, E.A.J. Evaluation of foot and mouth disease control measures: Simulating two endemic areas of Thailand. Prev. Vet. Med. 2023, 220, 106045. [Google Scholar] [CrossRef] [PubMed]
- te Beest, D.E.; Hagenaars, T.J.; Stegeman, J.A.; Koopmans, M.P.G.; van Boven, M. Risk based culling for highly infectious diseases of livestock. Vet. Res. 2011, 42, 81. [Google Scholar] [CrossRef] [PubMed]
- Tildesley, M.J.; Bessell, P.R.; Keeling, M.J.; Woolhouse, M.E.J. The role of pre-emptive culling in the control of foot-and-mouth disease. Proc. Biol. Sci. 2009, 276, 3239–3248. Available online: https://www.ncbi.nlm.nih.gov/pmc/articles/PMC2817163/ (accessed on 7 May 2024). [CrossRef] [PubMed]
- Roche, S.E.; Garner, M.G.; Wicks, R.M.; East, I.J.; De Witte, K. How do resources influence control measures during a simulated outbreak of foot and mouth disease in Australia? Prev. Vet. Med. 2014, 113. [Google Scholar] [CrossRef]
- Marschik, T.; Kopacka, I.; Stockreiter, S.; Schmoll, F.; Hiesel, J.; Höflechner-Pöltl, A.; Käsbohrer, A.; Pinior, B. The Epidemiological and Economic Impact of a Potential Foot-and-Mouth Disease Outbreak in Austria. Front. Vet. Sci. 2021, 7, 594753. [Google Scholar] [CrossRef]
- Bouma, A.; Elbers, A.R.W.; Dekker, A.; de Koeijer, A.; Bartels, C.; Vellema, P.; van der Wal, P.; van Rooij, E.M.A.; Pluimers, F.H.; de Jong, M.C.M. The foot-and-mouth disease epidemic in The Netherlands in 2001. Prev. Vet. Med. 2003, 57, 155–166. [Google Scholar] [CrossRef]
- McCulloch, S.P.; Reiss, M.J. A Proposal for a UK Ethics Council for Animal Policy: The Case for Putting Ethics Back into Policy Making. Animals 2018, 8, 88. [Google Scholar] [CrossRef]
- European Commission Avian Influenza—Giugno 2006—Eurobarometer Survey. Eurobarometer. 2006. Available online: https://europa.eu/eurobarometer/surveys/detail/1400 (accessed on 29 October 2024).
- Cabezas, A.H.; Mapitse, N.J.; Tizzani, P.; Sanchez-Vazquez, M.J.; Stone, M.; Park, M. Analysis of suspensions and recoveries of official foot and mouth disease free status of WOAH Members between 1996 and 2020. Front. Vet. Sci. 2022, 9, 1013768. Available online: https://www.ncbi.nlm.nih.gov/pmc/articles/PMC9650142/ (accessed on 8 May 2024). [CrossRef]
- ISMEA Prezzi-Rimborsi animali. Available online: https://www.ismeamercati.it/flex/cm/pages/ServeBLOB.php/L/IT/IDPagina/4484 (accessed on 17 May 2024).


| Farm | Number of Animals |
|---|---|
| Large dairy bovine | >31 |
| Large cattle | >31 |
| Small size bovine farms | ≤30 |
| Water buffalo | ≥11 |
| Small ruminants | ≥11 |
| Large swine fattening | >31 |
| Large swine breeders | >31 |
| Small swine | ≥11 and ≤30 |
| Backyard swine | ≤11 |
| Farm | Susceptibility | Infectivity |
|---|---|---|
| Large dairy bovine | Beta (90, 10) | Beta (45, 55) |
| Large cattle | Beta (90, 10) | Beta (45, 55) |
| Small size bovine | Beta (90, 10) | Beta (25, 75) |
| Water buffalo | Beta (90, 10) | Beta (45, 55) |
| Small ruminants | Beta (15, 85) | Beta (25, 75) |
| Large swine fattening | Beta (6, 94) | Beta (90, 10) |
| Large swine breeders | Beta (6, 94) | Beta (90, 10) |
| Small swine | Beta (6, 94) | Beta (45, 55) |
| Backyard | Beta (5, 95) | Beta (5, 95) |
| Model Parameter | Parameter | Value |
|---|---|---|
| Transmission Rate between Infectious to Susceptible | β | 0.25 |
| Transition rate between Exposed to Infected | 1/α | 0.5 |
| Transition Rate between Infected to Removed or Removal Rate of Infectious | 1/γ | 0.1 |
| Measurement | DPLA | MPLA | SPLA |
|---|---|---|---|
| Large dairy bovine farms | 1521 | 801 | 49 |
| Large cattle farms | 696 | 167 | 52 |
| Small size bovine farms | 408 | 474 | 268 |
| Water buffalo farms | 5 | 8 | 3 |
| Small ruminants farms | 88 | 284 | 667 |
| Large swine fattening farms | 651 | 192 | 3 |
| Large swine breeders farms | 223 | 88 | 17 |
| Small swine farms | 44 | 76 | 53 |
| Backyard swine farms | 6 | 32 | 529 |
| Total farms | 3642 | 2122 | 1641 |
| Surface (km2) | 4.024 | 7.477 | 4.823 |
| N. Farms/km2 | 0.91 | 0.28 | 0.34 |
| Large dairy bovine | 51–211–2096 | 51–204–2130 | 51–122–579 |
| Large cattle | 51–225–3710 | 51–92–3112 | 51–86–432 |
| Small size bovine | 11–27–50 | 11–22–50 | 5–19–50 |
| Water buffalo | 50–107–239 | 18–230–828 | 119–177–457 |
| Small ruminants | 11–39–2407 | 11–24–1912 | 11–158–5729 |
| Large swine fattening | 53–1841–23,608 | 51–1290–19,100 | 312–1300–3629 |
| Large swine breeders | 51–2318–17,998 | 62–1391–17,735 | 54–94–443 |
| Small swine | 11–18–50 | 11–17–50 | 5–11–48 |
| Backyard swine | 11–12–12 | 11–12–19 | 1–1–14 |
| Total animals | 3,038,809 | 875,230 | 197,239 |
| Surface (km2) | 4024 | 7477 | 4823 |
| N. Animal/km2 | 755 | 117 | 40 |
Disclaimer/Publisher’s Note: The statements, opinions and data contained in all publications are solely those of the individual author(s) and contributor(s) and not of MDPI and/or the editor(s). MDPI and/or the editor(s) disclaim responsibility for any injury to people or property resulting from any ideas, methods, instructions or products referred to in the content. |
© 2025 by the authors. Licensee MDPI, Basel, Switzerland. This article is an open access article distributed under the terms and conditions of the Creative Commons Attribution (CC BY) license (https://creativecommons.org/licenses/by/4.0/).
Share and Cite
Pesciaroli, M.; Bellato, A.; Scaburri, A.; Santi, A.; Mannelli, A.; Bellini, S. Modelling the Spread of Foot and Mouth Disease in Different Livestock Settings in Italy to Assess the Cost Effectiveness of Potential Control Strategies. Animals 2025, 15, 386. https://doi.org/10.3390/ani15030386
Pesciaroli M, Bellato A, Scaburri A, Santi A, Mannelli A, Bellini S. Modelling the Spread of Foot and Mouth Disease in Different Livestock Settings in Italy to Assess the Cost Effectiveness of Potential Control Strategies. Animals. 2025; 15(3):386. https://doi.org/10.3390/ani15030386
Chicago/Turabian StylePesciaroli, Michele, Alessandro Bellato, Alessandra Scaburri, Annalisa Santi, Alessandro Mannelli, and Silvia Bellini. 2025. "Modelling the Spread of Foot and Mouth Disease in Different Livestock Settings in Italy to Assess the Cost Effectiveness of Potential Control Strategies" Animals 15, no. 3: 386. https://doi.org/10.3390/ani15030386
APA StylePesciaroli, M., Bellato, A., Scaburri, A., Santi, A., Mannelli, A., & Bellini, S. (2025). Modelling the Spread of Foot and Mouth Disease in Different Livestock Settings in Italy to Assess the Cost Effectiveness of Potential Control Strategies. Animals, 15(3), 386. https://doi.org/10.3390/ani15030386