Article

Transcriptome Profiling Reveals Stage-Specific Regulation of Lipid Metabolism in Orbital Fat of Bighead Carp (Hypophthalmichthys nobilis)

1
School of Fisheries, Xinyang Agriculture and Forestry University, Xinyang 464000, China
2
Fishery Biological Engineering Technology Research Center of Henan Province, Xinyang 464000, China
3
State Key Laboratory of Freshwater Ecology and Biotechnology, Institute of Hydrobiology, Academy of Seed Design, Chinese Academy of Sciences, Wuhan 430072, China
*
Authors to whom correspondence should be addressed.
Animals 2025, 15(17), 2602; https://doi.org/10.3390/ani15172602
Submission received: 28 July 2025 / Revised: 28 August 2025 / Accepted: 2 September 2025 / Published: 4 September 2025

Simple Summary

The head of bighead carp, particularly the flavorful orbital fat behind the eyes, is a prized culinary component. Understanding how fat accumulates in this specific tissue as the fish grows is crucial for improving its quality. However, the underlying molecular mechanisms remain poorly understood. To address this, we compared the gene activity (transcriptome) in orbital fat between juvenile (6-month-old) and market-size (18-month-old) bighead carp. Key biological pathways involved in fat production and breakdown, such as fatty acid metabolism and PPAR signaling, showed significant changes. Importantly, genes like cpt1a, cpt1b, slc27a1, fads2, and scd were found to be linked to increased fat synthesis capacity in the market-size fish. This study provides the first detailed genetic blueprint of orbital fat development in the freshwater fish. These findings offer valuable insights and potential gene targets for future breeding programs aimed at enhancing the growth and nutritional quality of the bighead carp head for consumers.

Abstract

The orbital fat of bighead carp (Hypophthalmichthys nobilis) represents a structural fat deposit located posterior to the eyes and constitutes an important edible component of the head region. Nevertheless, molecular mechanisms governing lipid accumulation during ontogenetic development remain insufficiently characterized. Here, we performed RNA-Seq on orbital fat tissues from 6-month-old (juvenile) and 18-month-old (market-size) bighead carp. A total of 1042 DEGs were identified, with 807 up-regulated and 235 down-regulated in the 6-month-old stage. Functional enrichment revealed key pathways including fatty acid metabolism, PPAR signaling, and glycolysis/gluconeogenesis. qRT-PCR validation confirmed RNA-Seq reliability. Notably, the differential expression patterns of genes such as cpt1a, cpt1b, slc27a1, fads2, and scd suggest their association with an elevated capacity for lipid synthesis in the orbital fat of 18-month-old bighead carp. This study presents the first transcriptome analysis of orbital fat development in a freshwater fish, offering insights into the genetic improvement of head meat quality traits and growth in bighead carp head.

1. Introduction

Adipose tissue has a significant effect on meat quality and animal productivity [1]. Fat accumulation is influenced by age, genetics, and nutrition, with metabolic processes within adipose tissue directly governing fat deposition [2]. Notably, adipose tissue comprises adipocytes in addition to numerous other cell types, including endothelial cells, immune cells, fibroblasts, preadipocytes, and stem cells. The differentiation of adipocytes is a vital process that dictates the level of lipid accumulation within the tissue, and this differentiation is managed by an intricate network of molecular events [3].
Teleost fish exhibit lipid accumulation across a wide range of anatomical regions including visceral organs, liver, subcutaneous tissue, both red and white muscle tissue, brain, pancreas, esophagus, jaw, cranial skeleton, and caudal fin. This distribution varies based on species, nutritional status, life stage, and physiological condition [4]. Analysis of age-specific lipid and fatty acid composition in Atlantic salmon juveniles (at 0+, 1+, and 2+ years) revealed that the regulatory stability of critical functions in developing organisms is maintained through structural changes in the lipid system [5]. This suggests that when studying developmental regulation in different age stages of fish, in addition to muscles and bones, the regulation of the lipid system is also worthy of attention.
Fish have long been recognized as the most important source of long-chain polyunsaturated fatty acids (LC-PUFA) for human consumption, as well as a feed component for farmed fish and other food animals [6,7]. Unlike marine fish, freshwater teleosts possess the ability to desaturate and elongate 18C fatty acids into 20–22C LC-PUFAs. It is noteworthy that in the biosynthesis of LC-PUFA, the Δ6 desaturase (FADS2), which catalyzes the first desaturation step, plays a crucial role and is often used as an indicator of the LC-PUFA synthesis capacity in fish [8]. The influence of dietary fatty acid composition on fish growth, lipid peroxidation, mitochondrial lipids, and gene expression demonstrates age-dependent variations. A study investigating the effects of dietary fatty acids on mitochondrial phospholipid composition, oxidative status, and mitochondrial gene expression in zebrafish of varying ages revealed that younger fish are in a growth phase, whereas older fish are not. As a result, older fish exhibit a decreased susceptibility to lipid peroxidation [9]. These insights suggest that the ability for lipid regulation in fish undergoes modifications related to age.
Compared to other tissues, fish heads may contain higher levels of lipids, including PUFAs, excluding the visceral organs [10]. In particular, orbital fat, which serves a protective role around the optic nerve, has been identified in marine species like tuna and skipjack as a significant reservoir of highly unsaturated fats, with DHA comprising a substantial proportion [11,12]. This highlights the potential of fish head-derived lipids—especially from orbital fat—as a valuable nutritional source. The regulation of lipid metabolism and deposition is tightly controlled at the molecular level, with gene expression patterns in adipose tissue playing a key role in mediating responses to environmental and developmental cues. Transcriptomic analysis provides a powerful tool for rapidly capturing the sequences and expression levels of nearly all transcripts within tissues under specific conditions and has been widely applied to study various traits in fish [13]. The gene expression patterns in adipose tissue are particularly important, as they help link environmental variations to energy balance and maturation timing through genetic mechanisms that integrate lipid metabolism, seasonality, and sexual maturation [14]. For example, a study investigating the effects of glycyrrhizic acid (GA) supplementation in blunt snout bream juveniles revealed that 0.3 mg/kg GA significantly improved growth performance and lipid metabolism [15]. Similarly, transcriptomic analysis of subcutaneous adipose tissue in yellow drum fed a diet containing optimal n-3 LC-PUFAs (9.8 g/kg) showed that differentially expressed genes were primarily enriched in peroxisome and fatty acid biosynthesis pathways [16].
Bighead carp (Hypophthalmichthys nobilis) is a major freshwater aquaculture species in China and one of the traditional “Four Major Domestic Fish”. Unlike many other fish species, the head of bighead carp is highly prized by consumers, often exceeding the economic value of the body meat. Notably, the brain tissue of bighead carp is rich in polyunsaturated fatty acids (PUFAs). Interestingly, the ratio of EPA + DHA to total fatty acids in the total lipid (TL) and triglyceride (TG) fractions of bighead carp head shows no significant difference compared to that of Atlantic salmon—a representative marine fish [17]. In particular, the orbital fat and the associated extraocular muscles are regarded as the most flavorful parts of the head and are key constituents in gourmet dishes. In this study, we conducted transcriptome sequencing of orbital fat tissues from bighead carp at two critical developmental stages: juvenile (6 months old) and market-size (18 months old). By comparing gene expression profiles, with emphasis on lipid synthesis pathways, we aimed to elucidate the molecular mechanisms governing the growth and development of orbital fat, as well as the genetic regulation of fat deposition and metabolism within the head region. The acquisition of relevant pathways and important candidate genes for fat regulation will provide a theoretical basis for the genetic improvement and commercial development of bighead carp head growth and nutritional quality traits.

2. Materials and Methods

2.1. Experimental Material

The materials used in this study were obtained from a mixed-family fish strain cultivated at Zhangdu Lake Fishery in Wuhan, China. The fish were reared in ponds and fed the same commercial diet (Tongwei 131, Tongwei Co., Ltd., Chengdu, China; protein content ≥ 30%) throughout the experimental period under standardized farming conditions. Samples were collected at 6 months post-hatch (M6) (body weight: 512 ± 4.25 g) and at 18 months (M18) (body weight: 2867 ± 36.54 g). For each time point, three individual fish (mixed sex) were used, with each fish representing one biological replicate. After anesthesia with ethyl 3-amino-benzoic acid methyl sulfonate (MS-222) (Sigma-Aldrich, St. Louis, MO, USA), the orbital adipose tissue was rapidly dissected and flash-frozen in liquid nitrogen. The orbital adipose tissues from both eyes of each fish were pooled into one tube as a single sample and stored at −80 °C in an ultra-low temperature freezer.

2.2. RNA Extraction and Quality Evaluation

Total RNA was isolated from all samples with TRIzol reagent (Invitrogen, Carlsbad, CA, USA), followed by DNase I treatment to eliminate genomic DNA contamination. RNA quality was initially evaluated by 1% agarose gel electrophoresis to detect potential degradation or impurities. The purity and concentration of RNA were measured using a Nanodrop2000 spectrophotometer (Thermo Scientific, Waltham, MA, USA), while RNA integrity was further confirmed with an Agilent 2100 Bioanalyzer System (Agilent Technologies, Santa Clara, CA, USA) employing the Agilent RNA 6000 Nano Kit (Agilent Technologies, Santa Clara, CA, USA). Only high-quality RNA samples that passed these quality controls were proceeded to Illumina library preparation. Library preparation and next-generation sequencing were performed by Biomarker Technologies Co., Ltd. (Beijing, China). The final libraries were sequenced on an Illumina NovaSeq 6000 (San Diego, CA, USA) platform to generate 150 bp paired-end reads.

2.3. RNA Sequencing and Data Analysis

Raw sequencing reads were processed to remove adapters and low-quality sequences, yielding high-quality clean reads for all subsequent analyses. The clean reads were then aligned to the bighead carp reference genome (NCBI BioProject accession: PRJNA1090045) using HISAT2 (2.2.1). The resulting SAM files were converted to BAM files, sorted, and indexed using SAMtools (v1.12). Gene-level read counts were generated from the uniquely mapped reads using featureCounts (from Subread v2.0.3). Differential gene expression analysis was performed on the raw count matrix using the DESeq2 (v1.30.1). Simultaneously, the expression levels of genes were also calculated as Fragments Per Kilobase of exon per Million mapped fragments (FPKM) for downstream visualization and interpretation.
The resulting p-values were adjusted for multiple testing using the Benjamini–Hochberg method to control the false discovery rate (FDR). Genes with an FDR ≤ 0.01 and an absolute fold change ≥ 2 were defined as significantly differentially expressed. GO and KEGG enrichment results using the clusterProfiler R package (v4.4.1) with the Benjamini–Hochberg (BH) correction applied across all terms within the three GO domains (Biological Process, Cellular Component, Molecular Function) and KEGG pathways simultaneously. The protein–protein interaction network was constructed using the GeneMANIA plugin (version 3.6.0) in Cytoscape (version 3.9.1). Due to the lack of extensive interaction data specifically for bighead carp, the analysis was performed using the Homo sapiens reference database available within GeneMANia, which integrates interaction data from multiple sources including physical interactions, genetic interactions, pathways, co-expression, co-localization, and protein domain similarity. A permutation test (n = 1000) was conducted within the GeneMANIA framework to assess the statistical significance of the observed network connectivity. The resulting network is considered to represent functional associations that are likely to be conserved across vertebrates.

2.4. Validation of RNA-Seq Results by Quantitative Real-Time PCR (qRT-PCR)

To validate the RNA-seq results, ten differentially expressed genes (DEGs) were randomly selected for quantitative real-time PCR (qRT-PCR) analysis, with β-actin serving as the internal reference gene. The ten differentially expressed genes (DEGs) selected for qRT-PCR validation were chosen randomly based on the following criteria to ensure a comprehensive evaluation of the RNA-seq data: (1) a wide range of fold-change values (both up- and down-regulated in the M6); (2) representation of key significantly enriched KEGG pathways, namely fatty acid metabolism, Tight junction, PPAR signaling pathway, and glycolysis/gluconeogenesis. Total RNA used for qRT-PCR was obtained from the same biological specimens as those utilized for transcriptome sequencing. cDNA was reverse-transcribed from 1 μg of total RNA per sample using the PrimeScript™ RT kit (TaKaRa, Dalian, China). Gene-specific primers were designed with Primer 5 software, and their sequences are provided in Table 1. All qRT-PCR reactions were conducted on a StepOne™ Real-Time PCR System (Applied Biosystems, Carlsbad, CA, USA). Each 20 μL qRT-PCR reaction consisted of 10 μL of SYBR Green Master Mix, 0.6 μL of each primer (2 μmol/L), 2 μL of cDNA template (corresponding to 1000 ng total RNA), and 6.8 μL of nuclease-free water. The thermal cycling conditions were as follows: initial denaturation at 95 °C for 10 min, followed by 40 cycles of 95 °C for 15 s, 60 °C for 30 s, and 72 °C for 45 s. Each sample was analyzed in three biological and three technical replicates. Gene expression levels were calculated using the 2−ΔΔCT method normalized to β-actin [18]. The correlation between the RNA-seq and qRT-PCR results was assessed by linear regression analysis.

3. Results

3.1. Transcriptome Sequencing

RNA-Seq was performed on orbital fat from bighead carp at two developmental stages (M6, M18), with three biological replicates per stage (total n = 6). A total of 40.24 Gb of clean data was obtained, averaging 6.71 Gb per sample. The Q30 scores for all samples exceeded 91.73%, and GC content ranged from 45.37% to 48.38% (Table A1). All sequencing data were uploaded to the Sequence Reading Archive (SRA) of the National Center for Biotechnology Information (NCBI; accession number: PRJNA1284284). In comparison with M18 vs. M6, 1042 DEGs were identified: 807 were significantly up-regulated in M6, and 235 were significantly down-regulated in M6 (Figure 1).

3.2. GO and KEGG Enrichment Analysis of Differentially Expressed Genes

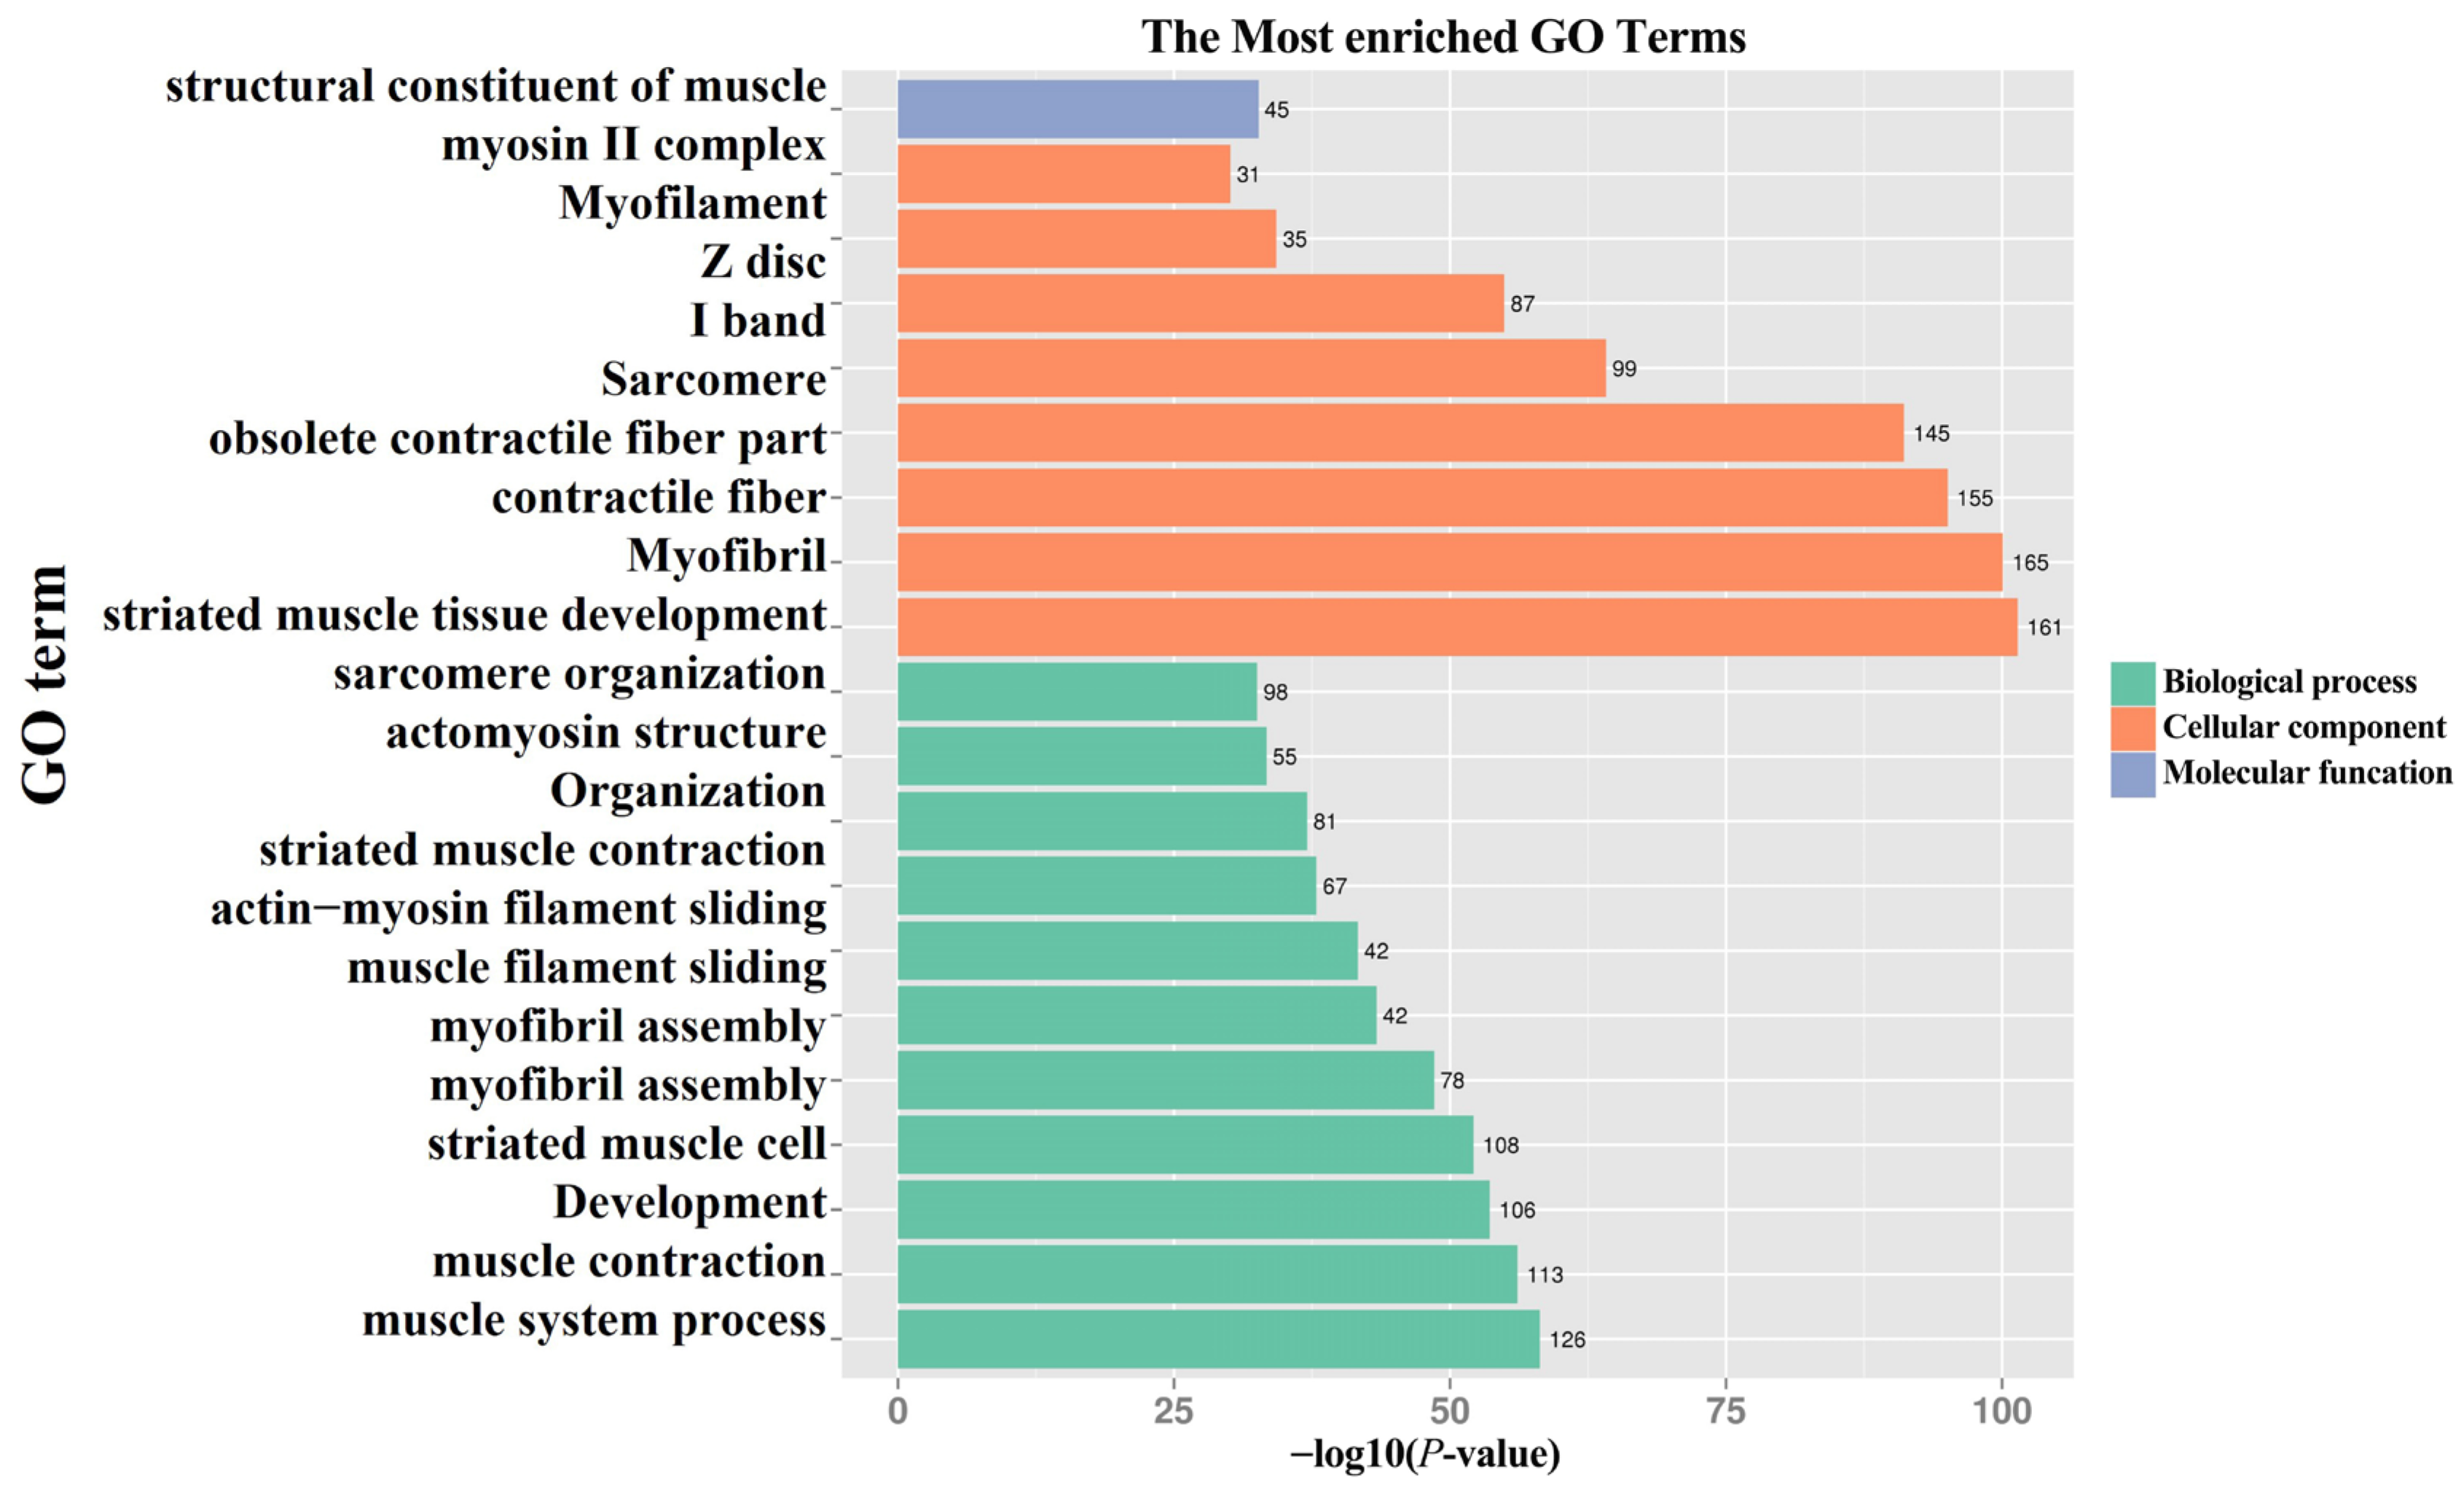
To deeply explore the biological significance of DEGs in the two growth stages of orbital fat, we ranked the enriched terms based on ascending p-value and mainly analyzed the top 20 GO entries (Figure 2). Functional enrichment analysis shows that DEGs in two periods were mainly clustered in cellular components and biological processes, with fewer DEGs clustered in molecular function. In cellular components, DEGs mainly include myofibril (GO:0030016), contractile fiber (GO:0043292), and sarcomere (GO:0030017), etc. In biological process, DEGs mainly include muscle system process (GO:0003012), muscle contraction (GO:0006936), muscle cell development (GO:0055001), etc.; In molecular function, DEGs are mainly structural constituent of muscle (GO:0008307). GO enrichment analysis was performed using the clusterProfiler R package (v4.4.1), with Benjamini–Hochberg (BH) correction applied simultaneously across all terms from the three Gene Ontology (GO) domains (Biological Process, Cellular Component, and Molecular Function). The results are presented in Figure A2.
KEGG enrichment analysis showed that the pathways that were significantly enriched in the comparison between M6 and M18 were mainly Cardiac muscle contraction, Adrenergic signaling in cardiomyocytes, carbon metabolism, Glycolysis/Gluconeogenesis, fatty acid metabolism, PPAR signaling pathway, etc. (Figure 3).

3.3. Important Candidate Genes Regulating the Growth and Development of Adipose Tissue in the Bighead’s Eye Socket

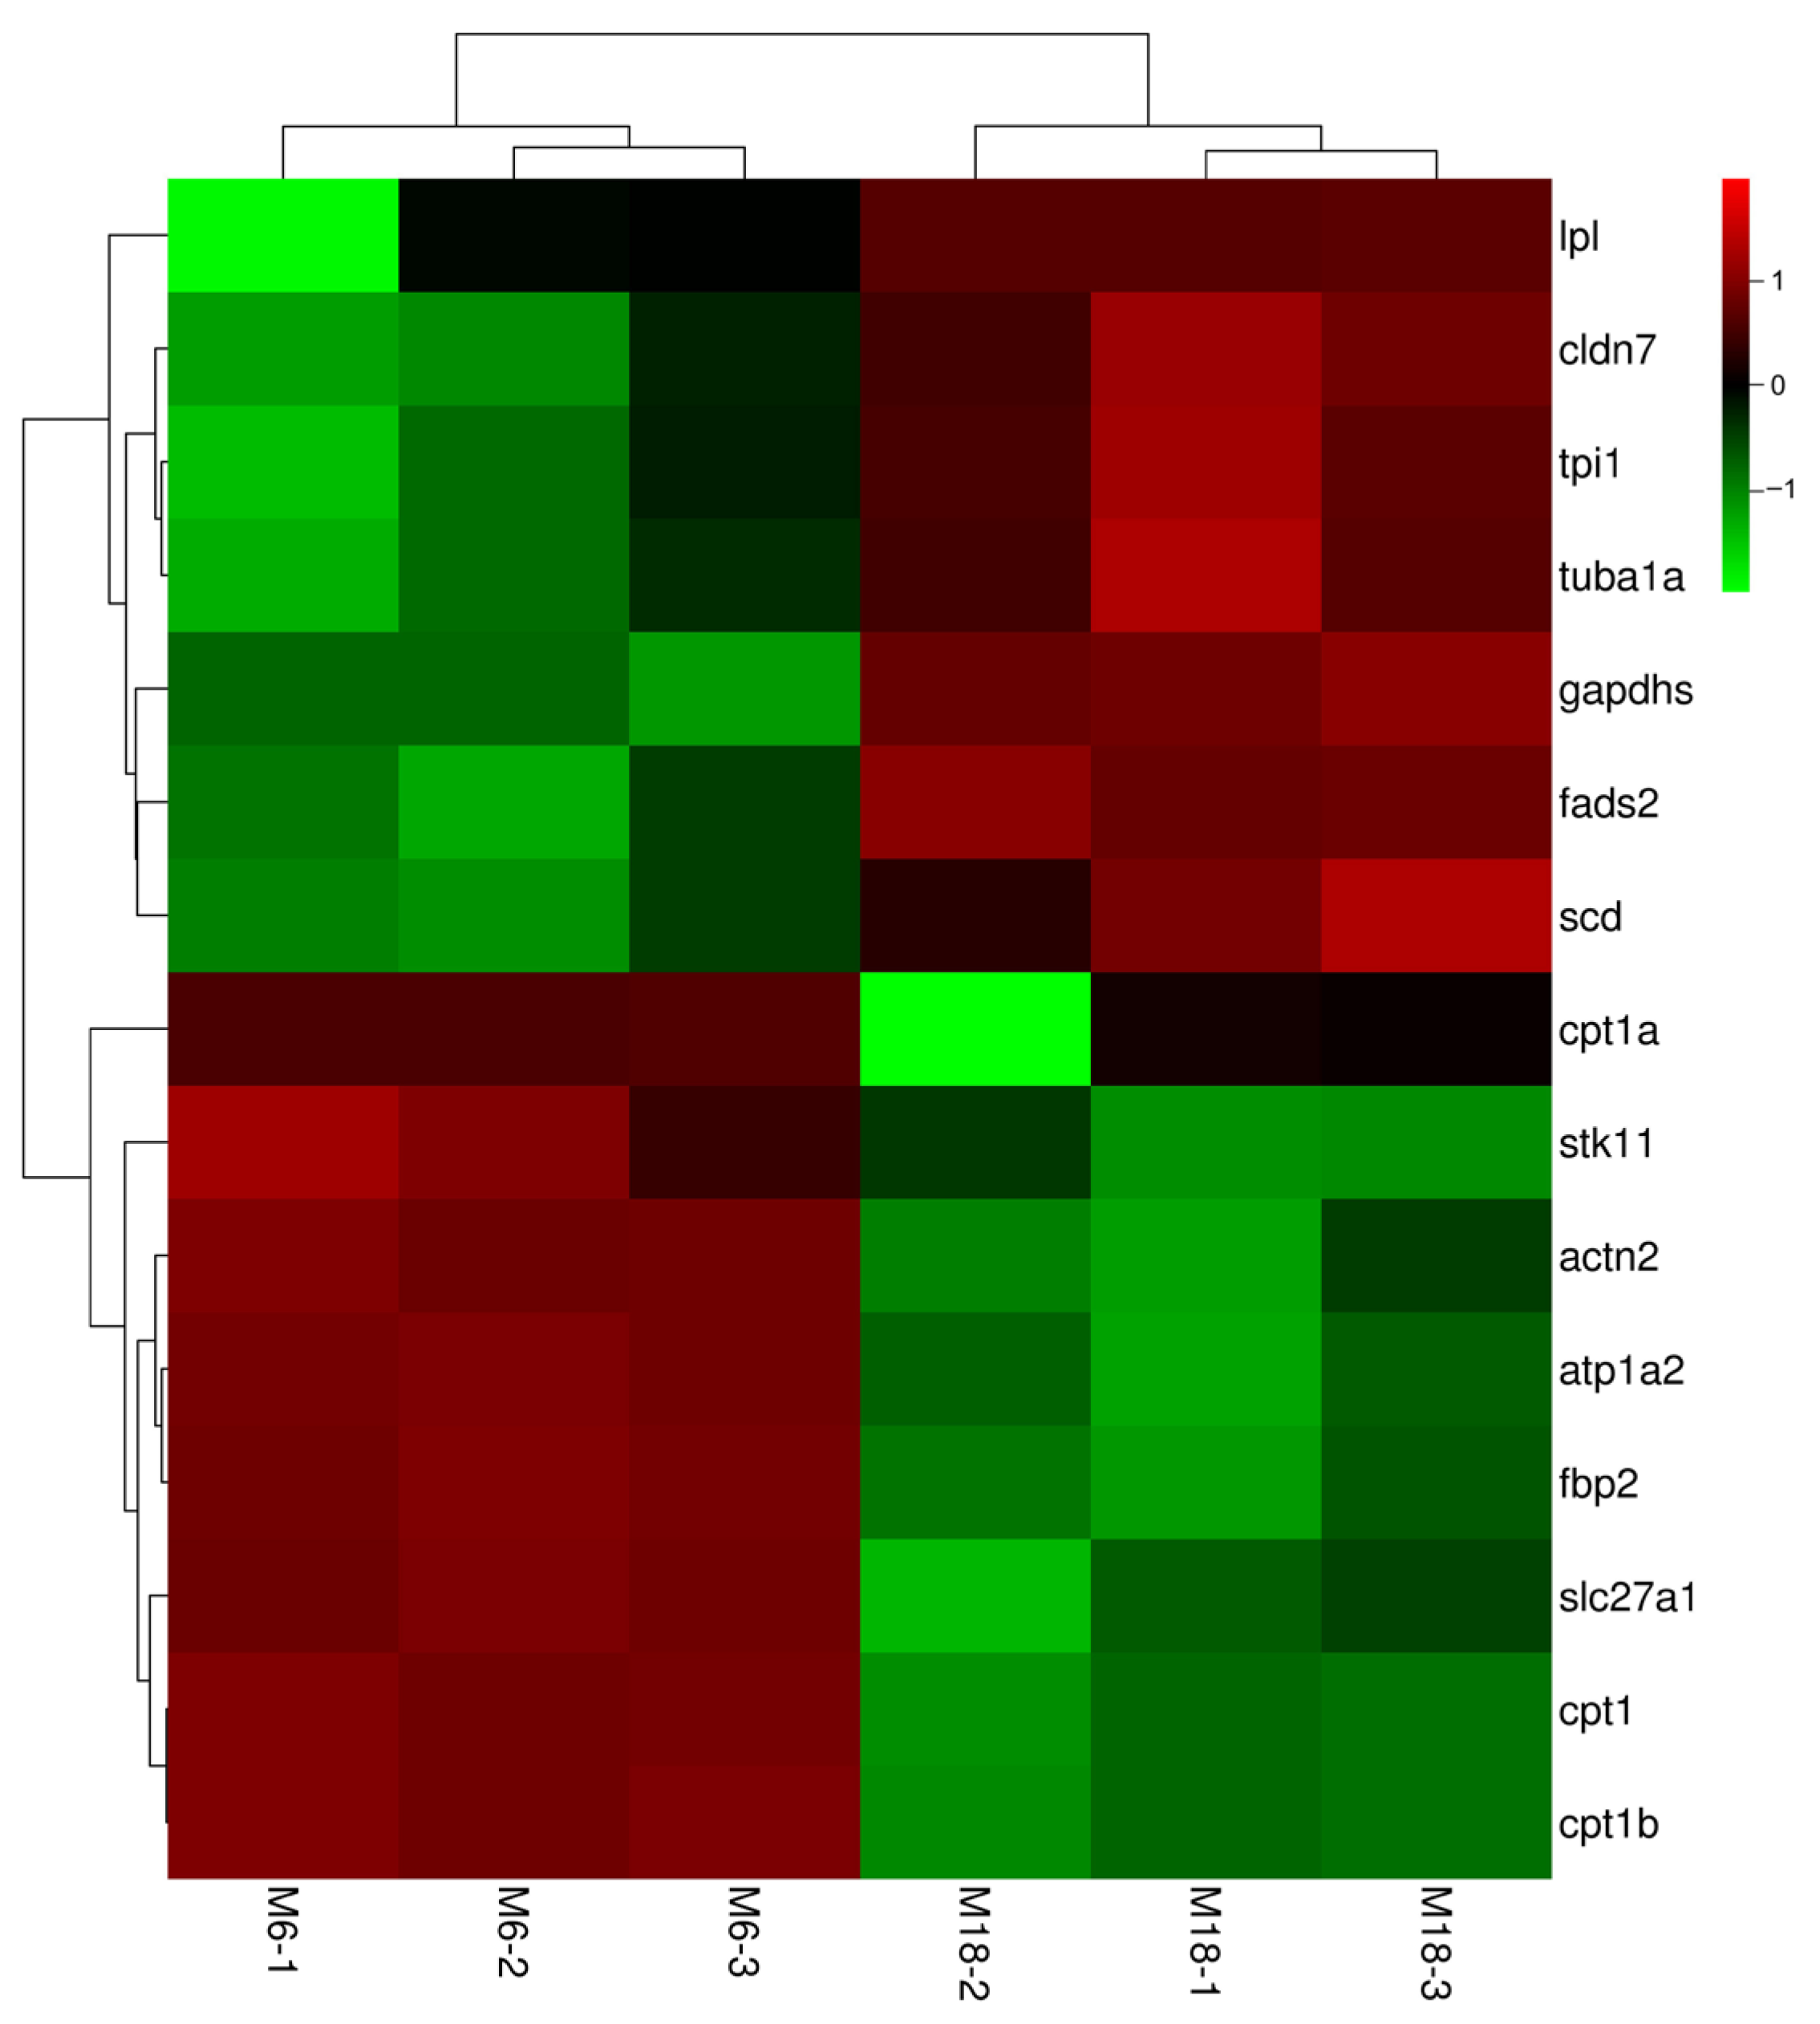
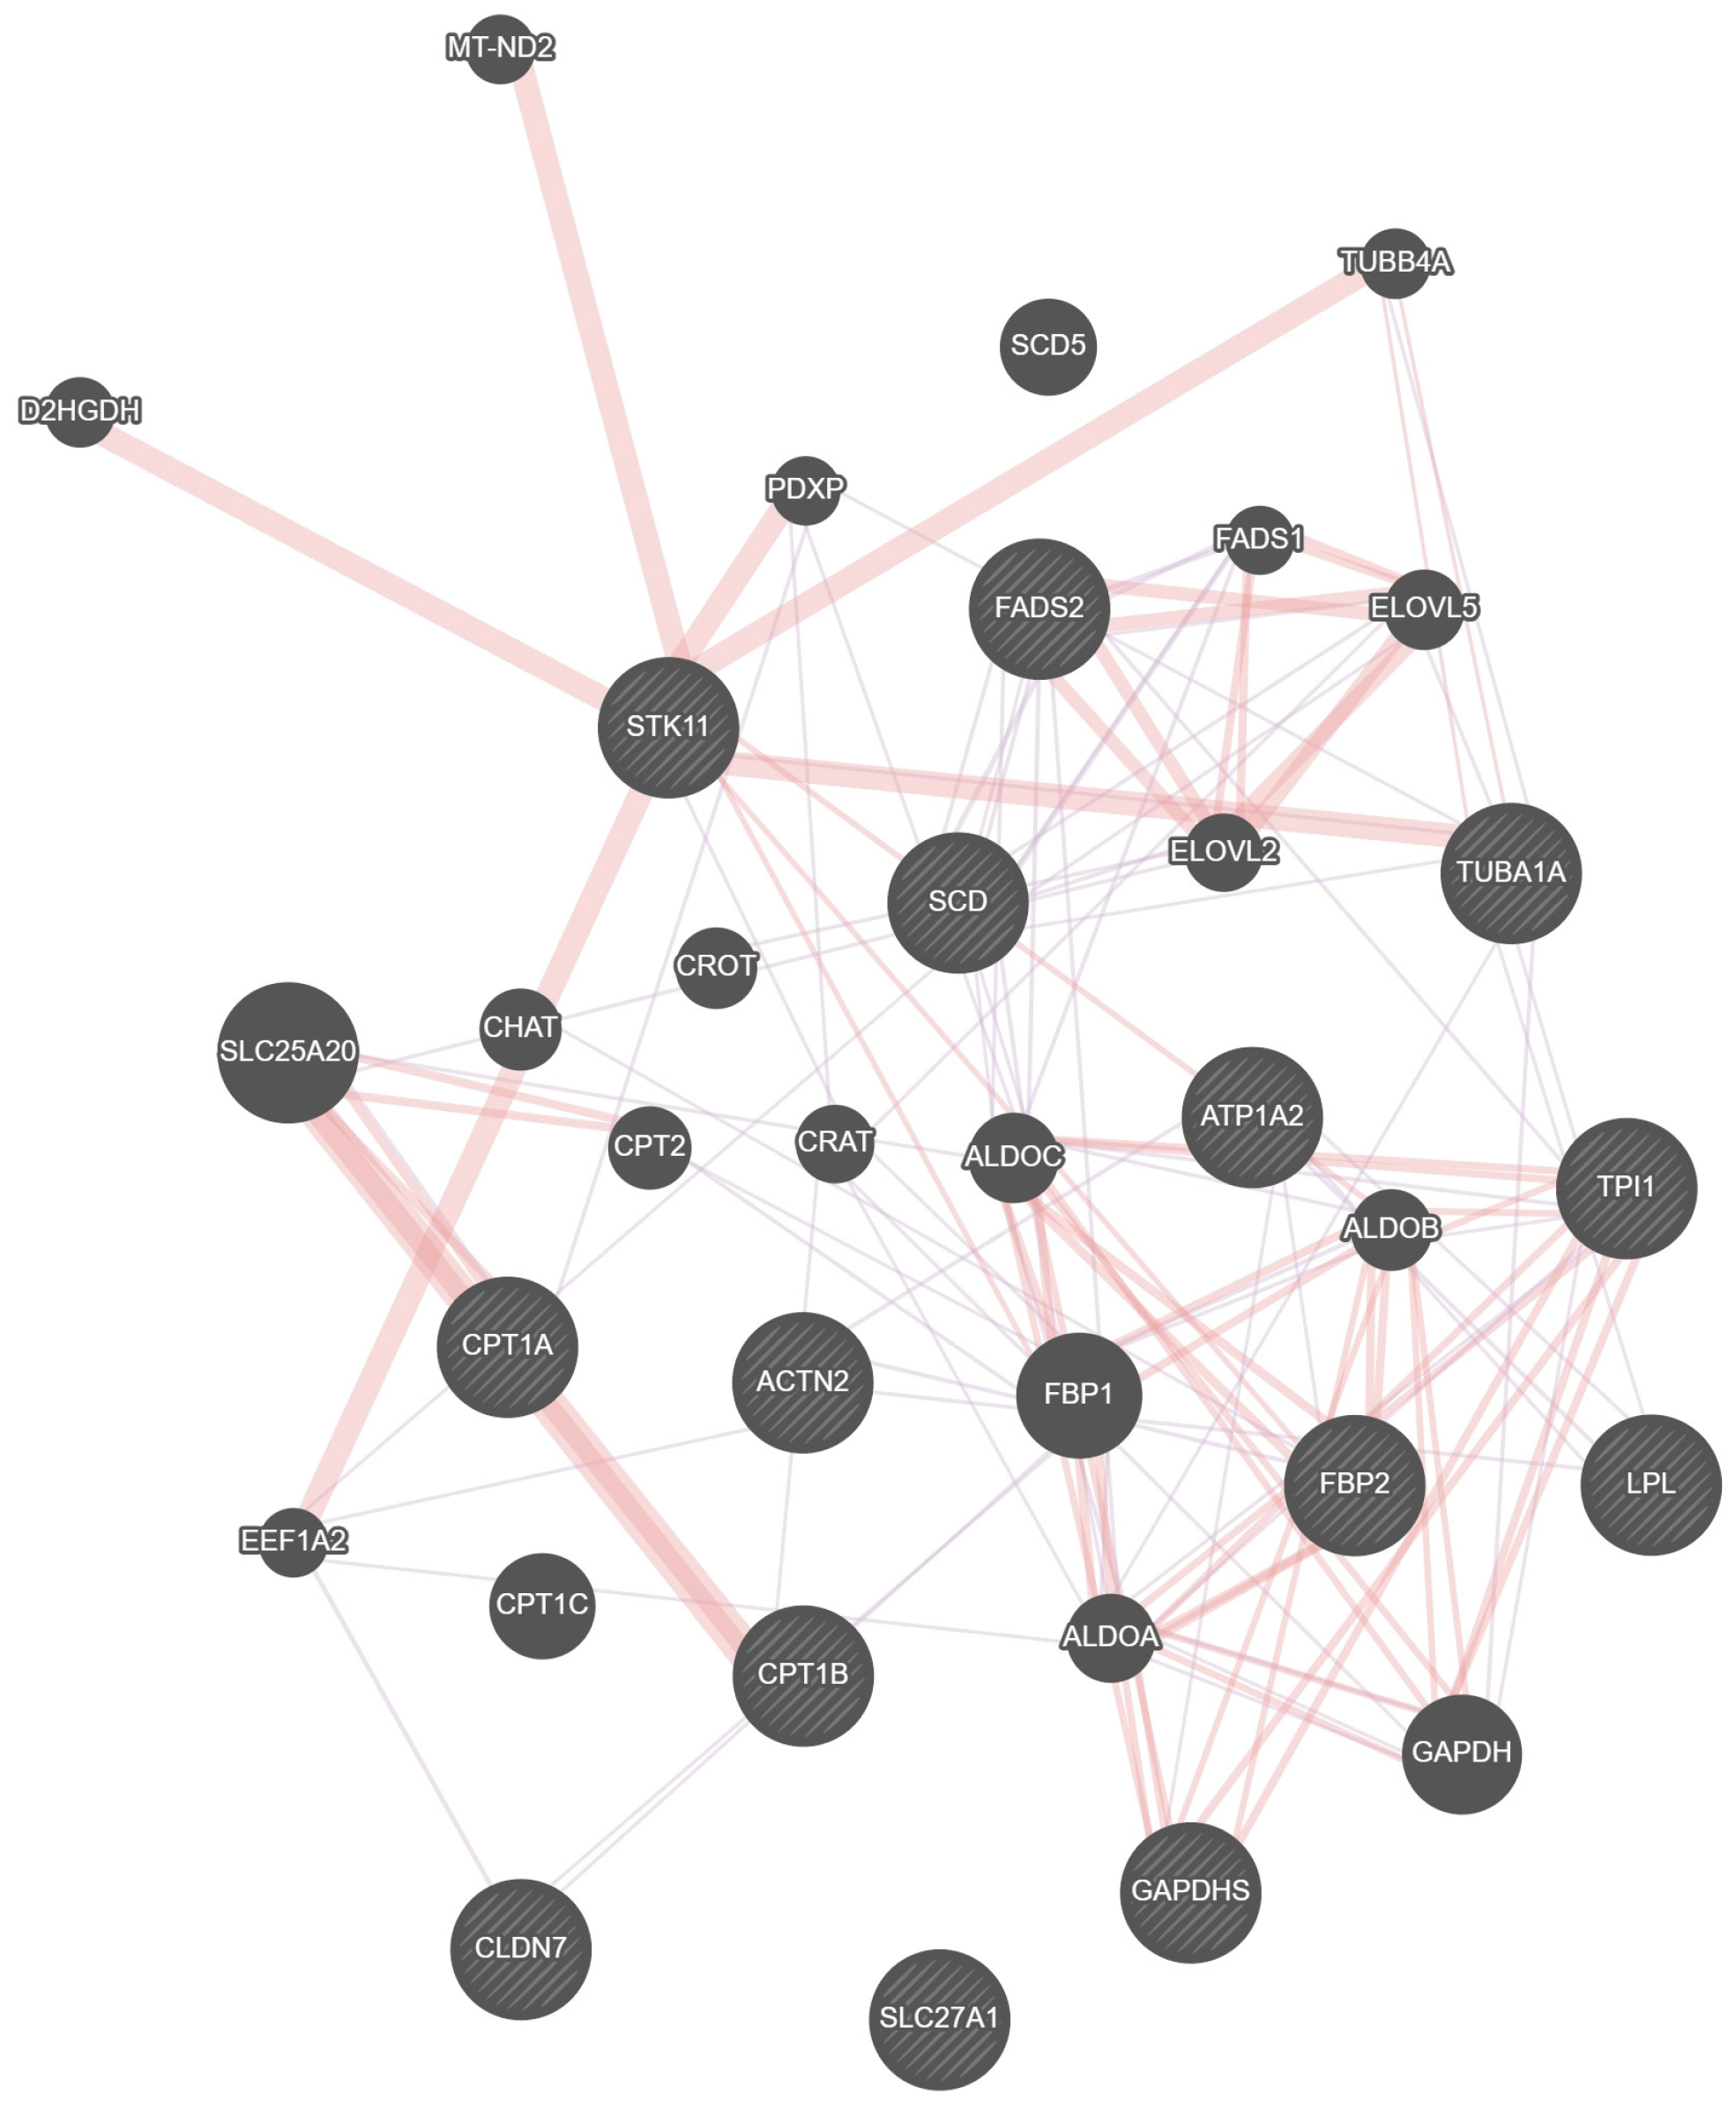
Through KEGG pathway enrichment analysis, six key pathways and associated candidate genes were identified. These genes may play important roles in bighead carp orbital fat growth and development and fat regulation (Figure 3; Table 2). We analyzed important DEGs in key pathways that showed a high frequency of involvement (Figure 4) and used Gene MANIA to construct correlation networks out of these 15 key DEGs (Figure 5). Up-regulated DEGs were primarily enriched in pathways such as Cardiac muscle contraction and Adrenergic signaling in cardiomyocytes. The pathways Fatty acid metabolism, Tight junction, PPAR signaling pathway, and Glycolysis/Gluconeogenesis contained both up- and down-regulated DEGs. Among the DEGs enriched in key pathways, 23 genes exhibited higher expression at M6 (i.e., ryanodine receptor 3 (ryr3), ATPase Na+/K+ transporting subunit alpha 2 (atp1a2), actin alpha cardiac muscle 1 (actc1), tropomyosin 2 (tpm2), hydroxy acyl-CoA dehydrogenase (hadh), carnitine palmitoyl transferase 1B (cpt1b), acyl-CoA synthetase long chain family member 1 (acsl1) and fructose-bisphosphates 2 (fbp2), among others). Conversely, 18 genes were down-regulated in the M6 group, such as fatty acid desaturase 2 (fads2), tubulin alpha 1a (tuba1a), apolipoprotein A1 (apoa1), fructose-bisphosphates 1 (fbp1), hexokinase 2 (hk2), enolase 1 (eno1), and triosephosphate isomerase 1 (tpi1) are among the genes associated with lipid anabolism.

3.4. Validation of RNA-Seq Results by qPCR

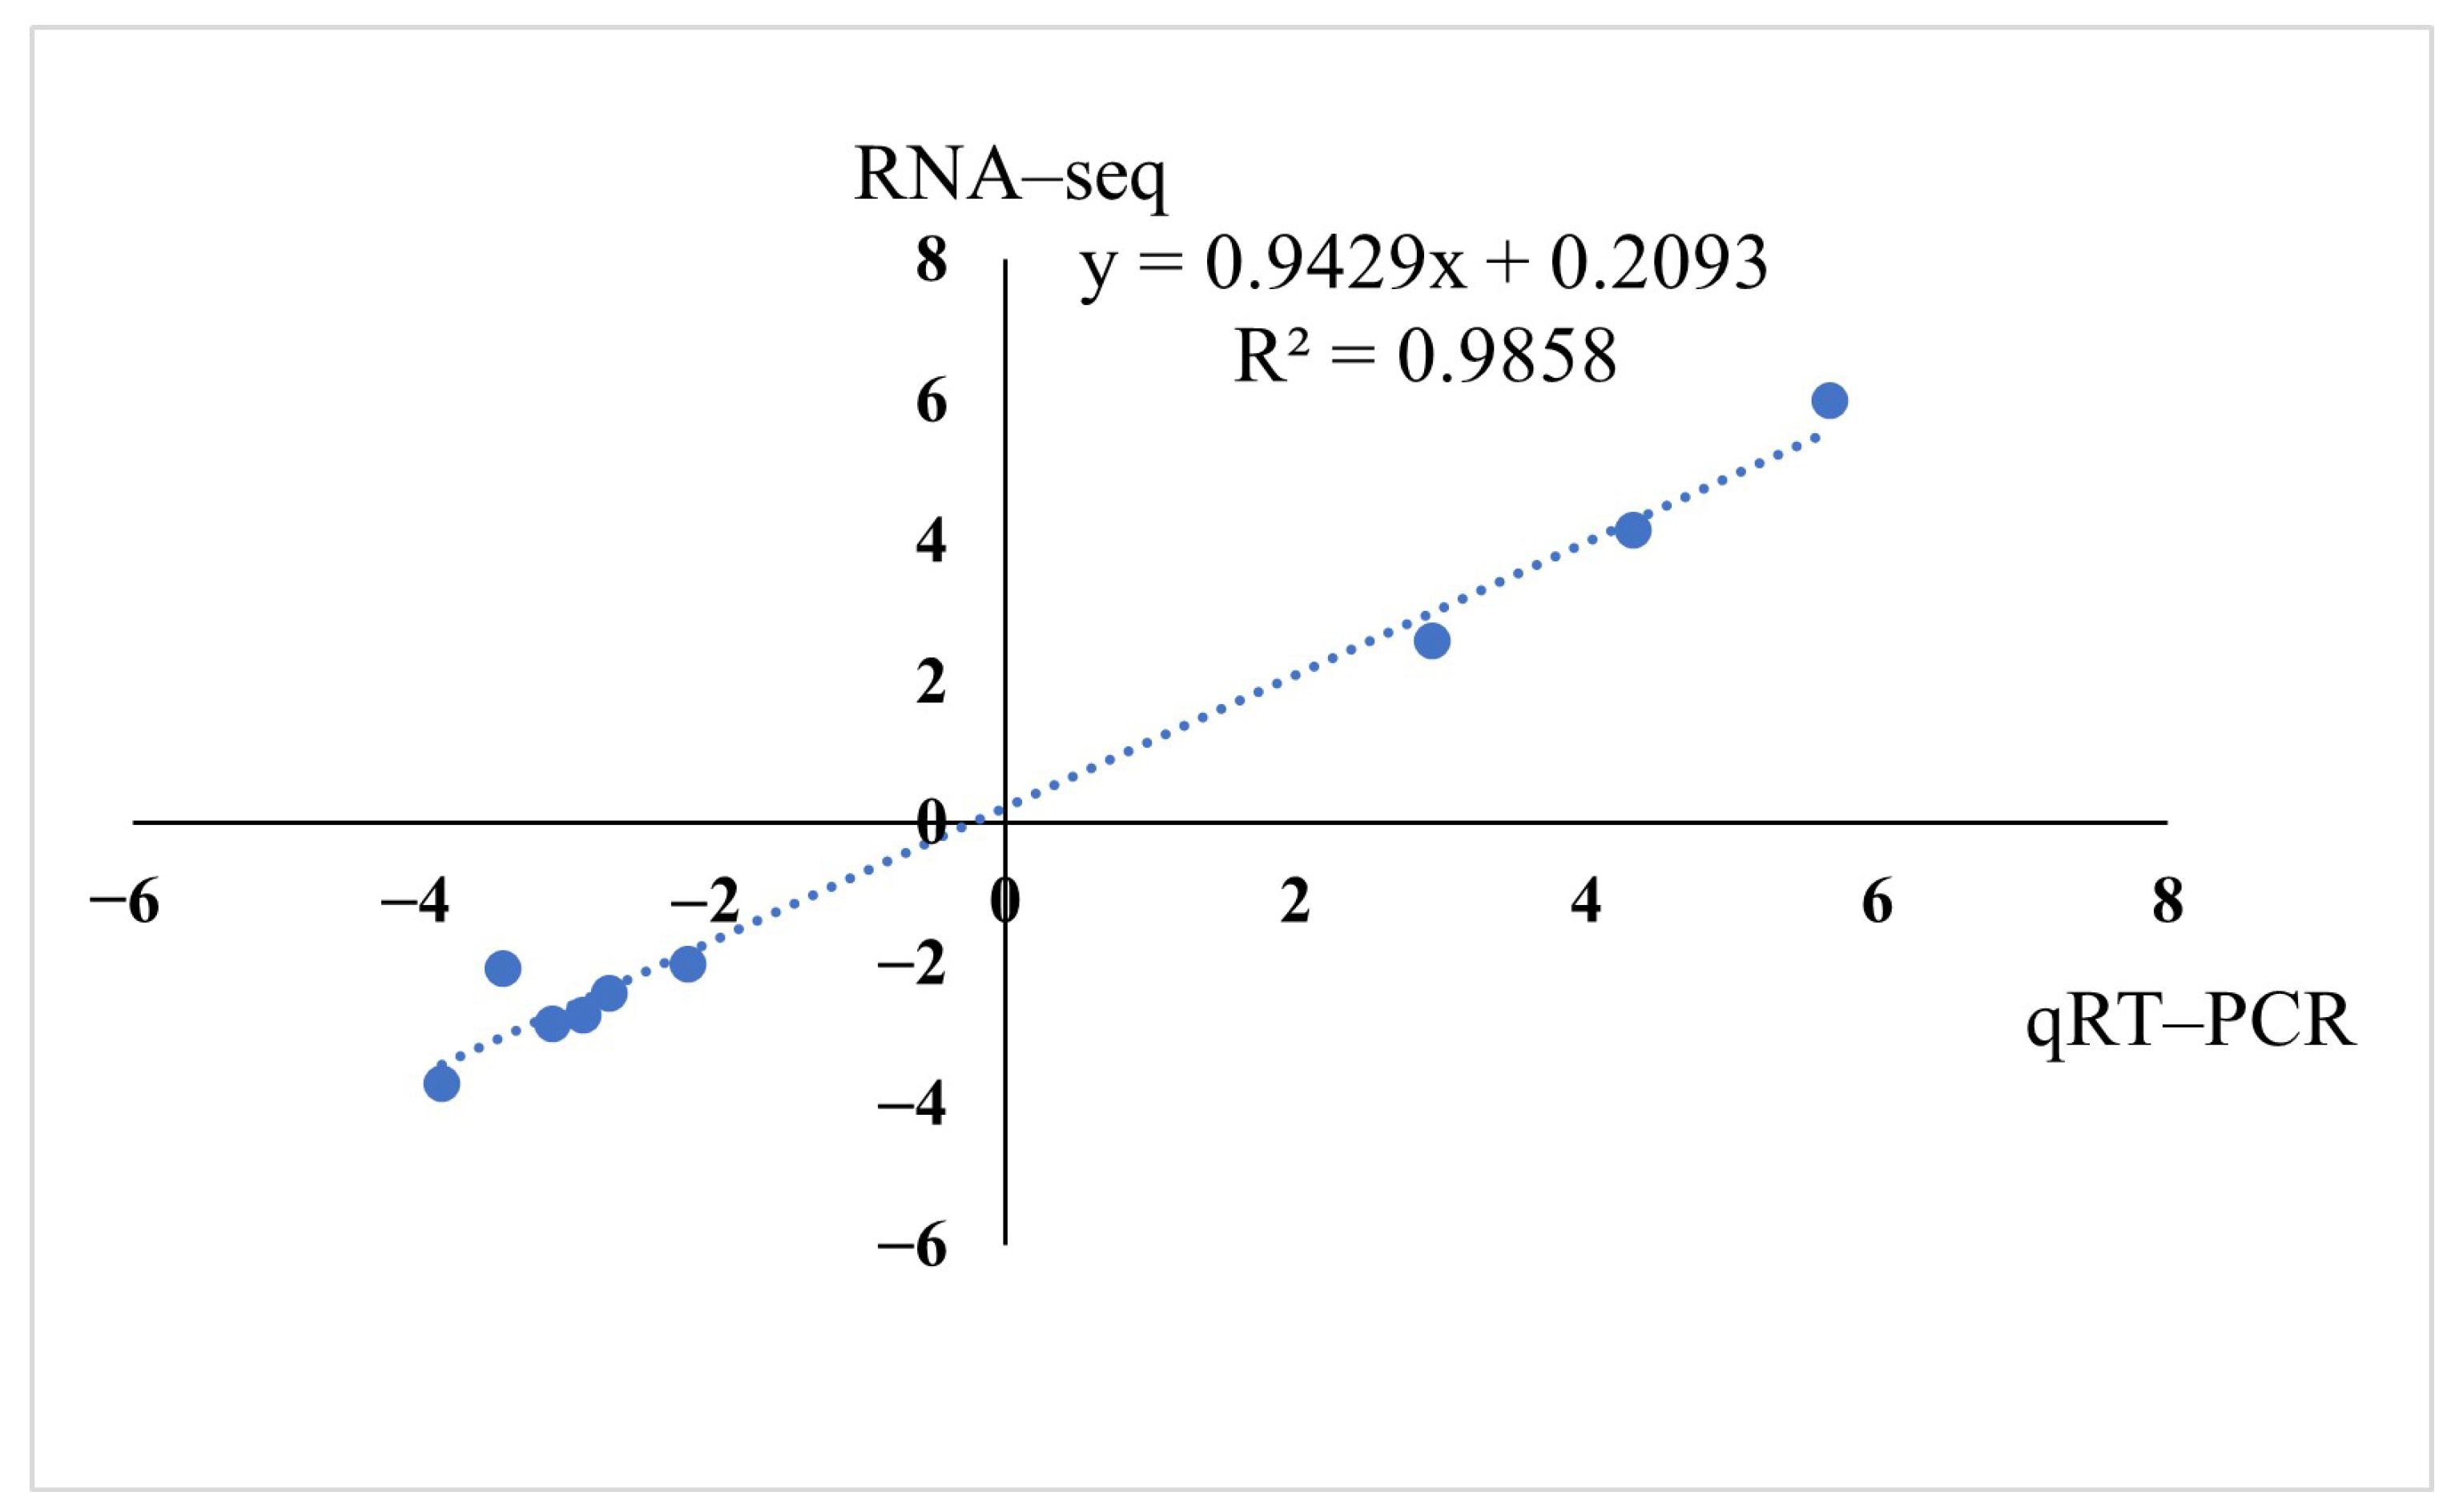
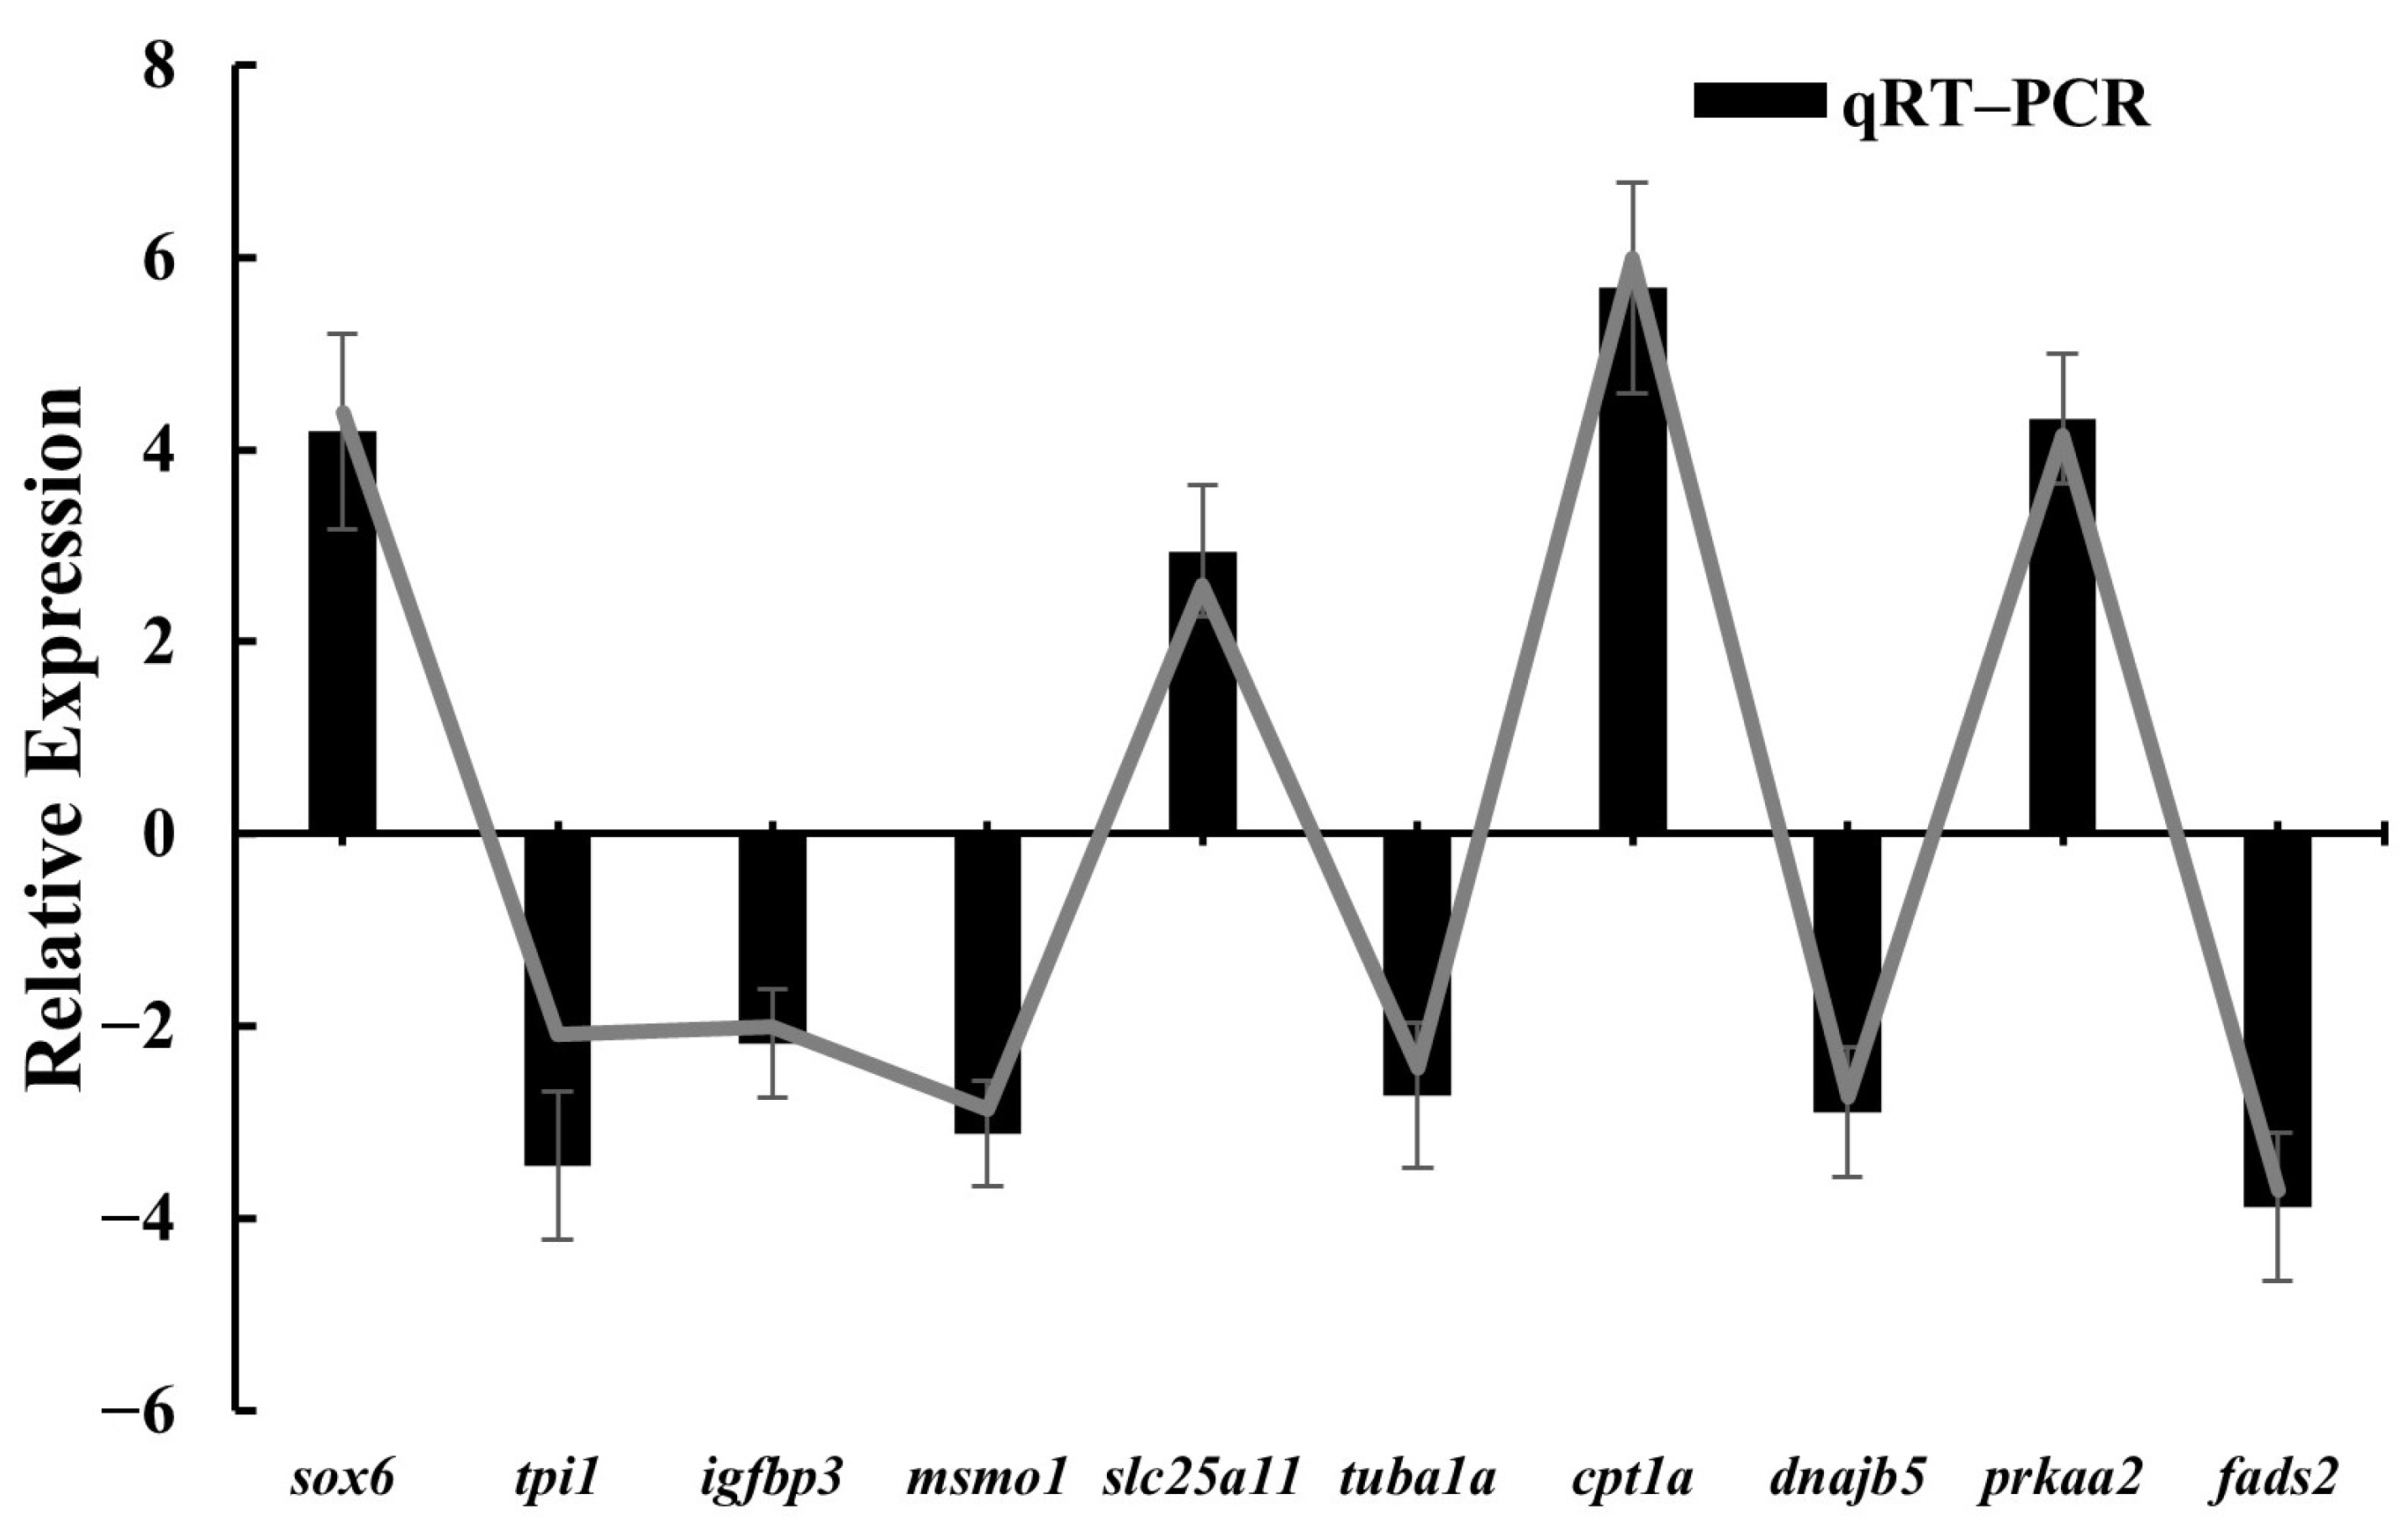
To verify the accuracy of the RNA-seq data, we randomly selected 10 DEGs for qRT-PC. These randomly selected DEGs included: tpi1, insulin like growth factor binding protein 3 (igfbp3), methylsterol monooxygenase 1 (msmo1), solute carrier family 25 member 11 (slc25a11), tuba1a, carnitine palmitoyltransferase 1A (cpt1a), dnajb5, protein kinase AMP-activated catalytic subunit alpha 2; prkaa2), SRY-box transcription factor 6 (SRY-box transcription factor 6; sox6), and fads2. The expression patterns of these 10 DEGs, as determined by qRT-PCR, were consistent with the RNA-seq data (Figure 6). A strong correlation was observed between the two methods (R2 = 0.9858, slope = 0.9429; Figure A1), further confirming the high accuracy and reliability of our transcriptome analysis.

4. Discussion

Adipose tissue, liver, and skeletal muscle are pivotal organs intimately involved in whole-body lipid metabolism [19,20]. Specifically, adipose tissue functions not only as a metabolic and endocrine organ that mediates de novo fatty acid synthesis and lipid storage but also plays an essential role in the systemic regulation of lipid metabolism [21]. As a highly dynamic tissue, it secretes adipokines that contribute to metabolic homeostasis and influences developmental processes. With growing consumer emphasis on food quality, enhancing meat attributes—including texture, flavor, and nutritional profile—has become a critical objective across livestock, poultry, and aquaculture industries [16]. In the present study, we employed high-throughput transcriptomics to elucidate the molecular mechanisms underlying age-dependent alterations in orbital adipose tissue development in bighead carp (Hypophthalmichthys nobilis) in vivo. We demonstrate that changes in orbital fat deposition during growth are closely associated with stage-specific regulation of gene expression, providing novel insights into the molecular basis of lipid accumulation in this economically valuable tissue.
In the present study, we obtained some pathways related to lipid anabolism and up-regulated genes in M6 group. Carnitine palmitoyl transferase 1 (cpt1) inhibition improves skeletal muscle glucose tolerance and insulin sensitivity. cpt1b-/- mice have hearts that are four times larger than controls [22]. The identification of the differentially expressed gene cpt1b in the liver transcriptomic analysis of blunt-snout bream (Megalobrama amblycephala) individuals, which showed high expression in fast-growing individuals, suggests its potential role in promoting growth by regulating lipid absorption and utilization [23]. High expression of cpt1b is positively correlated with growth rate, suggesting that it promotes fish growth through lipid metabolism regulation. Fatty acid transporter protein 1 (fatp1), also known as slc27a1, is an integral membrane protein that facilitates the influx of long-chain fatty acids and is involved in the genetic network of oleic acid synthesis in beef [24]. Down-regulation of the genes related to lipolytic metabolism in the PPAR signaling pathway, slc27a1, lpl, abca1, and cpt1a, has been associated with higher IMF (Intramuscular Fat) in the Wenchang chicken content. The low expression of slc27a1 enhances chicken intramuscular fat deposition by down-regulating cpt1a-mediated fatty acid oxidation [25]. Furthermore, slc27a1 was differentially expressed in muscle transcriptome analyses of Sinocyclocheilus grahami individuals exhibiting growth differences, which is associated with variations in the efficiency of fatty acid utilization among individuals [26]. In this study, cpt1b, cpt1a and slc27a1 genes were all expressed higher in M6 than M18 (Figure 4). It can be hypothesized that the high expression of cpt1a, cpt1b and slc27a1 at M6 may reflect higher fatty acid oxidative capacity or translocation requirements (to support energy demands during the rapid growth period), whereas the down-regulation of these genes at M18 is accompanied by the up-regulation of synthetic genes (e.g., scd, fads2), which are more favorable for fat deposition.
The high expression of stk11, atp1a2, actn2, and fbp2 in the M6 group suggests a potential role in suppressing cell proliferation within the orbital adipose tissue. Specifically, stk11 encodes a serine/threonine kinase involved in cellular polarity and tumor suppression [27], while atp1a2 has been shown to inhibit tumor growth in vivo [28]. Similarly, overexpression of an ACTN2 fragment suppresses tumor cell motility and proliferation [29]. prkaa2 encodes a subunit of AMP-activated protein kinase (AMPK), which plays a critical role in various energy metabolism processes. This kinase is implicated in fatty acid biosynthesis pathways and participates in the regulation of energy homeostasis.
High expression of stk11, atp1a2, actn2, and fbp2 in the M6 group may inhibit cell proliferation in the adipose tissue of the eye socket, and these genes may be candidate genes associated with bighead head development. In a mice study, it has been demonstrated that lipocalin serves as an important adipose-specific protein, and Ryr3 plays a significant role in the regulation of lipocalin expression. Ryr3 was found to be expressed in 3T3-L1 preadipocytes, and its expression decreased during adipogenesis [30]. The roles of prkaa2 in energy metabolism have been established in studies on lipid metabolism in the liver of grass carp [31] and in investigations of growth rate variations in Sinocyclocheilus grahami [26]. prkaa2 and ryr3 expression were lower in the 18-month-old group than in the 6-month-old group, which may be related to the formation of adipose during development. Expansion of adipose tissue (hypertrophy and hyperplasia) is clearly correlated with cell growth and proliferative functions, and studies have reported that the proliferative and differentiation capacity of adipocytes in mice and rats decreases with age [32], but the age of sexual maturity for bighead carp is between 4 and 5 years, and the 6-month and 18-month individuals used for analyses in the present study were at an early stage of their life. Also in this study some genes related to muscle structure, myocyte growth and development regulation such as: tpm2 and myl3 genes can regulate muscle growth and muscle fiber differences, while acat1 gene is related to the regulation of lipid deposition capacity and is considered as a candidate gene related to pork quality traits [33]. Ppp2r3a is a major serine/threonine phosphatase with key functions in regulating development and growth [34]. These genes may also be potential candidates for the regulation of bighead carp head traits. Skeletal muscle metabolism and fiber type are related to intramuscular lipid content, and changes in skeletal muscle gene expression affect the development of adipose tissue [35].
We identified 18 genes in the fatty acid metabolism, tight junction, glycolysis/glycolysis and PPAR signaling pathways that were down-regulated in expression in the 6-month-old group. Fatty acid desaturase (FADS2) is a key enzyme in the biosynthesis of polyunsaturated fatty acids (PUFAs), which are the fundamental structural determinants of mammalian membrane lipid bilayers [36]. The gene is involved in fatty acid metabolic processes, arachidonic acid metabolism, RAS, PPAR and VEGF pathways. fads2 has been positively correlated at the single-cell level with biological behaviors such as tumor inflammation, cell cycle, proliferation, DNA damage, and DNA repair response [37]. The ability of fish to biosynthesis long-chain (≥C-20) polyunsaturated fatty acids varies from species to species, and in teleost fish is largely dependent on the presence of functionally diverse FADS2 enzymes, as many teleosts have lost the gene encoding the Delta 5 desaturase (fads1). Nutritional levels may not directly drive diversification of fads2 in teleost fishes as initially hypothesized, while other factors such as species phylogeny appear to be more influential [38]. Stearoyl coenzyme a desaturase (scd) is less expressed in 6-month-olds than in 18-month-olds, and this gene is a key enzyme in the conversion of saturated fatty acids (SFAs) to monounsaturated fatty acids (MUFAs) during lipid biosynthesis [39].
Lipoprotein lipase (LPL) shows differential expression at different stages of the early development of adipose tissue in grass carp [40]. Meanwhile, studies have shown that genes related to adipogenesis may regulate the continuous development of adipose tissue. Existing studies have revealed that the development of white adipose tissue (WAT) in zebrafish is dually regulated by both developmental stage and body size [41]. Adipocytes play a crucial role in metabolism and energy balance. Thus, unlike other organs formed during specific developmental periods, adipogenesis is likely triggered in response to metabolic demands at different growth stages. This may explain the differential expression of lipid-related genes in the orbital fat tissue of bighead carp observed between the two developmental stages in this study. More energy is likely to be focused on the growth of the fish’s skeleton and muscle during the juvenile period at 6 months of age, when growth rates are faster. 18 months of age is the appropriate market size for bighead carp, and the synthesis of PUFAs in the fat of the eye sockets is higher during this period, which is beneficial to the consumer.
In all organisms, carbon fluxes through the fundamental pathways of glycolysis, gluconeogenesis and pyruvate hubs are central processes associated with growth and productivity. Down-regulation of glycolytic enzyme-enolase (eno1) expression not only significantly reduces cell proliferation, but also significantly inhibits cell migration, invasion and vivo tumorigenesis [42]. Triosephosphate isomerase 1 (tpi1), a key glycolytic enzyme, was identified as a central factor in the glycolytic pathway through an integrated transcriptomics and metabolomics study on feed efficiency in large yellow croaker [43].
Pyruvate kinase L/R (pyruvate kinase L/R; pklr) gene is differentially expressed in cows at different lactations and is involved in lipid metabolism through insulin, PI3K-Akt, MAPK, AMPK, mTOR, and PPAR signaling pathways [44]. Overexpression of graphs promotes glycolysis, cell growth and proliferation [45]. In this study, we used transcriptome sequencing to compare the major differentially expressed genes in bighead carp orbital fat during different developmental periods, and these energy metabolism-related pathways and genes may also be potential candidate genes for regulating bighead carp growth and development.

5. Conclusions

The results showed that several pathways and genes related to cell growth, proliferation and lipid metabolism, including fatty acid metabolism and the PPAR signaling pathway, play important roles in the development of bighead carp eye socket adipose tissues. cpt1a, slc27a1, fbp2, ryr3, fads2, scd and tpi1 may be the key genes involved in bighead carp fat synthesis and metabolism. Future functional validation studies, such as gene editing, are warranted to confirm the roles of these potential candidate genes. Validated genes could serve as valuable markers for selective breeding programs for growth and meat quality traits in bighead carp future breeding studies.

Author Contributions

Conceptualization, J.W. and Q.L.; methodology, J.W.; software, J.W.; validation, J.L. and Z.S.; formal analysis, X.Y.; investigation, J.W.; resources, J.W. and J.T.; data curation, J.W.; writing—original draft preparation, J.W. and Q.L.; writing—review and editing, X.G. and J.T.; visualization, J.W. and X.Y.; supervision, J.L., X.G. and J.T.; project administration, X.G. and J.T. All authors have read and agreed to the published version of the manuscript.

Funding

This research was funded by the National Natural Science Foundation of China (32072973), Youth Fund Project of Xinyang Agriculture and Forestry University (No. 911006), Doctoral Research Start-up Grant of Xinyang Agriculture and Forestry University (203130), Scientific and Technological Project of Henan Province (252102110075), Natural Science Foundation of Henan (252300420726).

Institutional Review Board Statement

The animal study protocol was approved by the Academic Committee on Scientific Ethics of Xinyang Agricultural and Forestry University (protocol code XYAFU-AE-2019019 and date of approval 30 May 2019).

Informed Consent Statement

Not applicable.

Data Availability Statement

All sequencing data were uploaded to the Sequence Reading Archive (SRA) of the Nation-al Center for Biotechnology Information (NCBI; accession number: PRJNA1284284).

Conflicts of Interest

The authors declare no conflicts of interest.

Appendix A

Table A1. The periocular fat transcriptome data quality control results.
Sample IDRaw DatabaseClean DatabaseQ20 (%)Q30 (%)GC (%)
M6-16,871,532,8106,846,104,58796.8791.9146.97
M6-27,485,026,3927,468,839,79896.8091.7347.73
M6-37,616,530,5787,563,379,41096.7991.7946.35
M18-16,431,992,2606,382,998,82496.5391.1945.37
M18-26,100,950,9986,090,612,18897.0392.3148.38
M18-35,914,123,7105,903,172,09996.8391.7946.60
Figure A1. The Linear regression analysis between RNA-seq and qRT-PCR.
Animals 15 02602 g0a1
Figure A2. GO enrichment analysis of bighead carp orbital fat transcriptome. (A): Biological Process; (B): Cellular Component; (C) (Molecular Function). Gene ratio (x-axis) reflecting DEG proportion and color indicating p-adjust significance.
Animals 15 02602 g0a2

References

  1. Tao, X.; Liang, Y.; Yang, X.M.; Pang, J.; Zhong, Z.; Chen, X.; Yang, Y.; Zeng, K.; Kang, R.; Lei, Y.; et al. Transcriptomic profiling in muscle and adipose tissue identifies genes related to growth and lipid deposition. PLoS ONE 2017, 12, e0184120. [Google Scholar] [CrossRef]
  2. Rule, D.C.; Thornton, J.H.; McGilliard, A.D.; Beitz, D.C. Effect of adipose-tissue site, animal size, and fasting on lipolysis in bovine adipose-tissue invitro. Int. J. Biochem. 1992, 24, 789–793. [Google Scholar] [CrossRef]
  3. Tian, J.J.; Lei, C.X.; Ji, H.; Zhou, J.S.; Xie, J. Dietary arachidonic acid decreases the expression of transcripts related to adipocyte development and chronic inflammation in the adipose tissue of juvenile grass carp, Ctenopharyngodon idella. Comp. Biochem. Physiol. Part D Genom. Proteom. 2019, 30, 122–132. [Google Scholar] [CrossRef] [PubMed]
  4. Salmeron, C. Adipogenesis in fish. J. Exp. Biol. 2018, 221 (Suppl. S1), jeb161588. [Google Scholar] [CrossRef]
  5. Svetlana, M.; Zinaida, N.; Svetlana, P.; Alexey, V.; Denis, E.; Nina, N. Age-specific lipid and fatty acid profiles of atlantic salmon juveniles in the varzuga river. Int. J. Mol. Sci. 2016, 17, 1050. [Google Scholar] [CrossRef] [PubMed]
  6. Howe, P.R.; Downing, J.A.; Grenyer, B.F.; Grigonis-Deane, E.M.; Bryden, W.L. Tuna fishmeal as a source of DHA for n-3 PUFA enrichment of pork, chicken, and eggs. Lipids 2002, 37, 1067–1076. [Google Scholar] [CrossRef] [PubMed]
  7. Tacon, A.G.J.; Metian, M. Global overview on the use of fish meal and fish oil in industrially compounded aquafeeds: Trends and future prospects. Aquaculture 2008, 285, 146–158. [Google Scholar] [CrossRef]
  8. Xu, H.G.; Dong, X.J.; Ai, Q.H.; Mai, K.S.; Xu, W.; Zhang, Y.J.; Zuo, R.T. Regulation of tissue LC-PUFA contents, Δ6 fatty acyl desaturase (FADS2) gene expression and the methylation of the putative FADS2 gene promoter by different dietary fatty acid profiles in Japanese seabass (Lateolabrax japonicus). PLoS ONE 2014, 9, e87726. [Google Scholar] [CrossRef]
  9. Betancor, M.B.; Almaida-Pagán, P.F.; Hernández, A.; Tocher, D.R. Effects of dietary fatty acids on mitochondrial phospholipid compositions, oxidative status and mitochondrial gene expression of zebrafish at different ages. Fish Physiol. Biochem. 2015, 41, 1187–1204. [Google Scholar] [CrossRef]
  10. Sahena, F.; Zaidul, I.S.M.; Jinap, S.; Saari, N.; Jahurul, H.A.; Abbas, K.A. Pufas in fish: Extraction, fractionation, importance in health. Compr. Rev. Food Sci. Food Saf. 2010, 8, 59–74. [Google Scholar] [CrossRef]
  11. Zhao, R.X. Current status of research on docosahexaenoic acid (DHA) mechanism in Japan. Mod. Fish. Inf. 1991, 8, 12–14. [Google Scholar]
  12. Sawada, T.; Takahashi, K.; Hatano, M. Molecular-species analysis of fish oil triglyceride by light-scattering mass detector equipped liquid-chromatography.2. triglyceride composition of tuna and bonito orbital fats. Nippon. Suisan Gakkaishi 1993, 59, 285–290. [Google Scholar] [CrossRef]
  13. Qian, X.; Ba, Y.; Zhuang, Q.F.; Zhong, G.F. RNA-Seq technology and its application in fish transcriptomics. Omics J. Integr. Biol. 2014, 18, 98–110. [Google Scholar] [CrossRef] [PubMed]
  14. Ahi, E.P.; Verta, J.P.; Kurko, J.; Ruokolainen, A.; Singh, P.; Debes, P.V.; Primmer, C.R. Gene co-expression patterns in Atlantic salmon adipose tissue provide a molecular link among seasonal changes, energy balance and age at maturity. Mol. Ecol. 2024, 34, e17313. [Google Scholar] [CrossRef]
  15. Abasubong, K.P.; Adjoumani, J.J.Y.; Li, X.F.; Liu, W.B.; Jiang, G.Z. Dietary supplementation of glycyrrhetinic acid benefit growth performance and lipid metabolism in blunt snout bream (Megalobrama amblycephala) juveniles. Aquac. Nutr. 2021, 27, 407–416. [Google Scholar] [CrossRef]
  16. Tan, P.; Wabike, E.E.; Qin, G.; Lou, B.; Xu, D.; Chen, R.; Wang, L. Effects of dietary n-3 long-chain polyunsaturated fatty acids (n-3 LC-PUFAs) on growth performance, body composition and subcutaneous adipose tissue transcriptome analysis of juvenile yellow drum (Nibea albiflora). Aquac. Nutr. 2021, 27, 556–567. [Google Scholar] [CrossRef]
  17. Kohno, H.; Yamaguchi, N.; Ohdoi, C.; Nakajima, S.; Odashima, S.; Tanaka, T. Modifying effect of tuna orbital oil rich in docosahexaenoic acid and vitamin D-3 on azoxymethane-induced colonic aberrant crypt foci in rats. Oncol. Rep. 2000, 7, 1069–1074. [Google Scholar] [CrossRef]
  18. Zhang, M.; Xu, P.; Pang, H.; Chen, T.; Zhang, G. Expression analysis of mRNA decay of maternal genes during bombyx mori maternal-to-zygotic transition. Int. J. Mol. Sci. 2019, 20, 5651. [Google Scholar] [CrossRef]
  19. Ramayo-Caldas, Y.; Mach, N.; Esteve-Codina, A.; Corominas, J.; Castelló, A.; Ballester, M.; Estellé, J.; Ibáñez-Escriche, N.; Fernández, A.I.; Pérez-Enciso, M.; et al. Liver transcriptome profile in pigs with extreme phenotypes of intramuscular fatty acid composition. BMC Genom. 2012, 13, 547. [Google Scholar] [CrossRef]
  20. Xing, K.; Zhu, F.; Zhai, L.; Liu, H.; Wang, Y.; Wang, Z.; Chen, S.; Hou, Z.; Wang, C. Integration of transcriptome and whole genomic resequencing data to identify key genes affecting swine fat deposition. PLoS ONE 2015, 10, e0122396. [Google Scholar] [CrossRef]
  21. Ohea, E.K.; Leveille, G.A. Significance of adipose tissue and liver as sites of fatty acid synthesis in pig and efficiency of utilization of various substrates for lipogenesis. J. Nutr. 1969, 99, 338–344. [Google Scholar] [CrossRef] [PubMed]
  22. Haynie, K.R.; Vandanmagsar, B.; Wicks, S.E.; Zhang, J.; Mynatt, R.L. Inhibition of carnitine palymitoyltransferase1b induces cardiac hypertrophy and mortality in mice. Diabetes Obes. Metab. 2014, 16, 757–760. [Google Scholar] [CrossRef] [PubMed]
  23. Liu, Q.; Zou, X.; Zhao, M.; Guan, Q.Q.; Xuan, Z.Y.; Liu, L.S.; Gao, Z.X. Integrated transcriptome and metabolome analysis of liver reveals unsynchronized growth mechanisms in blunt-snout bream (Megalobrama amblycephala). BMC Genom. 2025, 26, 30. [Google Scholar] [CrossRef]
  24. Zhao, Z.; Tian, H.; Shi, B.; Jiang, Y.; Liu, X.; Hu, J. Transcriptional Regulation of the Bovine Fatty Acid Transport Protein 1 Gene by Kruppel-Like Factors 15. Animals 2019, 9, 654. [Google Scholar] [CrossRef] [PubMed]
  25. Qiu, F.; Xie, L.; Ma, J.E.W.; Zhang, L.; Chao, Z.; Chen, S.; Nie, Q.; Lin, Z.; Zhang, X. Lower expression of slc27a1 enhances intramuscular fat deposition in chicken via down-regulated fatty acid oxidation mediated by cpt1a. Front. Physiol. 2017, 8, 449. [Google Scholar] [CrossRef]
  26. Yin, Y.; Zhang, Y.; Hua, Z.; Wu, A.; Pan, X.; Yang, J.; Wang, X. Muscle transcriptome analysis provides new insights into the growth gap between fast-and slow-growing Sinocyclocheilus grahami. Front. Genet. 2023, 14, 1217952. [Google Scholar] [CrossRef]
  27. Bange, E.; Marmarelis, M.E.; Hwang, W.T.; Yang, Y.X.; Thompson, J.C.; Rosenbaum, J.; Bauml, J.M.; Ciunci, C.; Alley, E.W.; Cohen, R.B.; et al. Impact of kras and tp53 co-mutations on outcomes after first-line systemic therapy among patients with stk11-mutated advanced non-small-cell lung cancer. JCO Precis. Oncol. 2019, 3, 1–11. [Google Scholar] [CrossRef]
  28. Zhong, L.; Zhang, H.; Wu, L.; Ru, H.; Wei, N.; Yao, F.; Li, Y. Copper and zinc treatments alter the thyroid endocrine system in zebrafish embryos/larvae. Toxics 2022, 10, 756. [Google Scholar] [CrossRef]
  29. Li, H.; Wang, J.; Xu, H.; Xing, R.; Pan, Y.; Li, W.; Cui, J.; Zhang, H.; Lu, Y. Decreased fructose-1,6-bisphosphatase-2 expression promotes glycolysis and growth in gastric cancer cells. Mol. Cancer 2013, 12, 110. [Google Scholar] [CrossRef]
  30. Tsai, S.H.; Chang, E.Y.C.; Chang, Y.C.; Hee, S.W.; Tsai, Y.C.; Chang, T.J.; Chuang, L.M. Knockdown of RyR3 Enhances Adiponectin Expression Through an atf3-Dependent Pathway. Endocrinology 2013, 154, 1117–1129. [Google Scholar] [CrossRef]
  31. Ji, S.; Sun, J.; Bian, C.; Huang, X.; Chang, Z.; Yang, M.; Lu, R.-H.; Ji, H. cAMP-dependent protein kinase A in grass carp Ctenopharyngodon idella: Molecular characterization, gene structure, tissue distribution and mRNA expression in endoplasmic reticulum stress-induced adipocyte lipolysis. Comp. Biochem. Physiol. Part B Biochem. Mol. Biol. 2020, 250, 110479. [Google Scholar] [CrossRef]
  32. Sepe, A.; Tchkonia, T.; Thomou, T.; Zamboni, M.; Kirkland, J.L. Aging and Regional Differences in Fat Cell Progenitors—A Mini-Review. Gerontology 2011, 57, 66–75. [Google Scholar] [CrossRef]
  33. Wang, Z.X.; Shang, P.; Li, Q.G.; Wang, L.Y.; Chamba, Y.Z.; Zhang, B.; Zhang, H.; Wu, C.X. iTRAQ-based proteomic analysis reveals key proteins affecting muscle growth and lipid deposition in pigs. Sci. Rep. 2017, 7, 46717. [Google Scholar] [CrossRef]
  34. Yang, J.; Li, Z.H.; Gan, X.D.; Gang, Z.; Gao, J.J.; Xiong, C.L.; Qiu, X.P.; Wang, X.B.; Yin, Z.; Zheng, F. Deletion of Pr130 Interrupts Cardiac Development in Zebrafish. Int. J. Mol. Sci. 2016, 17, 1746. [Google Scholar] [CrossRef] [PubMed]
  35. Roberts, S.L.; Lancaster, P.A.; DeSilva, U.; Horn, G.W.; Krehbiel, C.R. Coordinated gene expression between skeletal muscle and intramuscular adipose tissue in growing beef cattle. J. Anim. Sci. 2015, 93, 4302–4311. [Google Scholar] [CrossRef] [PubMed]
  36. Stoffel, W.; Hammels, I.; Jenke, B.; Binczek, E.; Schmidt-Soltau, I.; Brodesser, S.; Thevis, M. Obesity resistance and deregulation of lipogenesis in Delta 6-fatty acid desaturase (FADS2) deficiency. EMBO Rep. 2014, 15, 110–120. [Google Scholar] [CrossRef] [PubMed]
  37. Chen, E.; Wang, C.; Lv, H.; Yu, J. The role of fatty acid desaturase 2 in multiple tumor types revealed by bulk and single-cell transcriptomes. Lipids Health Dis. 2023, 22, 25. [Google Scholar] [CrossRef]
  38. Garrido, D.; Kabeya, N.; Betancor, M.B.; Pérez, J.A.; Acosta, N.G.; Tocher, D.R.; Rodríguez, C.; Monroig, Ó. Functional diversification of teleost Fads2 fatty acyl desaturases occurs independently of the trophic level. Sci. Rep. 2019, 9, 11199. [Google Scholar] [CrossRef]
  39. Paton, C.M.; Ntambi, J.M. Biochemical and physiological function of stearoyl-CoA desaturase. Am. J. Physiol.-Endocrinol. Metab. 2009, 297, 28–37. [Google Scholar] [CrossRef]
  40. Liu, P.; Ji, H.; Li, C.; Tian, J.; Wang, Y.; Yu, P. Ontogenetic development of adipose tissue in grass carp (Ctenopharyngodon idellus). Fish Physiol. Biochem. 2015, 41, 867–878. [Google Scholar] [CrossRef]
  41. Imrie, D.; Sadler, K.C. White adipose tissue development in zebrafish is regulated by both developmental time and fish size. Dev. Dyn. 2010, 239, 3013–3023. [Google Scholar] [CrossRef] [PubMed]
  42. Song, Y.; Luo, Q.; Long, H.; Hu, Z.; Que, T.; Zhang, X.A.; Li, Z.; Wang, G.; Yi, L.; Liu, Z.; et al. Alpha-enolase as a potential cancer prognostic marker promotes cell growth, migration, and invasion in glioma. Mol. Cancer 2014, 13, 65. [Google Scholar] [CrossRef] [PubMed]
  43. Jin, Y.H.; Wang, G.S.; Ren, P.; Zhang, L.N.; Ai, Q.H.; Sun, Y.Z.; Han, F.; Wang, Z.Y. Integrated transcriptomics and metabolomics unveil key regulators of feed efficiency in Larimichthys crocea on fishmeal-free diets. Aquac. Nutr. 2025, 2147842. [Google Scholar] [CrossRef]
  44. Du, A.; Zhao, F.; Liu, Y.; Xu, L.; Chen, K.; Sun, D.; Han, B. Genetic polymorphisms of PKLR gene and their associations with milk production traits in Chinese Holstein cows. Front. Genet. 2022, 13, 1002706. [Google Scholar] [CrossRef]
  45. Ding, X.; Wang, L.; Chen, M.; Wu, Y.; Ge, S.; Li, J.; Fan, X.; Lin, M. Sperm-specific glycolysis enzyme glyceraldehyde-3-phosphate dehydrogenase regulated by transcription factor SOX10 to promote uveal melanoma tumorigenesis. Front. Cell Dev. Biol. 2021, 9, 610683. [Google Scholar] [CrossRef]
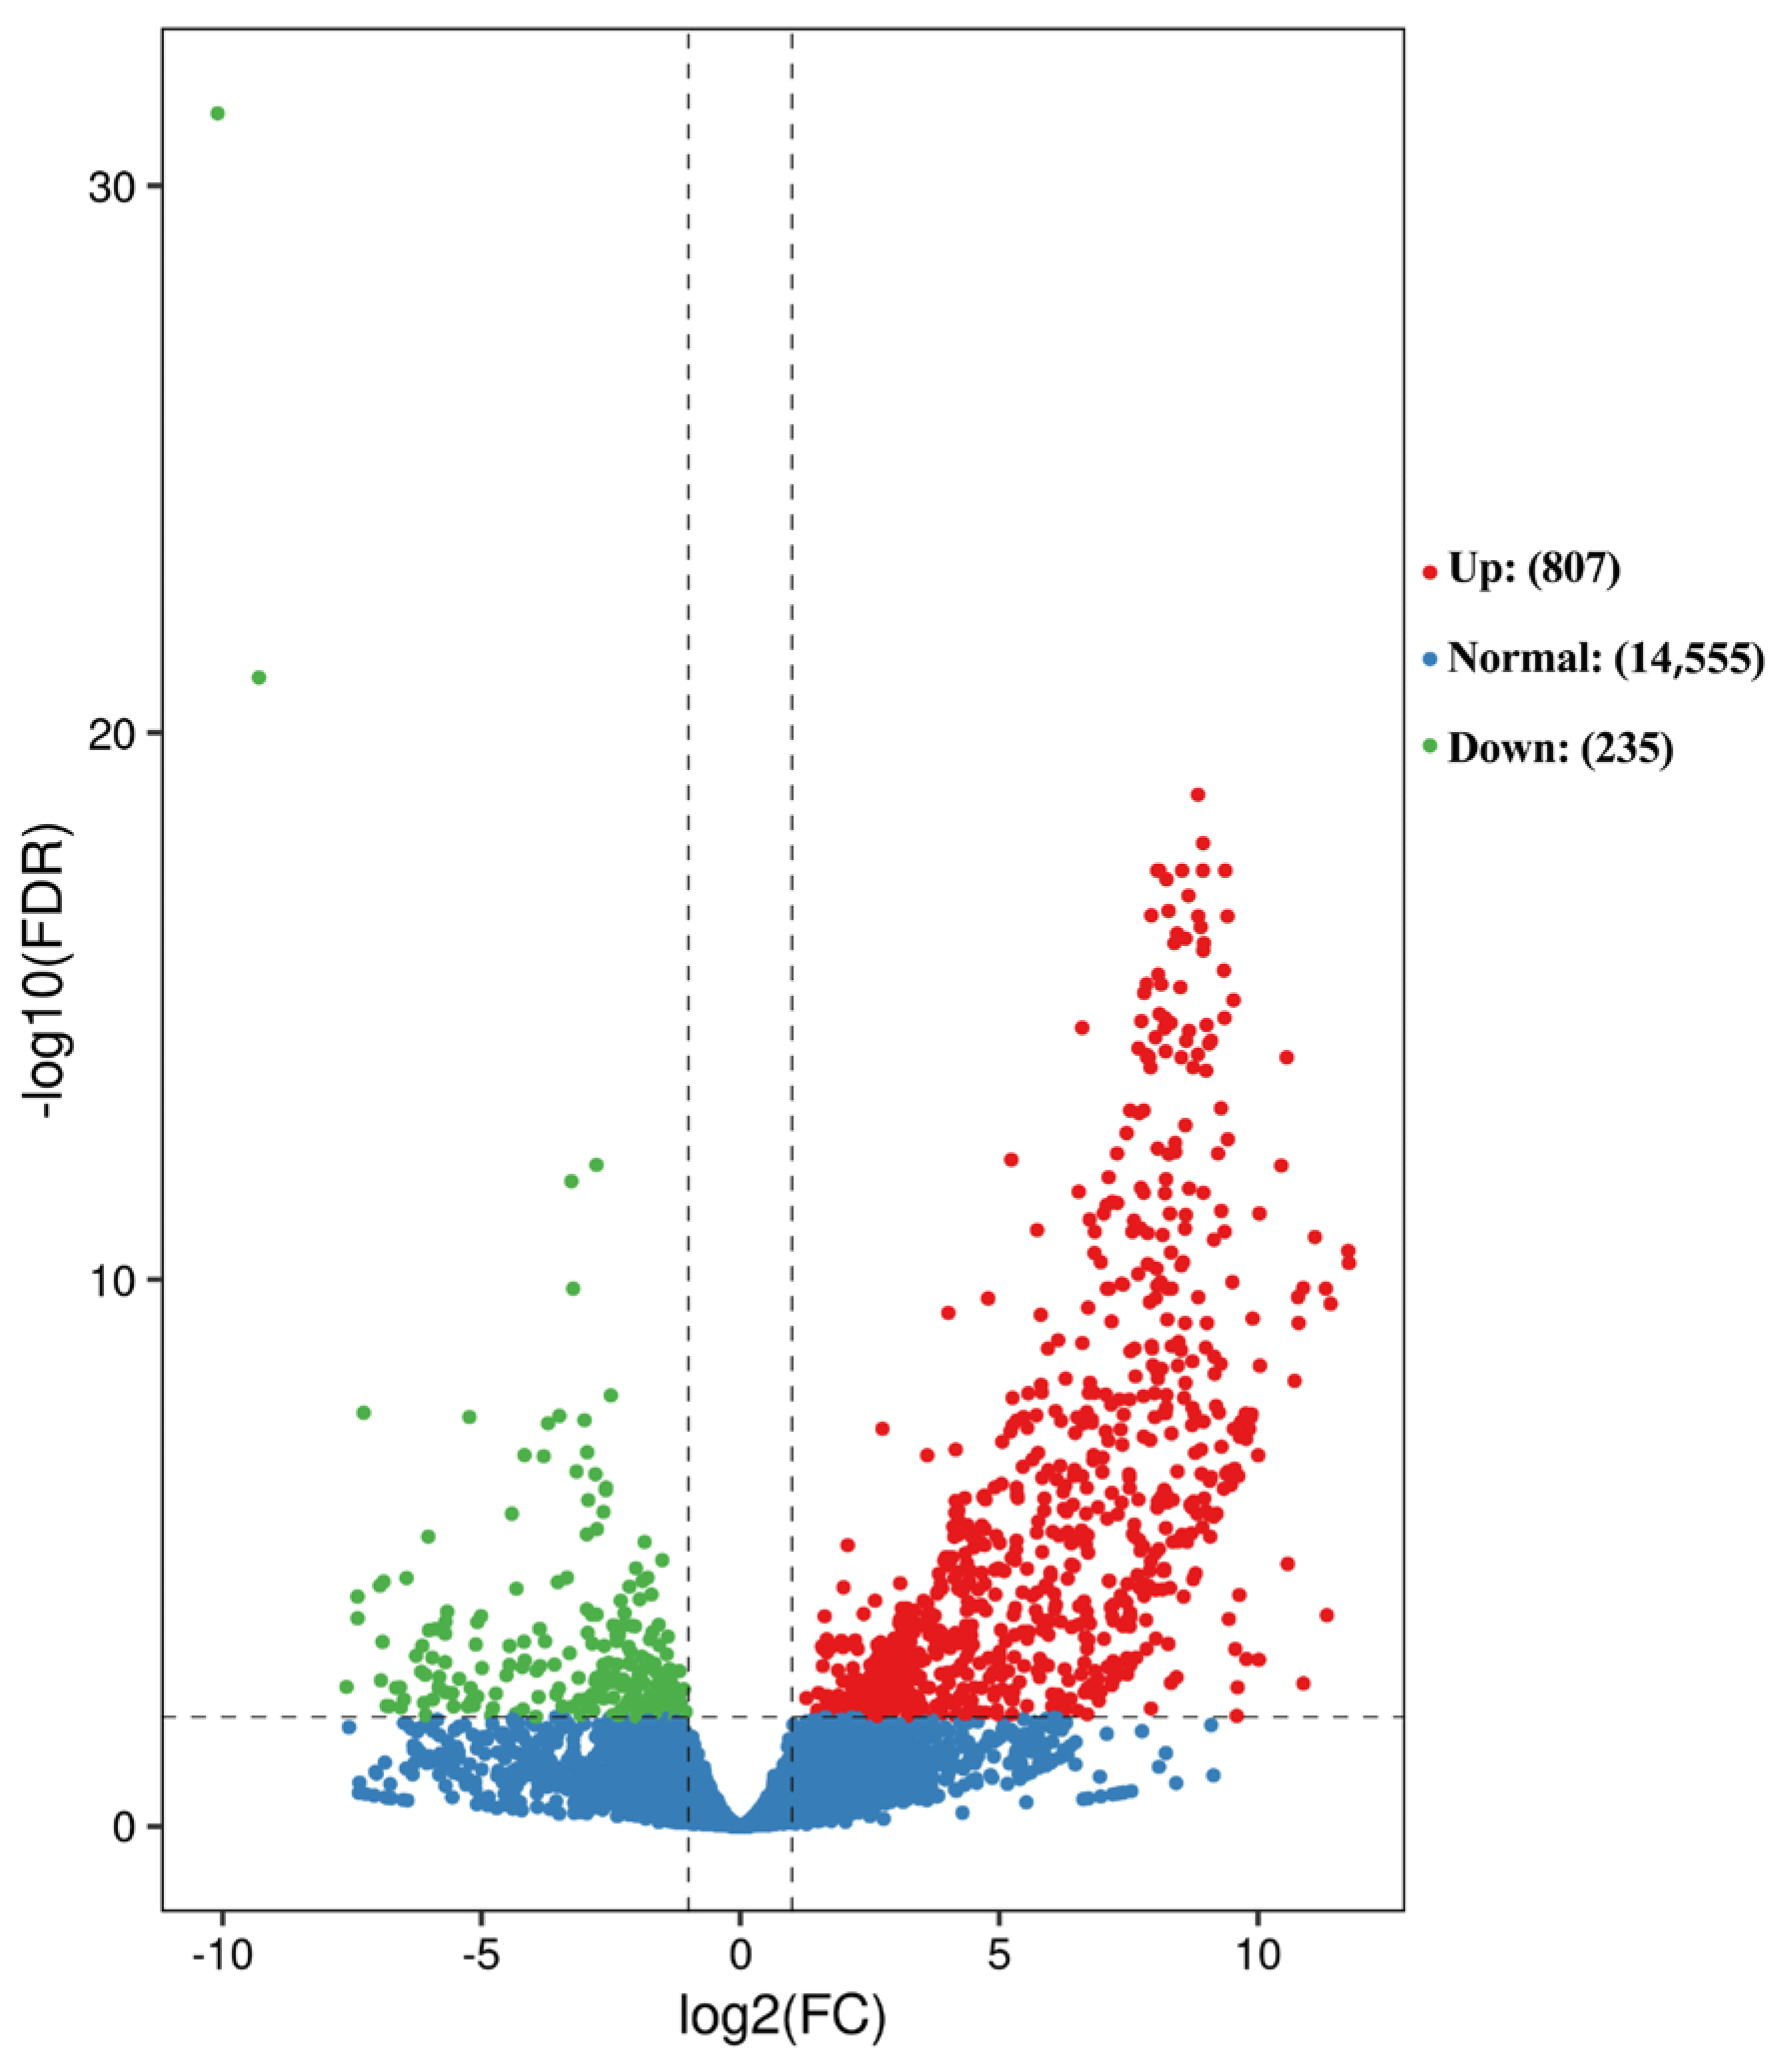
Figure 1. Patterns of differentially expressed genes (DEGs). Note: Red or green dots represent differentially expressed genes, blue dots represent non differentially expressed genes.
Animals 15 02602 g001
Figure 2. Top 20 GO classifications for enrichment analysis of DEGs at two stages of orbital fat of bighead carp. Note: The numbers right the bars indicate the count of genes enriched in each term.
Animals 15 02602 g002
Figure 3. Top 20 enriched KEGG pathways of DEGs in orbital fat of bighead carp. The color of the circles represents the significance of enrichment (−log10(adjusted p-values)), and the size of the circles represents the number of genes enriched in each pathway.
Animals 15 02602 g003
Figure 4. Heat map of 15 important DEGs expression profiles for the two growth stages. Gene abbreviations: lipoprotein lipase (lpl), claudin 7 (cldn7), triosephosphate isomerase 1 (tpi1), tubulin alpha 1a (tuba1a), glyceraldehyde-3-phosphate dehydrogenase, spermatogenic (gapdhs), fatty acid desaturase 2 (fads2), stearoyl-CoA desaturase (scd), carnitine palmitoyltransferase 1A (cpt1a), serine/threonine kinase 11 (stk11), actinin alpha 2 (actn2), ATPase Na+/K+ transporting subunit alpha 2 (atp1a2), fructose-bisphosphatase 2 (fbp2), solute carrier family 27 member 1 (slc27a1), carnitine palmitoyl transferase I (cpt1), carnitine palmitoyltransferase 1B (cpt1 b).
Animals 15 02602 g004
Figure 5. Correlation network of key genes. Diagonally filled circular nodes indicate key genes associated with early growth regulation in orbital fat. Circular nodes filled with solid colors indicate genes that interact with key genes. Interactions between different genes are indicated by different colored lines. Red lines indicate predicted interactions. Purple lines indicate co-expression interactions.
Animals 15 02602 g005
Figure 6. Validation of RNA-Seq results by qRT-PCR in bighead carp orbital fat across two developmental stages. Gene expression levels are presented as mean normalized ratios ± standard error (SE) (n = 3 biological replicates).
Animals 15 02602 g006
Table 1. Primer sequences of the DEGs for qRT-PCR.
PrimersSequence (5′-3′)Tm (°C)
Hyn-tpi1-qpcr-1FCGGAATCACGGAGAAAGTTGT59
Hyn-tpi1-qpcr-1RAGGCTCATAAGCAAGGACCAC
Hyn-igfbp3-qPCR-1FTAAGGACGCCGTTAGAGAGC55
Hyn-igfbp3-qPCR-1RAGTTTGGAATGCGGAAGC
Hyn-msmo1-qpcr-1FTATTTCAGTTCCTCCCTTTCA55
Hyn-msmo1-qpcr-1RGCATGGGAGTCCCAGTCATAG
Hyn-slc25a11-qPCR-1FAGGCGAGTCACCTTGCTACA58
Hyn-slc25a11-qPCR-1RAATGGATTTGGGGCGAAGTTTTT
Hyn-tuba1a-qPCR-1FCGTGGTGCCCAAAGATGTG60
Hyn-tuba1a-qPCR-1RGGGAGGCTGGTAGTTGATGC
Hyn-cpt1a-qPCR-1FTTTTACGACGGACGGTTGC58
Hyn-cpt1a-qPCR-1RCTGCTTGTTCTTCCCACGAC
Hyn-dnajb5-qPCR-1FCTACGATGTTCTGACCGACCC59
Hyn-dnajb5-qPCR-1RCCACCCTTGTTACGGCTGA
Hyn-prkaa2-qPCR-1FACAGCCCTAAGGCACGATG58
Hyn-prkaa2-qPCR-1RACGGGTTCACCACTTTCCA
Hyn-sox6-qPCR-1FACGGAGGTGAGGATGGATT56
Hyn-sox6-qPCR-1RGGAGGTTTGTTGTGGAGCA
Hyn-fads2-qPCR-1FAGCACGACTTCGGTCATCTATC58
Hyn-fads2-qPCR-1RGCACAGTTCCACTACAAACG
Hynβ-actin-qPCR-FTATCCTATTGAGCACGGTATTG57
Hynβ-actin-qPCR-RCCTGTTGGCTTTGGGATTC
Table 2. Top KEGG pathways and DEGs associated with growth and development of orbital fat of bighead carp.
RegulationName of PathwayPathway IDGenes
upFatty acid metabolismko01212hadh, cpt1b, cpt1a, acsl1
Tight junctionko04530actn2, actn3, prkaa2, stk11
PPAR signaling pathwayko03320slc27a1, sorbs1, adipoq
Glycolysis/Gluconeogenesisko00010fbp2, gapdh, aldoa, pgm5
Cardiac muscle contractionko04260ryr3, atp1a2, actc1, myh1, myl3
Adrenergic signaling in cardiomyocytesko04261ppp2r3a, tpm2, cacna1s
downFatty acid metabolismko01212hadha, hadhb, fads2
Tight junctionko04530tuba1a, tuba1c, cldn7
PPAR signaling pathwayko03320scd, apoa1, lpl
Glycolysis/Gluconeogenesisko00010fbp1, hk2, eno1, eno4, gapdhs, tpi1, pklr, ldhb, aldoc
Disclaimer/Publisher’s Note: The statements, opinions and data contained in all publications are solely those of the individual author(s) and contributor(s) and not of MDPI and/or the editor(s). MDPI and/or the editor(s) disclaim responsibility for any injury to people or property resulting from any ideas, methods, instructions or products referred to in the content.