
An Efficient Algorithm for Small Livestock Object Detection in Unmanned Aerial Vehicle Imagery


Simple Summary
Abstract
1. Introduction
- We established a grazing livestock dataset based on UAV imagery data from the Prairie Chenbarhu Banner in Hulunbuir. This dataset serves as the foundation for our proposed LSNET algorithm, which enhances livestock target detection by adding a low-level prediction head (P2) to improve feature extraction performance for small livestock targets and removing the deep prediction head (P5) to reduce the impact of excessive down-sampling.
- To further improve detection accuracy, the SPPCSPC module of YOLOv7 was enhanced to extract high-level semantic features by extending the receptive field and employing the Large Kernel Attention Mechanism. Moreover, incorporating WIoU v3 into the bounding box regression loss function.
- Evaluated on the Hulunbuir grassland livestock dataset, the proposed LSNET algorithm achieves a mean Average Precision (mAP) of 93.33%, representing a 1.47% improvement over the traditional YOLOv7 algorithm, highlighting its superior performance in livestock detection tasks.
2. Materials and Methods
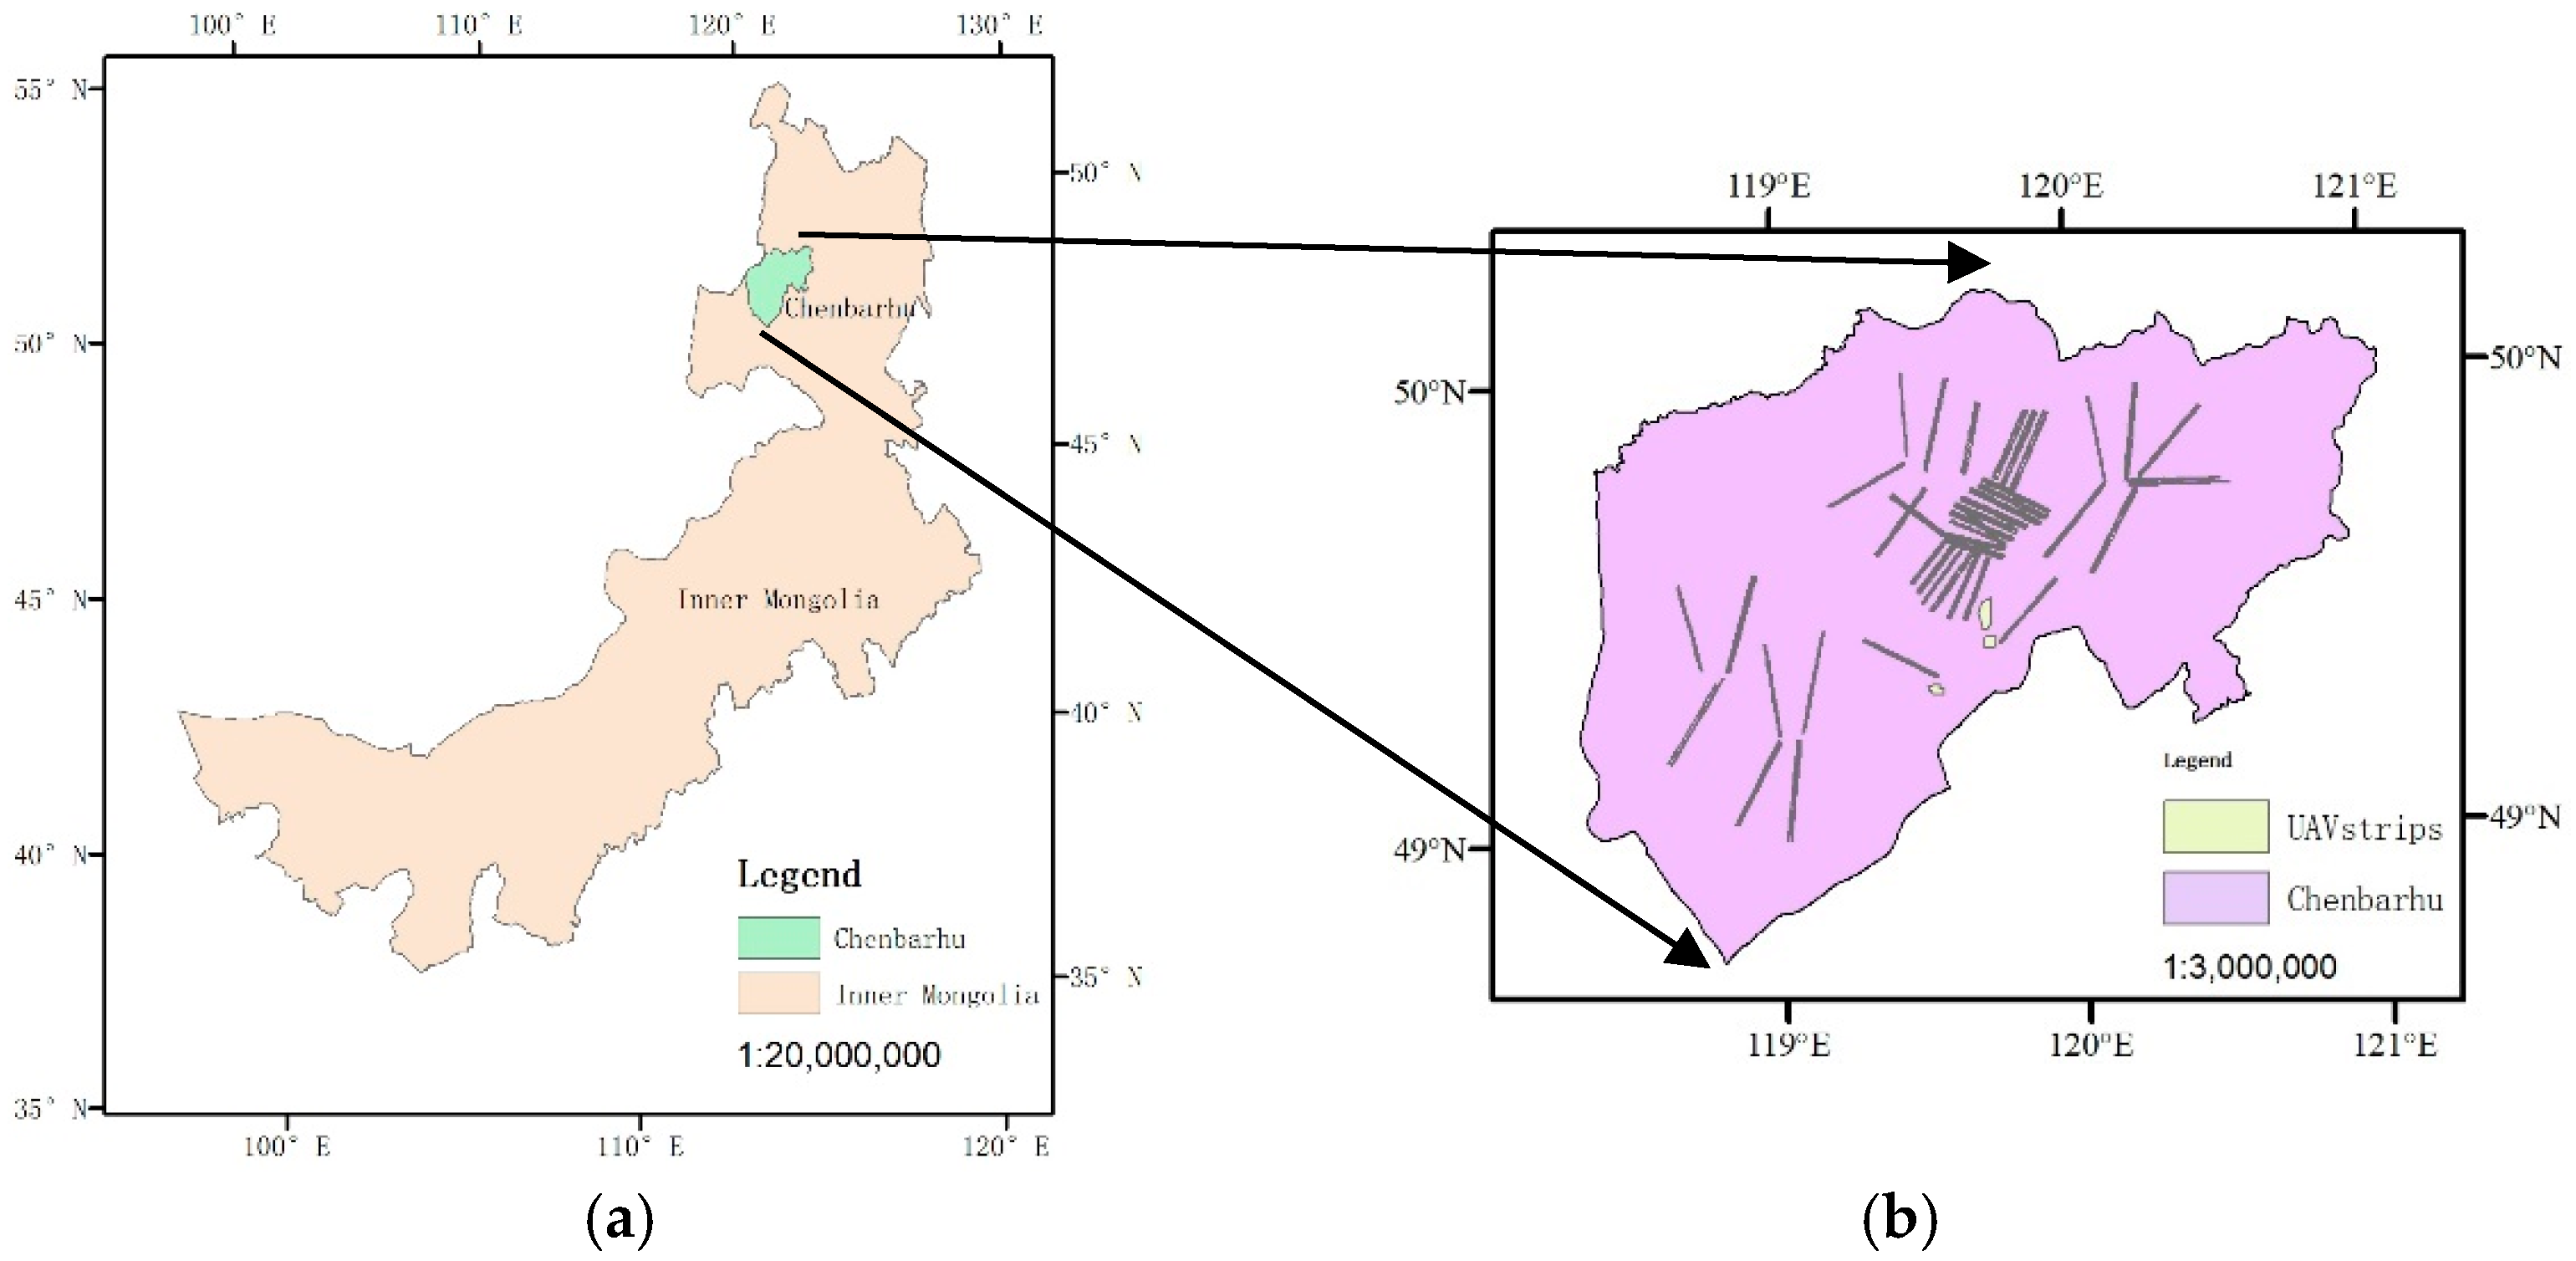
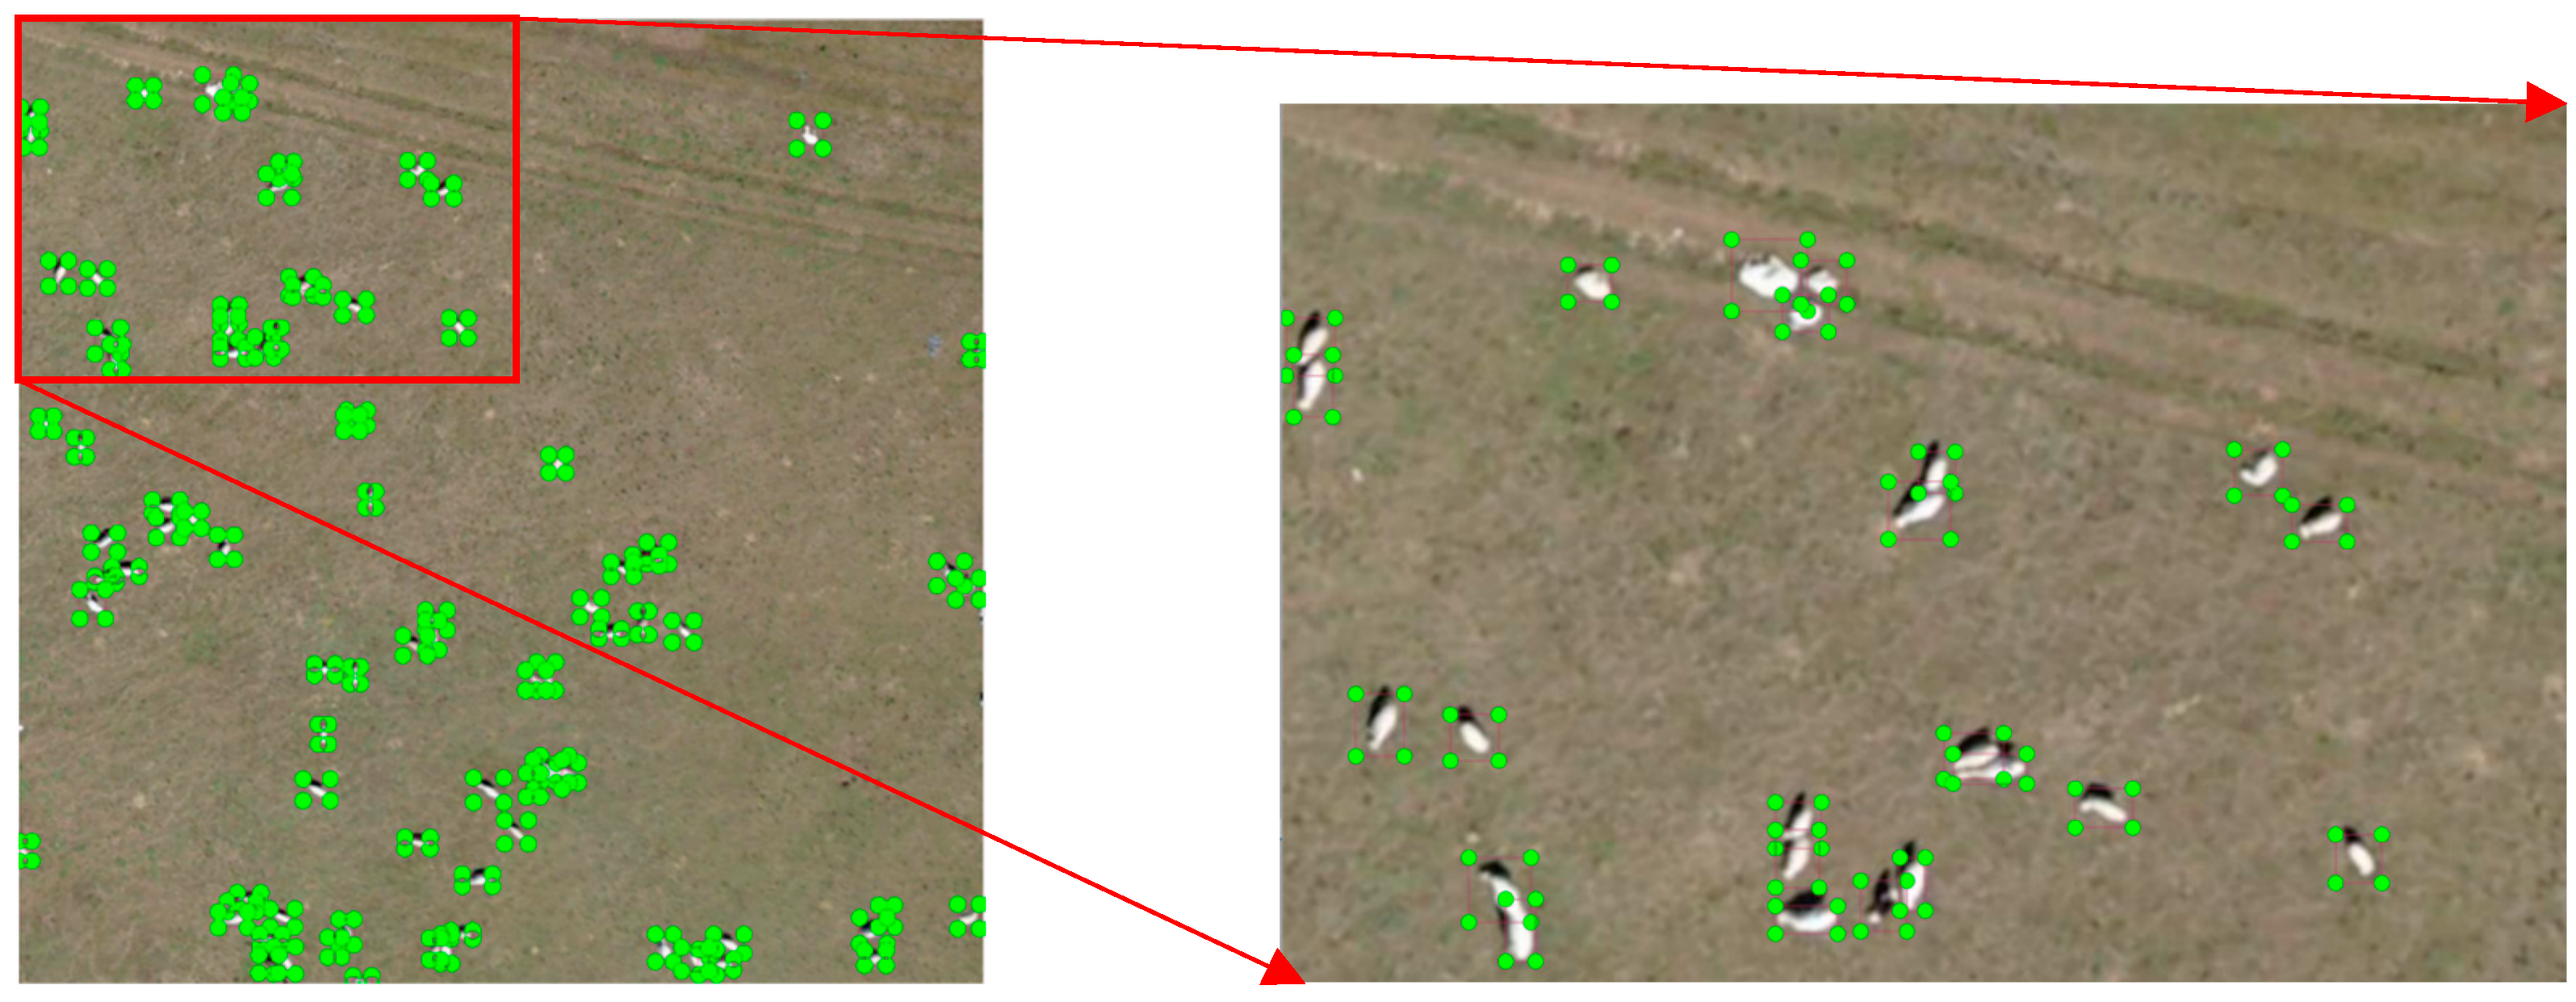
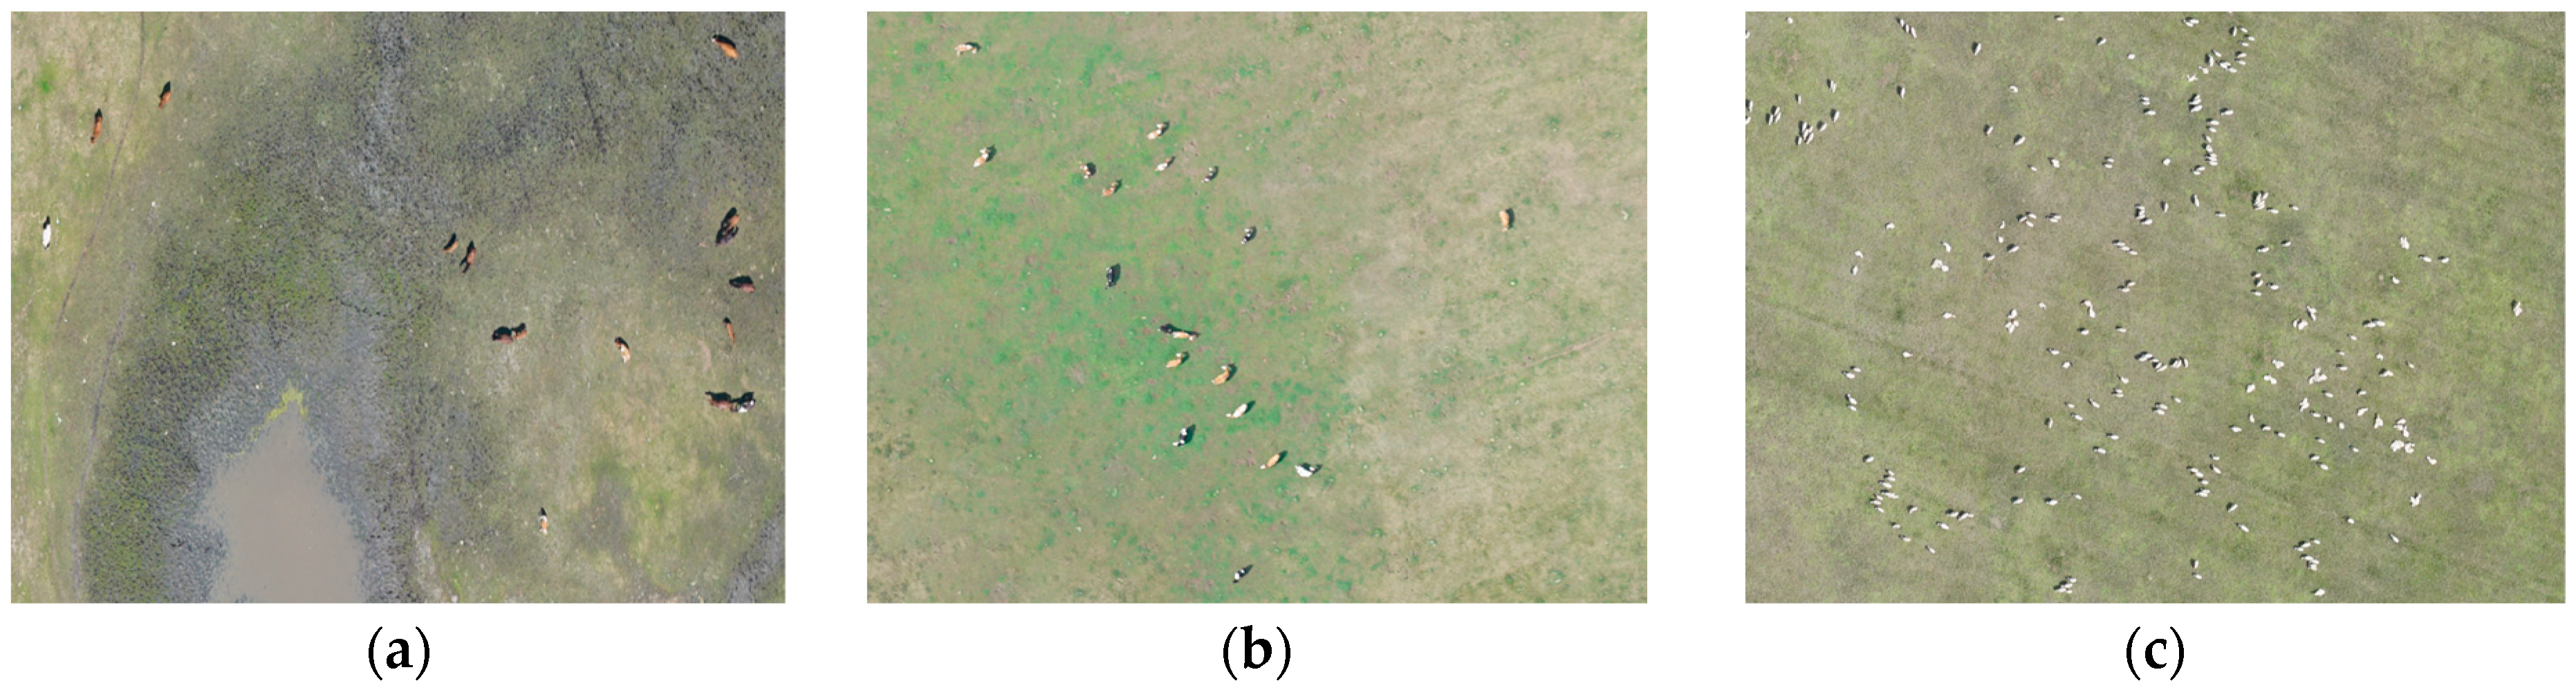
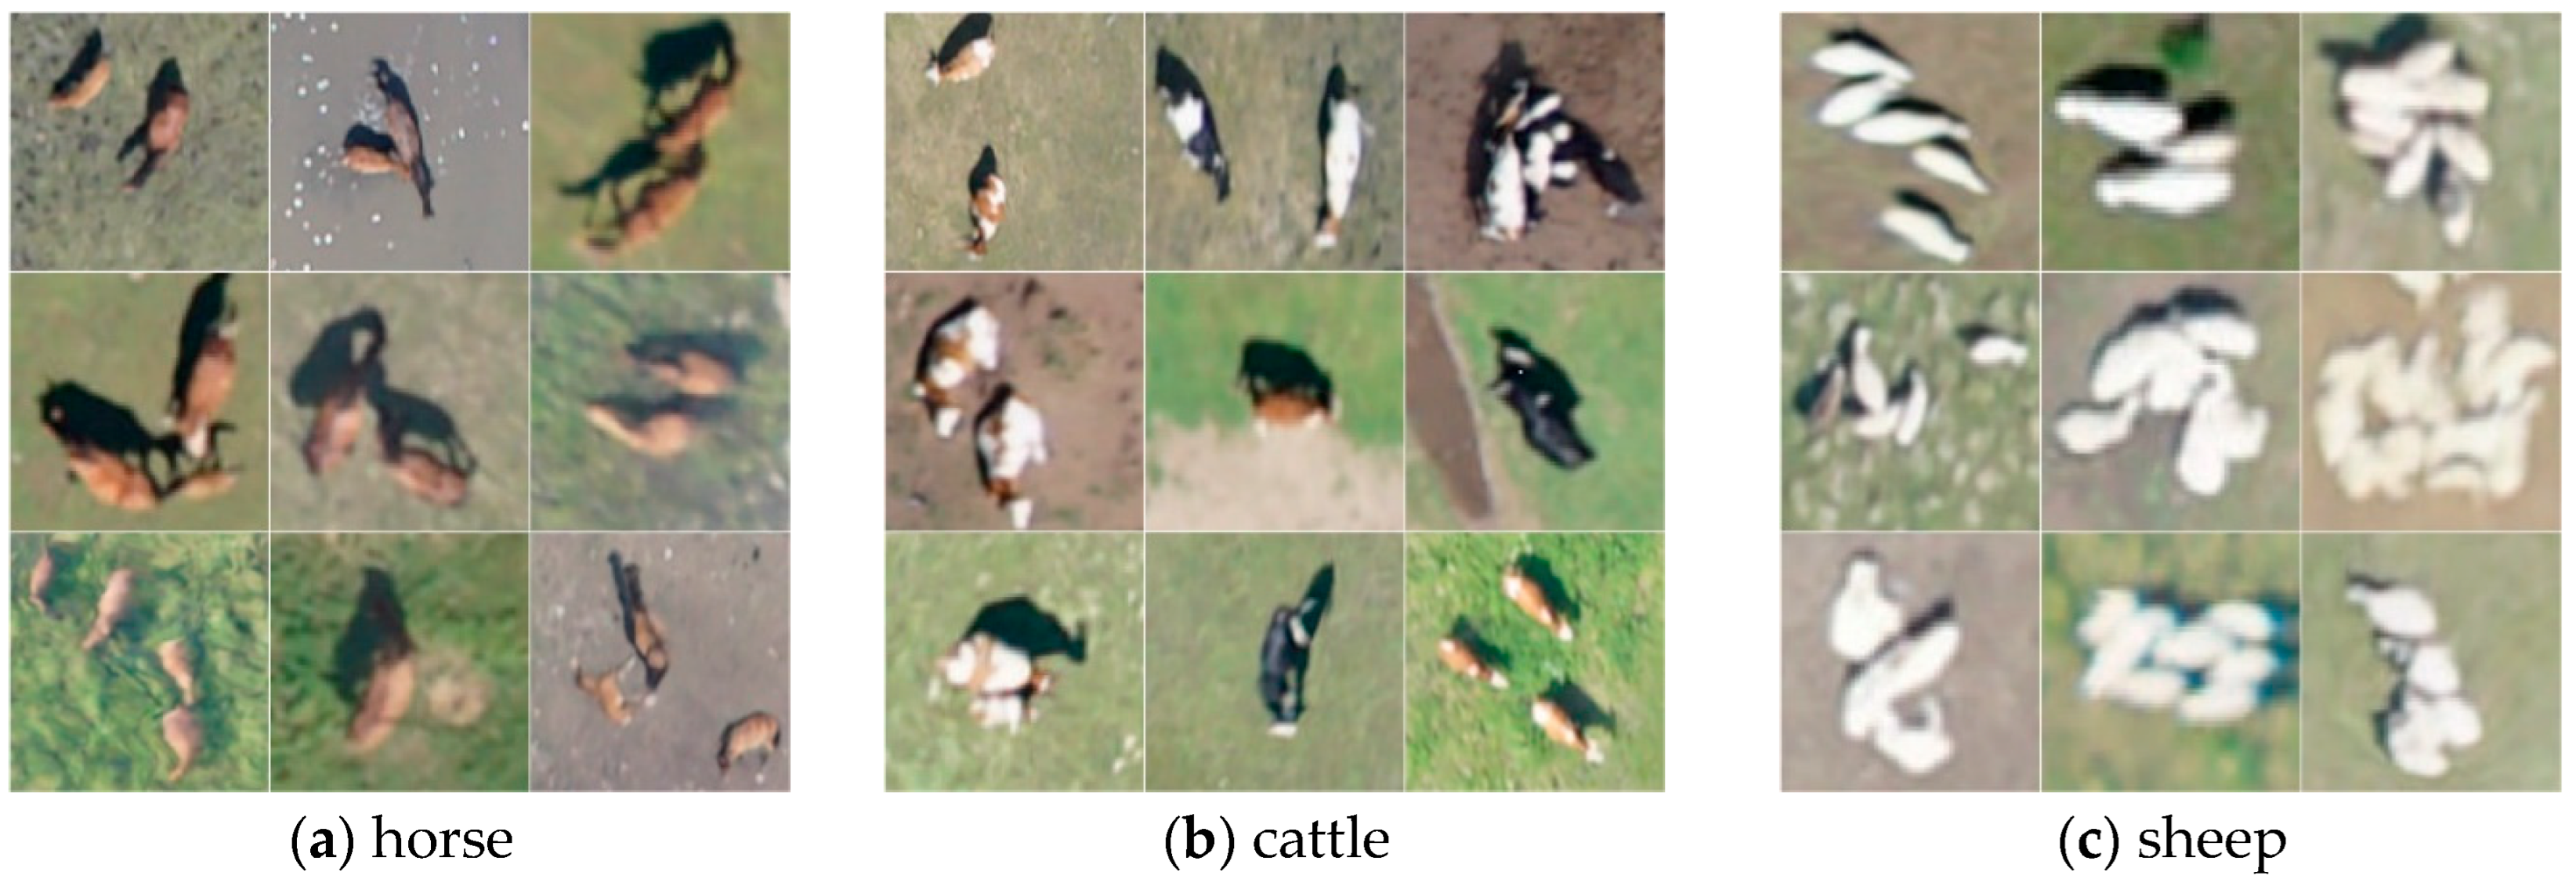
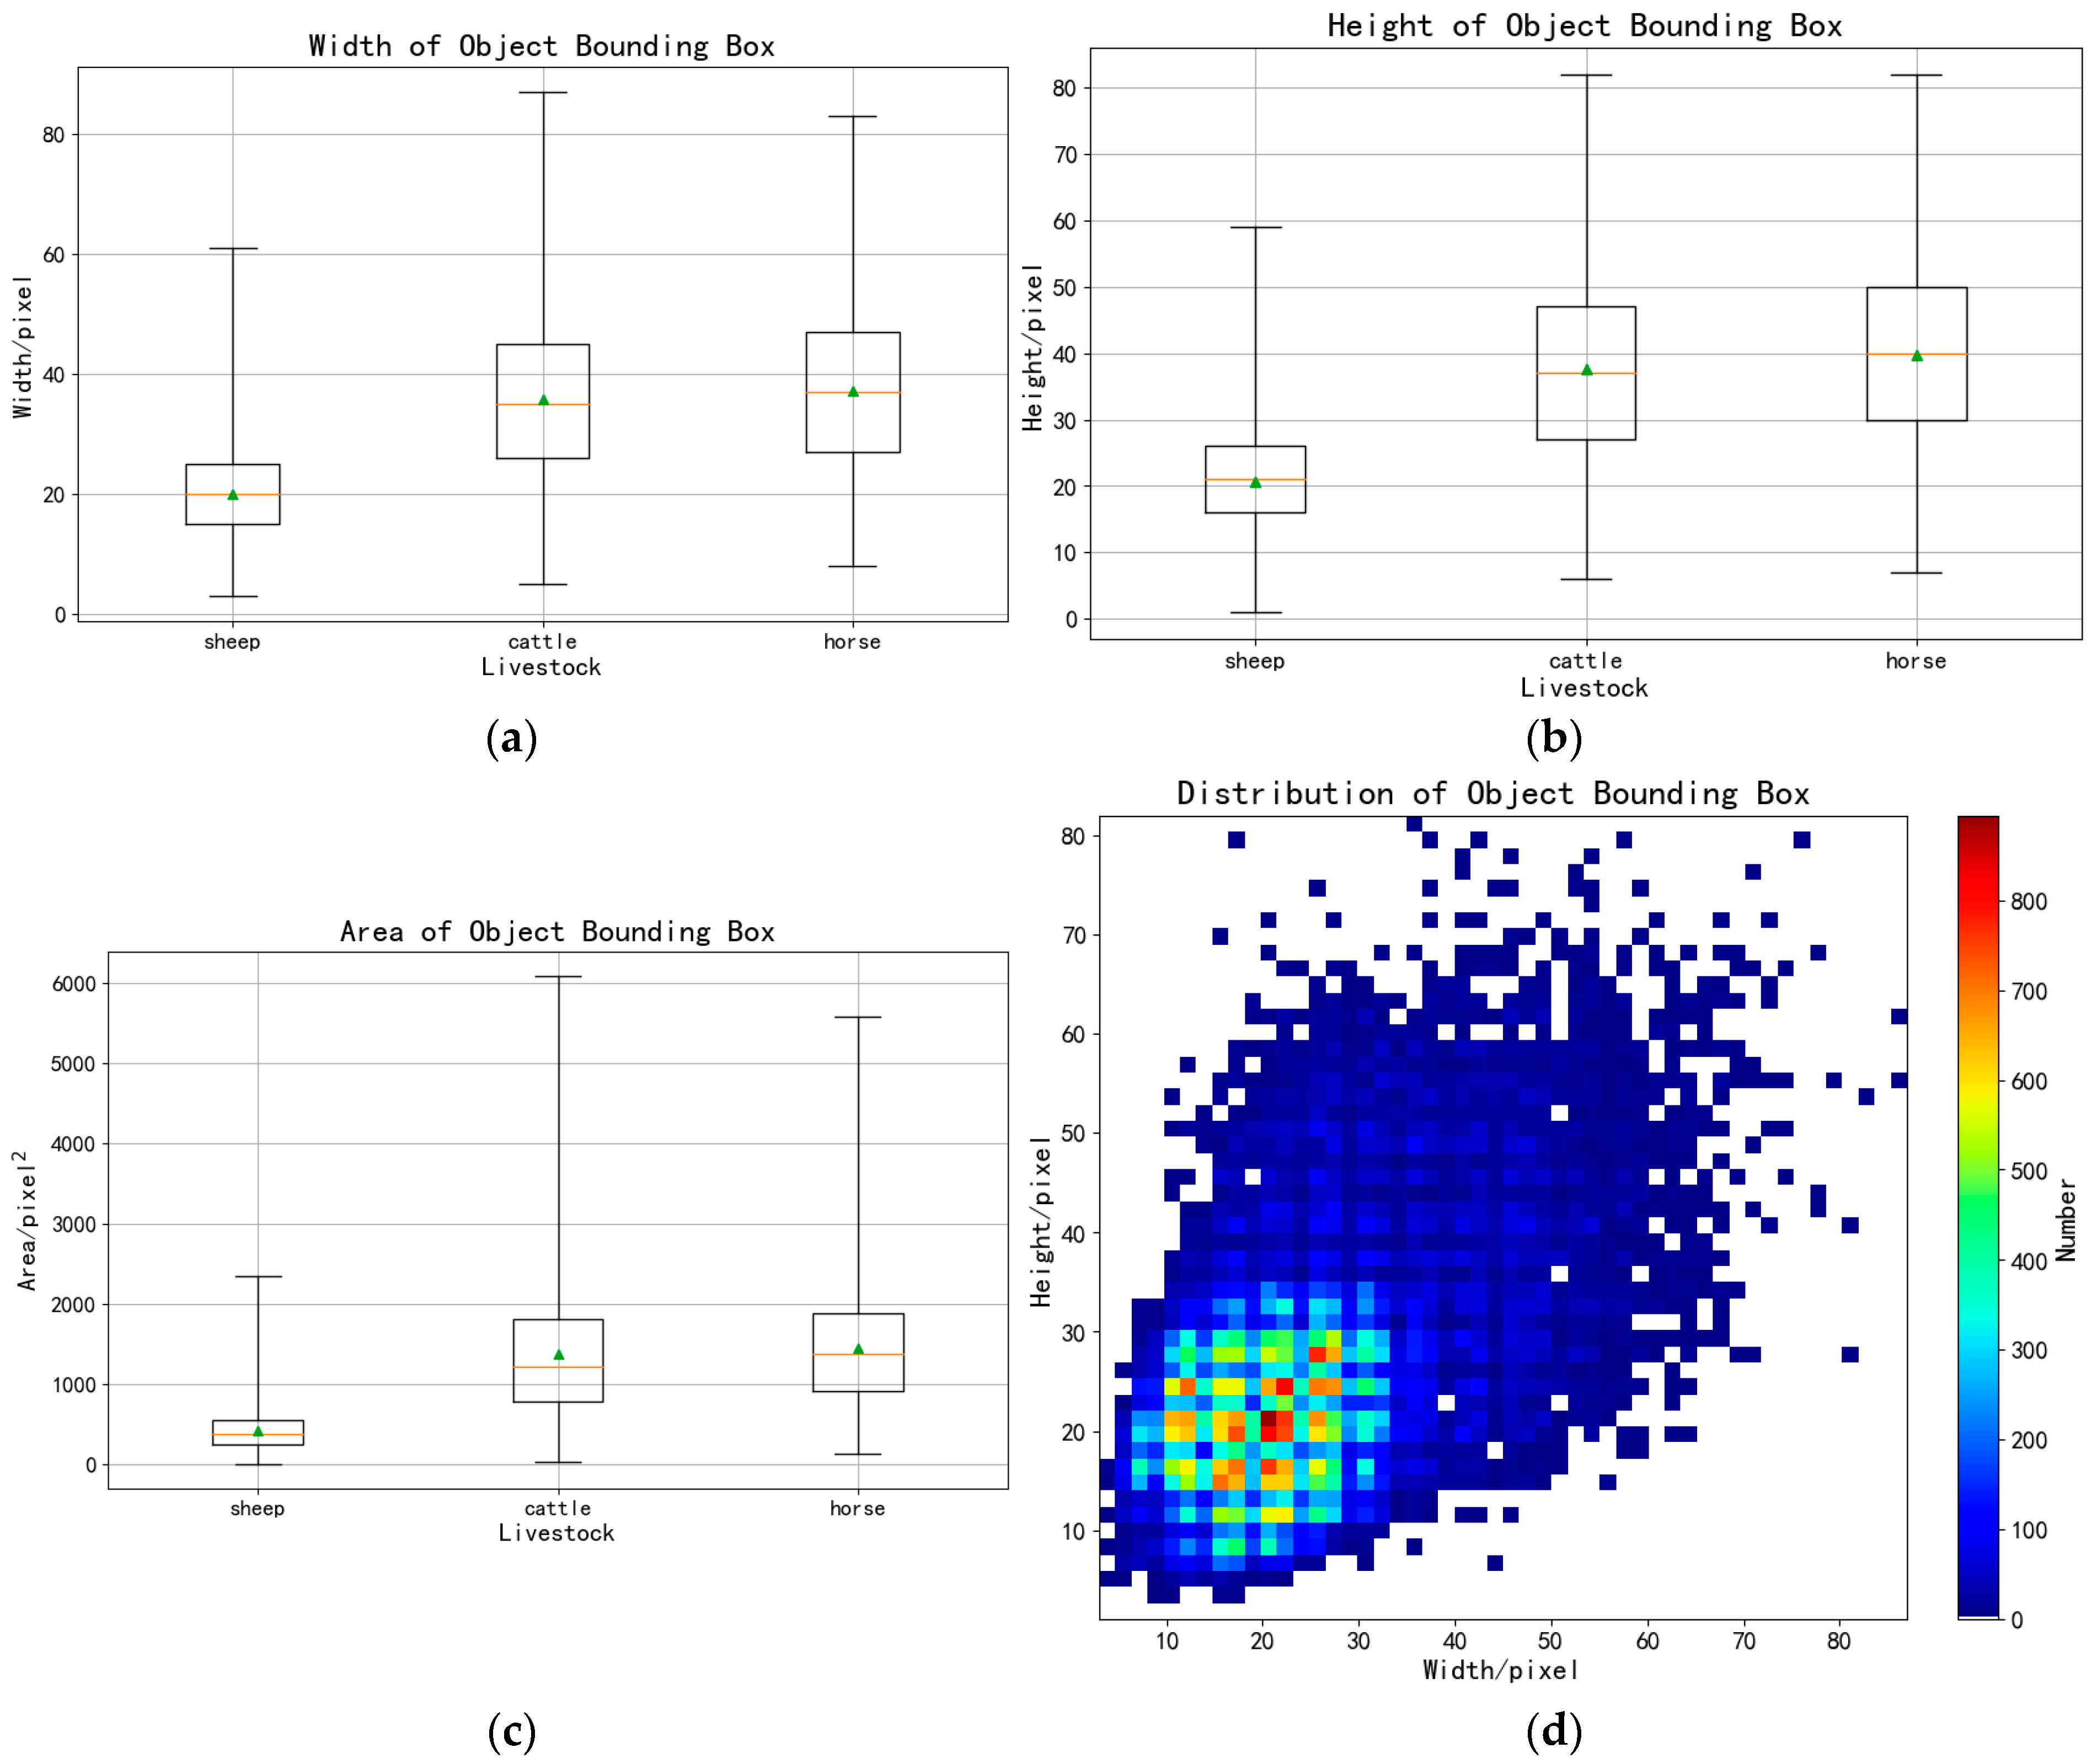
2.1. Experimental Data
2.2. Research Methods
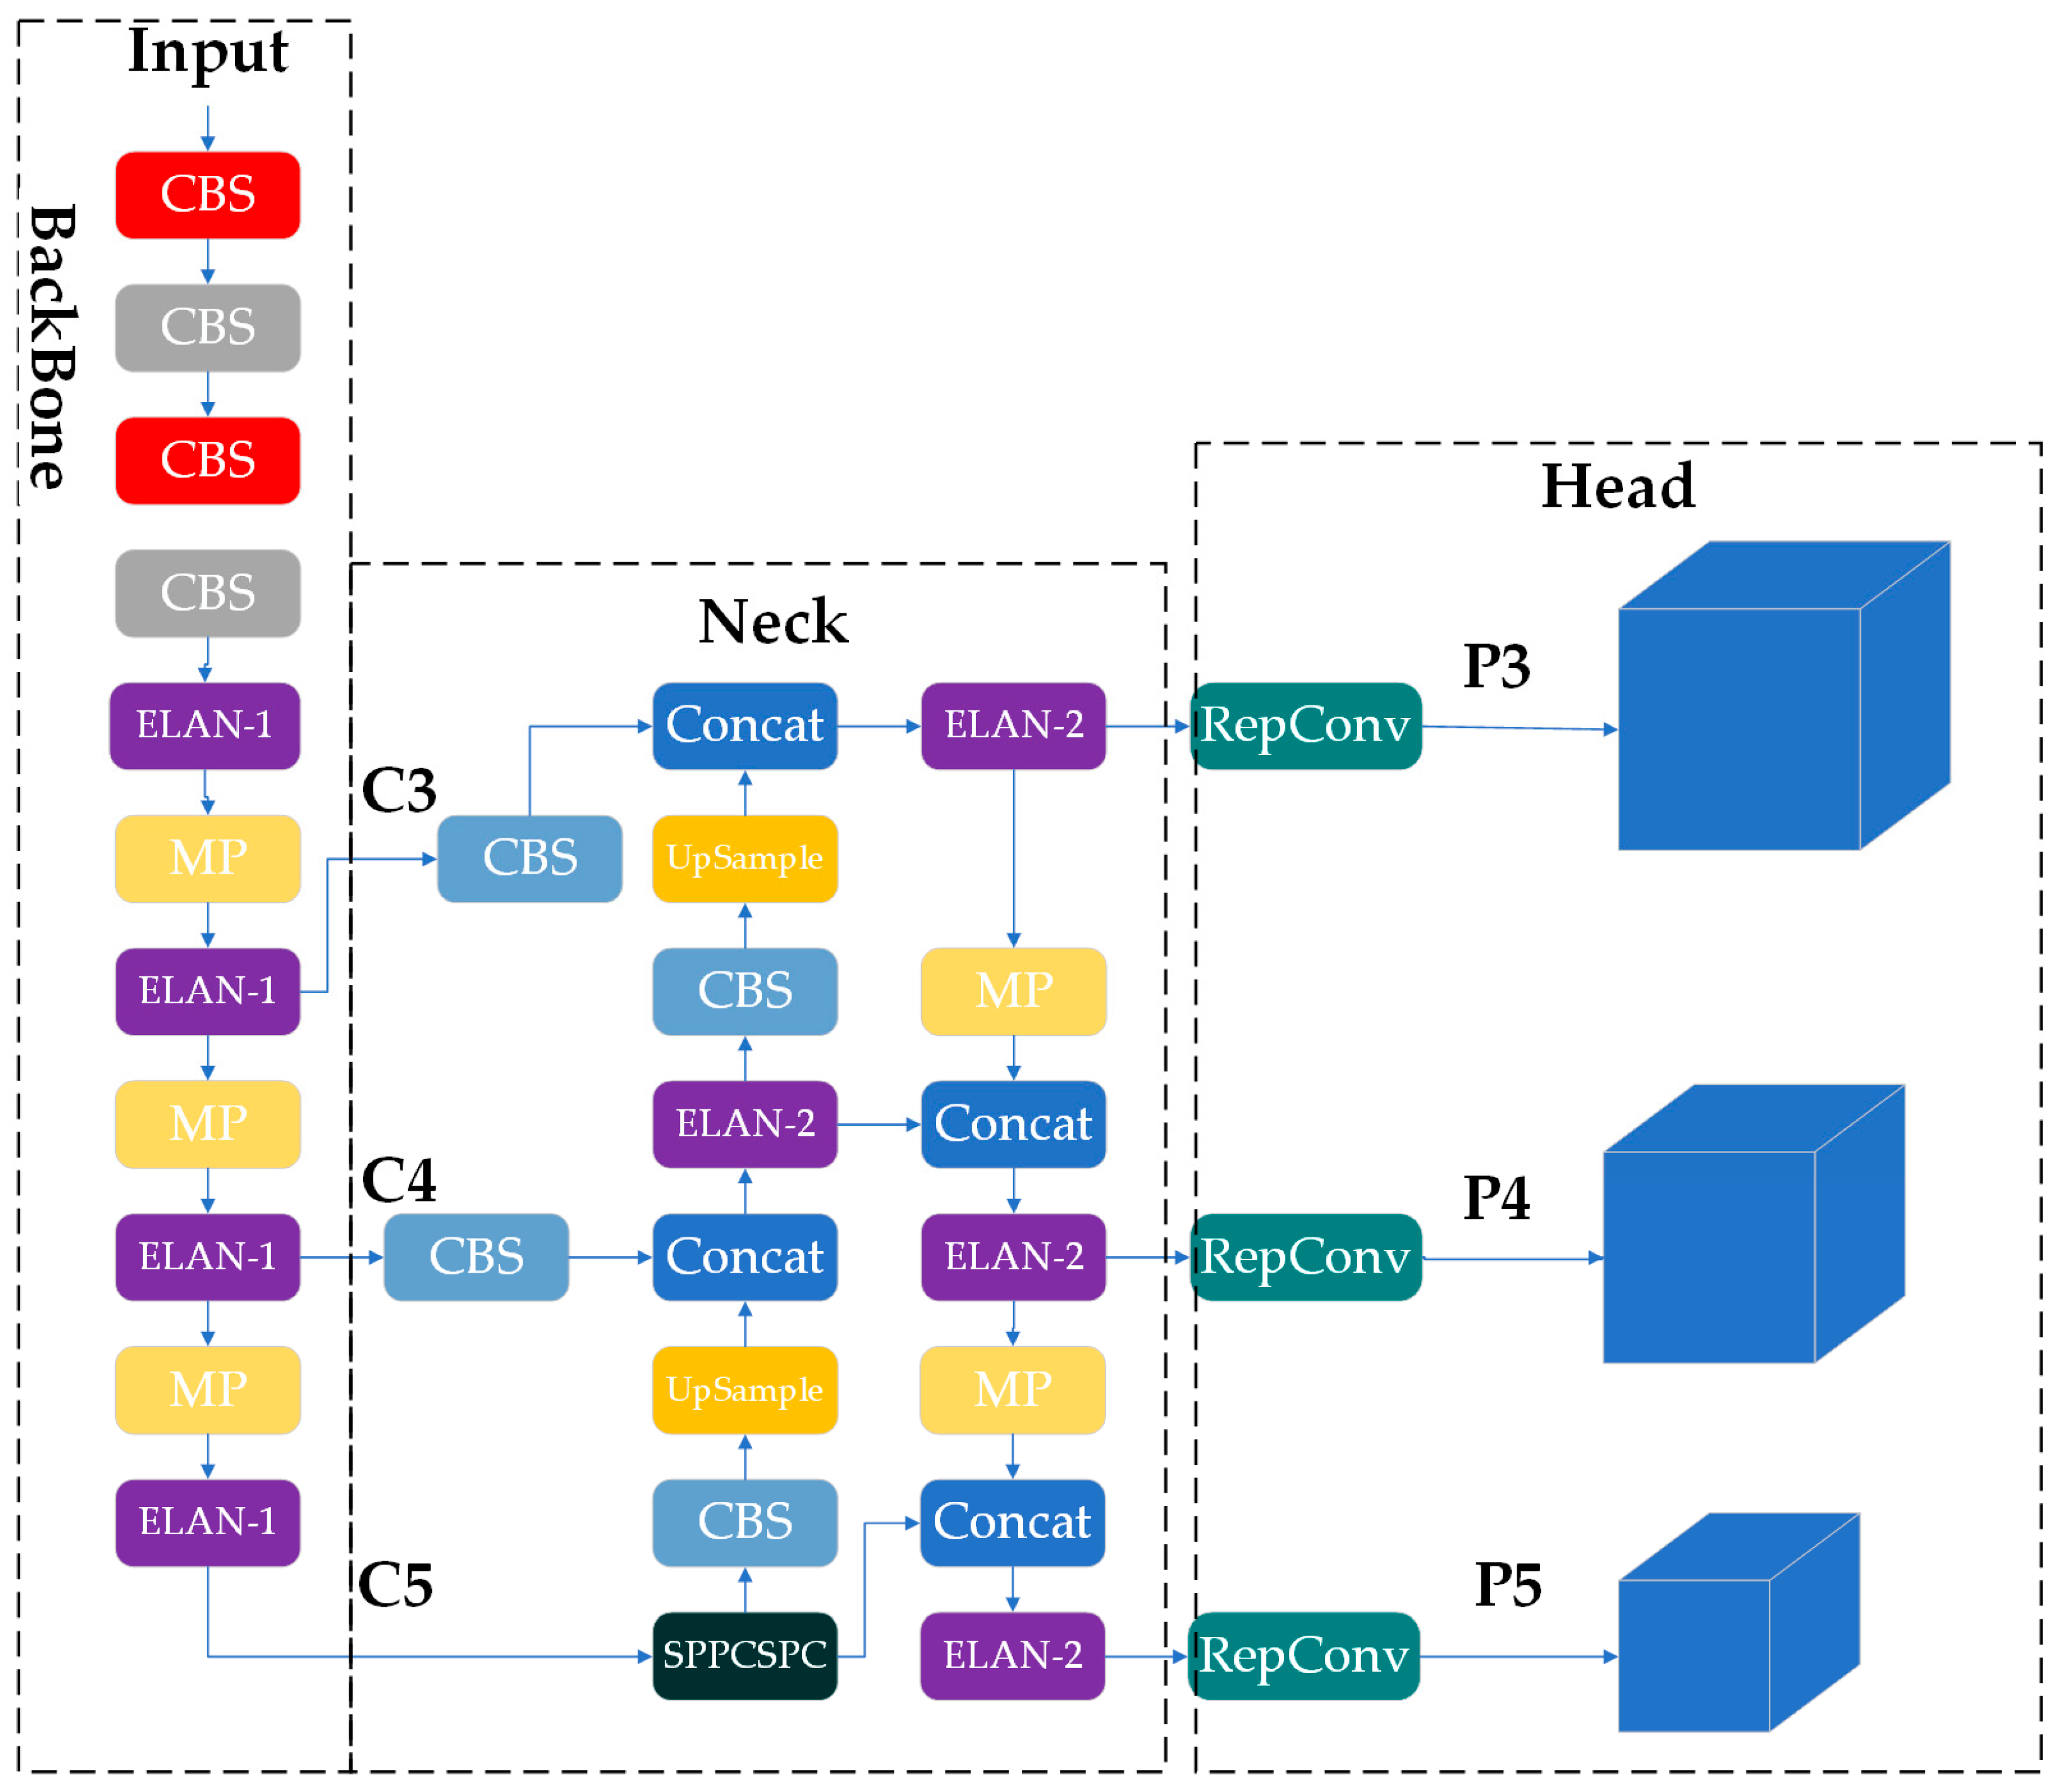
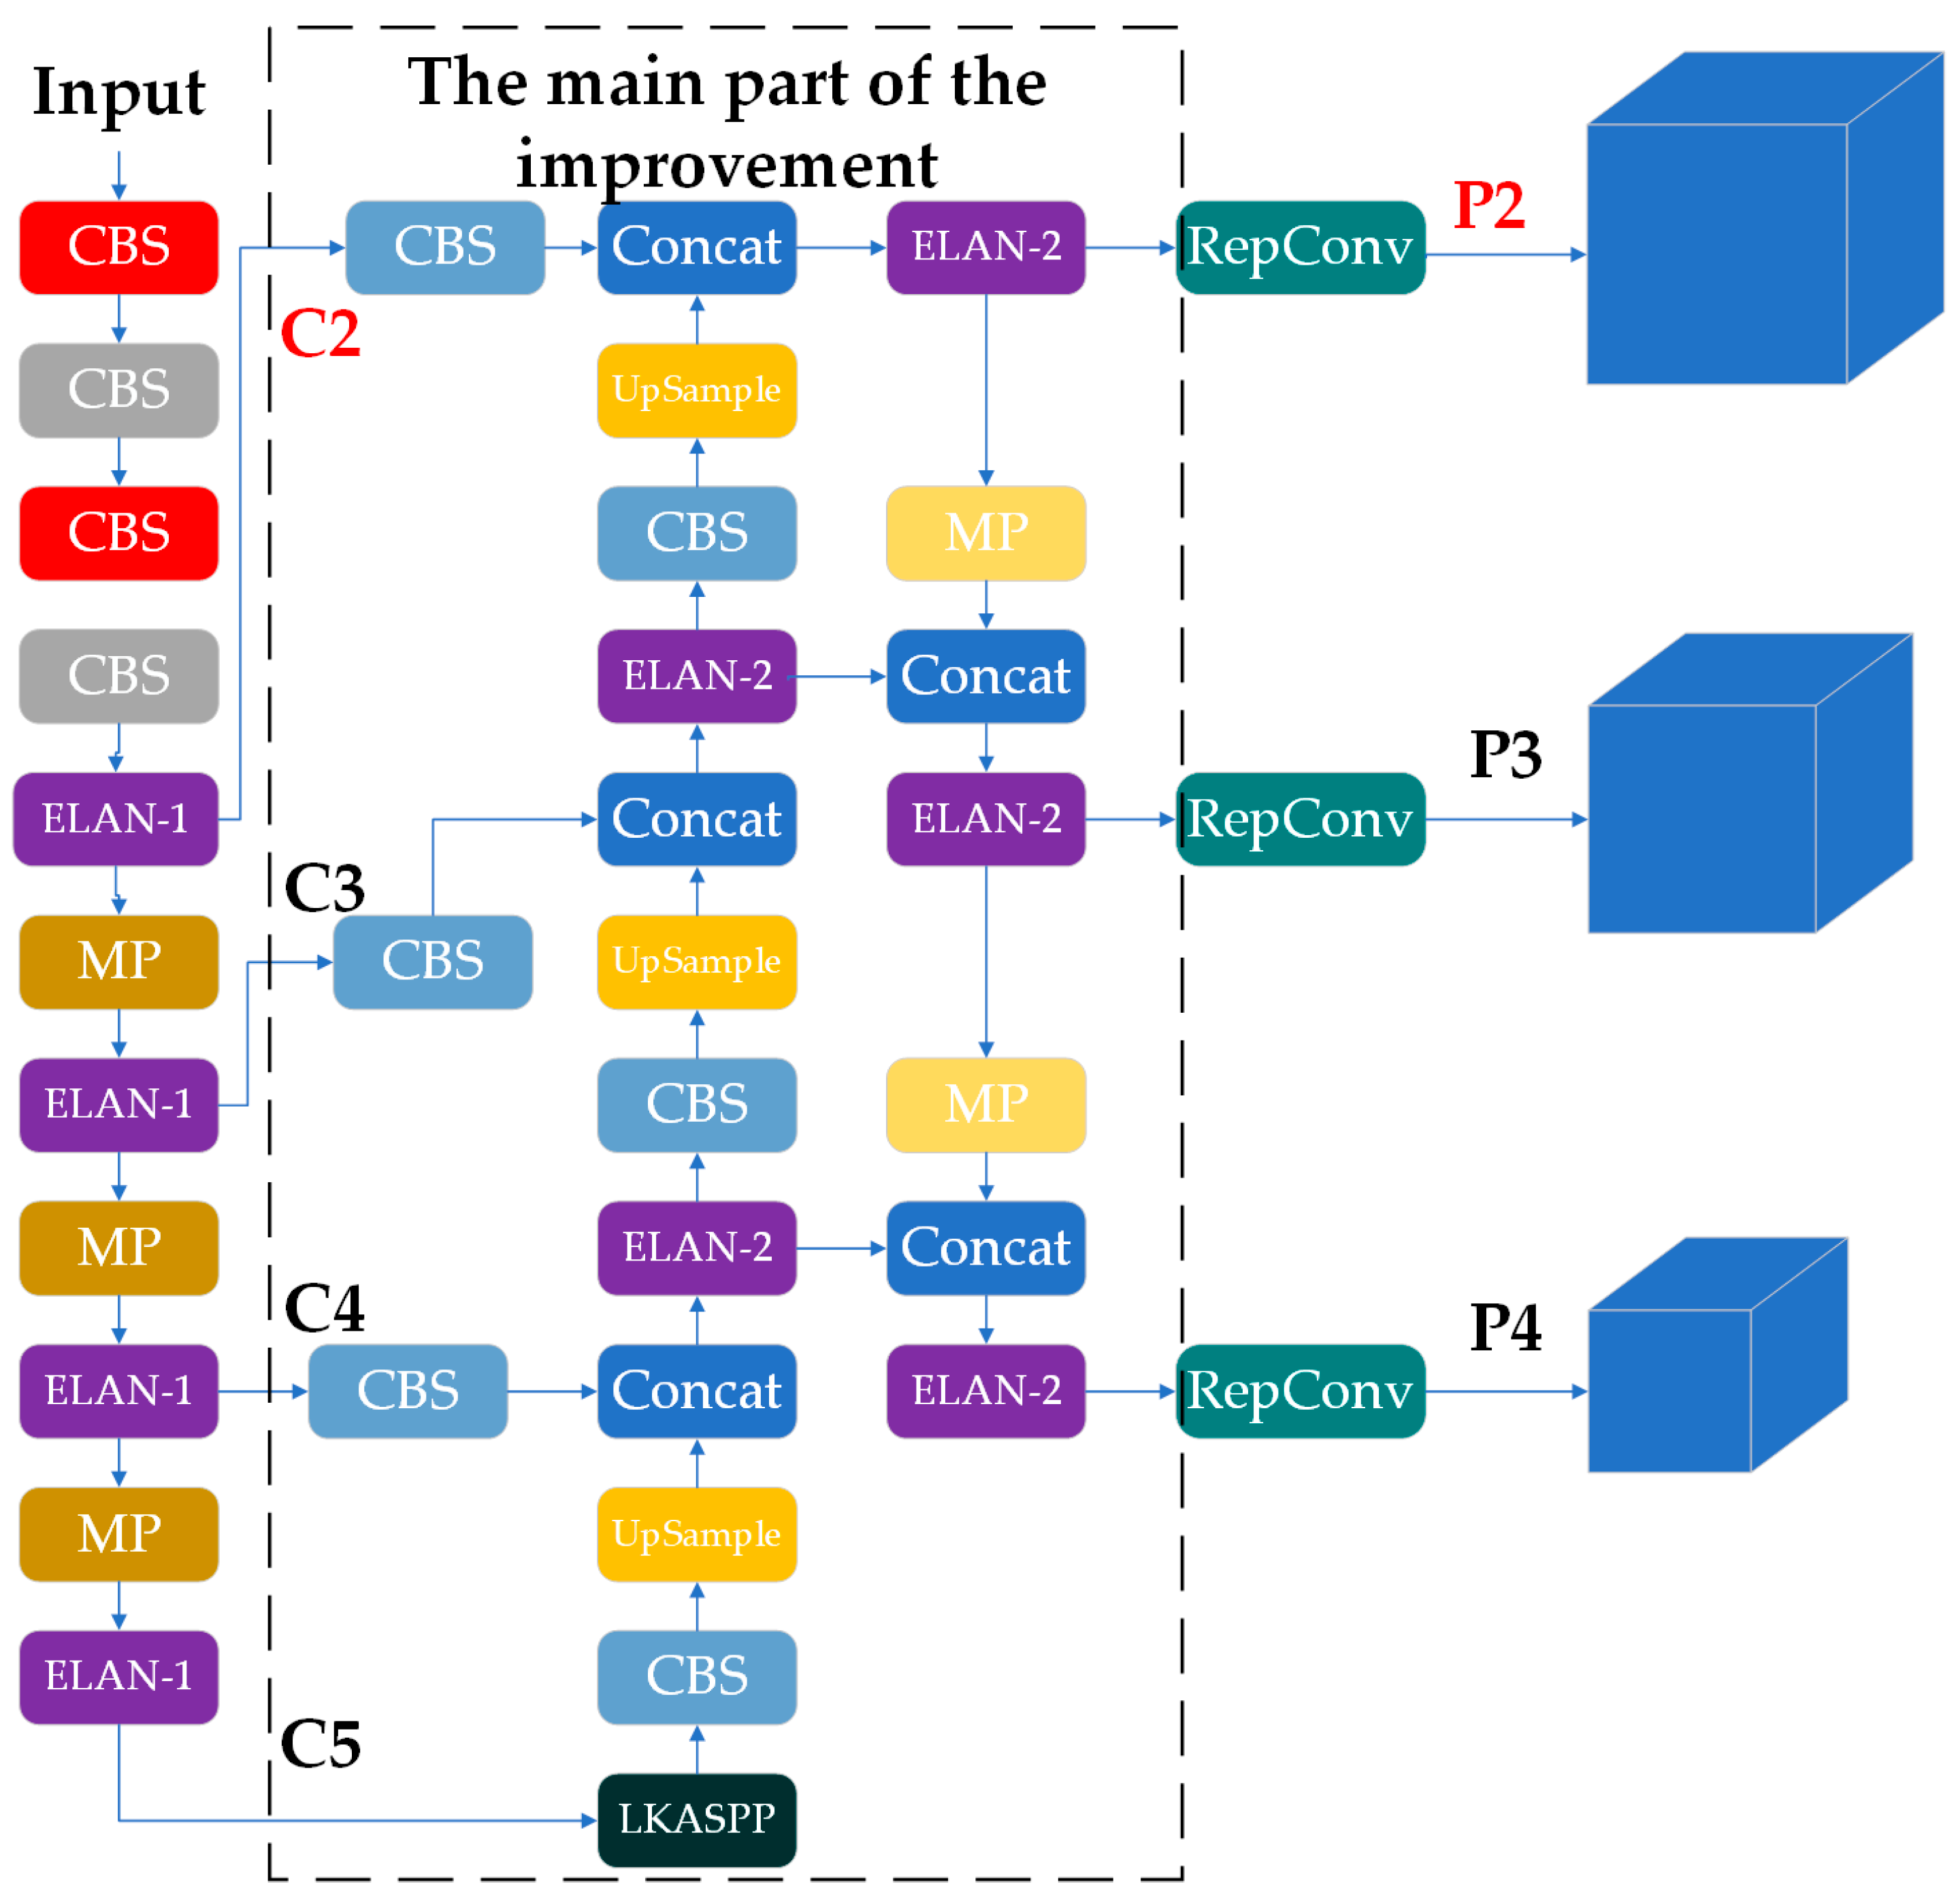
2.2.1. LSNET
2.2.2. Extra Prediction Head (P2)
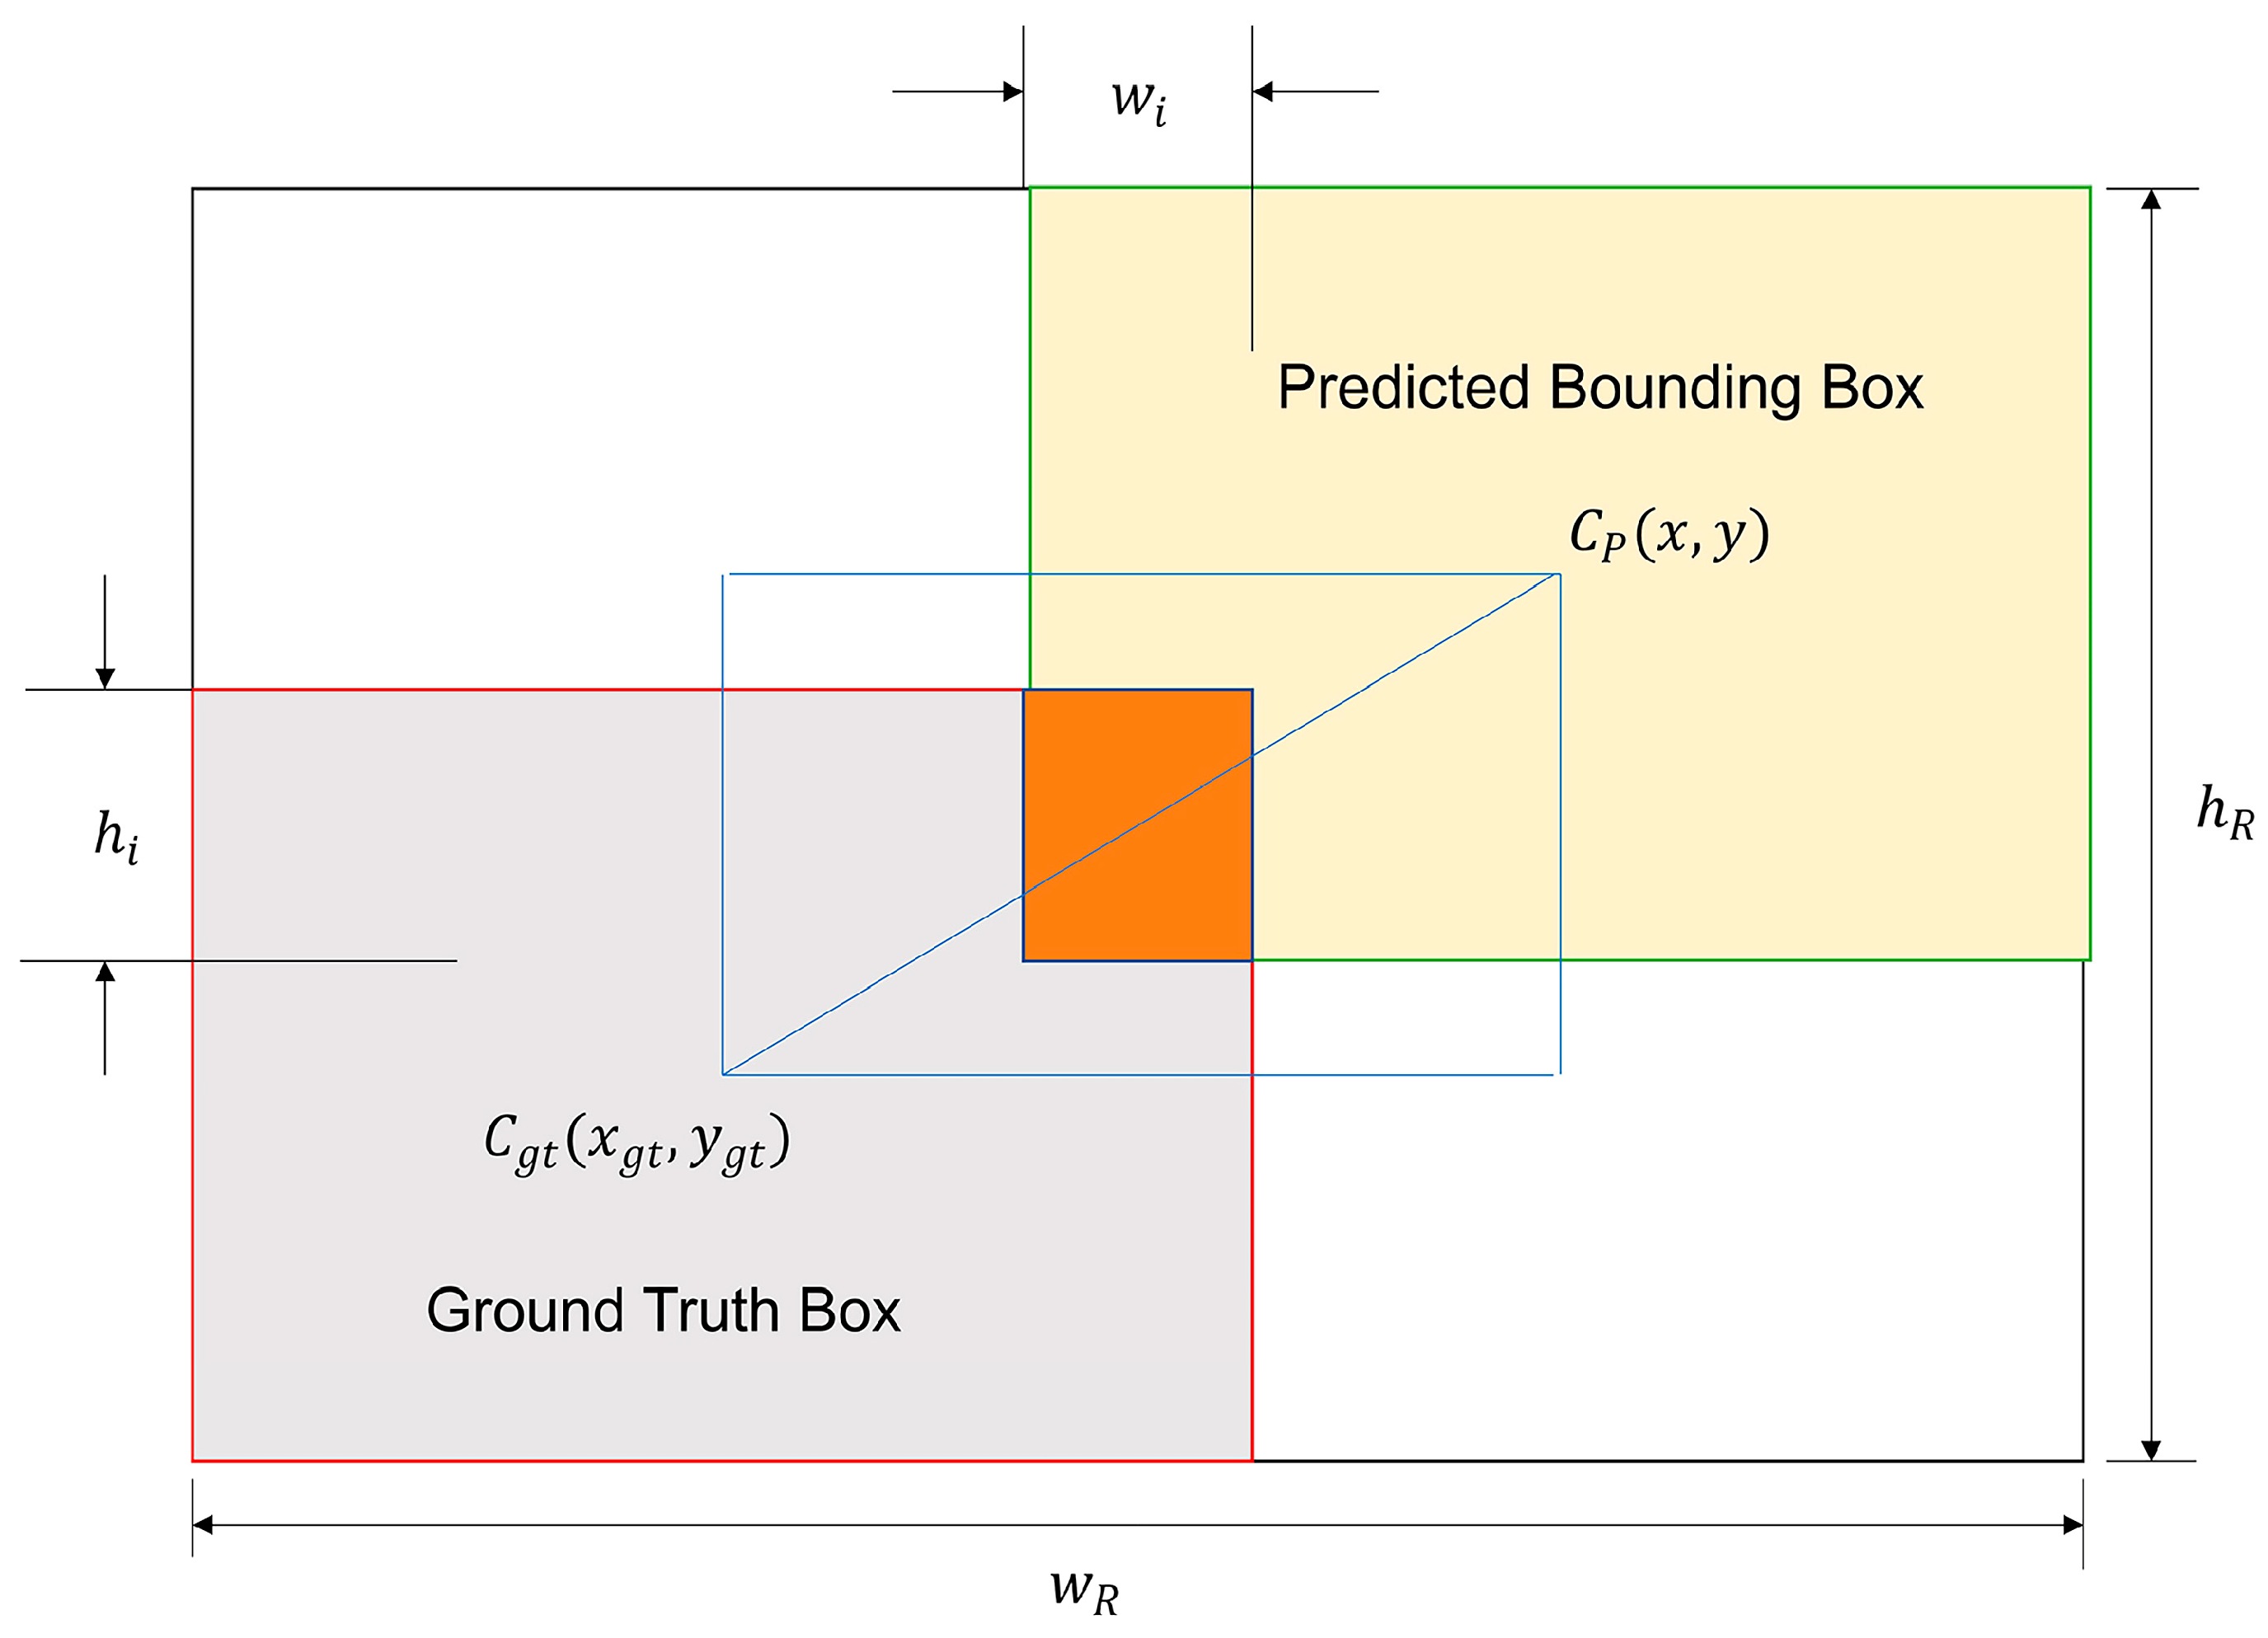
2.2.3. WIoU v3 Loss Function
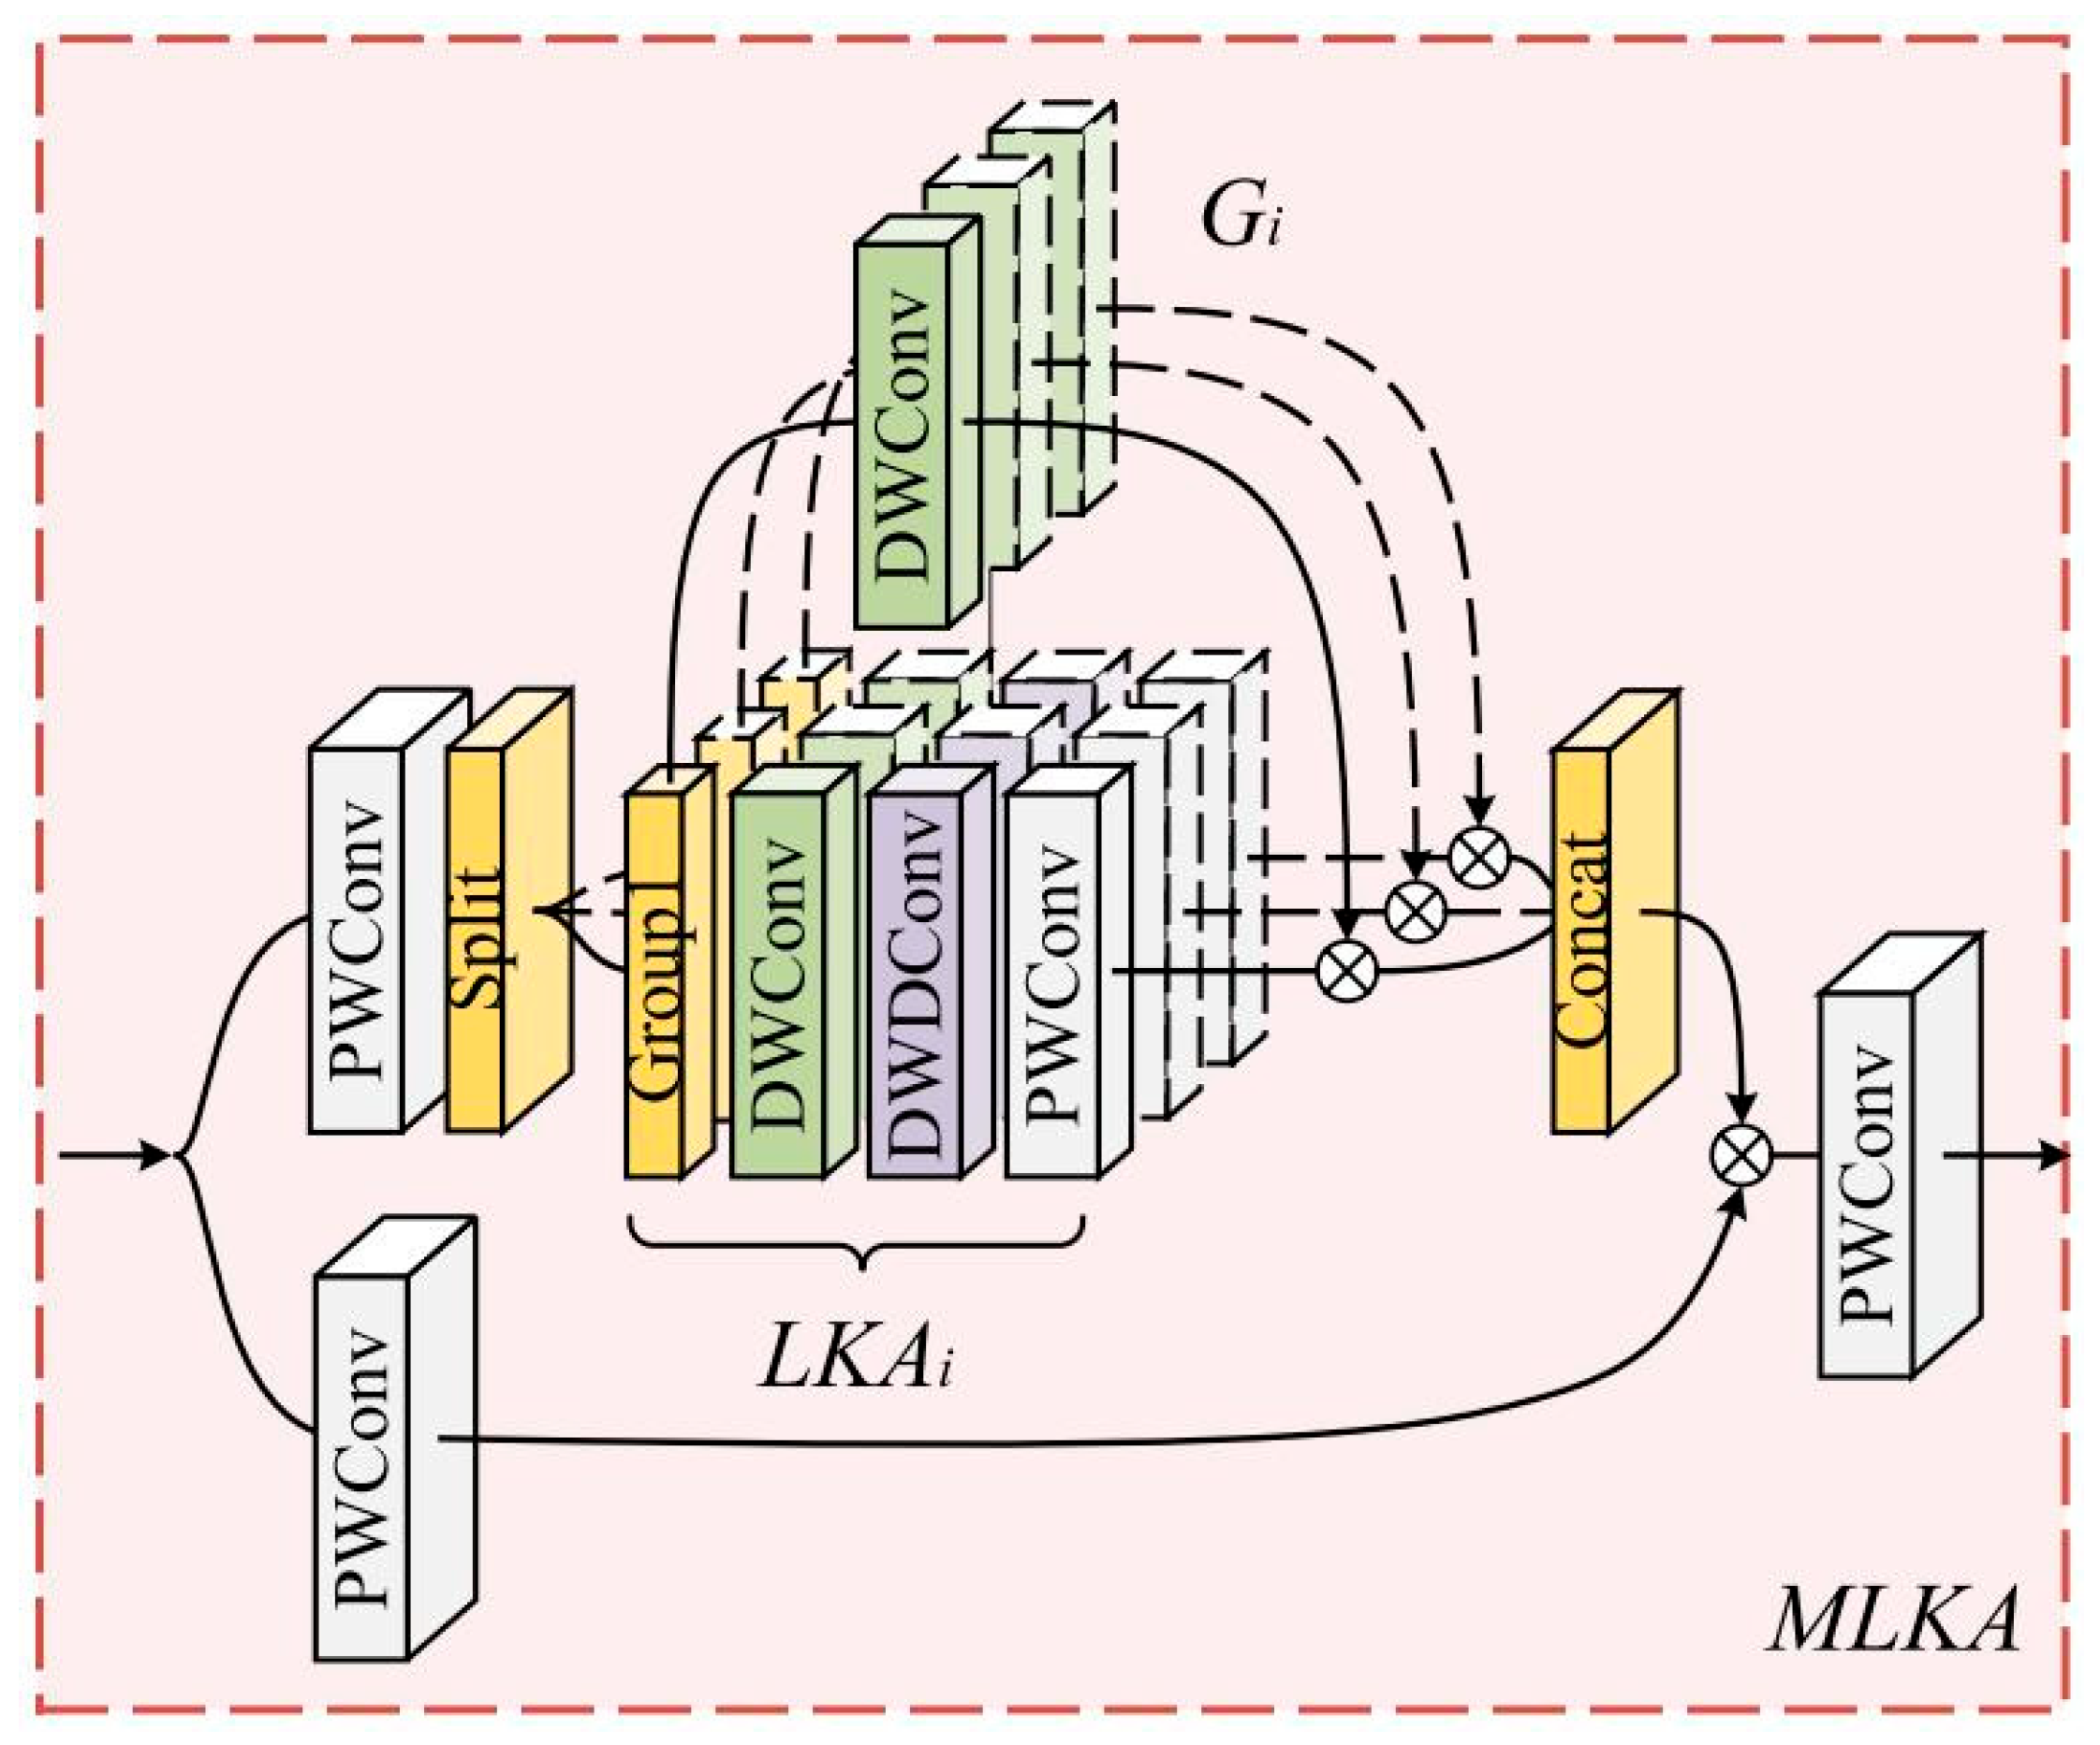
2.2.4. LKASPP (Large Kernel Attentions Spatial Pyramid Pooling)
3. Results
4. Discussion and Potential Future Works
4.1. Discussion
4.2. Potential Future Works
5. Conclusions
Author Contributions
Funding
Institutional Review Board Statement
Informed Consent Statement
Data Availability Statement
Conflicts of Interest
References
- Thornton, P.K. Livestock production: Recent trends, future prospects. Philos. Trans. R. Soc. B Biol. Sci. 2010, 365, 2853–2867. [Google Scholar] [CrossRef] [PubMed]
- Harris, P.; Brunsdon, C.; Charlton, M. Geographically weighted principal components analysis. Int. J. Geogr. Inf. Sci. 2011, 25, 1717–1736. [Google Scholar] [CrossRef]
- Quanqin, S.; Xingjian, G.; Yuzhe, L.; Yangchun, W.; Dongliang, W.; Jiyuan, L.; Jiangwen, F.; Fan, Y. Using UAV remote sensing to analyze the population and distribution of large wild herbivores. Natl. Remote Sens. Bull. 2021, 22, 497–507. [Google Scholar]
- Wang, D.; Shao, Q.; Yue, H.J.R.S. Surveying wild animals from satellites, manned aircraft and unmanned aerial systems (UASs): A review. Remote Sens. 2019, 11, 1308. [Google Scholar] [CrossRef]
- Cao, N.; Xi, R.N.; He, L.N.; Li, Y.K.; Gao, Q.H.; Su, Q.; Lyu, W. Application Prospects and Challenges of Drones in Animal Husbandry. Today’s Anim. Husb. Vet. Med. 2023, 39, 53–55. [Google Scholar] [CrossRef]
- Gonzalez, L.F.; Montes, G.A.; Puig, E.; Johnson, S.; Mengersen, K.; Gaston, K.J. Unmanned aerial vehicles (UAVs) and artificial intelligence revolutionizing wildlife monitoring and conservation. Sensors 2016, 16, 97. [Google Scholar] [CrossRef]
- Liu, C.-C.; Chen, Y.-H.; Wen, H.-L. Supporting the annual international black-faced spoonbill census with a low-cost unmanned aerial vehicle. Ecol. Inform. 2015, 30, 170–178. [Google Scholar] [CrossRef]
- LaRue, M.A.; Stapleton, S.; Porter, C.; Atkinson, S.; Atwood, T.; Dyck, M.; Lecomte, N. Testing methods for using high-resolution satellite imagery to monitor polar bear abundance and distribution. Wildl. Soc. Bull. 2015, 39, 772–779. [Google Scholar] [CrossRef]
- Xue, Y.; Wang, T.; Skidmore, A.K. Automatic counting of large mammals from very high resolution panchromatic satellite imagery. Remote Sens. 2017, 9, 878. [Google Scholar] [CrossRef]
- Torney, C.J.; Dobson, A.P.; Borner, F.; Lloyd-Jones, D.J.; Moyer, D.; Maliti, H.T.; Mwita, M.; Fredrick, H.; Borner, M.; Hopcraft, J.G.C. Assessing rotation-invariant feature classification for automated wildebeest population counts. PLoS ONE 2016, 11, e0156342. [Google Scholar] [CrossRef]
- Rey, N.; Volpi, M.; Joost, S.; Tuia, D. Detecting animals in African Savanna with UAVs and the crowds. Remote Sens. Environ. 2017, 200, 341–351. [Google Scholar] [CrossRef]
- Christiansen, P.; Steen, K.A.; Jørgensen, R.N.; Karstoft, H. Automated detection and recognition of wildlife using thermal cameras. Sensors 2014, 14, 13778–13793. [Google Scholar] [CrossRef]
- Wüthrich, L.M. Counting Sheep in Aerial Imagery Under Adverse Conditions. Bachelor’s Thesis, University of Bern, Bern, Switzerland, 2025. [Google Scholar]
- Deng, X.-F.; Zhang, S.; Shao, Y.; Yan, X.-L. A real-time sheep counting detection system based on machine learning. INMATEH-Agric. Eng. 2022, 67, 85–94. [Google Scholar] [CrossRef]
- Cao, Y.; Chen, J.; Zhang, Z. A sheep dynamic counting scheme based on the fusion between an improved-sparrow-search YOLOv5x-ECA model and few-shot deepsort algorithm. Comput. Electron. Agric. 2023, 206, 107696. [Google Scholar] [CrossRef]
- Yu, Z.; Liu, Y.; Yu, S.; Wang, R.; Song, Z.; Yan, Y.; Li, F.; Wang, Z.; Tian, F. Automatic detection method of dairy cow feeding behaviour based on YOLO improved model and edge computing. Sensors 2022, 22, 3271. [Google Scholar] [CrossRef]
- Zhi, W.; Haixin, L.; Zhiqiang, Z. CSD-YOLOv8s: Dense Sheep Small Target Detection Model Based on UAV Images. Smart Agric. 2024, 6, 42. [Google Scholar]
- Sikora, P.; Malina, L.; Kiac, M.; Martinasek, Z.; Riha, K.; Prinosil, J.; Jirik, L.; Srivastava, G. Artificial intelligence-based surveillance system for railway crossing traffic. IEEE Sens. J. 2020, 21, 15515–15526. [Google Scholar] [CrossRef]
- Redmon, J.; Divvala, S.; Girshick, R.; Farhadi, A. You only look once: Unified, real-time object detection. In Proceedings of the IEEE Conference on Computer Vision and Pattern Recognition, Las Vegas, NV, USA, 27–30 June 2016; pp. 779–788. [Google Scholar]
- Wang, C.-Y.; Bochkovskiy, A.; Liao, H.-Y.M. YOLOv7: Trainable bag-of-freebies sets new state-of-the-art for real-time object detectors. In Proceedings of the IEEE/CVF Conference on Computer Vision and Pattern Recognition, Vancouver, BC, Canada, 17–24 June 2023; pp. 7464–7475. [Google Scholar]
- Zhu, X.; Lyu, S.; Wang, X.; Zhao, Q. TPH-YOLOv5: Improved YOLOv5 based on transformer prediction head for object detection on drone-captured scenarios. In Proceedings of the IEEE/CVF International Conference on Computer Vision, Montreal, BC, Canada, 11–17 October 2021; pp. 2778–2788. [Google Scholar]
- Li, X.; Wei, Y.; Li, J.; Duan, W.; Zhang, X.; Huang, Y. Improved YOLOv7 algorithm for small object detection in unmanned aerial vehicle image scenarios. Appl. Sci. 2024, 14, 1664. [Google Scholar] [CrossRef]
- Wang, W.; Chen, J.; Huang, Z.; Yuan, H.; Li, P.; Jiang, X.; Wang, X.; Zhong, C.; Lin, Q. Improved YOLOv7-based algorithm for detecting foreign objects on the roof of a subway vehicle. Sensors 2023, 23, 9440. [Google Scholar] [CrossRef] [PubMed]
- Cai, S.; Zhang, X.; Mo, Y. A Lightweight underwater detector enhanced by Attention mechanism, GSConv and WIoU on YOLOv8. Sci. Rep. 2024, 14, 25797. [Google Scholar] [CrossRef] [PubMed]
- Tong, Z.; Chen, Y.; Xu, Z.; Yu, R. Wise-IoU: Bounding box regression loss with dynamic focusing mechanism. arXiv 2023, arXiv:2301.10051. [Google Scholar]
- Wang, Y.; Li, Y.; Wang, G.; Liu, X. Multi-scale attention network for single image super-resolution. In Proceedings of the IEEE/CVF Conference on Computer Vision and Pattern Recognition, Seattle, WA, USA, 16–22 June 2024; pp. 5950–5960. [Google Scholar]
- Girshick, R. Fast r-cnn. In Proceedings of the IEEE International Conference on Computer Vision, Santiago, Chile, 7–13 December 2015; pp. 1440–1448. [Google Scholar]
- Duan, K.; Bai, S.; Xie, L.; Qi, H.; Huang, Q.; Tian, Q. Centernet: Keypoint triplets for object detection. In Proceedings of the IEEE/CVF International Conference on Computer Vision, Seoul, Republic of Korea, 27 October–2 November 2019; pp. 6569–6578. [Google Scholar]


| Datasets | Animal Patches |
|---|---|
| Training | 3560 |
| Validation | 396 |
| Testing | 440 |
| Total | 4396 |
| Category | Min Width | Max Width | Average Width | Min Height | Max Height | Average Height | Average Area | Number |
|---|---|---|---|---|---|---|---|---|
| cattle | 5.0 | 87.0 | 35.71 | 6.0 | 82.0 | 37.67 | 1453.64 | 20,486 |
| sheep | 3.0 | 61.0 | 20.04 | 1.0 | 59.0 | 20.89 | 424.73 | 74,753 |
| horse | 8.0 | 83.0 | 37.16 | 7.0 | 82.0 | 39.71 | 1453.65 | 2788 |
| Prediction Head | Feature Graph | Anchor Size |
|---|---|---|
| P2 | 160 × 160 | (11, 6) (8, 9) (7.5, 14) |
| P3 | 80 × 80 | (16, 8) (15, 11) (12,14) |
| P4 | 40 × 40 | (18, 16) (13, 22) (28, 27) |
| Model | Category | AP@0.5 (%) | F1 | Recall (%) | Precision (%) | mAP (%) | Parameters (M) | GFLOPS (G) |
|---|---|---|---|---|---|---|---|---|
| YOLOv7 | cattle | 93.18 | 0.93 | 91.43 | 93.72 | 91.86 | 37.620 | 106.472 |
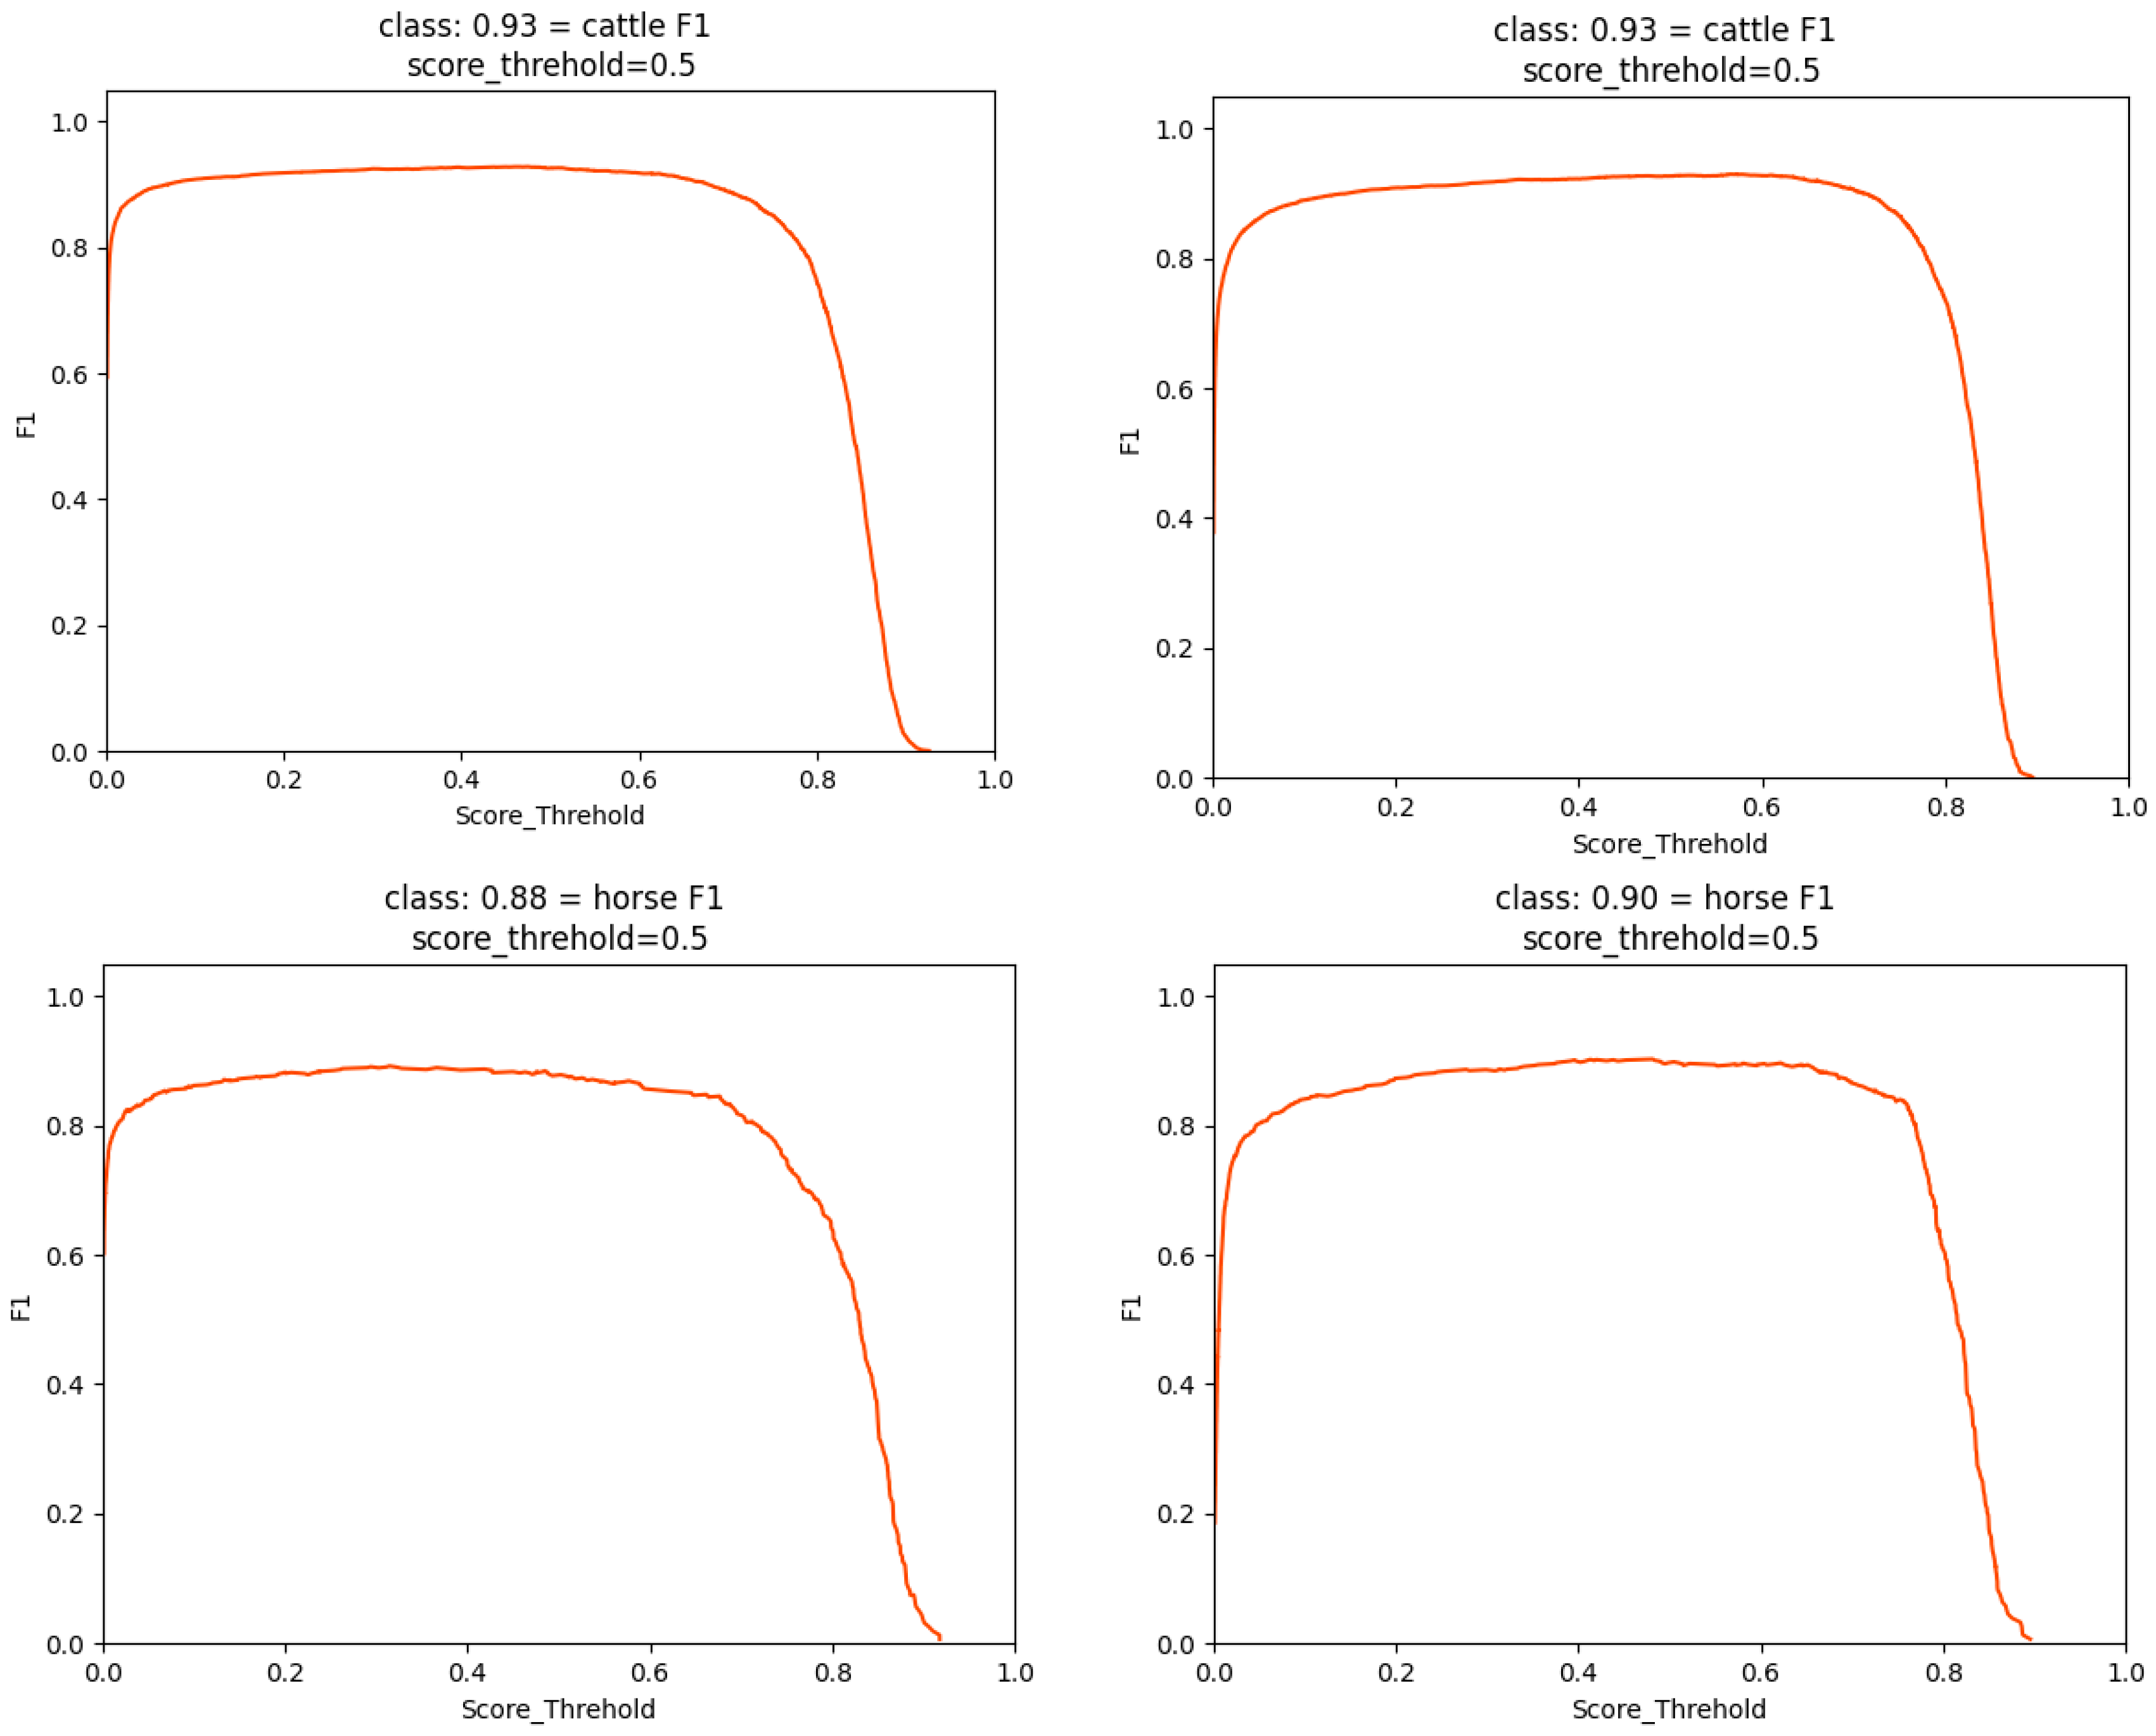
| horse | 90.57 | 0.88 | 83.12 | 93.09 | ||||
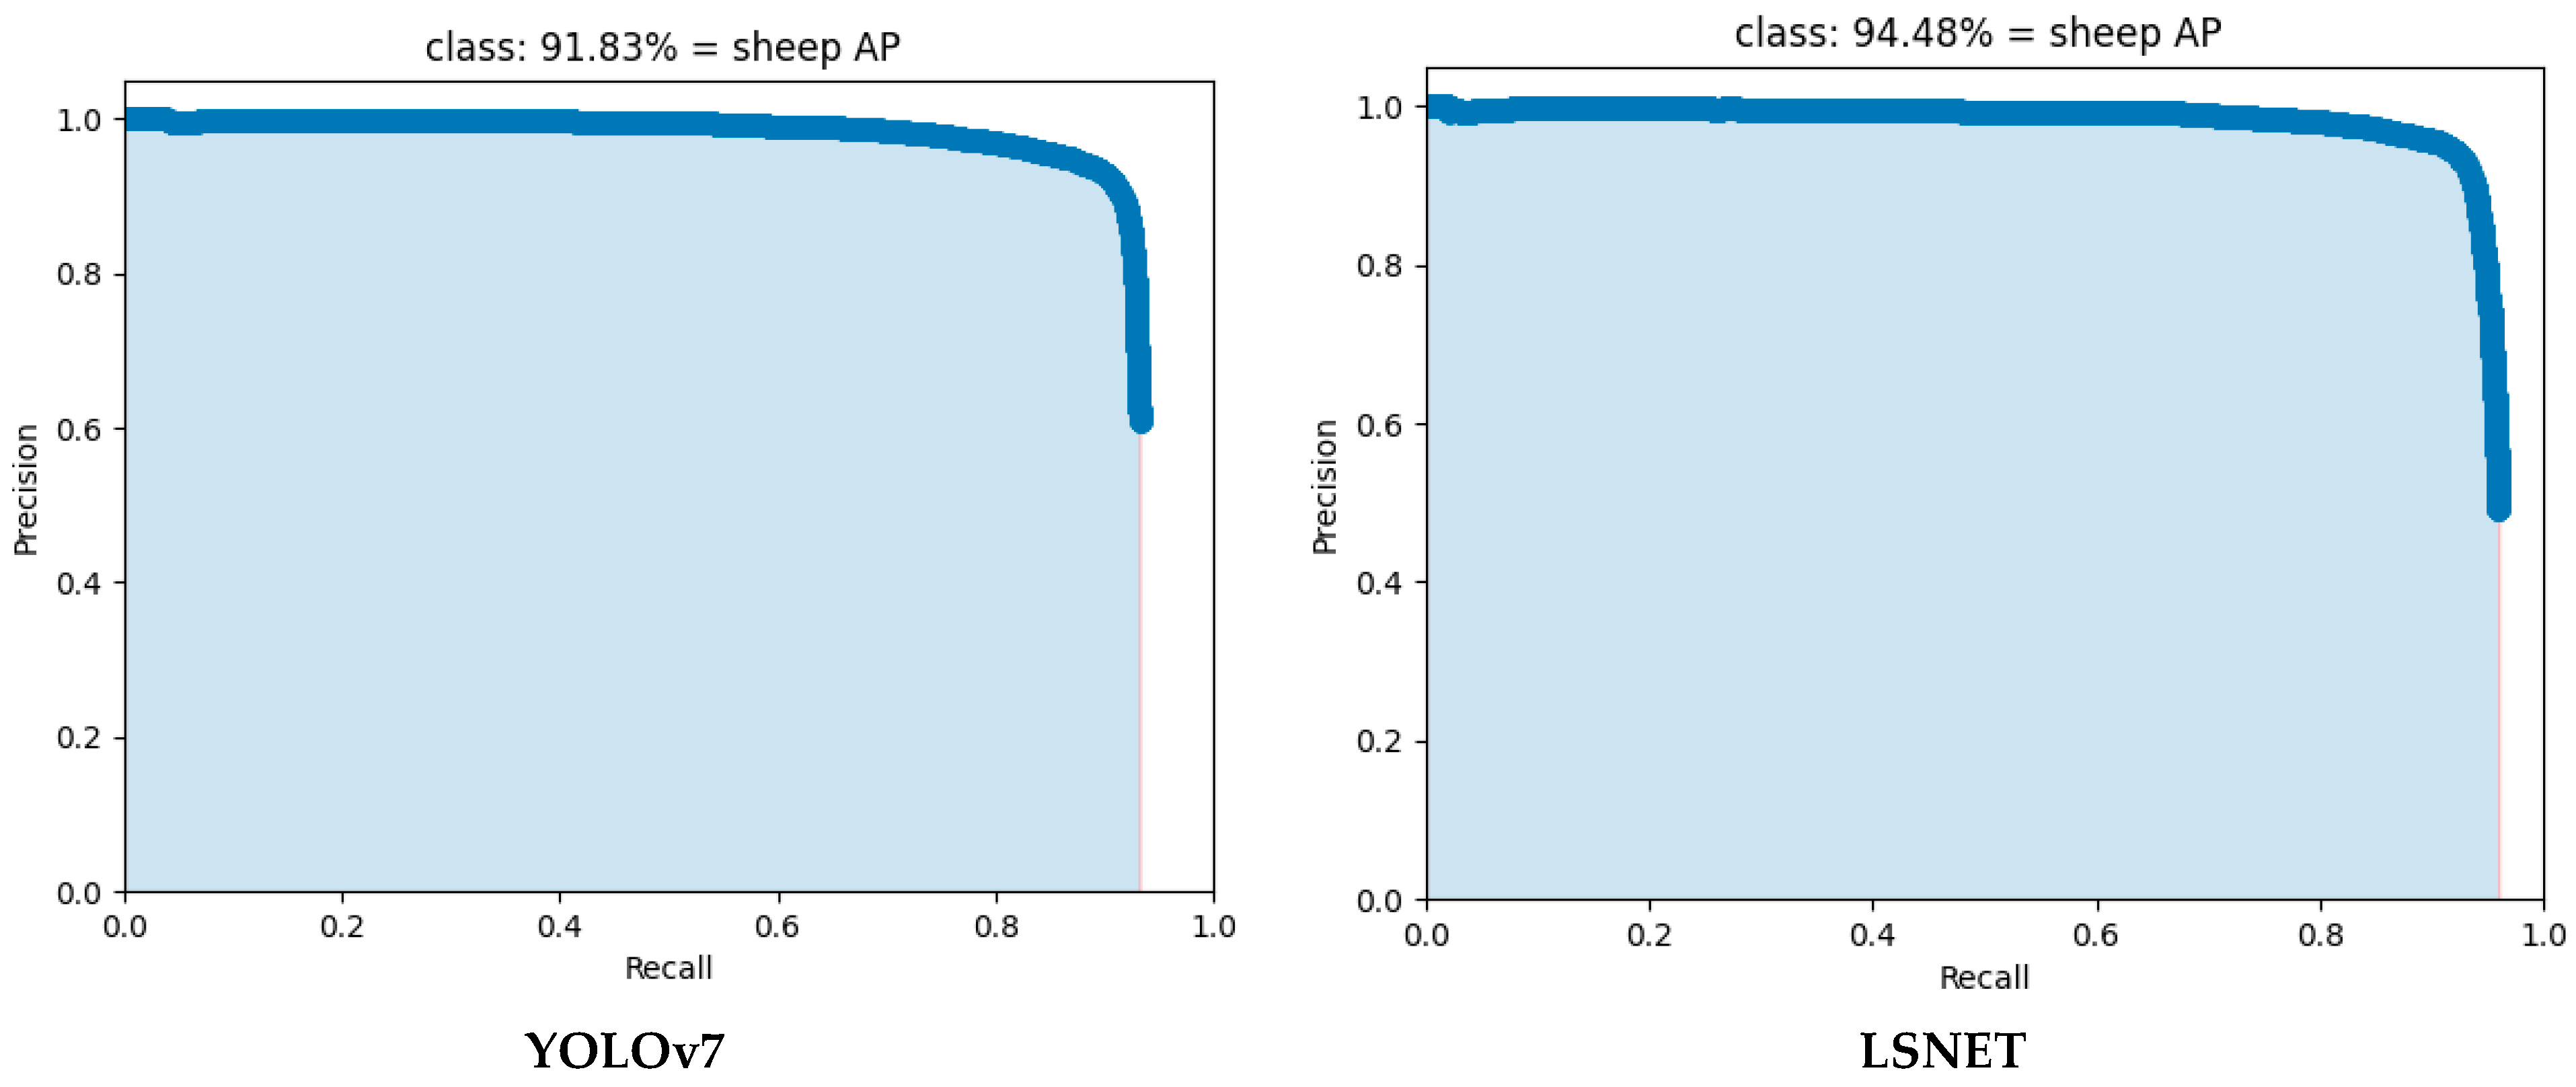
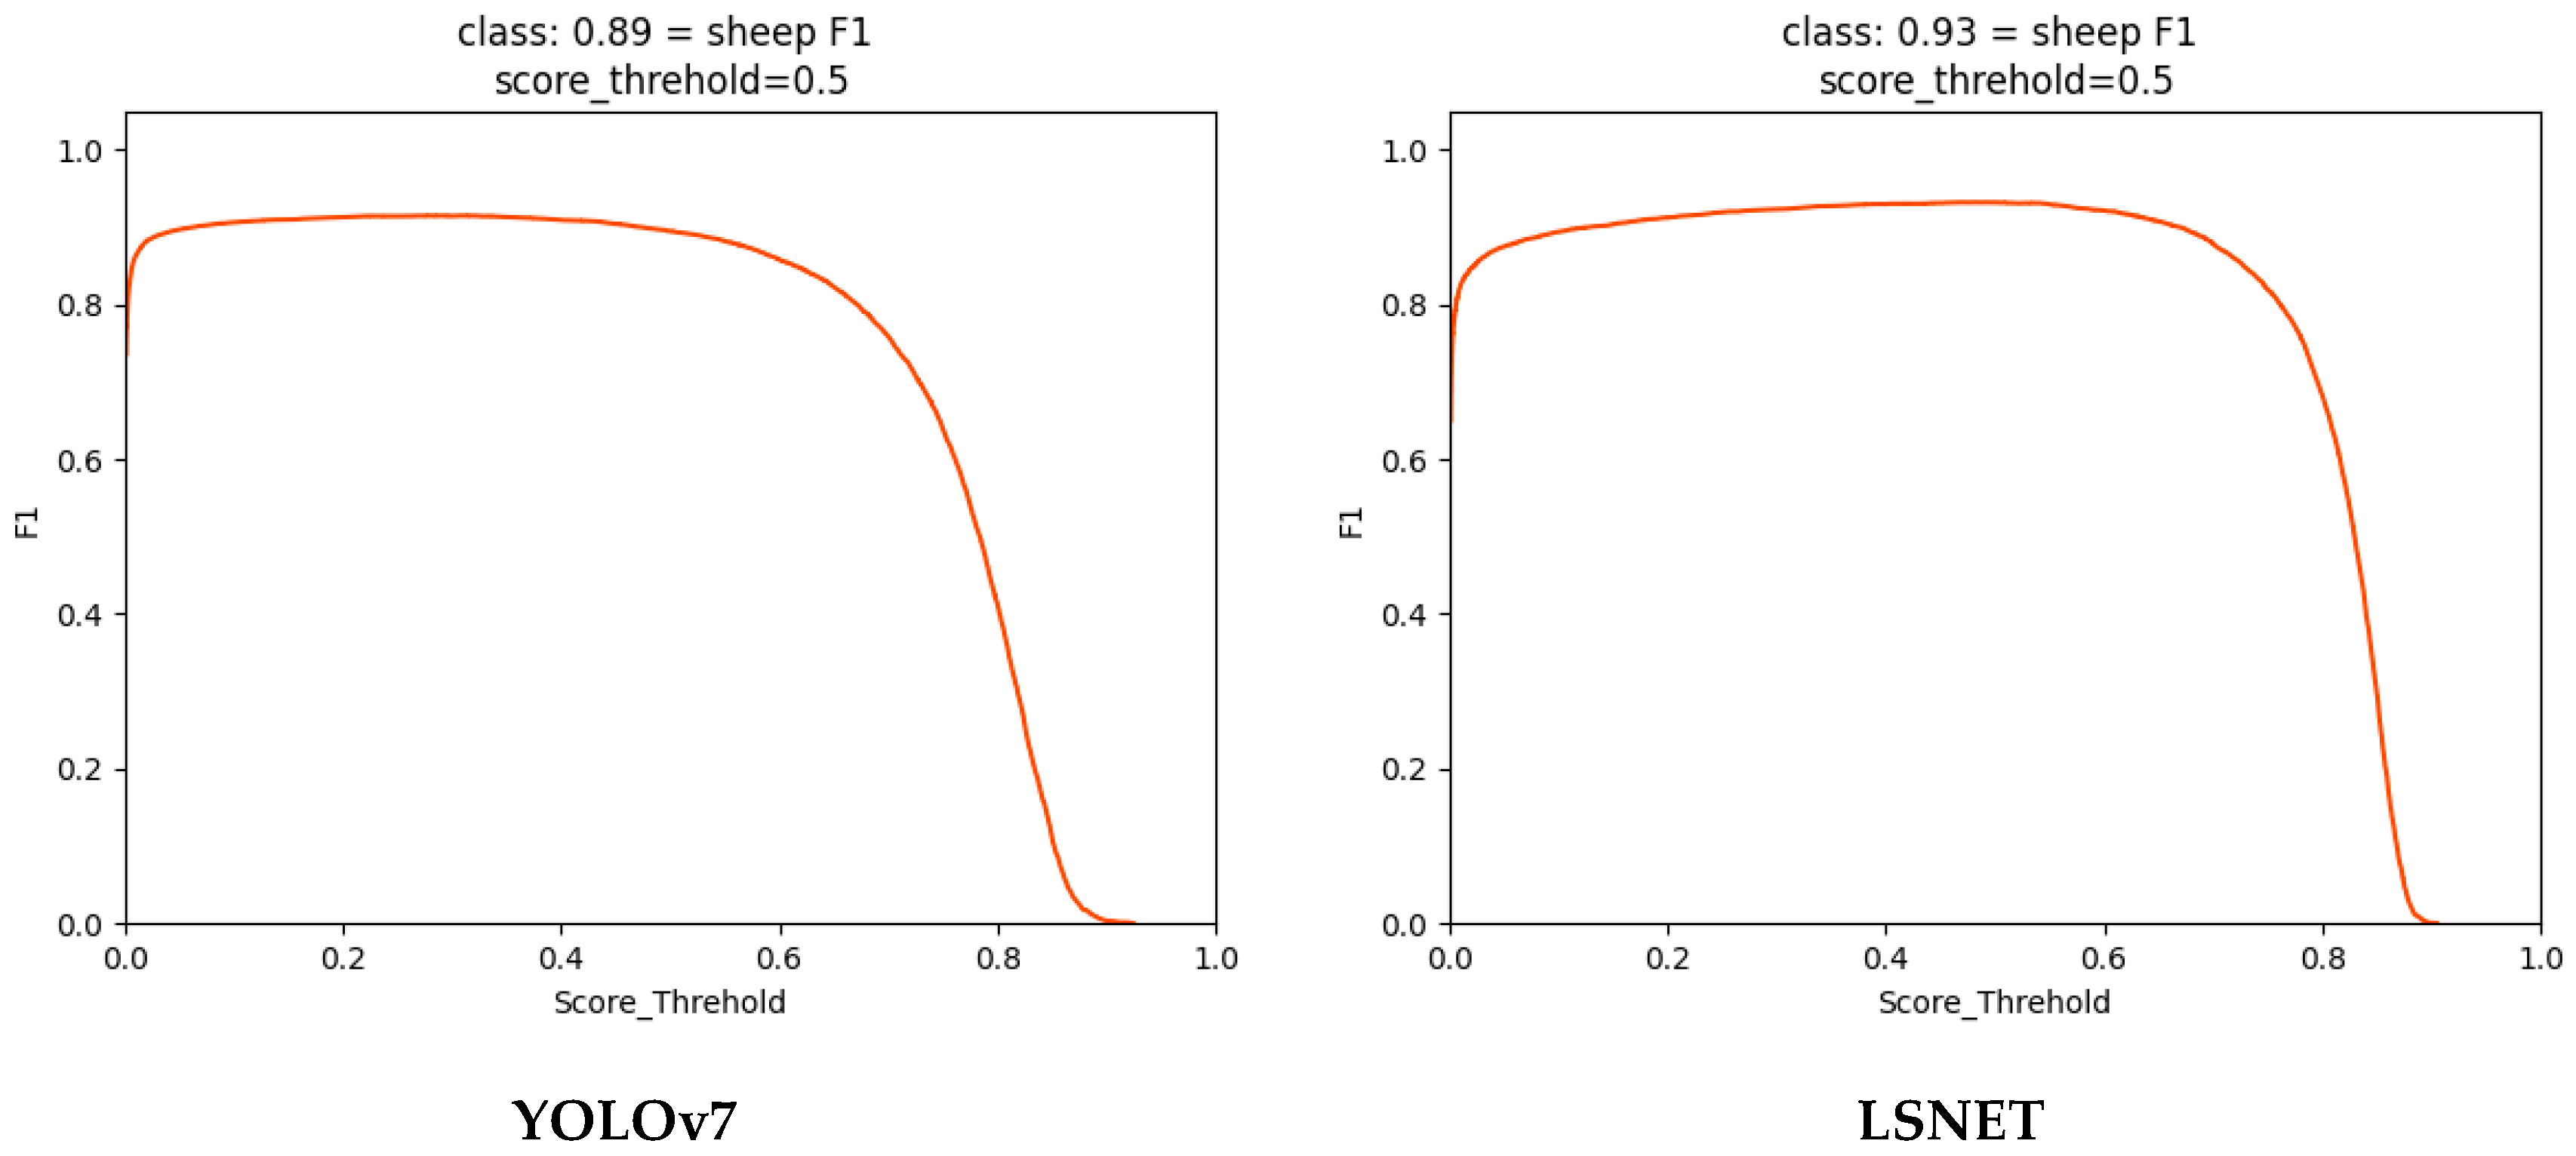
| sheep | 91.83 | 0.89 | 83.87 | 95.79 | ||||
| YOLOv7 + remove YOLOv7-P5 | cattle | 93.53 | 0.93 | 91.81 | 94.39 | 91.79 | 26.338 | 98.120 |
| horse | 90.20 | 0.89 | 82.14 | 92.67 | ||||
| sheep | 91.65 | 0.90 | 84.21 | 95.94 | ||||
| YOLOv7 + P2 | cattle | 93.23 | 0.93 | 93.91 | 92.60 | 92.12 | 38.20 | 123.122 |
| horse | 89.33 | 0.89 | 88.38 | 89.96 | ||||
| sheep | 93.80 | 0.93 | 90.49 | 94.70 | ||||
| YOLOv7 + remove YOLOv7-P5 + P2 | cattle | 93.89 | 0.93 | 93.12 | 92.78 | 92.40 | 26.920 | 113.928 |
| horse | 88.72 | 0.89 | 85.71 | 92.96 | ||||
| sheep | 94.60 | 0.93 | 91.39 | 95.06 | ||||
| YOLOv7 + remove YOLOv7-P5 + P2 + LKASPP | cattle | 93.72 | 0.93 | 93.25 | 92.12 | 93.10 | 26.247 | 113.385 |
| horse | 91.33 | 0.90 | 88.37 | 90.78 | ||||
| sheep | 94.24 | 0.93 | 9.34 | 95.03 | ||||
| YOLOv7 + remove YOLOv7-P5 + P2 + LKASPP +WIoU v3(LSNET) | cattle | 93.79 | 0.93 | 92.79 | 92.51 | 93.33 | 26.247 | 113.385 |
| horse | 91.71 | 0.90 | 89.37 | 90.27 | ||||
| sheep | 94.48 | 0.93 | 91.75 | 94.59 |
| Model | Category | AP@0.5 (%) | F1 | Recall (%) | Precision (%) | mAP (%) | Parameters (M) |
|---|---|---|---|---|---|---|---|
| Faster R-CNN | cattle | 32.97 | 0.45 | 53.38 | 38.99 | 19.61 | 28.3 |
| horse | 23.59 | 0.38 | 49.80 | 30.49 | |||
| sheep | 2.28 | 0.09 | 5.17 | 30.70 | |||
| Centernet | cattle | 64.17 | 0.50 | 34.68 | 89.43 | 53.38 | 32.665 |
| horse | 44.82 | 0.13 | 74.17 | 85.19 | |||
| sheep | 48.86 | 0.56 | 43.13 | 81.36 | |||
| YOLOv5 | cattle | 92.65 | 0.92 | 90.61 | 93.23 | 89.89 | 47.057 |
| horse | 88.01 | 0.88 | 85.27 | 90.22 | |||
| sheep | 89.02 | 0.88 | 82.10 | 95.15 | |||
| YOLOv7_X | cattle | 93.31 | 0.93 | 91.96 | 93.94 | 92.09 | 71.344 |
| horse | 90.37 | 0.89 | 88.31 | 90.67 | |||
| sheep | 92.58 | 0.91 | 86.20 | 92.09 | |||
| LSNET | cattle | 93.79 | 0.93 | 92.79 | 92.51 | 93.33 | 26.247 |
| horse | 91.71 | 0.90 | 89.37 | 90.27 | |||
| sheep | 94.48 | 0.93 | 91.75 | 94.59 |
Disclaimer/Publisher’s Note: The statements, opinions and data contained in all publications are solely those of the individual author(s) and contributor(s) and not of MDPI and/or the editor(s). MDPI and/or the editor(s) disclaim responsibility for any injury to people or property resulting from any ideas, methods, instructions or products referred to in the content. |
© 2025 by the authors. Licensee MDPI, Basel, Switzerland. This article is an open access article distributed under the terms and conditions of the Creative Commons Attribution (CC BY) license (https://creativecommons.org/licenses/by/4.0/).
Share and Cite
Chen, W.; Wang, D.; Xie, X. An Efficient Algorithm for Small Livestock Object Detection in Unmanned Aerial Vehicle Imagery. Animals 2025, 15, 1794. https://doi.org/10.3390/ani15121794
Chen W, Wang D, Xie X. An Efficient Algorithm for Small Livestock Object Detection in Unmanned Aerial Vehicle Imagery. Animals. 2025; 15(12):1794. https://doi.org/10.3390/ani15121794
Chicago/Turabian StyleChen, Wenbo, Dongliang Wang, and Xiaowei Xie. 2025. "An Efficient Algorithm for Small Livestock Object Detection in Unmanned Aerial Vehicle Imagery" Animals 15, no. 12: 1794. https://doi.org/10.3390/ani15121794
APA StyleChen, W., Wang, D., & Xie, X. (2025). An Efficient Algorithm for Small Livestock Object Detection in Unmanned Aerial Vehicle Imagery. Animals, 15(12), 1794. https://doi.org/10.3390/ani15121794