
Polymorphisms of CYP7A1 and HADHB Genes and Their Effects on Milk Production Traits in Chinese Holstein Cows


Abstract
Simple Summary
Abstract
1. Introduction
2. Materials and Methods
2.1. Animal Selection and Phenotypic Data Collection
2.2. Genomic DNA Extraction
2.3. Identification and Genotyping of SNPs in Candidate Genes
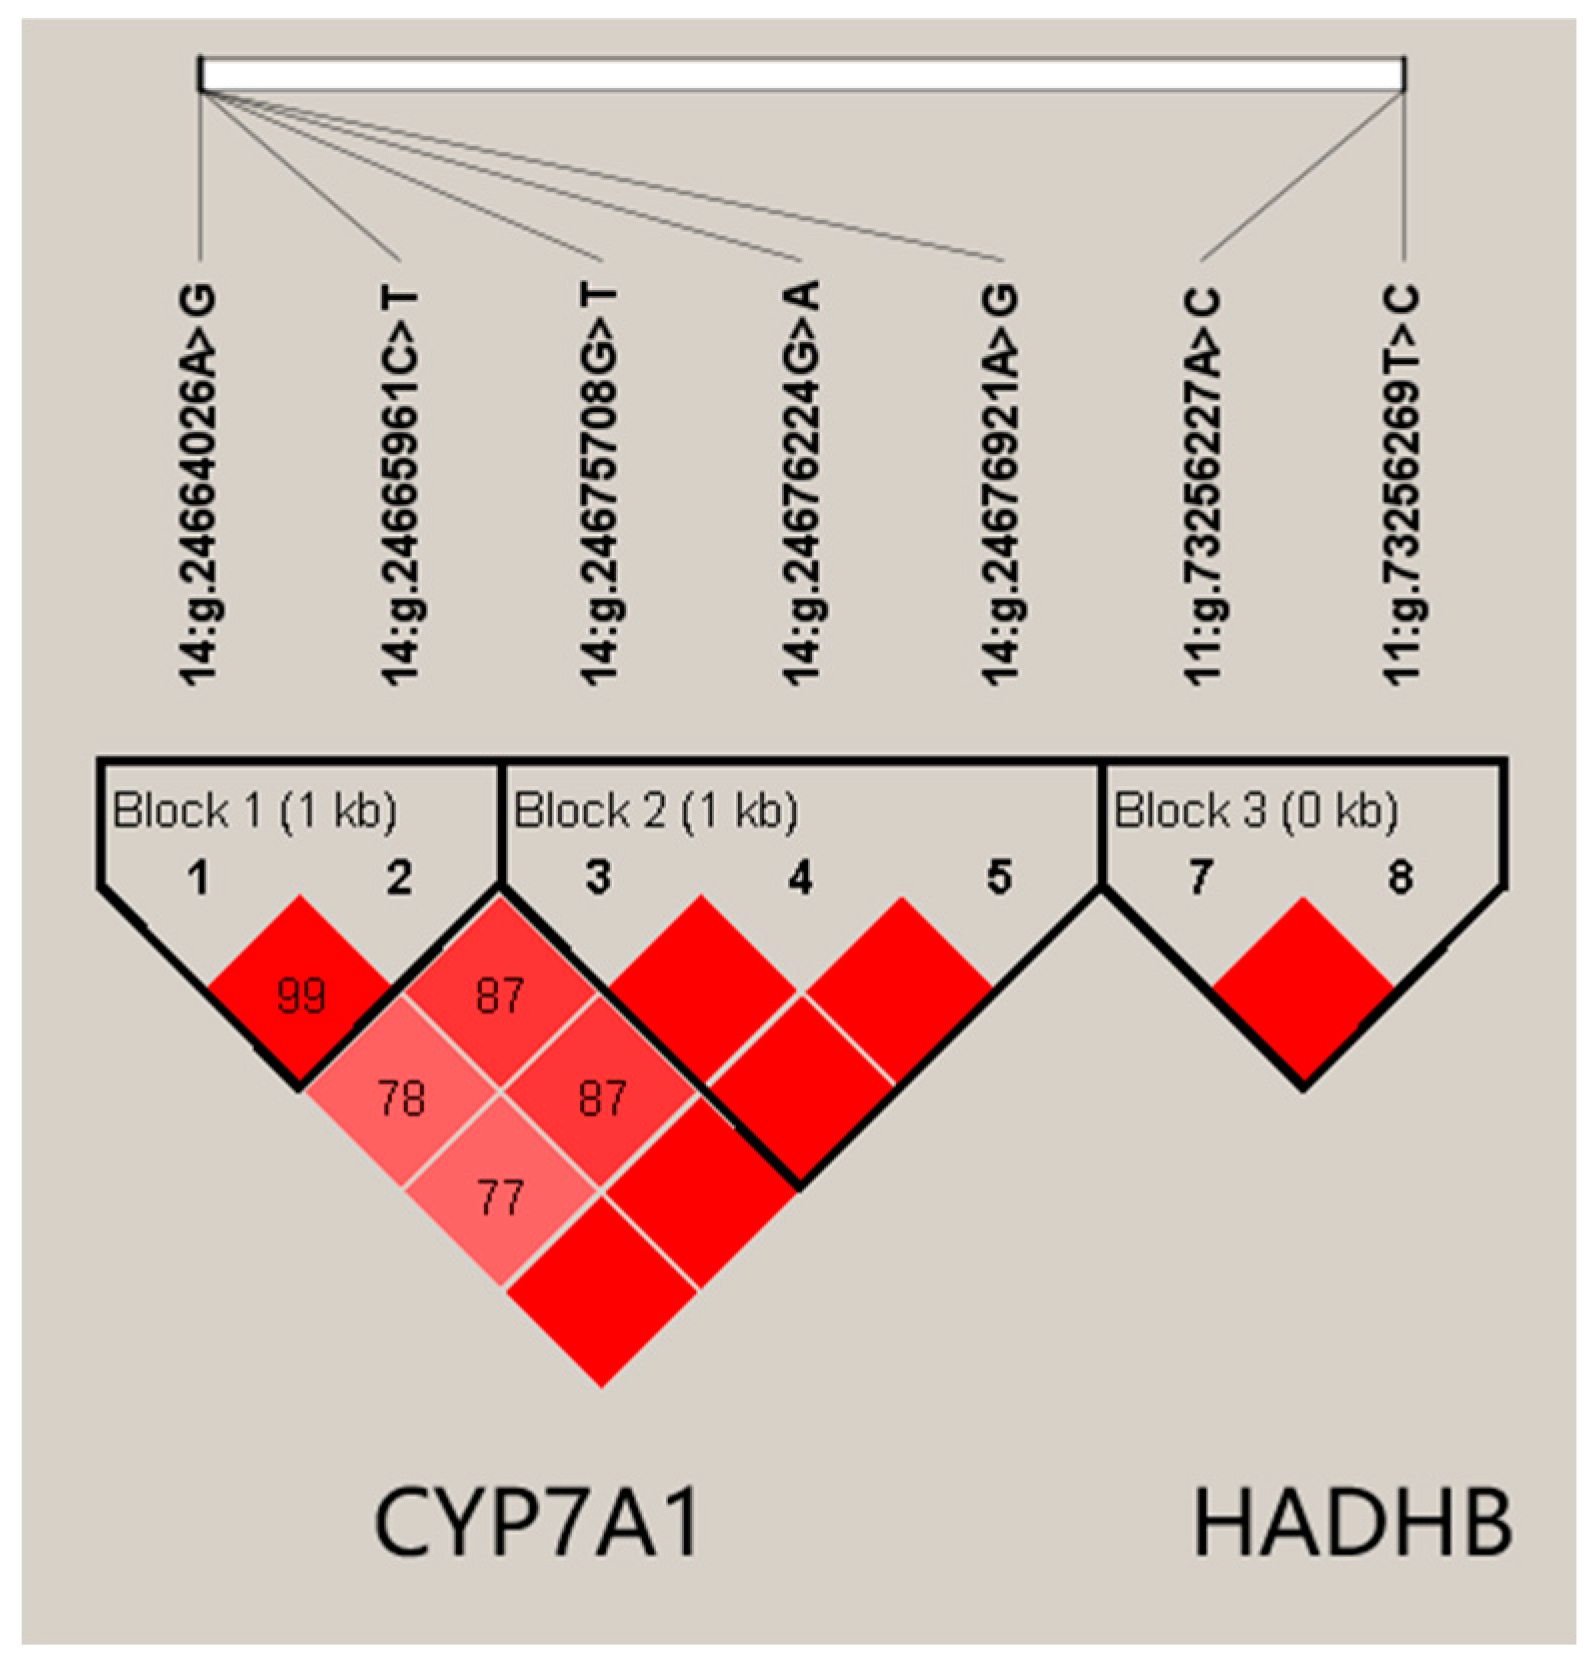
2.4. Linkage Disequilibrium (LD) Estimation
2.5. Association Analysis between SNP/Haplotype and Milk-Production Traits
2.6. Prediction of Transcription Factor Binding Sites
2.7. Prediction of mRNA Structure
3. Results
3.1. SNPs Identification
3.2. Single-Marker Association Analysis
3.3. Haplotype Association Analysis
3.4. Changes of Transcription Factor Binding Sites Caused by SNPs in 5′ Region
3.5. mRNA Structural Stability Altered by the Mutation in Untranslated Region
4. Discussion
5. Conclusions
Supplementary Materials
Author Contributions
Funding
Institutional Review Board Statement
Informed Consent Statement
Data Availability Statement
Acknowledgments
Conflicts of Interest
References
- Pereira, P.C. Milk nutritional composition and its role in human health. Nutrition 2014, 30, 619–627. [Google Scholar] [CrossRef]
- Khaw, K.-T.; Friesen, M.D.; Riboli, E.; Luben, R.; Wareham, N. Plasma phospholipid fatty acid concentration and incident coronary heart disease in men and women: The EPIC-Norfolk prospective study. PLoS Med. 2012, 9, e1001255. [Google Scholar] [CrossRef]
- Vignal, A.; Milan, D.; SanCristobal, M.; Eggen, A. A review on SNP and other types of molecular markers and their use in animal genetics. Genet. Sel. Evol. 2002, 34, 275–305. [Google Scholar] [CrossRef] [PubMed]
- Lalonde, E.; Ha, K.C.; Wang, Z.; Bemmo, A.; Kleinman, C.L.; Kwan, T.; Pastinen, T.; Majewski, J. RNA sequencing reveals the role of splicing polymorphisms in regulating human gene expression. Genome Res. 2011, 21, 545–554. [Google Scholar] [CrossRef] [PubMed]
- Gong, J.; Tong, Y.; Zhang, H.M.; Wang, K.; Hu, T.; Shan, G.; Sun, J.; Guo, A.Y. Genome-wide identification of SNPs in microRNA genes and the SNP effects on microRNA target binding and biogenesis. Hum. Mutat. 2012, 33, 254–263. [Google Scholar] [CrossRef]
- Raven, L.-A.; Cocks, B.G.; Pryce, J.E.; Cottrell, J.J.; Hayes, B.J. Genes of the RNASE5 pathway contain SNP associated with milk production traits in dairy cattle. Genet. Sel. Evol. 2013, 45, 25. [Google Scholar] [CrossRef]
- Fang, M.; Fu, W.; Jiang, D.; Zhang, Q.; Sun, D.; Ding, X.; Liu, J. A multiple-SNP approach for genome-wide association study of milk production traits in Chinese Holstein cattle. PLoS ONE 2014, 9, e99544. [Google Scholar] [CrossRef]
- Ibeagha-Awemu, E.M.; Peters, S.O.; Akwanji, K.A.; Imumorin, I.G.; Zhao, X. High density genome wide genotyping-by-sequencing and association identifies common and low frequency SNPs, and novel candidate genes influencing cow milk traits. Sci. Rep. 2016, 6, 31109. [Google Scholar] [CrossRef]
- Pasandideh, M.; Mohammadabadi, M.; Esmailizadeh, A.; Tarang, A. Association of bovine PPARGC1A and OPN genes with milk production and composition in Holstein cattle. Czech J. Anim. Sci. 2015, 60, 97–104. [Google Scholar] [CrossRef]
- MacLeod, I.; Bowman, P.; Vander Jagt, C.; Haile-Mariam, M.; Kemper, K.; Chamberlain, A.; Schrooten, C.; Hayes, B.J.; Goddard, M.E. Exploiting biological priors and sequence variants enhances QTL discovery and genomic prediction of complex traits. BMC Genom. 2016, 17, 144. [Google Scholar] [CrossRef]
- Xu, L.; Shi, L.; Liu, L.; Liang, R.; Li, Q.; Li, J.; Han, B.; Sun, D. Analysis of liver proteome and identification of critical proteins affecting milk fat, protein, and lactose metabolism in dariy cattle with Itraq. Proteomics 2019, 19, 1800387. [Google Scholar] [CrossRef]
- Pullinger, C.R.; Eng, C.; Salen, G.; Shefer, S.; Batta, A.K.; Erickson, S.K.; Verhagen, A.; Rivera, C.R.; Mulvihill, S.J.; Malloy, M.J.; et al. Human cholesterol 7α-hydroxylase (CYP7A1) deficiency has a hypercholesterolemic phenotype. J. Clin. Investig. 2002, 110, 109–117. [Google Scholar] [CrossRef]
- Das, A.M.; Illsinger, S.; Lucke, T.; Hartmann, H.; Ruiter, J.P.; Steuerwald, U.; Waterham, H.R.; Duran, M.; Wanders, R.J.J.C.c. Isolated mitochondrial long-chain ketoacyl-CoA thiolase deficiency resulting from mutations in the HADHB gene. Clin. Chem. 2006, 52, 530–534. [Google Scholar] [CrossRef]
- Zhang, Q.; Boichard, D.; Hoeschele, I.; Ernst, C.; Eggen, A.; Murkve, B.; Pfister-Genskow, M.; Witte, L.A.; Grignola, F.E.; Uimari, P. Mapping quantitative trait loci for milk production and health of dairy cattle in a large outbred pedigree. Genetics 1998, 149, 1959–1973. [Google Scholar] [CrossRef]
- Boichard, D.; Grohs, C.; Bourgeois, F.; Cerqueira, F.; Faugeras, R.; Neau, A.; Rupp, R.; Amigues, Y.; Boscher, M.Y.; Levéziel, H. Detection of genes influencing economic traits in three French dairy cattle breeds. Genet. Sel. Evol. 2003, 35, 77–101. [Google Scholar] [CrossRef]
- Kučerová, J.; Lund, M.; Sørensen, P.; Sahana, G.; Guldbrandtsen, B.; Nielsen, V.; Thomsen, B.; Bendixen, C. Multitrait quantitative trait loci mapping for milk production traits in Danish Holstein cattle. J. Dairy Sci. 2006, 89, 2245–2256. [Google Scholar] [CrossRef]
- Pedrosa, V.B.; Schenkel, F.S.; Chen, S.-Y.; Oliveira, H.R.; Casey, T.M.; Melka, M.G.; Brito, L.F. Genomewide association analyses of lactation persistency and milk production traits in Holstein cattle based on imputed whole-genome sequence data. Genes 2021, 12, 1830. [Google Scholar] [CrossRef]
- Wu, D.; Gu, M.; Wei, Z.; Bai, C.; Su, G.; Liu, X.; Zhao, Y.; Yang, L.; Li, G. Myostatin knockout regulates bile acid metabolism by promoting bile acid synthesis in cattle. Animals 2022, 12, 205. [Google Scholar] [CrossRef]
- Shao, F.; Wang, X.; Yu, J.; Shen, K.; Qi, C.; Gu, Z. Expression of miR-33 from an SREBP2 intron inhibits the expression of the fatty acid oxidation-regulatory genes CROT and HADHB in chicken liver. Br. Poult. Sci. 2019, 60, 115–124. [Google Scholar] [CrossRef]
- Cargill, M.; Altshuler, D.; Ireland, J.; Sklar, P.; Ardlie, K.; Patil, N.; Lane, C.R.; Lim, E.P.; Kalyanaraman, N.; Nemesh, J.; et al. Characterization of single-nucleotide polymorphisms in coding regions of human genes. Nat. Genet. 1999, 22, 231–238. [Google Scholar] [CrossRef]
- Kumar, V.; Westra, H.-J.; Karjalainen, J.; Zhernakova, D.V.; Esko, T.; Hrdlickova, B.; Almeida, R.; Zhernakova, A.; Reinmaa, E.; Võsa, U.; et al. Human disease-associated genetic variation impacts large intergenic non-coding RNA expression. PLoS Genet. 2013, 9, e1003201. [Google Scholar] [CrossRef]
- Ryan, B.M.; Robles, A.I.; Harris, C.C. Genetic variation in microRNA networks: The implications for cancer research. Nat. Rev. Cancer 2010, 10, 389–402. [Google Scholar] [CrossRef]
- Lango Allen, H.; Estrada, K.; Lettre, G.; Berndt, S.I.; Weedon, M.N.; Rivadeneira, F.; Willer, C.J.; Jackson, A.U.; Vedantam, S.; Raychaudhuri, S.; et al. Hundreds of variants clustered in genomic loci and biological pathways affect human height. Nature 2010, 467, 832–838. [Google Scholar] [CrossRef]
- Miglior, F.; Fleming, A.; Malchiodi, F.; Brito, L.F.; Martin, P.; Baes, C.F. A 100-Year Review: Identification and genetic selection of economically important traits in dairy cattle. J. Dairy Sci. 2017, 100, 10251–10271. [Google Scholar] [CrossRef]
- Gengler, N. Persistency of lactation yields: A review. Interbull Bull. 1996, 12, 87–96. [Google Scholar]
- Latchman, D.S. Transcription factors: An overview. Int. J. Biochem. Cell Biol. 1997, 29, 1305–1312. [Google Scholar] [CrossRef]
- Orso, F.; Corà, D.; Ubezio, B.; Provero, P.; Caselle, M.; Taverna, D. Identification of functional TFAP2A and SP1 binding sites in new TFAP2A-modulated genes. BMC Genom. 2010, 11, 355. [Google Scholar] [CrossRef]
- Oo, J.A.; Irmer, B.; Günther, S.; Warwick, T.; Pálfi, K.; Izquierdo Ponce, J.; Teichmann, T.; Pflüger-Müller, B.; Gilsbach, R.; Brandes, R.P.; et al. ZNF354C is a transcriptional repressor that inhibits endothelial angiogenic sprouting. Sci. Rep. 2020, 10, 19079. [Google Scholar] [CrossRef]
- Sabi, R.; Tuller, T. Modelling the efficiency of codon–tRNA interactions based on codon usage bias. DNA Res. 2014, 21, 511–526. [Google Scholar] [CrossRef]
- Hanson, G.; Coller, J. Codon optimality, bias and usage in translation and mRNA decay. Nat. Rev. Mol. Cell Biol. 2018, 19, 20–30. [Google Scholar] [CrossRef]

| Gene | SNP | rs ID | Gene Region | Genotype | Genotypic Frequency | Allele | Allelic Frequency |
|---|---|---|---|---|---|---|---|
| CYP7A1 | 14:g.24676921A>G | rs42765357 | 5′ flanking region | AA | 0.1341 | A | 0.3511 |
| AG | 0.4340 | G | 0.6489 | ||||
| GG | 0.4319 | ||||||
| 14:g.24676224G>A | rs109454495 | 5′ flanking region | AA | 0.3073 | A | 0.5433 | |
| AG | 0.4720 | G | 0.4567 | ||||
| GG | 0.2207 | ||||||
| 14:g.24675708G>T | rs42765359 | 5′ flanking region | GG | 0.3083 | G | 0.5444 | |
| GT | 0.4720 | T | 0.4566 | ||||
| TT | 0.2196 | ||||||
| 14:g.24665961C>T | rs108958186 | 3′ UTR | CC | 0.2218 | C | 0.4683 | |
| CT | 0.4931 | T | 0.5317 | ||||
| TT | 0.2851 | ||||||
| 14:g.24664026A>G | rs109680813 | 3′ flanking region | AA | 0.4298 | A | 0.6584 | |
| AG | 0.4572 | G | 0.3416 | ||||
| GG | 0.1130 | ||||||
| HADHB | 11:g.73256269T>C | rs110033443 | 5′ flanking region | CC | 0.6410 | C | 0.8031 |
| CT | 0.3242 | T | 0.1969 | ||||
| TT | 0.0348 | ||||||
| 11:g.73256227A>C | rs134856746 | 5′ UTR | AA | 0.0201 | A | 0.1605 | |
| AC | 0.2809 | C | 0.8395 | ||||
| CC | 0.6990 | ||||||
| 11:g.73242290C>T | rs137211407 | Intron | CC | 0.1373 | C | 0.2450 | |
| CT | 0.2154 | T | 0.7550 | ||||
| TT | 0.6473 |
| Gene | SNP | Lactation | Genotype (No.) | Milk Yield (kg) | Fat Yield (kg) | Fat Percentage (%) | Protein Yield (kg) | Protein Percentage (%) |
|---|---|---|---|---|---|---|---|---|
| CYP7A1 | 14:g.24676921A>G | 1 | AA (118) | 10,289 ± 64.59 | 345.06 ± 2.27 | 3.37 ± 0.03 | 306.85 ± 2.73 | 2.98 ± 0.01 |
| AG (391) | 10,308 ± 43.99 | 344.94 ± 1.55 | 3.36 ± 0.03 | 308.93 ± 2.17 | 2.30 ± 0.01 | |||
| GG (389) | 10,299 ± 43.98 | 345.75 ± 1.55 | 3.37 ± 0.03 | 308.37 ± 2.18 | 3.00 ± 0.01 | |||
| p value | 0.9512 | 0.8719 | 0.8957 | 0.6648 | 0.3686 | |||
| 2 | AA (79) | 11,067 A ± 103.8 | 396.65 A ± 4.38 | 3.59 ± 0.04 | 330.55 Aa ± 4.38 | 2.99 ± 0.01 | ||
| AG (272) | 10,660 B ± 69.92 | 378.52 B ± 3.10 | 3.56 ± 0.03 | 317.36 Bb ± 3.10 | 2.98 ± 0.01 | |||
| GG (260) | 10,717 B ± 71.91 | 383.4 B ± 3.17 | 3.59 ± 0.03 | 319.70 ABb ± 3.17 | 2.99 ± 0.01 | |||
| p value | 0.0003 | <0.0001 | 0.5719 | 0.0059 | 0.5828 | |||
| 14:g.24676224G>A | 1 | AA (278) | 10,287 ± 50.05 | 346.51 ± 1.73 | 3.38 ± 0.03 | 308.51 ± 2.31 | 3.01 ± 0.01 | |
| GA (422) | 10,277 ± 43.34 | 343.81 ± 1.49 | 3.36 ± 0.03 | 307.49 ± 2.15 | 2.99 ± 0.01 | |||
| GG (198) | 10,370 ± 53.54 | 346.97 ± 1.85 | 3.37 ± 0.03 | 310.12 ± 2.41 | 3.00 ± 0.01 | |||
| p value | 0.1972 | 0.1421 | 0.574 | 0.3774 | 0.2884 | |||
| 2 | AA (181) | 10,755 B ± 78.19 | 385.15 AB ± 3.38 | 3.59 ± 0.03 | 321.69 AB ± 3.38 | 3.00 ± 0.01 | ||
| GA (293) | 10,622 B ± 69.32 | 378.07 B ± 3.05 | 3.58 ± 0.03 | 315.65 B ± 3.05 | 2.97 ± 0.01 | |||
| GG (137) | 10,942 A ± 84.75 | 389.83 A ± 3.63 | 3.57 ± 0.03 | 326.73 A ± 3.63 | 2.98 ± 0.01 | |||
| p value | 0.0006 | 0.0011 | 0.8325 | 0.0029 | 0.0677 | |||
| 14:g.24675708G>T | 1 | GG (279) | 10,271 ± 50.23 | 346.01 ± 1.73 | 3.38 ± 0.03 | 308.12 ± 2.31 | 3.01 ± 0.01 | |
| GT (422) | 10,282 ± 43.57 | 343.92 ± 1.49 | 3.36 ± 0.03 | 307.55 ± 2.15 | 2.99 ± 0.01 | |||
| TT (197) | 10,378 ± 53.8 | 347.33 ± 1.86 | 3.37 ± 0.03 | 310.48 ± 2.41 | 3.00 ± 0.01 | |||
| p value | 0.1313 | 0.1635 | 0.5444 | 0.2926 | 0.244 | |||
| 2 | GG (181) | 10,755 AB ± 78.19 | 385.15 AB ± 3.38 | 3.59 ± 0.03 | 321.69 AB ± 3.38 | 3.00 ± 0.01 | ||
| GT (293) | 10,622 B ± 69.32 | 378.07 B ± 3.05 | 3.58 ± 0.03 | 315.65 B ± 3.05 | 2.97 ± 0.01 | |||
| TT (137) | 10,942 A ± 84.76 | 389.83 A ± 3.63 | 3.57 ± 0.03 | 326.73 A ± 3.63 | 2.98 ± 0.01 | |||
| p value | 0.0006 | 0.0011 | 0.8325 | 0.0029 | 0.0677 | |||
| 14:g.24665961C>T | 1 | CC (198) | 10,355 ± 53.37 | 348.72 A ± 1.87 | 3.39 ± 0.03 | 310.35 A ± 2.42 | 3.00 ± 0.01 | |
| CT (438) | 10,250 ± 42.29 | 341.82 B ± 1.48 | 3.35 ± 0.03 | 306.39 B ± 2.14 | 2.99 ± 0.01 | |||
| TT (262) | 10,354 ± 50.21 | 348.93 A ± 1.76 | 3.38 ± 0.03 | 310.43 A ± 2.33 | 3.00 ± 0.01 | |||
| p value | 0.0443 | <0.0001 | 0.2811 | 0.0258 | 0.369 | |||
| 2 | CC (136) | 10,975 Aa ± 85.38 | 394.69 Aa ± 3.66 | 3.60 ± 0.03 | 328.62 Aa ± 3.66 | 2.99 ± 0.01 | ||
| CT (305) | 10,604 Bb ± 67.5 | 377.09 Bc ± 2.99 | 3.57 ± 0.03 | 315.25 Bb ± 2.99 | 2.98 ± 0.01 | |||
| TT (170) | 10,813 ABa ± 80.72 | 385.16 ABb ± 3.49 | 3.57 ± 0.03 | 322.85 ABa ± 3.49 | 2.99 ± 0.01 | |||
| p value | <0.0001 | <0.0001 | 0.5643 | 0.0001 | 0.1667 | |||
| 14:g.24664026A>G | 1 | AA (385) | 10,251 ± 42.60 | 344.86 ± 1.48 | 3.38 ± 0.03 | 306.82 ± 2.16 | 3.00 ± 0.01 | |
| AG (410) | 10,358 ± 42.67 | 346.02 ± 1.49 | 3.36 ± 0.03 | 309.88 ± 2.17 | 2.99 ± 0.01 | |||
| GG (103) | 10,284 ± 68.88 | 344.17 ± 2.41 | 3.36 ± 0.04 | 309.52 ± 2.90 | 3.01 ± 0.01 | |||
| p value | 0.0583 | 0.6425 | 0.5414 | 0.1429 | 0.5095 | |||
| 2 | AA (261) | 10,798 ± 70.29 | 386.32 Aa ± 3.10 | 3.59 ± 0.03 | 322.31 ± 3.10 | 2.99 ± 0.01 | ||
| AG (286) | 10,676 ± 69.67 | 378.68 Ab ± 3.09 | 3.57 ± 0.03 | 317.79 ± 3.09 | 2.98 ± 0.01 | |||
| GG (64) | 10,758 ± 113.28 | 389.85 Aa ± 4.75 | 3.62 ± 0.05 | 320.94 ± 4.75 | 2.99 ± 0.02 | |||
| p value | 0.2012 | 0.0037 | 0.4078 | 0.2597 | 0.7069 | |||
| HADHB | 11:g.73256269T>C | 1 | CC (580) | 10,345 ± 40.5 | 345.52 ± 1.40 | 3.36 ± 0.03 | 309.82 ± 2.08 | 3.00 ± 0.01 |
| TC (287) | 10,249 ± 49.36 | 346.32 ± 1.72 | 3.39 ± 0.03 | 306.67 ± 2.30 | 3.00 ± 0.01 | |||
| TT (31) | 10,100 ± 118.79 | 338.41 ± 4.16 | 3.35 ± 0.06 | 302.28 ± 4.45 | 2.99 ± 0.02 | |||
| p value | 0.0236 | 0.1926 | 0.2617 | 0.0461 | 0.8674 | |||
| 2 | CC (370) | 10,873 A ± 66.55 | 387.93 Aa ± 2.95 | 3.58 ± 0.03 | 324.74 A ± 2.95 | 2.99 ± 0.01 | ||
| TC (214) | 10,626 B ± 74.67 | 380.21 Ab ± 3.26 | 3.60 ± 0.03 | 315.93 B ± 3.26 | 2.98 ± 0.01 | |||
| TT (27) | 10,091 C ± 162.53 | 351.42 Bc ± 6.68 | 3.50 ± 0.07 | 299.92 B ± 6.68 | 2.98 ± 0.02 | |||
| p value | <0.0001 | <0.0001 | 0.3795 | <0.0001 | 0.585 | |||
| 11:g.73256227A>C | 1 | AA (18) | 10,532 AB ± 156.37 | 349.98 ± 5.49 | 3.31 ± 0.08 | 313.59 b ± 5.73 | 3.00 ± 0.03 | |
| AC (250) | 10,178 B ± 51.16 | 344.16 ± 1.81 | 3.40 ± 0.03 | 304.93 a ± 2.36 | 3.00 ± 0.01 | |||
| CC (630) | 10,333 A ± 39.75 | 345.45 ± 1.42 | 3.36 ± 0.03 | 309.37 b ± 2.07 | 3.00 ± 0.01 | |||
| p value | 0.0015 | 0.499 | 0.2506 | 0.0184 | 0.9941 | |||
| 2 | AA (19) | 9958.5 Ac ± 193.86 | 335.25 A ± 7.93 | 3.42 ± 0.08 | 294.18 B ± 7.93 | 2.98 ± 0.03 | ||
| AC (184) | 10,540 Bb ± 78.1 | 377.62 B ± 3.39 | 3.60 ± 0.03 | 312.87 B ± 3.39 | 2.97 ± 0.01 | |||
| CC (408) | 10,883 Aa ± 65.13 | 388.71 C ± 2.90 | 3.58 ± 0.03 | 325.20 A ± 2.90 | 2.99 ± 0.01 | |||
| p value | <0.0001 | <0.0001 | 0.0665 | <0.0001 | 0.404 | |||
| 11:g.73242290C>T | 1 | CC (123) | 10,254 AB ± 65.02 | 344.89 ± 2.30 | 3.38 ± 0.04 | 306.77 ab ± 2.73 | 2.99 ± 0.01 | |
| CT (189) | 10,168 B ± 54.74 | 344.54 ± 1.95 | 3.40 ± 0.03 | 304.97 b ± 2.47 | 3.00 ± 0.01 | |||
| TT (586) | 10,358 A ± 40.35 | 345.66 ± 1.45 | 3.36 ± 0.03 | 309.91 a ± 2.08 | 3.00 ± 0.01 | |||
| p value | 0.0012 | 0.8134 | 0.2182 | 0.0206 | 0.7748 | |||
| 2 | CC (88) | 10,476 B ± 99.09 | 368.81 Bc ± 4.20 | 3.54 ± 0.04 | 308.42 B ± 4.20 | 2.96 ± 0.01 | ||
| CT (147) | 10,545 B ± 82.76 | 379.36 ABb ± 3.58 | 3.62 ± 0.03 | 315.16 B ± 3.58 | 2.99 ± 0.01 | |||
| TT (376) | 10,884 A ± 66.08 | 387.96 Aa ± 2.95 | 3.57 ± 0.03 | 325.03 A ± 2.95 | 2.99 ± 0.01 | |||
| p value | <0.0001 | <0.0001 | 0.1681 | <0.0001 | 0.0674 |
| Gene | SNP Name | Lactation | Effect | Milk Yield (kg) | Fat Yield (kg) | Fat Percentage (%) | Protein Yield (kg) | Protein Percentage (%) |
|---|---|---|---|---|---|---|---|---|
| CYP7A1 | 14:g.24676921A>G | 1 | Additive Effect (a) | −5.0162 | −0.3432 | −0.00126 | −0.7593 | −0.00757 |
| Dominance Effect (d) | 14.2908 | −0.467 | −0.00879 | 1.3145 | 0.007425 | |||
| Allele Substitution Effect (α) | −9.3289 | −0.2023 | 0.001392 | −1.156 | −0.00981 | |||
| 2 | Additive Effect (a) | 174.61 ** | 6.6291 ** | 0.00234 | 5.4211 * | −0.00187 | ||
| Dominance Effect (d) | −232.24 ** | −11.5028 ** | −0.02803 | −7.7643 ** | −0.00847 | |||
| Allele Substitution Effect (α) | 243.41 ** | 10.0366 ** | 0.01064 | 7.7212 ** | 0.000633 | |||
| 14:g.24676224G>A | 1 | Additive Effect (a) | −41.8497 | −0.2291 | 0.006524 | −0.8039 | 0.004882 | |
| Dominance Effect (d) | −51.9072 | −2.9335 * | −0.018 | −1.8257 | −0.00847 | |||
| Allele Substitution Effect (α) | −46.4739 | −0.4904 | 0.00492 | −0.9666 | 0.004128 | |||
| 2 | Additive Effect (a) | −93.7702 * | −2.34 | 0.009039 | −2.5205 | 0.007237 | ||
| Dominance Effect (d) | −226.82 ** | −9.4213 ** | −0.00727 | −8.5594 ** | −0.01769 | |||
| Allele Substitution Effect (α) | −110.1 * | −3.0184 | 0.008515 | −3.1369 | 0.005963 | |||
| 14:g.24675708G>T | 1 | Additive Effect (a) | −53.7569 | −0.6575 | 0.0065 | −1.1824 | 0.004344 | |
| Dominance Effect (d) | −42.5283 | −2.7457 | −0.01911 | −1.7491 | −0.00997 | |||
| Allele Substitution Effect (α) | −57.6403 | −0.9082 | 0.004755 | −1.3421 | 0.003434 | |||
| 2 | Additive Effect (a) | −93.7702 * | −2.34 | 0.009039 | −2.5205 | 0.007237 | ||
| Dominance Effect (d) | −226.82 ** | −9.4213 ** | −0.00727 | −8.5594 ** | −0.01769 | |||
| Allele Substitution Effect (α) | −110.1 * | −3.0184 | 0.008515 | −3.1369 | 0.005963 | |||
| 14:g.24665961C>T | 1 | Additive Effect (a) | 0.911 | −0.106 | 0.002497 | −0.04286 | −0.00055 | |
| Dominance Effect (d) | −104.99 * | −6.9981 | −0.03212 | −3.9993 * | −0.01024 | |||
| Allele Substitution Effect (α) | 8.3937 | 0.3928 | 0.004787 | 0.2422 | 0.000182 | |||
| 2 | Additive Effect (a) | 80.7445 | 4.764 * | 0.01721 | 2.8865 | 0.001474 | ||
| Dominance Effect (d) | −289.97 ** | −12.8359 ** | −0.01506 | −10.4784 ** | −0.0176 | |||
| Allele Substitution Effect (α) | 96.8803 * | 5.4783 ** | 0.01805 | 3.4696 | 0.002453 | |||
| 14:g.24664026A>G | 1 | Additive Effect (a) | −16.3957 | 0.3409 | 0.009981 | −1.3534 | −0.00523 | |
| Dominance Effect (d) | 89.7199 | 1.5028 | −0.0135 | 1.7121 | −0.00847 | |||
| Allele Substitution Effect (α) | 11.7791 | 0.8128 | 0.005741 | −0.8157 | −0.00789 | |||
| 2 | Additive Effect (a) | 20.2446 | −1.7674 | −0.01594 | 0.6858 | −0.00119 | ||
| Dominance Effect (d) | −101.99 | −9.407 ** | −0.03741 | −3.8298 | −0.00827 | |||
| Allele Substitution Effect (α) | −14.8297 | −5.0024 | −0.0288 | −0.6313 | −0.00403 | |||
| HADHB | 11:g.73256269T>C | 1 | Additive Effect (a) | 122.03 * | 3.5596 | 0.003985 | 3.7702 | 0.004206 |
| Dominance Effect (d) | 26.4066 | 4.3527 | 0.03899 | 0.6195 | 0.001006 | |||
| Allele Substitution Effect (α) | 104.04 ** | 0.5932 | −0.02259 | 3.348 * | 0.003521 | |||
| 2 | Additive Effect (a) | 390.89 ** | 18.2568 ** | 0.03657 | 12.4128 ** | 0.001967 | ||
| Dominance Effect (d) | 143.14 | 10.5408 ** | 0.05419 | 3.5935 | −0.00841 | |||
| Allele Substitution Effect (α) | 471.25 ** | 24.1742 ** | 0.067 | 14.4302 ** | −0.00275 | |||
| 11:g.73256227A>C | 1 | Additive Effect (a) | 99.5398 | 2.2649 | −0.02704 | 2.1125 | −0.00149 | |
| Dominance Effect (d) | −254.17 ** | −3.5579 | 0.05961 * | −6.5477 * | 0.001585 | |||
| Allele Substitution Effect (α) | 272.76 * | 4.6897 | −0.06766 | 6.5749 | −0.00257 | |||
| 2 | Additive Effect (a) | −462.42 ** | −26.7305 ** | −0.08246 * | −15.5101 ** | −0.0063 ** | ||
| Dominance Effect (d) | 118.71 | 15.6455 ** | 0.1017 * | 3.184 | −0.00734 | |||
| Allele Substitution Effect (α) | −538 ** | −36.6914 ** | −0.1472 * | −17.5372 ** | −0.00162 ** | |||
| 11:g.73242290C>T | 1 | Additive Effect (a) | −51.7106 | −0.383 | 0.01289 | −1.5714 | −0.00237 | |
| Dominance Effect (d) | −137.38 | −0.7373 | 0.02938 | −3.3741 | 0.0067 | |||
| Allele Substitution Effect (α) | 19.1215 | −0.00287 | −0.00226 | 0.1682 | −0.00583 | |||
| 2 | Additive Effect (a) | −203.9 ** | −9.573 ** | −0.01824 | −8.3062 ** | −0.01506 * | ||
| Dominance Effect (d) | −135.25 | 0.9699 | 0.06063 | −1.5693 | 0.01771 | |||
| Allele Substitution Effect (α) | −140.15 * | −10.0302 ** | −0.04682 | −7.5665 ** | −0.02341 * |
| Block | Lactation | Haplotype Combination | Milk Yield (kg) | Fat Yield (kg) | Fat Percentage (%) | Protein Yield (kg) | Protein Percentage (%) |
|---|---|---|---|---|---|---|---|
| BLOCK1 | 1 | H1H1 (197) | 10,410 A ± 53.81 | 352.81 ABa ± 1.9 | 3.41 ± 0.03 | 312.82 A ± 2.41 | 3.01 ± 0.01 |
| H1H2 (282) | 10,329 A ± 46.52 | 346.8 Bb ± 1.64 | 3.38 ± 0.03 | 310.03 AB ± 2.23 | 3.01 ± 0.01 | ||
| H1H3 (155) | 10,125 B ± 57.38 | 343.65 Bb ± 2.02 | 3.41 ± 0.03 | 304.38 B ± 2.52 | 3.01 ± 0.01 | ||
| H2H2 (102) | 10,314 AB ± 68.66 | 351.65 ABab ± 2.42 | 3.41 ± 0.04 | 310.75 AB ± 2.85 | 3.02 ± 0.01 | ||
| H2H3 (127) | 10,466 A ± 63.22 | 356.37 Aa ± 2.23 | 3.42 ± 0.04 | 313.93 A ± 2.68 | 3.00 ± 0.01 | ||
| p value | <0.0001 | <0.0001 | 0.6801 | 0.0011 | 0.7621 | ||
| 2 | H1H1 (136) | 10,937 Aa ± 86.81 | 392.63 Aa ± 3.73 | 3.60 ± 0.03 | 327.99 A ± 2.71 | 3.00 ± 0.01 | |
| H1H2 (201) | 10,539 Bb ± 76.03 | 374.21 Bb ± 3.31 | 3.57 ± 0.03 | 316.09 B ± 2.40 | 3.00 ± 0.01 | ||
| H1H3 (104) | 10,453 Bb ± 91.26 | 372.18 Bb ± 3.89 | 3.57 ± 0.04 | 311.78 B ± 2.83 | 2.99 ± 0.01 | ||
| H2H2 (64) | 10,560 ABb ± 108.83 | 379.53 ABb ± 4.56 | 3.60 ± 0.04 | 319.76 AB ± 3.32 | 3.04 ± 0.02 | ||
| H2H3 (85) | 10,971 Aa ± 98.06 | 385.25 ABab ± 4.15 | 3.52 ± 0.04 | 329.89 A ± 3.02 | 3.01 ± 0.014 | ||
| p value | <0.0001 | <0.0001 | 0.3899 | <0.0001 | 0.1286 | ||
| BLOCK2 | 1 | H1H1 (118) | 10,243 B ± 66.47 | 349.59 b ± 2.33 | 3.43 ± 0.04 | 309.81 B ± 2.90 | 3.00 ± 0.01 |
| H1H3 (71) | 10,679 A ± 80.86 | 359.13 a ± 2.84 | 3.39 ± 0.04 | 323.14 A ± 3.30 | 3.02 ± 0.02 | ||
| H2H2 (278) | 10,336 B ± 52.06 | 353.69 ab ± 1.83 | 3.45 ± 0.03 | 312.8 B ± 2.45 | 3.02 ± 0.01 | ||
| p value | <0.0001 | 0.017 | 0.329 | 0.0004 | 0.3323 | ||
| 2 | H1H1 (79) | 10,988 Aa ± 108.25 | 391.81 Aa ± 4.58 | 3.58 ± 0.04 | 327.91 a ± 3.33 | 2.99 ± 0.02 | |
| H1H3 (50) | 10,544 Bb ± 131.80 | 369.04 Bb ± 5.51 | 3.51 ± 0.05 | 316.52 b ± 4.02 | 3.00 ± 0.02 | ||
| H2H2 (181) | 10,597 Bb ± 83.65 | 379.16 ABb ± 3.64 | 3.58 ± 0.03 | 319.04 b ± 2.65 | 3.02 ± 0.01 | ||
| p value | 0.0007 | 0.0006 | 0.4171 | 0.0088 | 0.1168 | ||
| BLOCK3 | 1 | H1H2 (239) | 10,194 ± 73.90 | 345.47 b ± 3.22 | 3.40 ± 0.03 | 305.64 B ± 2.34 | 3.00 ± 0.01 |
| H2H2 (580) | 10,292 ± 62.97 | 346.25 b ± 2.82 | 3.38 ± 0.03 | 308.43 AB ± 2.05 | 3.00 ± 0.01 | ||
| H2H3 (48) | 10,439 ± 118.76 | 357.32 a ± 4.93 | 3.43 ± 0.05 | 315.61 A ± 3.59 | 3.03 ± 0.02 | ||
| p value | 0.06 | 0.0315 | 0.3858 | 0.0103 | 0.2938 | ||
| 2 | H1H2 (176) | 10,456 Ab ± 79.36 | 312.66 b ± 3.40 | 3.58 ± 0.03 | 312.67 C ± 2.50 | 2.99 ± 0.01 | |
| H2H2 (370) | 10,700 Aa ± 67.79 | 320.34 a ± 2.97 | 3.55 ± 0.03 | 320.34 B ± 2.19 | 3.00 ± 0.01 | ||
| H2H3 (37) | 10,860 Aa ± 138.53 | 327.69 a ± 5.71 | 3.60 ± 0.06 | 327.69 A ± 4.18 | 3.02 ± 0.02 | ||
| p value | 0.0005 | 0.0052 | 0.3623 | <0.0001 | 0.496 |
| Gene | SNP | Allele | Transcription Factor | Relative Score (≥0.80) | Predicted Binding Site Sequence |
|---|---|---|---|---|---|
| CYP7A1 | 14:g.24676921A>G | A | - | - | - |
| G | EBF1 | 0.89 | ATTCCAGGGA | ||
| SP1 | 0.88 | GGGACGGGG | |||
| 14:g.24675708G>T | G | ELK1 | 0.80 | GGCACTGAAA | |
| T | FOXC1 | 0.82 | TTTGTAAATGC | ||
| ZNF354C | 0.82 | ATGCAC | |||
| HADHB | 11:g.73256269T>C | T | PAX2 | 0.84 | GGTCGTGC |
| NR2F1 | 0.82 | GAAGGGTCGTGCG | |||
| C | TFAP2A | 0.92 | GCCGTGCGC |
Disclaimer/Publisher’s Note: The statements, opinions and data contained in all publications are solely those of the individual author(s) and contributor(s) and not of MDPI and/or the editor(s). MDPI and/or the editor(s) disclaim responsibility for any injury to people or property resulting from any ideas, methods, instructions or products referred to in the content. |
© 2024 by the authors. Licensee MDPI, Basel, Switzerland. This article is an open access article distributed under the terms and conditions of the Creative Commons Attribution (CC BY) license (https://creativecommons.org/licenses/by/4.0/).
Share and Cite
Chen, A.; Yang, Q.; Ye, W.; Xu, L.; Wang, Y.; Sun, D.; Han, B. Polymorphisms of CYP7A1 and HADHB Genes and Their Effects on Milk Production Traits in Chinese Holstein Cows. Animals 2024, 14, 1276. https://doi.org/10.3390/ani14091276
Chen A, Yang Q, Ye W, Xu L, Wang Y, Sun D, Han B. Polymorphisms of CYP7A1 and HADHB Genes and Their Effects on Milk Production Traits in Chinese Holstein Cows. Animals. 2024; 14(9):1276. https://doi.org/10.3390/ani14091276
Chicago/Turabian StyleChen, Ao, Qianyu Yang, Wen Ye, Lingna Xu, Yuzhan Wang, Dongxiao Sun, and Bo Han. 2024. "Polymorphisms of CYP7A1 and HADHB Genes and Their Effects on Milk Production Traits in Chinese Holstein Cows" Animals 14, no. 9: 1276. https://doi.org/10.3390/ani14091276
APA StyleChen, A., Yang, Q., Ye, W., Xu, L., Wang, Y., Sun, D., & Han, B. (2024). Polymorphisms of CYP7A1 and HADHB Genes and Their Effects on Milk Production Traits in Chinese Holstein Cows. Animals, 14(9), 1276. https://doi.org/10.3390/ani14091276