Article

Effects of Restraint Stress on Circulating Corticosterone and Met Enkephalin in Chickens: Induction of Shifts in Insulin Secretion and Carbohydrate Metabolism

by
Colin G. Scanes
1,*,
Krystyna Pierzchała-Koziec
2,* and
Alina Gajewska
3
1
Department of Biological Science, University of Wisconsin Milwaukee, Milwaukee, WI 53211, USA
2
Department of Animal Physiology and Endocrinology, University of Agriculture, Mickiewicza 24/28, 30-059 Kraków, Poland
3
Kielanowski Institute of Animal Physiology and Nutrition, Polish Academy of Sciences, 05-110 Jablonna, Poland
*
Authors to whom correspondence should be addressed.
Animals 2024, 14(5), 752; https://doi.org/10.3390/ani14050752
Submission received: 12 January 2024 / Revised: 20 February 2024 / Accepted: 22 February 2024 / Published: 28 February 2024
(This article belongs to the Special Issue Advances in Poultry Behaviour and Welfare)

Abstract

:

Simple Summary

Chickens are sensitive to different stressors such as emotional stressors, feed reduction or restraint. These may influence physiological parameters including those related to metabolism, growth and development. The choice of reliable markers of stress is essential to evaluate poultry welfare. Therefore, the objective of this study was to examine whether measuring glucose and insulin levels could be useful for establishing the short-term effects of stress. Additionally, we measured the changes in Met-enkephalin, an endogenous opioid, and corticosterone, hormones responsible for the stress response. Our results show that restraint is a severe stressor stimulating both the hypothalamo–pituitary–adrenocortical axis and the opioid system activity, together with influencing carbohydrate metabolism.

Abstract

This study examined the effects of acute restraint stress in the presence or absence of naltrexone on the circulating concentrations of insulin, glucose, Met-enkephalin and corticosterone in 14-week-old chickens [design: 2 sex × 2 stress/non-stress × 2 +/− naltrexone]. In chickens (five male and five females per treatment) subjected to restraint for 30 min, there were increases in the plasma concentrations of corticosterone and Met-enkephalin. The plasma concentrations of insulin and glucose were also increased in the chickens during restraint. Moreover, there were increases in the plasma concentrations of insulin and glucose in the chickens. The patterns of expression of the proenkephalin gene (PENK) in both the anterior pituitary gland and the adrenal gland were very similar to that of plasma Met-enkephalin. There were relationships between the plasma concentrations of corticosterone, Met-enkephalin, insulin and glucose after 30 min of restraint. The effects of naltrexone treatment on both untreated and stressed chickens were also examined, with naltrexone attenuating the stress-induced increases in the plasma concentrations of corticosterone, Met-enkephalin and glucose but not in those of insulin. The present study demonstrates that stress increases insulin secretion in chickens but also induces insulin resistance.

1. Introduction

Restraint stress is a widely used stressor in animals including rodents [1,2], reviewed in [3], and chickens [4,5,6,7,8,9,10,11]. This stress does not involve physical pain but represents a psychologically aversive inescapable environment, also restricting movement [12]. Another aspect of restraint stress is the exposure to a novel environment, such as small individual cages [12]. Assays for anxiety- and depression-related behaviors have been developed [13,14]. Anxiety-related behaviors in mice can be assessed by evaluating their avoidance of heights and open spaces and their preference for dark enclosed spaces in an elevated plus maze [13,14], together with hyperactivity, for instance, in light/dark transition tests and open field tests [14,15]. In mice, depression-related behaviors are studied using the Porsolt forced swim test, the tail suspension test and the sucrose preference test [14,15]. Repeated exposure of rodents to restraint stress is followed by reduced anxiety-like behavior and increased depression-like behavior [14,15]. Restraint stress also results in anorexia and weight loss in rodents [16,17]. Corticotropin-releasing hormone (CRH) plays a central role in the response to restraint stress, activating the hypothalamo–pituitary–adrenocortical (HPA) axis, thereby increasing the circulating concentrations of glucocorticoids [15,18,19].
Poultry are sensitive to multiple psychological stressors, reviewed in [20], with the circulating concentrations of corticosterone having been reported to be increased by restraint [4,5,6,7,8,9,10,11], withdrawal of feed [21,22] and exposure to Escherichia coli lipopolysaccharide [23,24] in chickens, as well as herding in turkeys [25]. The difficulty of attempting to transpose stress responses across species is exemplified by the different responses to shackling in chickens and turkeys, with marked increases in feather flapping and the circulating concentrations of corticosterone in chickens [26,27] but not in turkeys [24,27]. The activation of the HPA in chickens decreases growth [28,29] and enhances adiposity [30] and increases triglyceride lipase in the adipose tissue [22]. These effects are undesirable in poultry production. It is important to develop and employ optimal markers of stress to evaluate the welfare of chickens. What is not known is whether restraint stress influences the plasma concentrations of Met-enkephalin, insulin and glucose. The present study examines the effects of restraint stress on the plasma concentrations of Met-enkephalin and corticosterone, the latter determined to confirm a stress effect. Effects on the expression of the proenkephalin gene (PENK) in both the anterior pituitary gland and the adrenal gland were also determined.
There is considerable evidence that exogenous glucocorticoids induce both insulin secretion and insulin resistance in chickens. The circulating concentrations of insulin are elevated in chickens receiving corticosterone administration [31,32,33,34]. Similarly, dexamethasone increased the plasma concentration of insulin in chickens refed for 3 h after fasting for 24 h but not in fasted birds [35]. It is possible that the effects of exogenous glucocorticoids represent pharmacological (i.e., extremely high doses that are outside the physiological range) rather than physiological effects. What is not known is whether stressors influence insulin secretion and/or insulin resistance in chickens. The present study also examines the effects of the opioid antagonist naltrexone on the stress response (plasma concentrations of corticosterone and Met-enkephalin) and on the circulating concentrations of glucose and insulin in both stressed and control chickens.

2. Materials and Methods

All animal procedures were conducted with prior institutional ethical approval in accordance with the Local Institutional Animal Care and Use Committee (IACUC). The animal study protocol 120/2013 was approved by the Institutional Review Board and the First Local Ethical Committee on Animal Testing in Krakow, Poland.

2.1. Animal Model

The study employed twenty female and twenty male 14-week-old ISA Brown hybrid (Rhode Island x Leghorn) egg-laying chickens weighing 1.2 ± 0.10 kg. The birds were maintained in individual cages (60 × 60 × 60 cm) in a controlled environment (photoperiod 12L/12D with lights on from 7 a.m. to 7 p.m.) and at room temperature (20 °C). The chickens received feed and water ad libitum. The animals were habituated to these conditions for 7 days before the experiments. The chickens were randomly assigned to the experimental groups [design: 2 (sex) × 2 (stress/non-stress) × 2 (+/− naltrexone)]. The treatment groups (n = 5 for each sex per treatment) were subjected to the following conditions: control (O), stress by restraint (Re), naltrexone treatment (Na), and naltrexone treatment plus restraint (Re + Na).

2.2. Experimental Design

The overall design of the study was the following: 2 (sex) × 2 (stress/non-stress) × 2 (+/− naltrexone). Pretreatment blood samples were taken, and then the chickens received an i.v. injection of either 0.9% saline (control O and group Re to be stressed) or naltrexone (2 mg/kg b.w., Sigma-Aldrich, St. Louis, MO, USA; treatment groups Na and Re +Na). The chickens were separately kept in boxes (30 × 30 × 30 cm) with no light and sound for 30 min. To collect the blood samples, the birds were transitorily manually held, and the samples (each of 2 mL) were taken from the left wing-vein and transferred into heparinized tubes at the following times: 15 min before the initiation of the stress or sham treatment, 30 min after the initiation of restraint and 10 min after terminating the stress. The blood samples were taken at the same times starting at 9 a.m. Plasma was obtained after centrifugation (3000 rpm, at 4 °C, for 20 min) and immediately frozen at −80 °C until further processing.

2.3. Hormone and Glucose Assays

The concentrations of Met-enkephalin in the plasma were determined by radioimmunoassay employing the method of Pierzchala-Koziec and colleagues [36,37]. The inter-assay and intra-assay coefficients of variance were, respectively, 7% and 11%. The circulating levels of corticosterone were measured in duplicate by a radioimmunoassay (RIA) using the Corticosterone Double Antibody RIA kit (07–120102, MP Biomedicals, Irvine, CA, USA) in 10 µL of plasma. The intra-assay and inter-assay coefficients of variance were 9.1% and 15.5%, respectively. The plasma levels of insulin were estimated by a radioimmunoassay using a commercial kit obtained from DIAsource ImmunoAssays S.A., Ottignies-Louvain-la-Neuve, Belgium (INS-IRMA KIP-125I). The intra-assay and inter-assay coefficients of variance were 6.6% and 14.4%, respectively. The glucose concentrations in plasma were determined using an enzymatic colorimetric method (Glucose kit; Sigma Diagnostics, Livonia, MI, USA). The intra-assay and inter-assay coefficients of variation were less than 4.0%.

2.4. PENK (Met-Enkephalin Gene) Expression

mRNA gene expression was estimated by a modification of a reported method [38]. Briefly, the frozen fragments of the pituitary and adrenal glands were sliced (14 µm sections) using a Leica cryostat microtome (−22 °C). The sections were thaw-mounted on gelatin-covered microscopic slides and stored for 3 days at −20 °C before the assay. Then, the tissue sections were thawed and fixed in 4% formaldehyde in phosphate-buffered saline (PBS; pH 7.4) for 10 min. The sections were acylated for 10 min in triethanolamine/acetic anhydride (0.25%). The sections were dehydrated by immersion in graded ethanol (70%, 80%, 95%, 100%) and air-dried. After pre-hybridization, a synthetic deoxyoligonucleotide, complementary to a fragment of the rat proenkephalin (PENK) gene, was labeled using 35S-dATP (1200 Ci/nmol) to obtain a specific activity of about 4 × 10⁶ cpm μL−1. The probes were diluted in hybridization buffer (formamide, dextran sulfate, saline–sodium citrate buffer (SSC), Denhardt’s solution, yeast tRNA, herring sperm DNA). Hybridization occurred during 20 h in a humidified chamber at 37 °C. Then, the sections were washed once in SSC for 10 min and four times for 15 min each in SSC/50% formamide at 40 °C and then were rinsed in SSC and distilled water at room temperature and air-dried. The sections were exposed to a Kodak film for four weeks (−80 °C). The photo-stimulated luminescence (PSL) density of the irradiated plates was measured with a BAS-1000 readout system. The PSL/mm2 in the resultant film images was determined using a computer image analysis system.

2.5. Statistical Analysis

The data were checked for normal distribution (DATAtab, https://datatab.net/statistics-calculator/hypothesis-test, accessed 7 February 2024). The data obtained at different times from the same birds were analyzed by repeated-measures ANOVA. The data at the 30 min (following 30 min of restraint or sham treatment) sampling time were analyzed by three-way ANOVA (DATAtab https://datatab.net/statistics-calculator/hypothesis-test, accessed 7 February 2024) followed by the Tukey’s honestly significant difference test as the range test. Where appropriate (concentrations of hormones or glucose versus time or in pairwise comparisons between concentrations of hormones or glucose), the data were analyzed by linear regression.

3. Results

3.1. Basal (Pre-Treatment) Concentrations of Corticosterone, Met-Enkephalin, Glucose and Insulin

The basal plasma concentrations of Met-enkephalin were 12.9% greater (p < 0.0001) in male than in female chickens (Table 1). Similarly, the plasma concentrations of glucose were 12.8% greater (p < 0.0001) in male than in female chickens (Table 1). However, there were no differences between the plasma concentrations of either corticosterone or insulin between female and male chickens (Table 1).
There were no relationships (p > 0.05) between the basal (pre-treatment) plasma concentrations of corticosterone, Met-enkephalin, insulin and glucose, except for the plasma concentrations of Met-enkephalin and those of glucose in male or female chickens.

3.2. Effects of Restraint Stress and/or Naltrexone Administration

Table 2 summarizes the effects of restraint stress and/or naltrexone administration on the plasma concentrations of corticosterone, Met-enkephalin, insulin and glucose in 14-week-old chickens. The plasma concentrations of corticosterone were elevated (p < 0.001) compared to the pre-treatment ones after 30 min of restraint stress in juvenile chickens (Table 2; Figure 1), the increases being of 82.9% in females and 100.0% in males. Moreover, the plasma concentrations of corticosterone were increased (p < 0.001) compared to the pre-treatment ones in chickens receiving the opioid antagonist naltrexone (Figure 1), the increases being of 67.1% in females and 63.0% in males. In the presence of naltrexone, the increases compared to the pre-treatment values in the plasma concentrations of corticosterone were attenuated in both female and male chickens (Table 2; Figure 1), the decreases relative to restraint alone being of 29.7% in females and 29.0% in males. The increases in the plasma concentrations of corticosterone compared to the pre-treatment values were greater (p < 0.001) in males than in female chickens.
The plasma concentrations of Met-enkephalin were increased (p < 0.001) compared to the pre-treatment ones after 30 min of restraint in chickens (Table 2; Figure 1), by 76.7% in females and by 120.1% in males. The plasma concentrations of Met-enkephalin were greater (p < 0.001) in stressed males than in stressed females (Table 2; Figure 1). In the presence of naltrexone, there were reduced (p < 0.001) responses to restraint in the plasma concentrations of Met-enkephalin (Table 2; Figure 1), the decreases being of 50.6% in females and 32.6% in males.
The plasma concentrations of insulin were markedly elevated (p < 0.001) compared to the pre-treatment ones in chickens subjected to restraint for 30 min (Table 2; Figure 2), the increases being of 20.3-fold in females and 14.2-fold in males. The magnitude of the increases in the plasma concentrations of insulin compared to the pre-treatment levels was greater (p < 0.001) in females than in males (Table 2; Figure 2). The plasma concentrations of glucose were elevated (p < 0.001) compared to the pre-treatment ones in both female and male chickens after 30 min of restraint (Table 2; Figure 2), the increases being of 64.0 % in female and 115.5 % in male chickens. The plasma concentrations of glucose in stressed birds were greater (p < 0.001) in males than in females (Table 2; Figure 2). The plasma concentrations of glucose were increased (p < 0.001) compared to the pre-treatment values in male but not in female birds receiving the naltrexone treatment (Table 2; Figure 2). In contrast, there was a smaller (p < 0.001) increase in the plasma concentrations of glucose in birds subjected to restraint when receiving naltrexone (Figure 2).

3.3. Effects of Recovery following Restraint Stress

The plasma concentrations of both corticosterone and Met-enkephalin declined (p < 0.001) during the 10 min recovery period compared to those during restraint stress (Table 2). The magnitudes of the reductions were greater (p < 0.001) for the plasma concentrations of corticosterone than for those of Met-enkephalin and in female than in male chickens (Table 2), the decreases being of 49.2% in female and 27.4% in male chickens for the plasma concentrations of corticosterone and of 27.4% and 8.7% for the plasma concentrations of Met-enkephalin in female and male chickens (Table 2). Similarly, the plasma concentrations of glucose in birds that had been subjected to restraint declined (p < 0.001) during the recovery period compared to those during restraint stress, the decreases being of 23.7% in females and 45.0% in males (Table 2). In contrast, the plasma concentrations of insulin were unchanged during the short recovery period (Table 2).

3.4. Effect of Repeated Blood Sample Collection in the Controls and Following Naltrexone Administration

In both control female and male chickens that had been subjected to multiple blood sampling, there were increases in the plasma concentrations of glucose and insulin with time but not in those of corticosterone or met-enkephalin. For instance, the plasma concentrations of glucose were increased by 11.3% in females and 6.7% in males compared to the pre-treatment ones for up to 40 min after sample collection [females: adjusted R2 = 0.833 (p < 0.001), males: adjusted R2 = 0.793 (p < 0.001)]; increases were also observed in the plasma concentrations of insulin [females: adjusted R2 = 0.396 (p < 0.05), males: adjusted R2 = 0.621 (p < 0.001)].

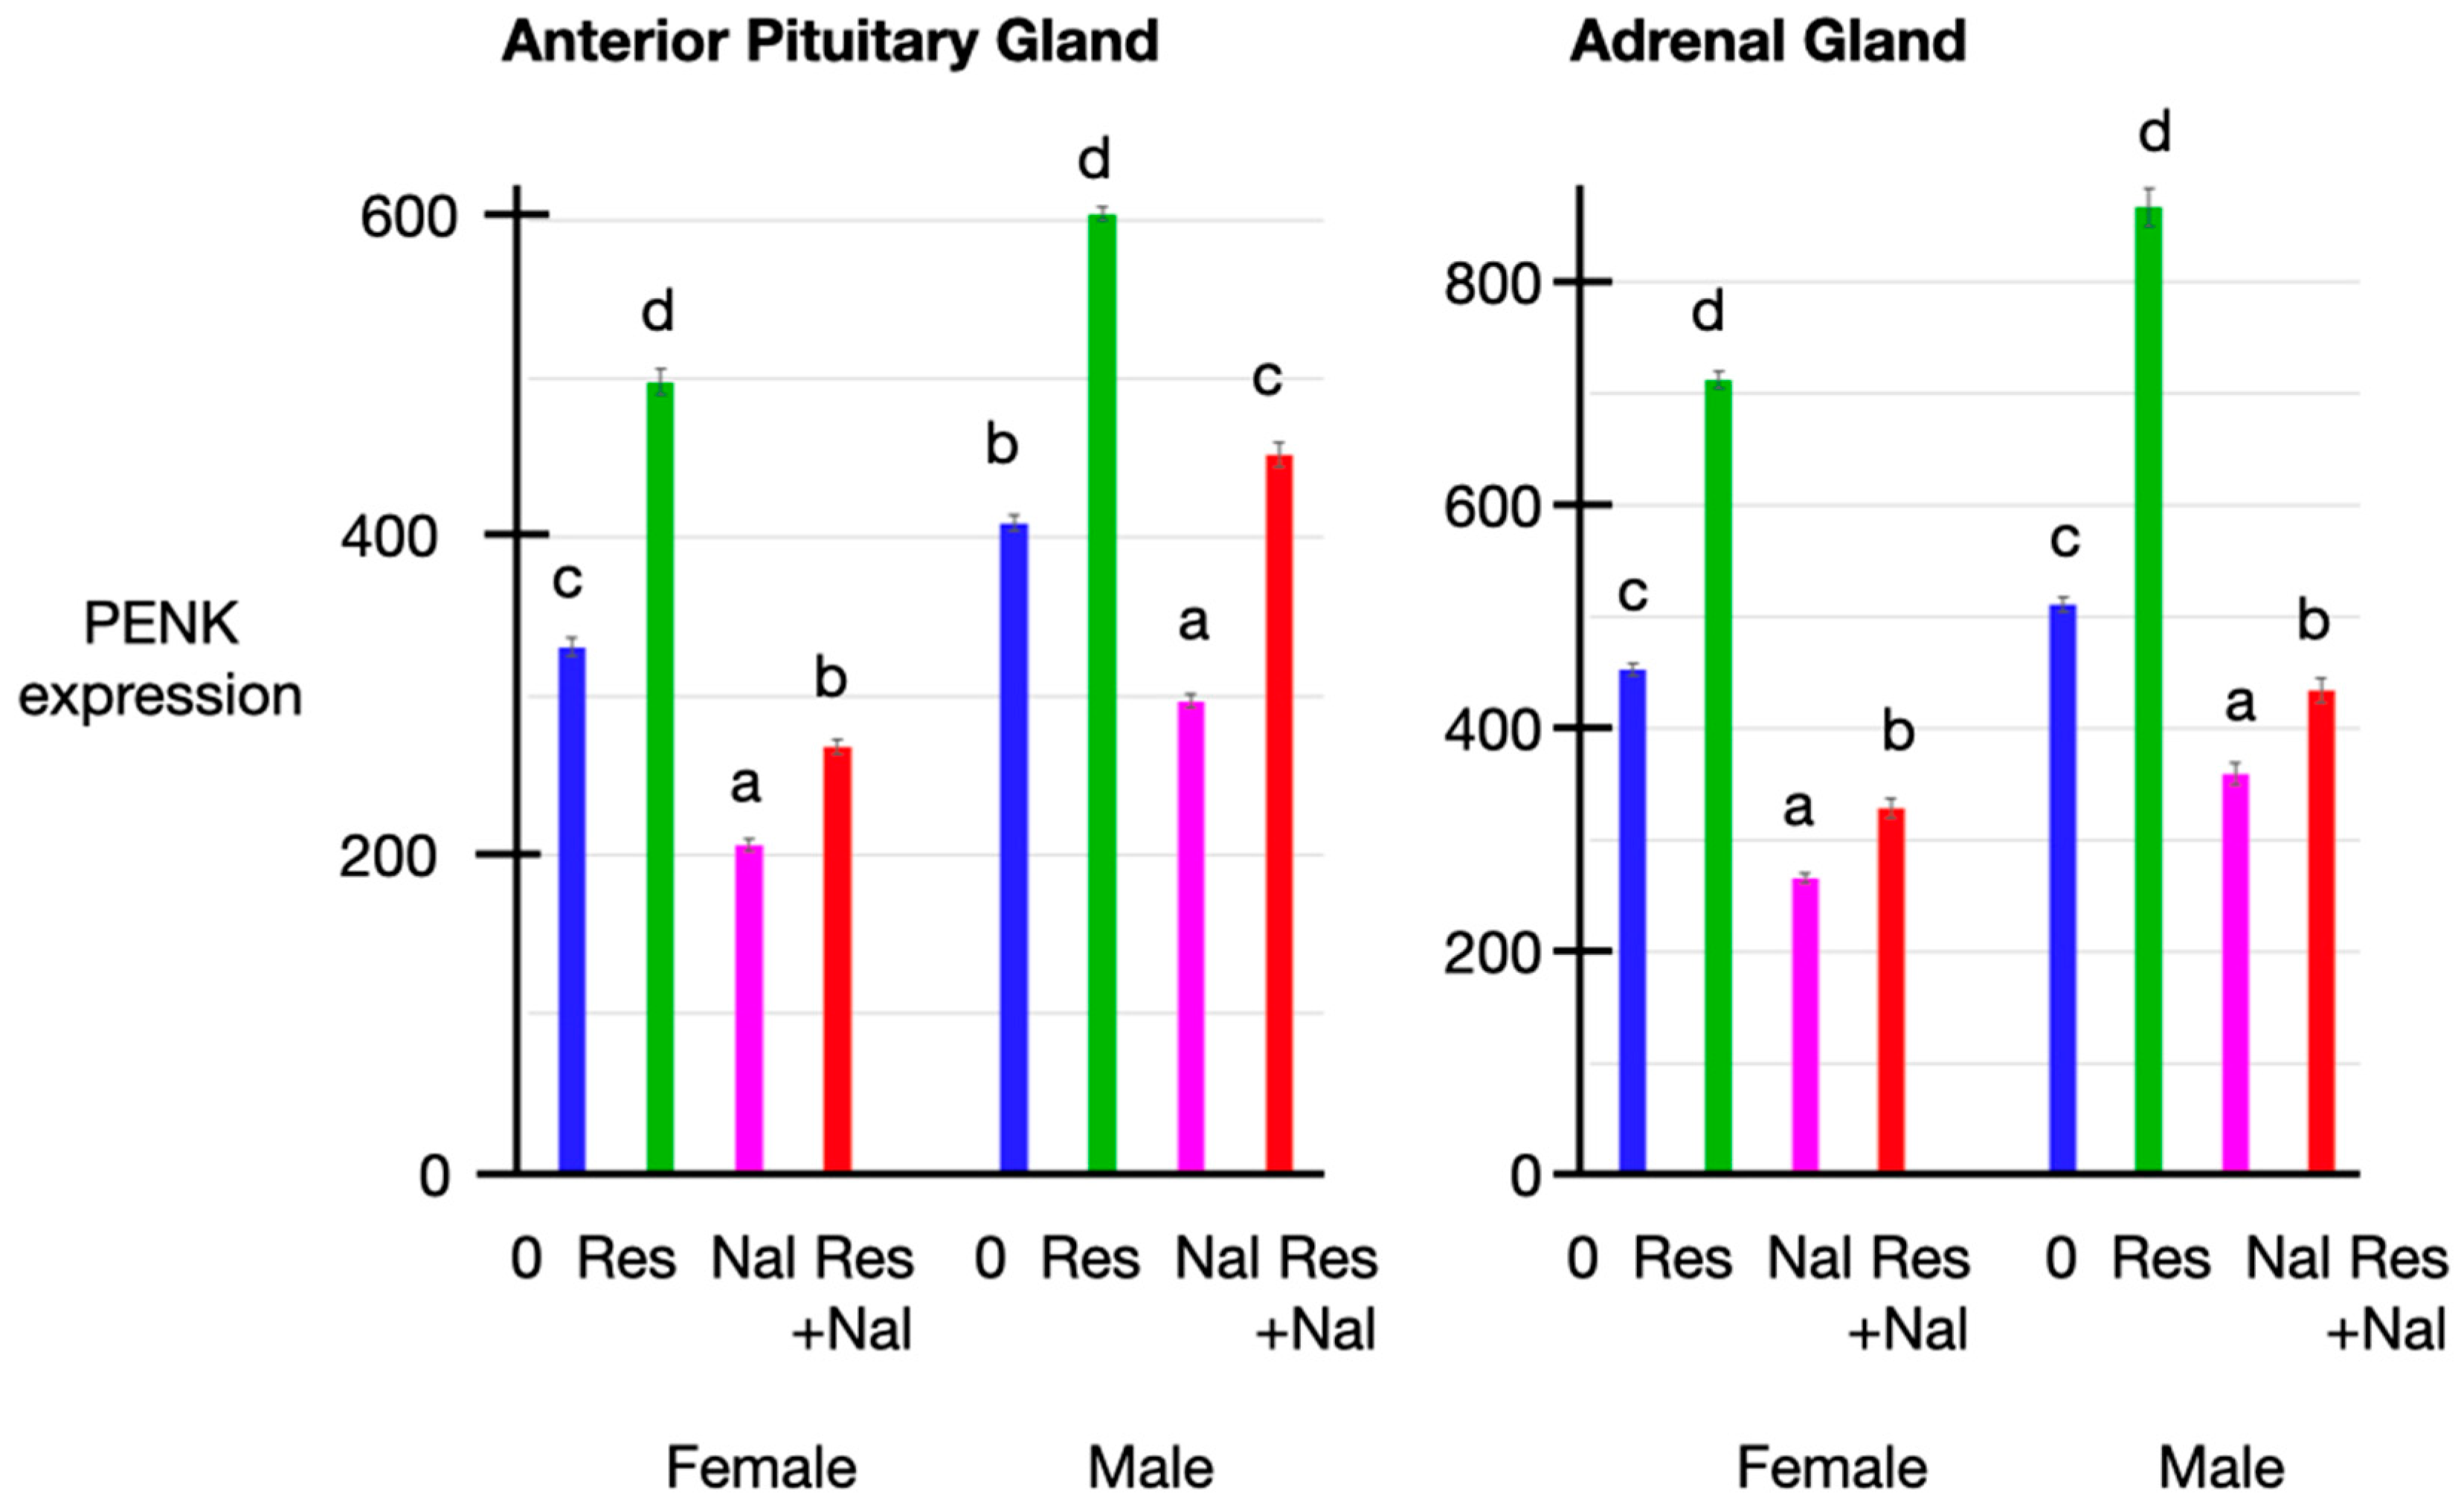
3.5. PENK Expression

There was increased (p < 0.05) PENK expression in both anterior pituitary and adrenal tissue in both male and female chickens subjected to restraint (Figure 3). In contrast, in both male and female chickens, PENK expression was reduced (p < 0.05) after naltrexone administration (Figure 3). There were increases (p < 0.05) in PENK expression in both adrenal and anterior pituitary tissue in chickens subjected to restraint and receiving naltrexone administration compared to chickens receiving naltrexone alone (Figure 3).

3.6. Relationships between the Plasma Concentrations of Corticosterone, Met-Enkephalin, Insulin and Glucose Together with PENK Expression

There were close relationships between the plasma concentrations of corticosterone and those of other hormones and glucose, as well as between those of different hormones or the same hormone and between those of hormones and glucose. For instance, there were relationships at the 30 min time point between the plasma concentrations of corticosterone and those of Met-enkephalin [adjusted R2 = 0.867 (p < 0.001)], those of insulin [adjusted R2 = 0.499 (p < 0.001)] and of glucose [adjusted R2 = 0.118 (p < 0.05)], between the plasma concentrations of Met-enkephalin and those of insulin [adjusted R2 = 0.307 (p < 0.001)] and glucose [adjusted R2 = 0.835 (p < 0.001)] and between the plasma concentrations of insulin [adjusted R2 = 0.453 (p < 0.001)].
There were close relationships between the expression levels of PENK in the adrenal and anterior pituitary glands [adjusted R2 = 0.867 (p < 0.001]) and between the PENK expression levels in the adrenal and anterior pituitary glands and the plasma concentrations of corticosterone (at 30 min: respectively, adjusted R2 = 0.797 (p < 0.001) and = 0.920 (p < 0.001); at 40 min: respectively, adjusted R2 = adjusted R2 = 0.613 (p < 0.001) and = 0.757 (p < 0.001)), of Met-enkephalin (at 30 min: respectively, adjusted R2 = 0.921 (p < 0.001) and 0.758 (p < 0.001); at 40 min: adjusted R2 = 0.736 (p < 0.001) and 0.686 (p < 0.001)), of insulin at 30 min: adjusted R2 = 0.138 (p < 0.05) and 0.216 (p < 0.001); at 40 min: adjusted R2 = 0.101 (p < 0.1) and 0.198 (p < 0.001)) and of glucose (at 30 min: adjusted R2 = 0.508 (p < 0.001) and 0.668 (p < 0.001); at 40 min: adjusted R2 = 0.482 (p < 0.001) and 0.630 (p < 0.001)).

4. Discussion

In the present study, the plasma concentrations of corticosterone were increased by restraint (Table 2, Figure 1). Across vertebrates, the hypothalamo–pituitary–adrenal (HPA) axis involves the corticotropin-releasing hormone, the adrenocorticotropic hormone and a glucocorticoid (cortisol, corticosterone or 11-deoxycortisol, depending on the species), with stressors stimulating the axis (wild birds, e.g., sparrows [39]; Reptilia and Amphibia [40]; Osteichthyes (boney fish), e.g., trout [41], reviewed in [42]; Chondrichthyes (cartilaginous fish) [43]; Agnatha (jawless fish) [44]). In a similar manner, for instance, the plasma concentrations of corticosterone in chickens are elevated by both acute and chronic immobilization stress [4,5,6].
The plasma concentrations of Met-enkephalin together with PENK expression were increased in stressed chickens (Table 2, Figure 1) as observed previously [37]. There is evidence of a crosstalk between the opioid/Met-enkephalin system and the HPA axis across the vertebrates. For instance, challenging immature trout with the opioid morphine or the met-enkephalin analogue D-Ala2, Met5-enkephalinamide was followed by increases in the circulating glucocorticoid concentrations [45]. Moreover, morphine stimulates the release of CRH from the hypothalamus in vitro (trout [46]; rat [47]) and an increase in the circulating concentrations of corticosterone (rat [48]). It is not clear whether the increases in the plasma concentrations of Met-enkephalin in stressed chickens (Table 2, Figure 1) are secondary to those in the plasma concentrations of corticosterone, insulin or glucose.
There were relationships between the plasma concentrations of Met-enkephalin together with PENK expression and those of either insulin or glucose. There is other evidence that Met-enkephalin influences the carbohydrate metabolism and its control by insulin. Met-enkephalin increased the plasma concentrations of glucose in rats [49] and glucose release from rat hepatocytes in vitro [50]. The plasma concentrations of Met-enkephalin are increased in insulin-dependent diabetics and further elevated following a meal and insulin therapy, but depressed in neuropathic patients [51,52]. Moreover, the plasma concentrations of glucose following a glucose load or a meal was reduced by a Met-enkephalin analogue [53].
There were also strong relationships between the plasma concentrations of insulin and those of glucose either 30 or 40 min after initiation of the treatments but not prior to treatment. Similarly, relationships between the circulating concentrations of insulin and those of gastric inhibitory peptide (GIP) or glucagon-like peptide (GLP) were reported in chickens [54], as well as between the circulating concentrations of insulin and those of uric acid [55].
It is hypothesized that the stress-induced increase in the plasma concentrations of glucose is secondary either to the release of epinephrine/norepinephrine or to the production of glucocorticoids. The former possibility is unlikely, as chickens challenged with epinephrine failed to exhibit changes in the circulating concentrations of glucose [56]. Corticosterone is considered the main physiological regulator in response to stress, rather than glucose, based on studies in sparrows [39]. Moreover, stress influence on insulin secretion in rats is at least partially mediated by glucocorticoids [57]. Moreover, stress influences glucose-stimulated insulin release in rats [58]. The increase in the plasma concentrations of insulin in stressed chickens (Table 2, Figure 2) were likely secondary to corticosterone-induced hyperglycemia.
The administration of naltrexone, blocking the effects of Met-enkephalin, was followed by increases in the plasma concentrations of corticosterone but attenuated the increase in the plasma concentrations of corticosterone in restrained chickens (Table 2, Figure 1). There was no increase in the plasma concentrations of Met-enkephalin following naltrexone administration per se, but naltrexone decreased the magnitude of the increase in the plasma concentrations of Met-enkephalin in restrained chickens (Table 2, Figure 2). Naltrexone had no effect on the plasma concentrations of insulin (Table 2, Figure 3). There was an increase in the plasma concentrations of glucose in male but not in female chickens following naltrexone administration (Table 2, Figure 3). Naltrexone again attenuated the increase in the plasma concentrations of glucose (Table 2).
The plasma concentrations of insulin were increased in chickens subjected to restraint (Table 2 Figure 3) and, to a lesser extent, repeated blood sampling (Table 2, Figure 2). The basis for these effects is not totally clear. They could be secondary to the increase in the plasma concentrations of glucose. Despite the absence of GLUT 4 in chickens [59,60], insulin secretion is increased by either glucose or the glycolytic hormone glucagon in chickens [61,62]. Exogenous glucocorticoids were reported to induce insulin release in chickens, with circulating concentrations of insulin being elevated following the administration of corticosterone [31,32,34] or dexamethasone [33,35]. In mammals, exogenous glucocorticoids were reported to increase or to decrease insulin secretion. Examples of studies in which glucocorticoids increased insulin release include the following. The administration of dexamethasone in vivo in human subjects for three days was accompanied by increases in the plasma concentrations of insulin [63]. Moreover, there was marked hyperglycemia in men receiving prednisolone administration for 2 or 15 days [64]. Similarly, dexamethasone administration was followed by elevated circulating concentrations of insulin in humans [65] and rats [66]. The in vitro release of insulin was depressed in adrenalectomized rats, and this was overcome by cortisol replacement therapy in vivo [67]. In contrast, dexamethasone depressed insulin release from mouse islets in vitro at both physiological and high concentrations of glucose [68]. Corticosterone administration depressed glucose-stimulated insulin release in mice [69]. Moreover, there was both a larger decrease in insulin secretion and a greater expression of a reporter gene in the β cells in mice over-expressing the glucocorticoid receptor and challenged with the glucocorticoid dexamethasone [70]. Overall, the ability of glucocorticoids to increase the circulating concentrations of insulin is consistent with the increase in the plasma concentrations of insulin being secondary to the increase in the plasma concentrations of corticosterone (Table 2, Figure 3).
The plasma concentrations of glucose were increased in chickens subjected to restraint and also elevated with repeated blood sampling. This was observed despite the plasma concentrations of insulin being increased (Table 2). This is consistent with stress inducing insulin resistance. In chickens, as in mammals, the plasma concentrations of glucose are depressed following insulin administration (chickens [55,71]. There is other evidence that glucocorticoids induce insulin resistance in chickens. The administration of the exogenous glucocorticoid dexamethasone increased the plasma concentrations of glucose [33,35]. Moreover, dexamethasone decreased the expression of GLU1 in the presence of insulin in myoblasts in vitro [34]. Similarly, stresses are associated with insulin resistance in mammals. For instance, insulin resistance was observed in mice subjected to inescapable foot shock stress, a model for acute psychological stress [55]. Moreover, both insulin resistance and increased endogenous glucocorticoid concentrations were observed in a mouse model of chronic psychological stress consisting of repeated acoustic and restraint stresses [72].
It is argued that the effects of restraint stress on the plasma concentrations of corticosterone and Met-enkephalin (Table 2) are quickly reversed once the stressful situation is terminated. The decline in the plasma concentrations of corticosterone and Met-enkephalin are presumed to reflect the clearance of these hormones. The observed decrease in the plasma concentrations of corticosterone in female chickens is consistent with a half-life of ~10 min (Table 2). This is similar to the half-life of 6 min reported in the Pekin duck [73] but shorter than that of 22 min reported in broiler chickens [74]. However, despite the marked decreases in the plasma concentrations of glucose (Table 2), there was either a smaller decrease (females) or an increase (males) in the plasma concentrations of insulin during the recovery period post the restraint stress (Table 2). This may reflect a time lag in either the hyperglycemia or the corticosterone stimulation of insulin secretion.

5. Conclusions

The present study demonstrated acute effects of restraint stress on the plasma concentrations of Met-enkephalin and corticosterone in growing chickens. The plasma concentrations of insulin were also increased by stressors, namely, restraint stress and repeated blood sampling, in chickens. The present results provide further support for a crosstalk between insulin, Met-enkephalin and the HPA axis. Furthermore, it is suggested that plasma insulin concentration may be a useful parameter indicating stress and, consequently, welfare in chickens.

Author Contributions

C.G.S., K.P.-K. and A.G.; conceptualization, C.G.S. and K.P.-K.; methodology, K.P.-K.; formal analysis, K.P.-K.; investigation, C.G.S., K.P.-K. and A.G.; resources, K.P.-K. and A.G.; data curation, C.G.S., K.P.-K. and A.G.; writing—original draft preparation, C.G.S. and K.P.-K.; writing—review and editing, C.G.S. and K.P.-K. All authors have read and agreed to the published version of the manuscript.

Funding

This research was funded by the Ministry of Science and Higher Education of the Republic of Poland (Grant No. 020002-D-015).

Institutional Review Board Statement

The study was conducted in accordance with the Declaration of Helsinki and approved by the Institutional Review Board with prior institutional ethical approval in accordance with the Local Institutional Animal Care and Use Committee (IACUC). The animal study protocol 120/2013 was approved by the Institutional Review Board and First Local Ethical Committee on Animal Testing in KRAKOW, Poland.

Informed Consent Statement

Not applicable.

Data Availability Statement

The data presented in this study are available on request from the corresponding authors.

Conflicts of Interest

The authors declare no conflicts of interest.

References

  1. McDougall, S.J.; Paull, J.R.A.; Widdop, R.E.; Lawrence, A.J. Restraint stress: Differential cardiovascular responses in Wistar-Kyoto and Spontaneously Hypertensive Rats. Hypertension 2000, 35, 126–129. [Google Scholar] [CrossRef] [PubMed]
  2. Olave, F.A.; Aguayo, F.I.; Román-Albasini, L.; Corrales, W.A.; Silva, J.P.; González, P.I.; Lagos, S.; García, M.A.; Alarcón-Mardones, M.; Rojas, P.S.; et al. Chronic restraint stress produces sex-specific behavioral and molecular outcomes in the dorsal and ventral rat hippocampus. Neurobiol. Stress 2022, 17, 100440. [Google Scholar] [CrossRef] [PubMed]
  3. Paré, W.P.; Glavin, G.B. Restraint stress in biomedical research: A review. Neurosci. Biobehav. Rev. 1986, 10, 339–370. [Google Scholar] [CrossRef] [PubMed]
  4. Selvam, R.; Jurkevich, A.; Kang, S.W.; Mikhailova, M.V.; Cornett, L.E.; Kuenzel, W.J. Distribution of the vasotocin subtype four receptor (VT4R) in the anterior pituitary gland of the chicken, Gallus gallus, and its possible role in the avian stress response. J. Neuroendocrinol. 2013, 25, 56–66. [Google Scholar] [CrossRef] [PubMed]
  5. Kang, S.W.; Kuenzel, W.J. Regulation of gene expression of vasotocin and corticotropin-releasing hormone receptors in the avian anterior pituitary by corticosterone. Gen. Comp. Endocrinol. 2014, 204, 25–32. [Google Scholar] [CrossRef] [PubMed]
  6. Kuenzel, W.J.; Kang, S.W.; Jurkevich, A. Neuroendocrine regulation of stress in birds with an emphasis on vasotocin receptors (VTRs). Gen. Comp. Endocrinol. 2013, 190, 18–23. [Google Scholar] [CrossRef]
  7. Nagarajan, G.; Tessaro, B.A.; Kang, S.W.; Kuenzel, W.J. Identification of arginine vasotocin (AVT) neurons activated by acute and chronic restraint stress in the avian septum and anterior diencephalon. Gen. Comp. Endocrinol. 2014, 202, 59–68. [Google Scholar] [CrossRef]
  8. Ericsson, M.; Jensen, P. Domestication and ontogeny effects on the stress response in young chickens (Gallus gallus). Sci. Rep. 2016, 6, 35818. [Google Scholar] [CrossRef]
  9. Ismail, S.N.; Awad, E.A.; Zulkifli, I.; Goh, Y.M.; Sazili, A.Q. Effects of method and duration of restraint on stress hormones and meat quality in broiler chickens with different body weights. Asian-Australas. J. Anim. Sci. 2019, 32, 865–873. [Google Scholar] [CrossRef]
  10. Peixoto, M.R.L.V.; Cooley, L.; Widowski, T.M. Maternal age and maternal environment affect stress reactivity and measures of social behaviour in laying hens. Sci. Rep. 2021, 11, 17499. [Google Scholar] [CrossRef]
  11. Kadhim, H.J.; Kuenzel, W.J. Interaction between the hypothalamo-pituitary-adrenal and thyroid axes during immobilization stress. Front. Physiol. 2022, 13, 972171. [Google Scholar] [CrossRef]
  12. Kvetnansky, R.; McCarty, R. Immobilization stress. In Encyclopedia of Stress, 2nd ed.; Fink, G., Ed.; Academic Press: San Diego, CA, USA, 2007; pp. 445–449. [Google Scholar]
  13. Walf, A.A.; Frye, C.A. The use of the elevated plus maze as an assay of anxiety-related behavior in rodents. Nat. Protoc. 2007, 2, 322–328. [Google Scholar] [CrossRef]
  14. Chiba, S.; Numakawa, T.; Ninomiya, M.; Richards, M.C.; Wakabayashi, C.; Kunugi, H. Chronic restraint stress causes anxiety- and depression-like behaviors, downregulates glucocorticoid receptor expression, and attenuates glutamate release induced by brain-derived neurotrophic factor in the prefrontal cortex. Prog. Neuropsychopharmacol. Biol. Psychiatry 2012, 39, 112–119. [Google Scholar] [CrossRef] [PubMed]
  15. Shoji, H.; Miyakawa, T. Differential effects of stress exposure via two types of restraint apparatuses on behavior and plasma corticosterone level in inbred male BALB/cAJcl mice. Neuropsychopharmacol. Rep. 2020, 40, 73–84. [Google Scholar] [CrossRef]
  16. Vallès, A.; Martí, O.; García, A.; Armario, A. Single exposure to stressors causes long-lasting, stress-dependent reduction of food intake in rats. Am. J. Physiol. 2000, 279, R1138–R1144. [Google Scholar] [CrossRef]
  17. Jaszczyk, A.; Juszczak, G.R. Glucocorticoids, metabolism and brain activity. Neurosci. Biobehav. Rev. 2021, 126, 113–145. [Google Scholar] [CrossRef]
  18. Ciccocioppo, R.; de Guglielmo, G.; Hansson, A.C.; Ubaldi, M.; Kallupi, M.; Cruz, M.T.; Oleata, C.S.; Heilig, M.; Roberto, M. Restraint stress alters nociceptin/orphanin FQ and CRF systems in the rat central amygdala: Significance for anxiety-like behaviors. J. Neurosci. 2014, 34, 363–372. [Google Scholar] [CrossRef]
  19. Schoenrock, S.A.; Tarantino, L.M. Animal models of environmental manipulations resulting in epigenetic modifications that increase risk for affective disorders. In Epigenetics in Psychiatry, 2nd ed.; Peedicayil, J., Grayson, D.R., Avramopoulos, D., Eds.; Academic Press: London, UK, 2014; pp. 181–205. [Google Scholar]
  20. Scanes, C.G. Animal well-being and behavior: Biology of stress in poultry with emphasis on glucocorticoids and the neutrophil to lymphocyte ratio. Poult. Sci. 2016, 95, 2208–2215. [Google Scholar] [CrossRef] [PubMed]
  21. Kadhim, H.J.; Kidd, M.; Kang, S.W.; Kuenzel, W.J. Differential delayed responses of arginine vasotocin and its receptors in septo-hypothalamic brain structures and anterior pituitary that sustain hypothalamic-pituitary-adrenal (HPA) axis functions during acute stress. Gen. Comp. Endocrinol. 2020, 286, 113302. [Google Scholar] [CrossRef]
  22. Honda, K.; Kurachi, K.; Takagi, S.; Saneyasu, T.; Kamisoyama, H. Role of corticosterone in lipid metabolism in broiler chick white adipose tissue. J. Poult. Sci. 2022, 59, 152–158. [Google Scholar] [CrossRef] [PubMed]
  23. Nakamura, K.; Mitarai, Y.; Yoshioka, M.; Koizumi, N.; Shibahara, T.; Nakajima, Y. Serum levels of interleukin-6, alpha1-acid glycoprotein, and corticosterone in two-week-old chickens inoculated with Escherichia coli lipopolysaccharide. Poult. Sci. 1998, 77, 908–911. [Google Scholar] [CrossRef] [PubMed]
  24. Wang, H.; Yang, F.; Song, Z.W.; Shao, H.T.; Bai, D.Y.; Ma, Y.B.; Kong, T.; Yang, F. The influence of immune stress induced by Escherichia coli lipopolysaccharide on the pharmacokinetics of danofloxacin in broilers. Poult. Sci. 2022, 101, 101629. [Google Scholar] [CrossRef]
  25. Scanes, C.G.; Hurst, K.; Thaxton, Y.; Archer, G.S.; Johnson, A. Effects of putative stressors and adrenocorticotropic hormone on plasma concentrations of corticosterone in market-weight male turkeys. Poult. Sci. 2020, 99, 1156–1162. [Google Scholar] [CrossRef]
  26. Huang, J.C.; Yang, J.; Huang, M.; Zhu, Z.S.; Sun, X.B.; Zhang, B.H.; Xu, X.L.; Meng, W.G.; Chen, K.J.; Xu, B.C. Effect of pre-slaughter shackling and wing flapping on plasma parameters, postmortem metabolism, AMPK, and meat quality of broilers. Poult. Sci. 2018, 97, 1841–1847. [Google Scholar] [CrossRef] [PubMed]
  27. Kannan, G.; Heath, J.L.; Wabeck, C.J.; Mench, J.A. Shackling of broilers: Effects on stress responses and breast meat quality. Br. Poult. Sci. 1997, 38, 323–332. [Google Scholar] [CrossRef]
  28. Scanes, C.G.; Hurst, K.; Thaxton, Y.; Archer, G.S.; Johnson, A. Effect of transportation and shackling on plasma concentrations of corticosterone and heterophil to lymphocyte ratios in market weight male turkeys in a commercial operation. Poult. Sci. 2020, 99, 546–554. [Google Scholar] [CrossRef] [PubMed]
  29. Wang, S.; Ni, Y.; Guo, F.; Fu, W.; Grossmann, R.; Zhao, R. Effect of corticosterone on growth and welfare of broiler chickens showing long or short tonic immobility. Comp. Biochem. Physiol. A 2013, 164, 537–543. [Google Scholar] [CrossRef]
  30. Yuan, L.; Lin, H.; Jiang, K.J.; Jiao, H.C.; Song, Z.G. Corticosterone administration and high-energy feed results in enhanced fat accumulation and insulin resistance in broiler chickens. Br. Poult. Sci. 2008, 49, 487–495. [Google Scholar] [CrossRef]
  31. Zhao, J.P.; Lin, H.; Jiao, H.C.; Song, Z.G. Corticosterone suppresses insulin- and NO-stimulated muscle glucose uptake in broiler chickens (Gallus gallus domesticus). Comp. Biochem. Physiol. 2009, 149, 448–454. [Google Scholar] [CrossRef]
  32. Zhao, J.P.; Jiao, H.C.; Song, Z.G.; Lin, H. Effects of L-arginine supplementation on glucose and nitric oxide (NO) levels and activity of NO synthase in corticosterone-challenged broiler chickens (Gallus gallus). Comp. Biochem. Physiol. C 2009, 150, 474–480. [Google Scholar] [CrossRef]
  33. Song, Z.; Zhang, H.X.; Zhu, L.X.; Jiao, H.; Lin, H. Dexamethasone alters the expression of genes related to the growth of skeletal muscle in chickens (Gallus gallus domesticus). J. Mol. Endocrinol. 2011, 46, 217–225. [Google Scholar] [CrossRef] [PubMed]
  34. Zhao, J.P.; Bao, J.; Wang, X.J.; Jiao, H.C.; Song, Z.G.; Lin, L. Altered gene and protein expression of glucose transporter1 underlies dexamethasone inhibition of insulin-stimulated glucose uptake in chicken muscles. J. Anim. Sci. 2012, 90, 4337–4345. [Google Scholar] [CrossRef] [PubMed]
  35. Liu, L.; Xu, S.; Wang, X.; Jiao, H.; Zhao, J.; Lin, H. Effect of dexamethasone on hypothalamic expression of appetite-related genes in chickens under different diet and feeding conditions. J. Anim. Sci. Biotechnol. 2016, 7, 23. [Google Scholar] [CrossRef] [PubMed]
  36. Pierzchala-Koziec, K.; Kępys, B.; Oeltgen, P.; Scanes, C.G. Developmental changes in the pituitary-adrenocortical axis and plasma met-enkephalin concentration in response to isolation stress in growing lambs. Folia Biol. 2018, 66, 53–61. [Google Scholar] [CrossRef]
  37. Scanes, C.G.; Pierzchala-Koziec, K. Perspectives on endogenous opioids in birds. Front. Physiol. 2018, 9, 1842. [Google Scholar] [CrossRef]
  38. Lightman, S.L.; Young, W.S. Changes in hypothalamic preproenkephalin A mRNA following stress and opiate withdrawal. Nature 1987, 328, 643–645. [Google Scholar] [CrossRef] [PubMed]
  39. Vágási, C.I.; Tóth, Z.; Pénzes, J.; Pap, P.L.; Ouyang, J.Q.; Lendvai, Á.Z. The relationship between hormones, glucose, and oxidative damage is condition and stress dependent in a free-living passerine bird. Physiol. Biochem. Zool. 2020, 93, 466–476. [Google Scholar] [CrossRef] [PubMed]
  40. Moore, I.M.; Jessop, T.S. Stress, reproduction, and adrenocortical modulation in amphibians and reptiles. Horm. Behav. 2003, 43, 39–47. [Google Scholar] [CrossRef]
  41. Pickering, A.D.; Pottinger, T.G.; Carragher, J.; Sumpter, J.P. The effects of acute and chronic stress on the levels of reproductive hormones in the plasma of mature male brown trout, Salmo trutta L. Gen. Comp. Endocrinol. 1987, 68, 249–259. [Google Scholar] [CrossRef]
  42. Wendelaar Bonga, S.E. The stress response in fish. Physiol. Rev. 1997, 77, 591–625. [Google Scholar] [CrossRef]
  43. Skomal, G.B.; Mandelman, J.W. The physiological response to anthropogenic stressors in marine elasmobranch fishes: A review with a focus on the secondary response. Comp. Biochem. Physiol. A 2012, 162, 146–155. [Google Scholar] [CrossRef]
  44. Shaughnessy, C.A.; McCormick, S.D. 11-Deoxycortisol is a stress responsive and gluconeogenic hormone in a jawless vertebrate, the sea lamprey (Petromyzon marinus). J. Exp. Biol. 2021, 224, jeb241943. [Google Scholar] [CrossRef] [PubMed]
  45. Mukherjee, S.; Baker, B.I.; Bird, D.J.; Buckingham, J.C. Hypothalamo-pituitary-interrenal responses to opioid substances in the trout. II. Effects of morphine and D-Ala2, Met5-enkephalinamide on plasma cortisol titres in vivo. Gen. Comp. Endocrinol. 1987, 68, 40–48. [Google Scholar] [CrossRef] [PubMed]
  46. Bird, D.J.; Buckingham, J.C.; Baker, B.I.; Mukherjee, S. Hypothalamo-pituitary-interrenal responses to opioid substances in the trout. I. Effects of morphine on the release in vitro of corticotrophin-releasing activity from the hypothalamus and corticotrophin from the pituitary gland. Gen. Comp. Endocrinol. 1987, 68, 33–39. [Google Scholar] [CrossRef] [PubMed]
  47. Tsagarakis, S.; Navarra, P.; Rees, L.H.; Besser, M.; Grossman, A.; Navara, P. Morphine directly modulates the release of stimulated corticotrophin-releasing factor-41 from rat hypothalamus in vitro. Endocrinology 1989, 124, 2330–2335. [Google Scholar] [CrossRef] [PubMed]
  48. Vassoler, F.M.; Toorie, A.M.; Byrnes, E.M. Transgenerational blunting of morphine-induced corticosterone secretion is associated with dysregulated gene expression in male offspring. Brain Res. 2018, 1679, 19–25. [Google Scholar] [CrossRef]
  49. Gulati, R.; Agrawal, D.K.; Ali, R.; Srivastava, U.; Hossain, M.M. Effect of met-enkephalin on blood glucose level. Indian J. Physiol. Pharmacol. 1998, 42, 559–562. [Google Scholar]
  50. Leach, R.P.; Allan, E.H.; Titheradge, M.A. The stimulation of glycogenolysis in isolated hepatocytes by opioid peptides. Biochem. J. 1985, 227, 191–197. [Google Scholar] [CrossRef]
  51. Negri, M.; Tonnarini, G.; D’Alessandro, M.; Fallucca, F. Plasma met-enkephalin in type I diabetes. Metabolism 1992, 41, 460–461. [Google Scholar] [CrossRef]
  52. Fallucca, F.; Tonnarini, G.; Di Biase, N.; D’Alessandro, M.; Negri, M. Plasma met-enkephalin levels in diabetic patients: Influence of autonomic neuropathy. Metabolism 1996, 45, 1065–1068. [Google Scholar] [CrossRef]
  53. Giugliano, D.; Quatraro, A.; Console, G.; Ceriello, A.; Torella, R.; D’Onofrio, F. Inhibitory effect of enkephalin on insulin secretion in healthy subjects and in non-insulin-dependent diabetic subjects. Metabolism 1987, 36, 286–289. [Google Scholar] [CrossRef]
  54. Mátis, G.; Kulcsár, A.; Mackei, M.; Petrilla, J.; Neogrády, Z. Comparative study on the modulation of incretin and insulin homeostasis by butyrate in chicken and rabbit. PLoS ONE 2018, 13, e0205512. [Google Scholar] [CrossRef]
  55. Ji, J.; Tao, Y.; Zhang, X.; Pan, J.; Zhu, X.; Wang, H.; Du, P.; Zhu, Y.; Huang, Y.Q.; Chen, W. Dynamic changes of blood glucose, serum biochemical parameters and gene expression in response to exogenous insulin in Arbor Acres broilers and Silky fowls. Sci. Rep. 2020, 10, 6697. [Google Scholar] [CrossRef]
  56. Seki, Y.; Sato, K.; Kono, T.; Abe, H.; Akiba, Y. Broiler chickens (Ross strain) lack insulin-responsive glucose transporter GLUT4 and have GLUT8 cDNA. Gen. Comp. Endocrinol. 2003, 133, 80–87. [Google Scholar] [CrossRef]
  57. Freeman, B.M.; Manning, A.C. The effects of repeated injections of adrenaline on the response of the fowl to further alarm stimulation. Res. Vet. Sci. 1979, 27, 76–81. [Google Scholar] [CrossRef]
  58. Salimi, M.; Eskandari, F.; Binayi, F.; Eliassi, A.; Ghanbarian, H.; Hedayati, M.; Fahanik-Babaei, J.; Eftekhary, M.; Keyhanmanesh, R.; Zardooz, H. Maternal stress induced endoplasmic reticulum stress and impaired pancreatic islets’ insulin secretion via glucocorticoid receptor upregulation in adult male rat offspring. Sci. Rep. 2022, 12, 12552. [Google Scholar] [CrossRef]
  59. Ghalami, J.; Zardooz, H.; Rostamkhani, F.; Farrokhi, B.; Hedayati, M. Glucose-stimulated insulin secretion: Effects of high-fat diet and acute stress. J. Endocrinol. Investig. 2013, 36, 835–842. [Google Scholar]
  60. Byers, M.S.; Howard, C.; Wang, X. Avian and mammalian facilitative glucose transporters. Microarrays 2017, 6, 7. [Google Scholar] [CrossRef] [PubMed]
  61. King, D.L.; Hazelwood, R.L. Regulation of avian insulin secretion by isolated perfused chicken pancreas. Am. J. Physiol. 1976, 231, 1830–1839. [Google Scholar] [CrossRef] [PubMed]
  62. Rideau, N.; Simon, J.; Leclercq, B. Further characterization of insulin secretion from the perfused duodenum-pancreas of chicken: A comparison of insulin release in chickens selected for high and low abdominal fat content. Endocrinology 1986, 119, 2635–2641. [Google Scholar] [CrossRef]
  63. Wise, J.K.; Hendler, R.; Felig, P. Influence of glucocorticoids on glucagon secretion and plasma amino acid concentrations in man. J. Clin. Investig. 1973, 52, 2774–2782. [Google Scholar] [CrossRef]
  64. van Raalte, D.H.; Nofrate, V.; Bunck, M.C.; van Iersel, T.; Schaap, J.E.; Nassander, U.K.; Diamant, M. Acute and 2-week exposure to prednisolone impair different aspects of beta-cell function in healthy men. Eur. J. Endocrinol. 2010, 162, 729–735. [Google Scholar] [CrossRef]
  65. Wajngot, A.; Giacca, A.; Grill, V.; Vranic, M.; Efendic, S. The diabetogenic effects of glucocorticoids are more pronounced in low- than in high-insulin responders. Proc. Natl. Acad. Sci. USA 1992, 89, 6035–6039. [Google Scholar] [CrossRef]
  66. Rafacho, A.; Cestari, T.M.; Taboga, S.R.; Boschero, A.C.; Bosqueiro, J.R. High doses of dexamethasone induce increased beta-cell proliferation in pancreatic rat islets. Am. J. Physiol. 2009, 296, E681–E689. [Google Scholar]
  67. Malaisse, W.J.; Malaisse-Lagae, F.; McCraw, E.F.; Wright, P.H. Insulin secretion in vitro by pancreatic tissue from normal, adrenalectomized, and cortisol-treated rats. Proc. Soc. Exp. Biol. Med. 1967, 124, 924–928. [Google Scholar] [CrossRef] [PubMed]
  68. Lambillotte, C.; Gilon, P.; Henquin, J.-C. Direct glucocorticoid inhibition of insulin secretion. An in vitro study of dexamethasone effects in mouse islets. J. Clin. Investig. 1997, 99, 414–423. [Google Scholar] [CrossRef]
  69. Longano, C.A.; Fletcher, H.P. Insulin release after acute hydrocortisone treatment in mice. Metab. Clin. Exp. 1983, 32, 603–608. [Google Scholar] [CrossRef] [PubMed]
  70. Delaunay, F.; Khan, A.; Cintra, A.; Davani, B.; Ling, Z.C.; Andersson, A.; Ostenson, C.G.; Gustafsson, J.; Efendic, S.; Okret, S. Pancreatic beta cells are important targets for the diabetogenic effects of glucocorticoids. J. Clin. Investig. 1997, 100, 2094–2098. [Google Scholar] [CrossRef] [PubMed]
  71. Hazelwood, R.L.; Lorenz, F.W. Effects of fasting and insulin metabolism in the domestic fowl. Am. J. Physiol. 1959, 197, 47–51. [Google Scholar] [CrossRef]
  72. Depke, M.; Fusch, G.; Domanska, G.; Geffers, R.; Volker, H. Hypermetabolic syndrome as a consequence of repeated psychological stress in mice. Endocrinology 2008, 149, 2714–2723. [Google Scholar] [CrossRef] [PubMed]
  73. Holmes, W.N.; Broock, R.L.; Devlin, J. Tritiated corticosteroid metabolism in intact and adenohypophysectomized ducks (Anas platyrhynchos). Gen. Comp. Endocrinol. 1974, 22, 417–427. [Google Scholar] [CrossRef] [PubMed]
  74. Birrenkott, G.P.; Wiggins, M.E. Determination of dexamethasone and corticosterone half-lives. Poult. Sci. 1984, 63, 1064–1068. [Google Scholar] [CrossRef] [PubMed]
Figure 1. Effect of restraint stress for 30 min in the presence or absence of naltrexone on the plasma concentrations of corticosterone (left) and Met-enkephalin (right) in 14-week-old female and male chickens. [key: 0 control, Re—restraint stress, Na—naltrexone (2 mg/kg b.w. i.v.)]. Vertical bars indicate SEM (n = 5). Different letters indicate a significant difference, p < 0.05.
Animals 14 00752 g001
Figure 2. Effect of restraint stress for 30 min in the presence or absence of naltrexone on the plasma concentrations of insulin (left) and glucose (right) in 14-week-old female and male chickens. [key: 0 control, Re—restraint stress, Na—naltrexone (2 mg/kg, b.w. i.v.)]. Vertical bars indicate SEM (n = 5). a, b, c, d, e Different superscript letters indicate a significant difference, p < 0.05.
Animals 14 00752 g002
Figure 3. Effect of restraint and/or naltrexone administration (n = 3 per sex per treatment) on PENK expression (PSL/mm2) in anterior pituitary and adrenal tissue in chickens. [a, b, c, d—Different superscript letter indicates differences, p < 0.05; Res—chickens subjected to restraint stress, Nal—chickens receiving naltrexone; vertical bars indicate SEM (n = 3 per sex per treatment)].
Animals 14 00752 g003
Table 1. Basal plasma concentrations of corticosterone, Met-enkephalin, glucose and insulin in female (n = 20) and male (n = 20) chickens (mean ± SEM).
FemaleMale
Corticosterone nmoles L−115.0 ± 0.4115.0 ± 0.34
Met-enkephalin pmoles L−137.1 ± 0.58 a41.9 ± 0.73 b
Insulin pmoles L−10.696 ± 0.0190.714 ± 0.023
Glucose mmoles L−19.89 ± 0.094 a11.2 ± 0.109 b
a,b Different superscript letters indicate a significant sex difference, p < 0.0001.
Table 2. Changes in the plasma concentrations of corticosterone, Met-enkephalin, insulin and glucose in 14-week-old chickens following multiple blood sampling (controls), restraint stress and/or naltrexone administration # [mean ± (n = 5) SEM].
TreatmentsPre-TreatmentTreatment 30 min10 min RecoveryPre-TreatmentTreatment 30 min10 min Recovery
Plasma concentrations of corticosterone nmoles L−1Plasma concentrations of Met-enkephalin pmoles L−1
Controls
Female15.0 ± 0.7114.0 ± 0.71 p13.4 ± 0.9338.6 ± 0.8136.0 ± 1.00 p35.0 ± 1.14
Male13.6 ± 0.5116.2 ± 0.58 p15.0 ± 0.7141.6 ± 0.8143.8 ± 1.07 pq44.8 ± 1.07
Restraint
Female14.0 ± 0.71 a25.6 ± 1.03 bq13.0 ± 0.71 a37.0 ± 1.22 a63.6 ± 1.44 br46.2 ± 1.56 a
Male15.8 ± 0.86 a32.4 ± 1.21 cr23.5 ± 1.64 b37.8 ± 1.07 a96.4 ± 1.44 cs88.0 ± 1.14 b
Naltrexone
Female16.8 ± 0.61 b23.4 ± 0.51 cpq12.6 ± 0.51 a35.6 ± 1.36 b26.0 ± 0.71 ap31.6 ± 0.51 b
Male15.4 ± 0.51 a26.4 ± 0.51 bq17.8 ± 0.37 a43.2 ± 0.86 b33.0 ± 0.71 ap41.6 ± 1.50 b
Restraint + naltrexone
Female14.1 ± 0.7118.0 ± 0.32 pq16.8 ± 0.3737.4 ± 1.12 b31.4 ± 1.57 ap27.8 ± 0.86 a
Male15.4 ± 0.7123.0 ± 0.71 pq18.6 ± 0.93 pq45.0 ± 0.71 a65.0 ± 1.58 cr59.2 ± 1.24 b
Effects3-way ANOVA
F = (P</=)
3-way ANOVA
F = (P</=)
Sex56.9 (<0.001) 540 (<0.001)
Restraint71.1 (<0.001) 1132 (<0.001)
Naltrexone1.33 (0.257) 583 (<0.001)
Sex × restraint interaction8.57 (<0.01) 218 (<0.001)
Sex × naltrexone interaction0.20 (=0.66) 0
Restraint × naltrexone interaction263
(<0.001)
150
(<0.001)
Sex × restraint interaction × naltrexone interaction1.33
(=0.26)
0.21
(=0.65)
Plasma concentrations of insulin
pmoles L−1
Plasma concentrations of glucose
mmoles L−1
Controls
Female0.68 ± 0.031 a0.74 ± 0.03 bp0.83 ± 0.03 b10.3 ± 0.10 a11.1 ± 0.06 bp11.6 ± 0.13 c
Male0.71 ± 0.052 a0.89 ± 0.05 ap1.22 ± 0.06 b11.5 ± 0.06 a11.7 ± 0.12 ap12.2 ± 0.13 b
Restraint
Female0.73 ± 0.040 a15.1 ± 0.35 bq14.0 ± 1.06 b9.7 ± 0.13 a18.1 ± 0.28 cr13.8 ± 1.16 b
Male0.68 ± 0.056 a12.6 ± 0.36 bq15.4 ± 1.90 b11.4 ± 0.07 a25.1 ± 0.20 cs13.8 ± 0.55 b
Naltrexone
Female0.71 ± 0.035 a1.66 ± 0.06 bp1.85 ± 0.08 c9.4 ± 0.06 a10.6 ± 0.17 bp11.7 ± 0.12 c
Male 0.76 ± 0.039 a1.85 ± 0.04 bp2.38 ± 0.04 c11.0 ± 0.14 a20.6 ± 0.14 cr14.0 ± 0.14 b
Restraint + naltrexone
Female0.66 ± 0.022 a15.3 ± 0.67 q18.8 ± 0.67 c10.2 ± 0.14 a15.0 ± 0.17 bq14.0 ± 0.35 b
Male0.72 ± 0.042 a13.8 ± 0.41 bq17.6 ± 0.35 c11.0 ± 0.14 a20.6 ± 0.11 cq14.0 ± 0.35 b
Effects3-way ANOVA
F= (P</=)
3-way ANOVA
F= (P</=)
Sex14.0 (=0.001) 14.5 (=0.001)
Restraint3022 (<0.001) 235 (<0.001)
Naltrexone12.0 (<0.01) 15.1 (<0.001)
Sex × restraint interaction20.1
(<0.001)
8.6
(< 0.01)
Sex × naltrexone interaction1.34
(=0.25)
0.80
(=0.38)
Restraint × naltrexone interaction0.30
(=0.59)
F = 2.06
(=0.16)
Sex × restraint interaction × naltrexone interactionF = 1.07
(=0.31)
F = 7.4
(<0.05)
# Sampled during pre-treatment, after 30 min and 40 min. a,b,c Different superscript letters indicate differences with time; p,q,r,s different superscript letters indicate a significant difference.
Disclaimer/Publisher’s Note: The statements, opinions and data contained in all publications are solely those of the individual author(s) and contributor(s) and not of MDPI and/or the editor(s). MDPI and/or the editor(s) disclaim responsibility for any injury to people or property resulting from any ideas, methods, instructions or products referred to in the content.

