Article

Changes in Parameters Registered by Innovative Technologies in Cows with Subclinical Acidosis

by
Ramūnas Antanaitis
1,*,
Karina Džermeikaitė
1,
Justina Krištolaitytė
1,
Rolandas Stankevičius
2,
Gintaras Daunoras
3,
Mindaugas Televičius
1,
Dovilė Malašauskienė
1,
John Cook
4 and
Lorenzo Viora
5
1
Large Animal Clinic, Veterinary Academy, Lithuanian University of Health Sciences, Tilžės Str. 18, LT-47181 Kaunas, Lithuania
2
Department of Animal Nutrition, Lithuanian University of Health Sciences, Tilzes Str. 18, LT-47181 Kaunas, Lithuania
3
L. Kriaučeliūnas Small Animal Clinic, Veterinary Faculty, Lithuanian University of Health Sciences, LT-47181 Kaunas, Lithuania
4
RCVS Recognised Specialist Cattle Health and Production, Technical Veterinarian, Avenida de los Robles Visalia, Visalia, CA 93291, USA
5
Scottish Centre for Production Animal Health and Food Safety, School of Biodiversity, One Health and Veterinary Medicine, University of Glasgow, Glasgow G12 8QQ, UK
*
Author to whom correspondence should be addressed.
Animals 2024, 14(13), 1883; https://doi.org/10.3390/ani14131883
Submission received: 31 May 2024 / Revised: 22 June 2024 / Accepted: 24 June 2024 / Published: 26 June 2024

Abstract

:

Simple Summary

Innovative technologies (ITs) involve real-time monitoring systems that use sensor technology to focus on individual animals. These advancements represent an important avenue for value creation across various stakeholders, with farmers primarily benefiting from its utility as a versatile tool. Our hypothesis suggested changes in biomarkers detected by innovative technologies among cows with subclinical acidosis compared to healthy ones. The results indicated that subclinical acidotic cows exhibited significantly higher activity levels compared to healthy cows, along with lower reticulorumen pH, decreased milk yield, a lower milk fat-to-protein ratio, and reduced rumination time.

Abstract

The hypothesis of this study was that there were changes in biomarkers registered by innovative technologies in cows with subclinical acidosis. The aim of this study was to identify changes in the in-line milk fat-to-protein ratio and cow feeding behaviors such as reticulorumen pH, reticulorumen temperature, cow activity, and water intake with subclinical acidosis. From a total of 98 cows, 59 cows were selected to meet the following criteria (2 or more lactations, with 31 days in milk (DIM)). The selected animals were separated into two groups based on general clinical examination and reticulorumen pH: the subclinical acidosis group (SCA, n = 23) and the healthy group (HC, n = 36). During the diagnosis of subclinical acidosis and following the clinical examination of the healthy group using the BROLIS HerdLine system, the daily averages of milk yield (kg/day), milk fat (%), milk protein (%), and the milk fat-to-protein ratio were recorded. Simultaneously, by using Smaxtec technology, reticulorumen parameters and cow activity, including pH, temperature (°C), rumination time (minutes/day), and water intake (hours/day), were registered. Changes in parameters measured using innovative technologies were able to identify cows with subclinical acidosis. Cows with subclinical acidosis had a lower reticulorumen pH by 18.8% (p < 0.0001), a decreased milk yield by 10.49% (p < 0.001), a lower milk fat-to-protein ratio by 11.88% (p < 0.01), and a decreased rumination time by 6.59% (p < 0.01). However, the activity of these cows was higher by 57.19% (p < 0.001) compared to healthy cows. From a practical point of view, we suggest that veterinarians and farmers track parameters such as reticulorumen pH, milk yield, milk fat-to-protein ratio, rumination time, and activity for the identification of subclinical acidosis.

1. Introduction

High milk output is common in modern dairy farming, which poses a risk to cows’ health due to a relationship that is likely driven by survivor bias. While the observation is frequently made at the level of individual cows, it is not commonly noticed at the level of the entire herd [1]. The aim of feeding diets that are high in starch but low in fiber is to increase energy intake and meet the cow’s nutrient requirements while adhering to the limitations of the cow’s dry matter intake (DMI). Optimal milk production necessitates abundant lactose precursors, which in turn rely on glucose as a substrate for lactose synthesis. Therefore, maintaining enough glucose levels is crucial for supporting the formation of lactose [2,3]. While high starch diets are essential, they also heighten the likelihood of developing subacute ruminal acidosis (SARA), as evidenced by research [4,5,6]. SARA is a widely acknowledged digestive issue in high-producing dairy cows, detrimentally affecting both animal welfare and the economic efficiency of dairy farms, especially in well-run operations, according to previous studies [7,8,9,10]. Although cows are naturally inclined to consume forage-based diets, their nutritional intake frequently deviates. This typically results in the consumption of diets that contain a mixture of easily fermentable substrates, such as grains, or an excessive amount of long or inedible particles in the feed. This might result in alterations to one’s diet, disruptions to regular eating habits, and sporadic instances of excessive food consumption [11]. Definitions and ruminal pH benchmarks for diagnosing SARA vary across different studies; however, it typically is identified when the ruminal pH falls between 5.2 and 6 for an extended time frame [12]. SARA manifests through daily periods of reduced ruminal pH, with the pH significantly dropping for several hours each day [7,13,14], caused by an accumulation of volatile fatty acids and a lack of adequate buffering in the rumen [7]. Cows affected by SARA do not exhibit specific clinical symptoms of illness [6,15]. Nevertheless, SARA has been linked to inflammation in various organs and tissues within dairy cows. Its effects are varied and multifaceted, leading to decreased feed consumption, further exacerbating erratic eating patterns, lower digestibility of the diet, diminished milk production, a drop in the percentage of milk fat, gastrointestinal injuries, liver abscesses, and lameness [6,7]. Damage to the lining of the gastrointestinal tract, resulting in localized or systemic inflammation, is believed to be a key factor behind many of these adverse outcomes.
Innovative technologies (ITs) involve the use of real-time monitoring technologies, essentially using sensor technology to target individual animals. ITs are an important source of value creation for a range of stakeholders, although they are mostly useful for farmers as tools that offer the potential for enhancing and optimizing management in various areas, including nutrition, housing, and more. In addition to lessening environmental effects, it improves the ability to improve animal welfare, effectiveness, and health [16]. Notable real-time monitoring systems in precision livestock farming (PLF) are the BROLIS HerdLine in-line milk analyzer and the Smaxtec system, which register parameters such as reticulorumen pH and temperature. Reticulorumen temperature is a useful indicator of cattle health when used in conjunction with water intake measurements in dairy herds [17]. Real-time monitoring of reticulorumen pH and temperature is advantageous for evaluating the risk of SARA, especially in high-risk groups of cattle, such as cows in early lactation [17]. In order to forecast the nutritional and health state of dairy cows, Alzahal et al. [18] evaluated the relationship between the pH and ruminal temperature of the animals. SARA is defined as a condition in which the ruminal pH drops below 5.6 for a prolonged period. Additionally, cows with a pH lower than 5.6 had higher ruminal temperatures [18].
Livestock reproductive health can also be predicted using reticuloruminal pH data [9]. Low pH, or altered rumen metabolism, is associated with lower reproductive rates in dairy cows. Reticuloruminal pH is, therefore, a highly reliable indicator of a dairy cow’s procreative performance. Further research is necessary to fully understand how reticuloruminal pH affects cow reproductive health [9]. According to previous research, ruminal temperature decreases one day before parturition [19].
The ideal ruminal pH range for diet fermentation and fiber digestion is 6.0–6.4. Fiber is effectively broken down by the cellulolytic bacteria at this previously mentioned pH range, as it is blocked at pH values lower than 6.0 [18]. As a result, an increase in acidity due to a drop in ruminal pH raises abomasal temperature [9]. Thus, one can forecast a cow’s health state using the two criteria. Nevertheless, it is crucial to verify any findings by testing them on several management systems to guarantee that they are accurate.
Regular milking sessions, which involve the frequent and non-invasive acquisition of milk, along with established standard analysis methods, highlight the diagnostic utility of milk [20]. Precision cow husbandry has advanced due to the recent commercial availability of behavior recording systems. To improve early warning systems, more research into the application of early milk samples and the possible integration of other data sources is necessary. Before the model is put into operation, further data from other farms must be incorporated and assessed in order to guarantee that it is applicable to a variety of management styles and dietary requirements [21]. A BROLIS HerdLine in-line milk analyzer (Brolis Sensor Technology, Vilnius, Lithuania) can be used to measure the daily milk fat-to-protein ratios of cows [22]. Understanding the relationships between these features in food, blood, and milk can assist in understanding the health and production status of animals. Milk volume and components are generated from blood and food components [23]. The percentages of milk fat and protein, as well as the milk fat-to-protein (F/P) ratio, are examples of possible measurements [24]. Because milk properties match markers of lipolysis and ketogenesis in cow blood, they are an important sign of metabolic stress in cows. Since milk samples may be obtained non-invasively, they are appropriate for normal practice assessments of metabolic status. We hypothesize this would be a useful addition to herd health programs for dairy farms, and producers can identify which cows are susceptible to metabolic stress by tracking each cow’s energy status [22]. Previous research has shown that the in-line F/P ratio has a substantial positive correlation with blood non-esterified fatty acid levels, suggesting that it can be used to identify cows at increased risk of negative energy balance [22].
The hypothesis of this study was that subclinical acidosis in cows impacts the in-line milk fat-to-protein ratio, reticulorumen pH, reticulorumen temperature, cow activity, and water intake, as registered by innovative technologies. The aim of this study was to identify changes in the in-line milk fat-to-protein ratio and cow feeding behaviors such as reticulorumen pH, reticulorumen temperature, cow activity, and water intake with subclinical acidosis.

2. Materials and Methods

2.1. Farm and Animals

This study adhered to the guidelines set forth by the Lithuanian Law on Animal Welfare and Protection, with an approval number of PK012858. Conducted in Lithuania, the research spanned from 1 October to 30 November 2023. Dairy cows were housed in free-stall barns equipped with ventilation systems and received a balanced total mixed ration (TMR) tailored to their physiological requirements. Feeding times were 06:00 and 18:00 daily. The cows were fed from a clean bunk. Any leftover feed was cleaned out every day at 5:00. This diet comprised 25% corn silage, 5% alfalfa grass hay, 20% grass silage, 15% sugar beet pulp silage, 30% grain concentrate mash, and 5% mineral mix, aiming to satisfy the nutritional demands of a 500 kg Holstein cow producing 37 kg of milk daily. Table 1 presents the nutritional content of the diet provided to dairy cows. The average bunk space per cow was approximately 65 cm. Milking was carried out twice daily at 05:00 and 17:00 in a parlor system. Of the 1160 cows examined, 59 were selected for this study, focusing on those in their second or subsequent lactations and within the first 5 to 30 days post-calving. The average body weight of these cows was 650 kg ± 45 kg, and they achieved an average energy-corrected milk yield (with 4.2% fat and 3.6% protein) of 12,500 kg per lactation. The calculations were performed based on predetermined formulas [25].

2.2. Allocation to Groups for Analysis

The 59 selected animals were separated into two groups based on general clinical examination and reticulorumen pH: the subclinical acidosis group (SCA, n = 23) and the healthy cow group (HC, n = 36).
The SCA group was created based on signs of subclinical acidosis, such as rumen motility rates of five to six times every three minutes, moderate to severe diarrhea, and the presence of undigested food particles in their feces. To analyze fiber content, fecal matter was passed through a sieve [26]. Based on the reticulorumen pH test, the pH level of the reticulorumen was found to be below 6.22 [27], and the milk fat-to-protein ratio was less than 1.2 [26].
The healthy cow group (HC) was established based on similar principles, showing ruminal motility every three minutes, no sign of diarrhea, and no presence of undigested particles in their feces. The reticulorumen pH of this group was greater than 6.22 [27].
Throughout the entire period of investigation, all cows remained within their assigned group.

2.3. Measurement of Variables

2.3.1. Registration of In-Line Milk Fat-to-Protein Ratio

The composition of milk, including its fat and protein content, was analyzed using the BROLIS HerdLine in-line milk analyzer from Brolis Sensor Technology in Vilnius, Lithuania. This device features a GaSb widely tunable external cavity laser-based spectrometer that operates in the 2100–2400 nm spectral range and monitors milk flow in transmission mode throughout the milking process. By analyzing molecular absorption spectra, it determines the concentrations of the milk’s primary components, effectively serving as a compact, on-farm laboratory. The analyzer provides continuous assessments of each cow’s milk composition during milking. This streamlined “mini-spectroscope” is conveniently placed in the milking stalls or attached to the milking robot along the milk line.
Each BROLIS HerdLine in-line milk analyzer was calibrated, and its accuracy was evaluated in the Eurofins lab. The resulting values of the root mean square error of prediction (RMSEP) were 0.21% for fat, 0.19% for protein, and 0.19% for lactose.

2.3.2. Recticulorumen Data Collection

Reticulorumen parameters (temperature (RT), pH, and total reticulated rumination (TRR)) and physical activity were monitored using SmaXtec boluses developed by SmaXtec animal care technology® (Graz, Austria), with a focus on animal health and welfare. This technology facilitates the continuous, real-time monitoring of data such as ruminal pH and temperature. The boluses, prepared as per the manufacturer’s guidelines, were administered into the cows’ reticulorumen using a specialized tool. Every cow was administered a bolus by the same skilled veterinarian. Each cow received a single bolus orally; the boluses were designed to settle in the reticulum due to gravity. Before deployment, the boluses were activated, linked to each cow’s individual ear tag for identification, and connected to the central monitoring station. The device’s functionality was verified, and it was calibrated using a standard pH 7.00 buffer solution (provided by Reagecon, Shannon, Ireland). During the administration process, cows were secured in a self-locking stand, and the individual administering the bolus manually restrained each cow’s head, opened its mouth, and used an appropriate applicator to place the bolus at the base of the tongue for the cow to swallow willingly. Post-administration, cows were observed for two hours to ensure that there were no adverse effects.
Data collection was facilitated by antennas from smaXtec animal care technology®, utilizing an implanted and wireless device that recorded reticulorumen temperature (RT), pH, total reticulated rumination (TRR), and physical activity. The system, managed by a microprocessor, collected pH and TRR data through an A/D converter, storing it on an external memory chip for later analysis. The smaXtec messenger® software (version 4) compiled all the collected data.
Throughout the experiment, we measured several parameters: reticulorumen pH, reticulorumen temperature, cow activity, and water intake.

2.4. Duration of Experimental Observation

During the diagnosis of subclinical acidosis and following the clinical examination of the healthy group using the BROLIS HerdLine system, the daily averages of milk yield (kg/day), milk fat (%), milk protein (%), and the milk fat-to-protein ratio were recorded. Simultaneously, by using Smaxtec Techmologie, reticulorumen parameters and cow activity, including pH, temperature (°C), rumination time (min/day), and water intake (h/day), were registered.

2.5. Statistical Analyses

All statistical analyses were conducted using version 25.0 of IBM SPSS Statistics for Windows (SPSS Inc., IBM Corp., Armonk, New York, NY, USA, 2017). To assess the normality of the data distribution, the Shapiro–Wilk test was utilized. Data were presented as the mean plus/minus the standard error of the mean (M ± SEM). Student’s t-test was applied to compare the average values of the SCK, SCA, and H groups, which were normally distributed. A p-value of less than 0.05 was considered statistically significant (p < 0.05). Pearson’s correlation coefficient was calculated to identify the linear relationship between variables. Linear regression was used to explore the statistical association between the in-line milk fat-to-protein ratio and other parameters, with significance determined at a probability of less than 0.05. All pH values were converted to H+ ion concentrations before running the statistics. The mean H+ ion concentration was calculated and then converted to pH. The SEM was presented as the H+ ion concentration.

3. Results

3.1. Statistical Overview of the Examined Indicators or Descriptive Distribution of Variables

We found significant differences between the groups in reticulorumen pH, milk yield, milk fat, protein, milk fat-to-protein ratio, cow activity, and rumination time (Table 2). We found that cows in the SCA group were less productive, had lower reticulorumen pH and lower levels of milk fat, protein, and milk fat-to-protein ratio (F/P), exhibited shorter rumination times, and were more active compared with the HC group.
The mean reticulorumen pH of the SCA group was 5.28 (±0.11), while in the HC group, it was 6.22 (±0.33). The reticulorumen pH in the SCA group was 18.8% lower than that in the HC group (p < 0.001).
Milk yield (MY) in cows from the SCA group was 10.49% lower than in cows from the HC group (p < 0.001). The average MY in the SCA group was 29.43 (±1.6) kg/d., while in the HC group, it was 32.52 (±1.35) kg/d.
The milk fat-to-protein ratio (F/P) in SCA cows was 11.88% lower than in the HC group (p < 0.01). The average F/P ratio in the SCA group was 1.01 (±0.06), while in the HC group, it was 1.13 (±0.21).
Milk fat was 17.71% lower in the SCA group (p < 0.001). The average milk fat content in the SCA group was 3.67 (±0.25)%, while in the HC group, it was 4.32 (±0.81)%.
Milk protein was also 4.95% lower in the SCA group (p < 0.001). The average milk protein content in the SCA group was 3.63 (±0.05)%, while in the HC group, it was 3.81 (±0.12)%.
Cow daily activity in the SCA group was 57.19% higher than in the HC group (p < 0.001). The average activity of cows in the SCA group was 4.59 (±1.01), while in the HC group, it was 2.92 (±0.97).
The rumination time (RT) in the SCA group was 6.59% lower than in the HC group (p < 0.01). The average RT in the SCA group was 488.31 (±32.51) min/d., while in the HC group, it was 520.51 (±47.35) min/d.

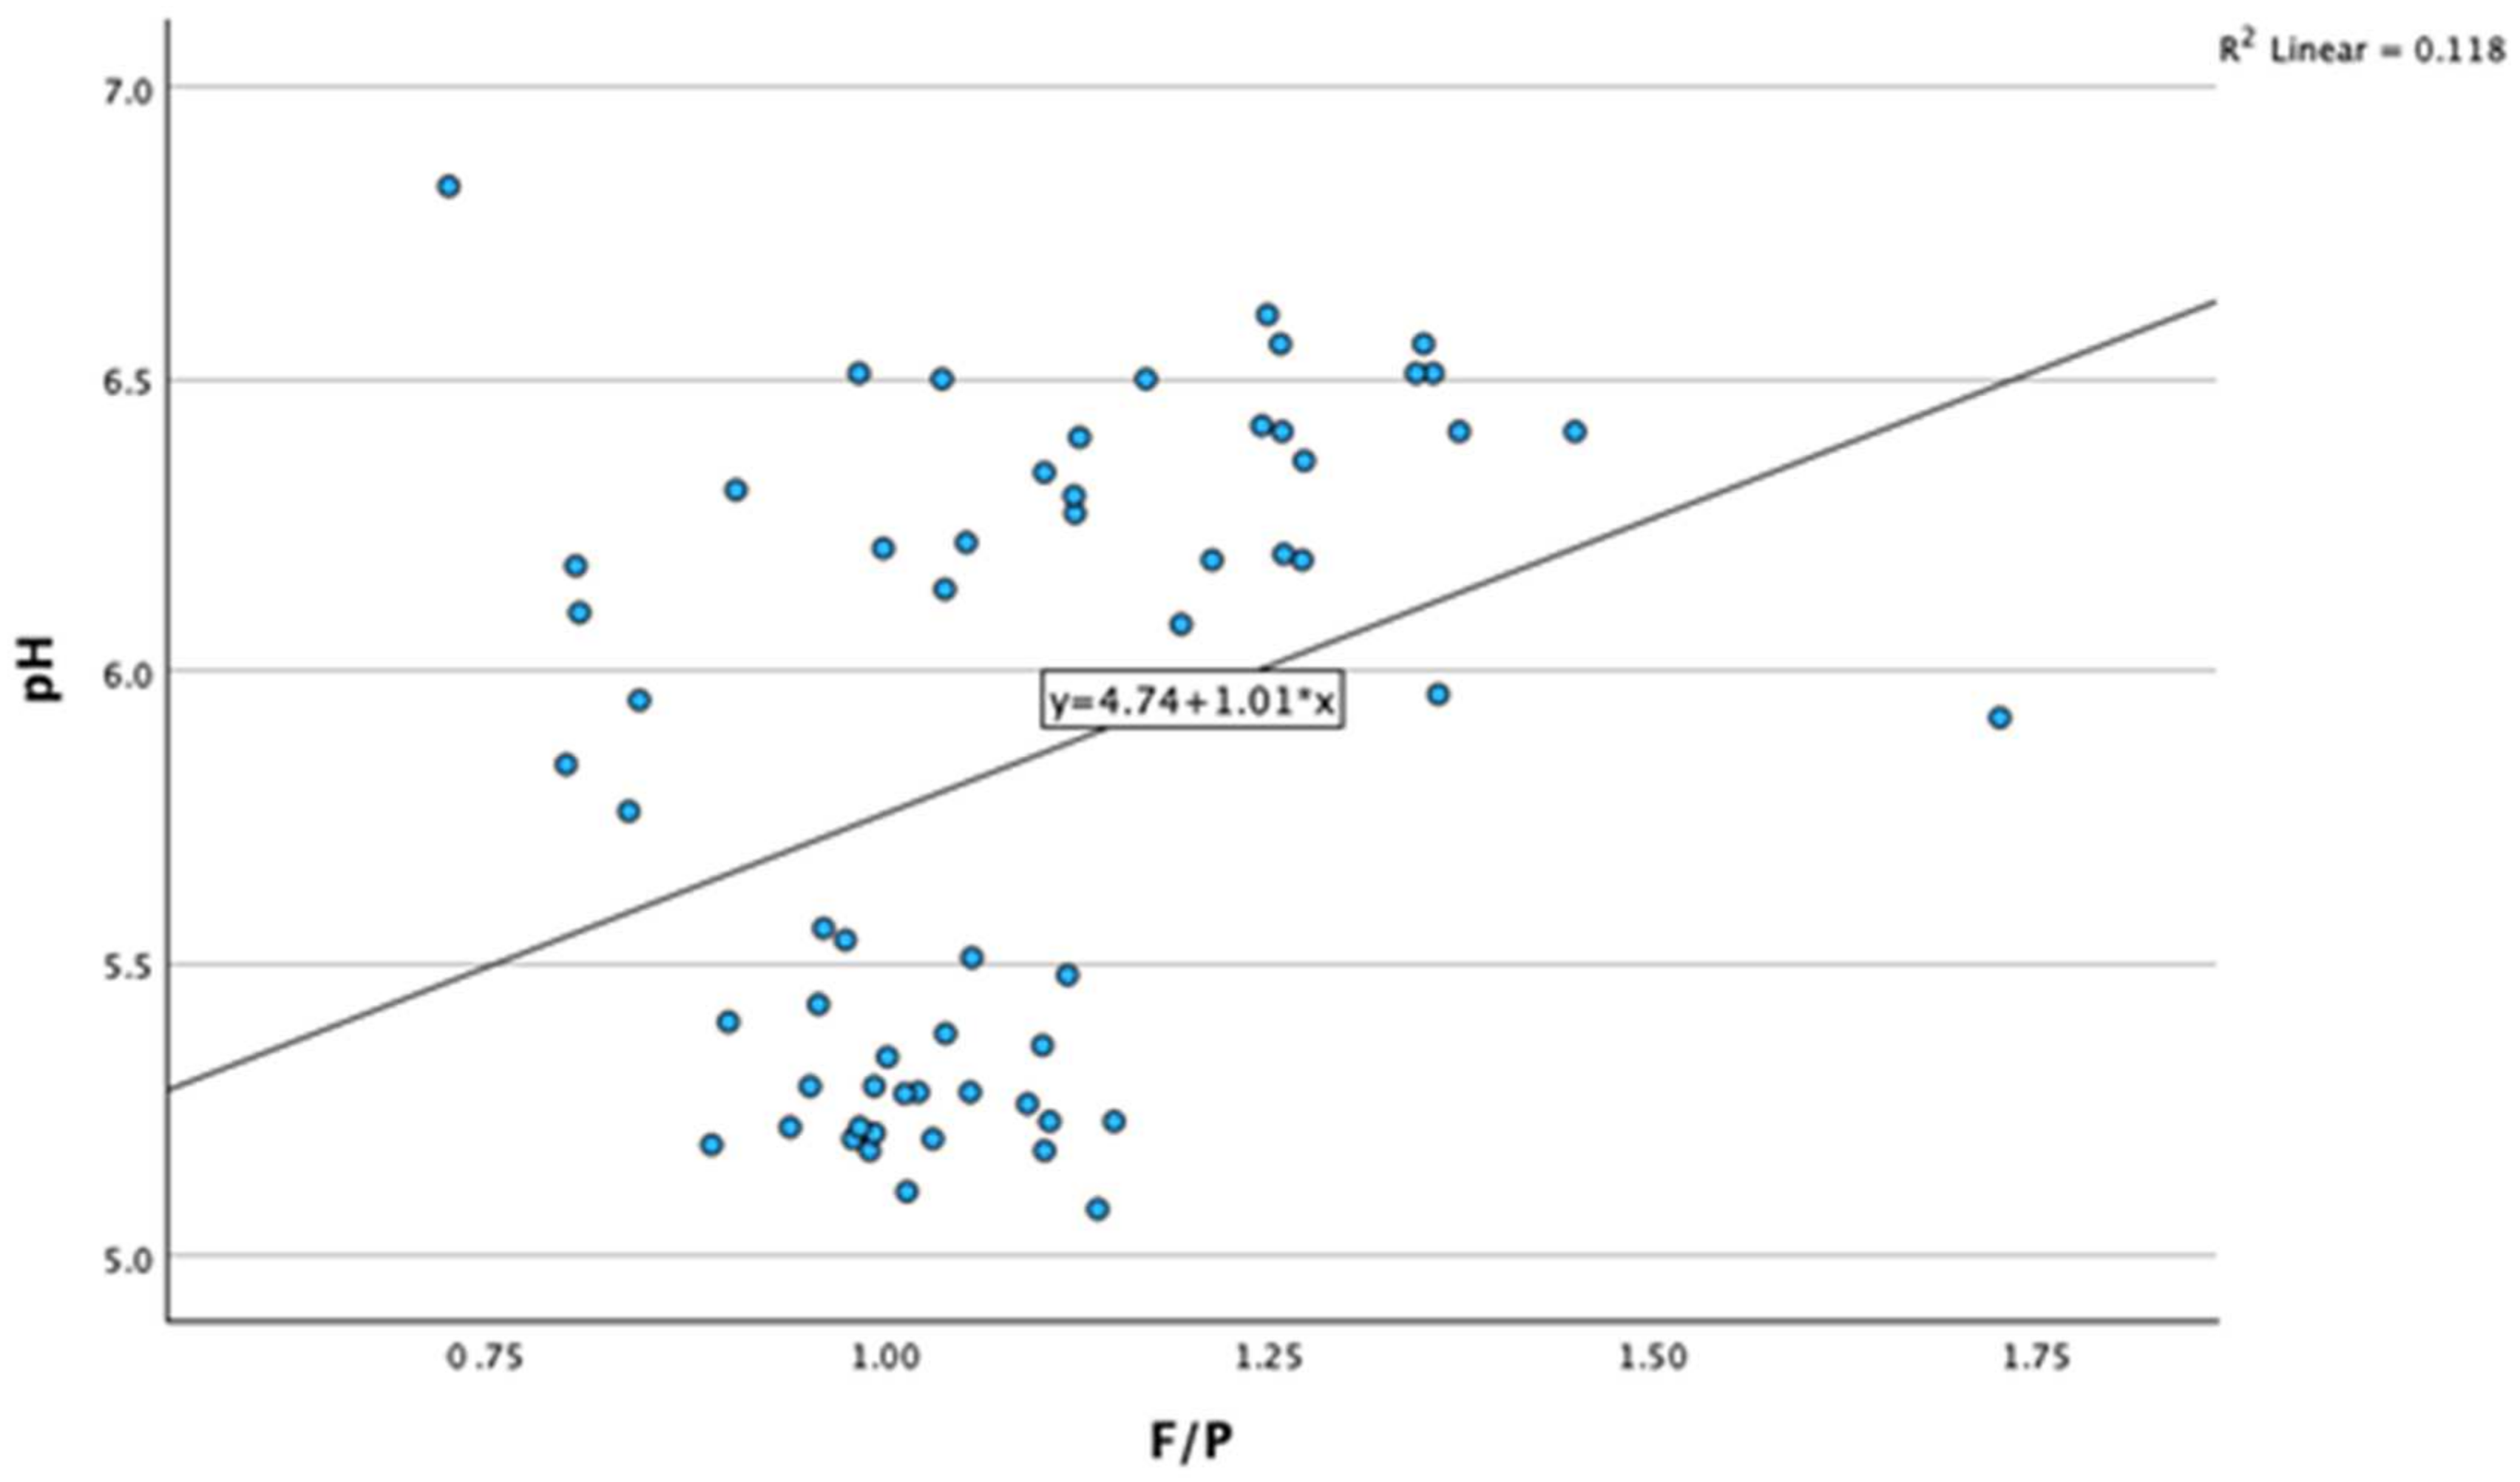
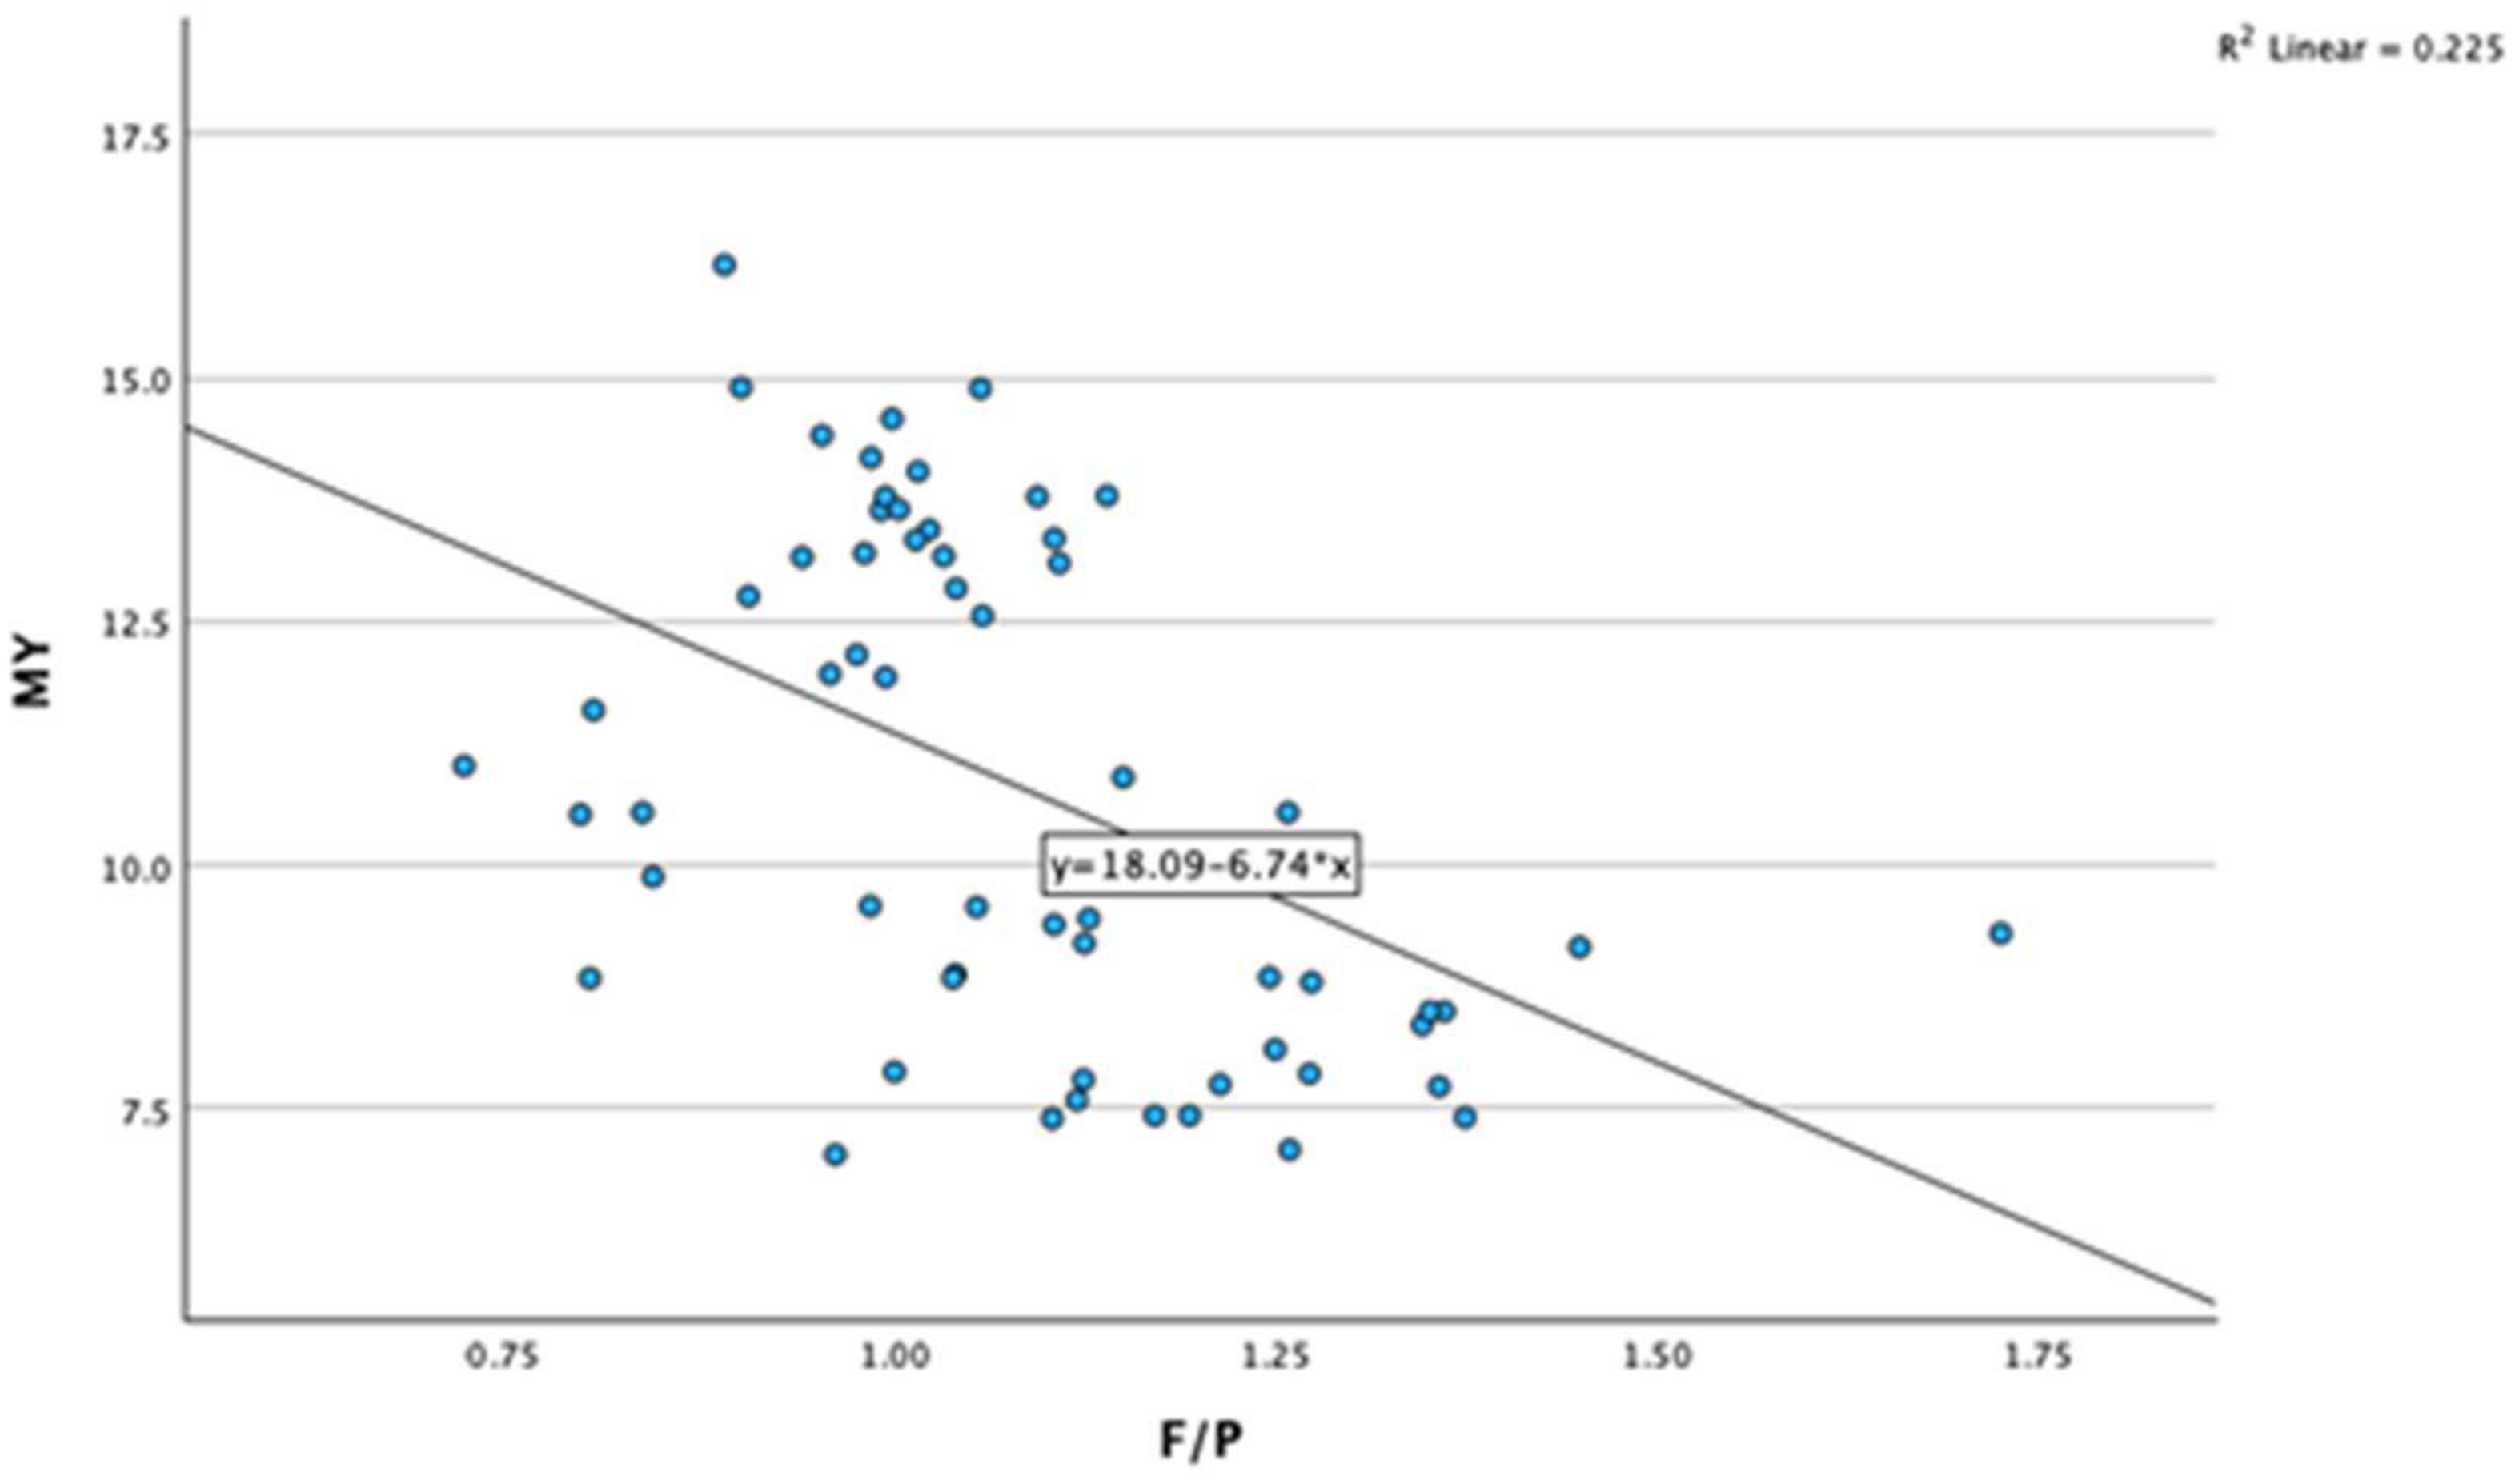
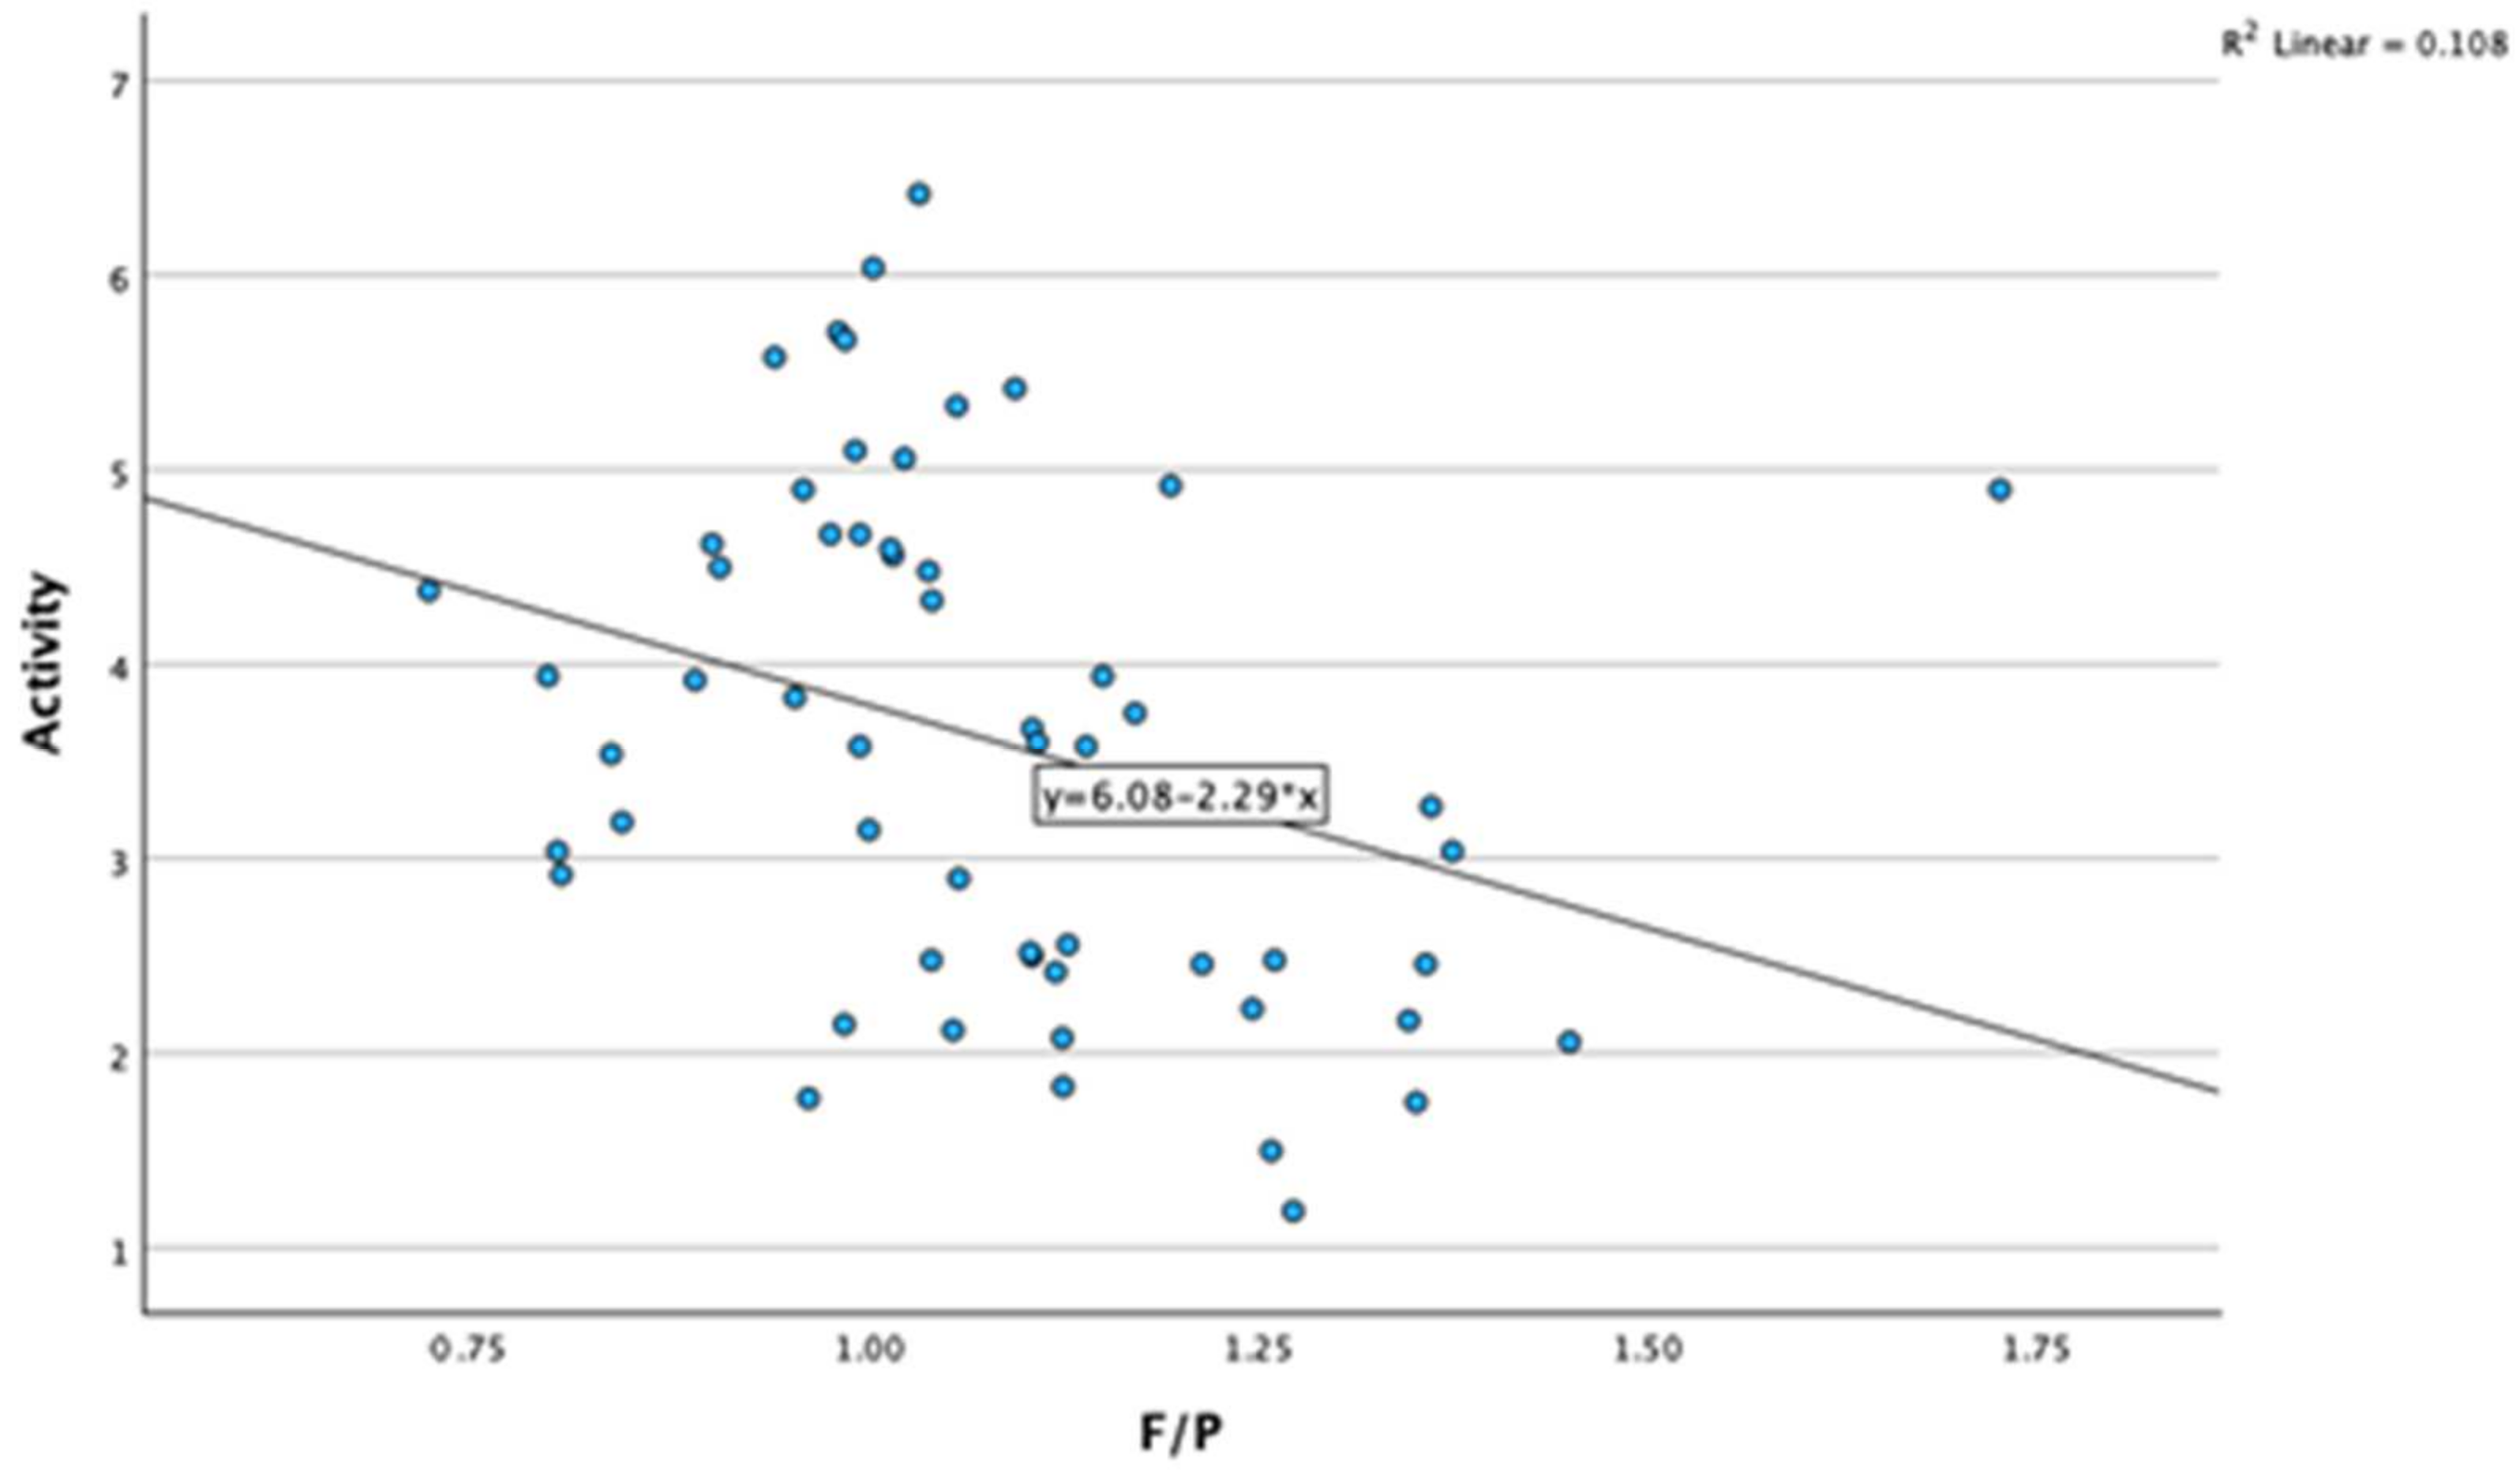
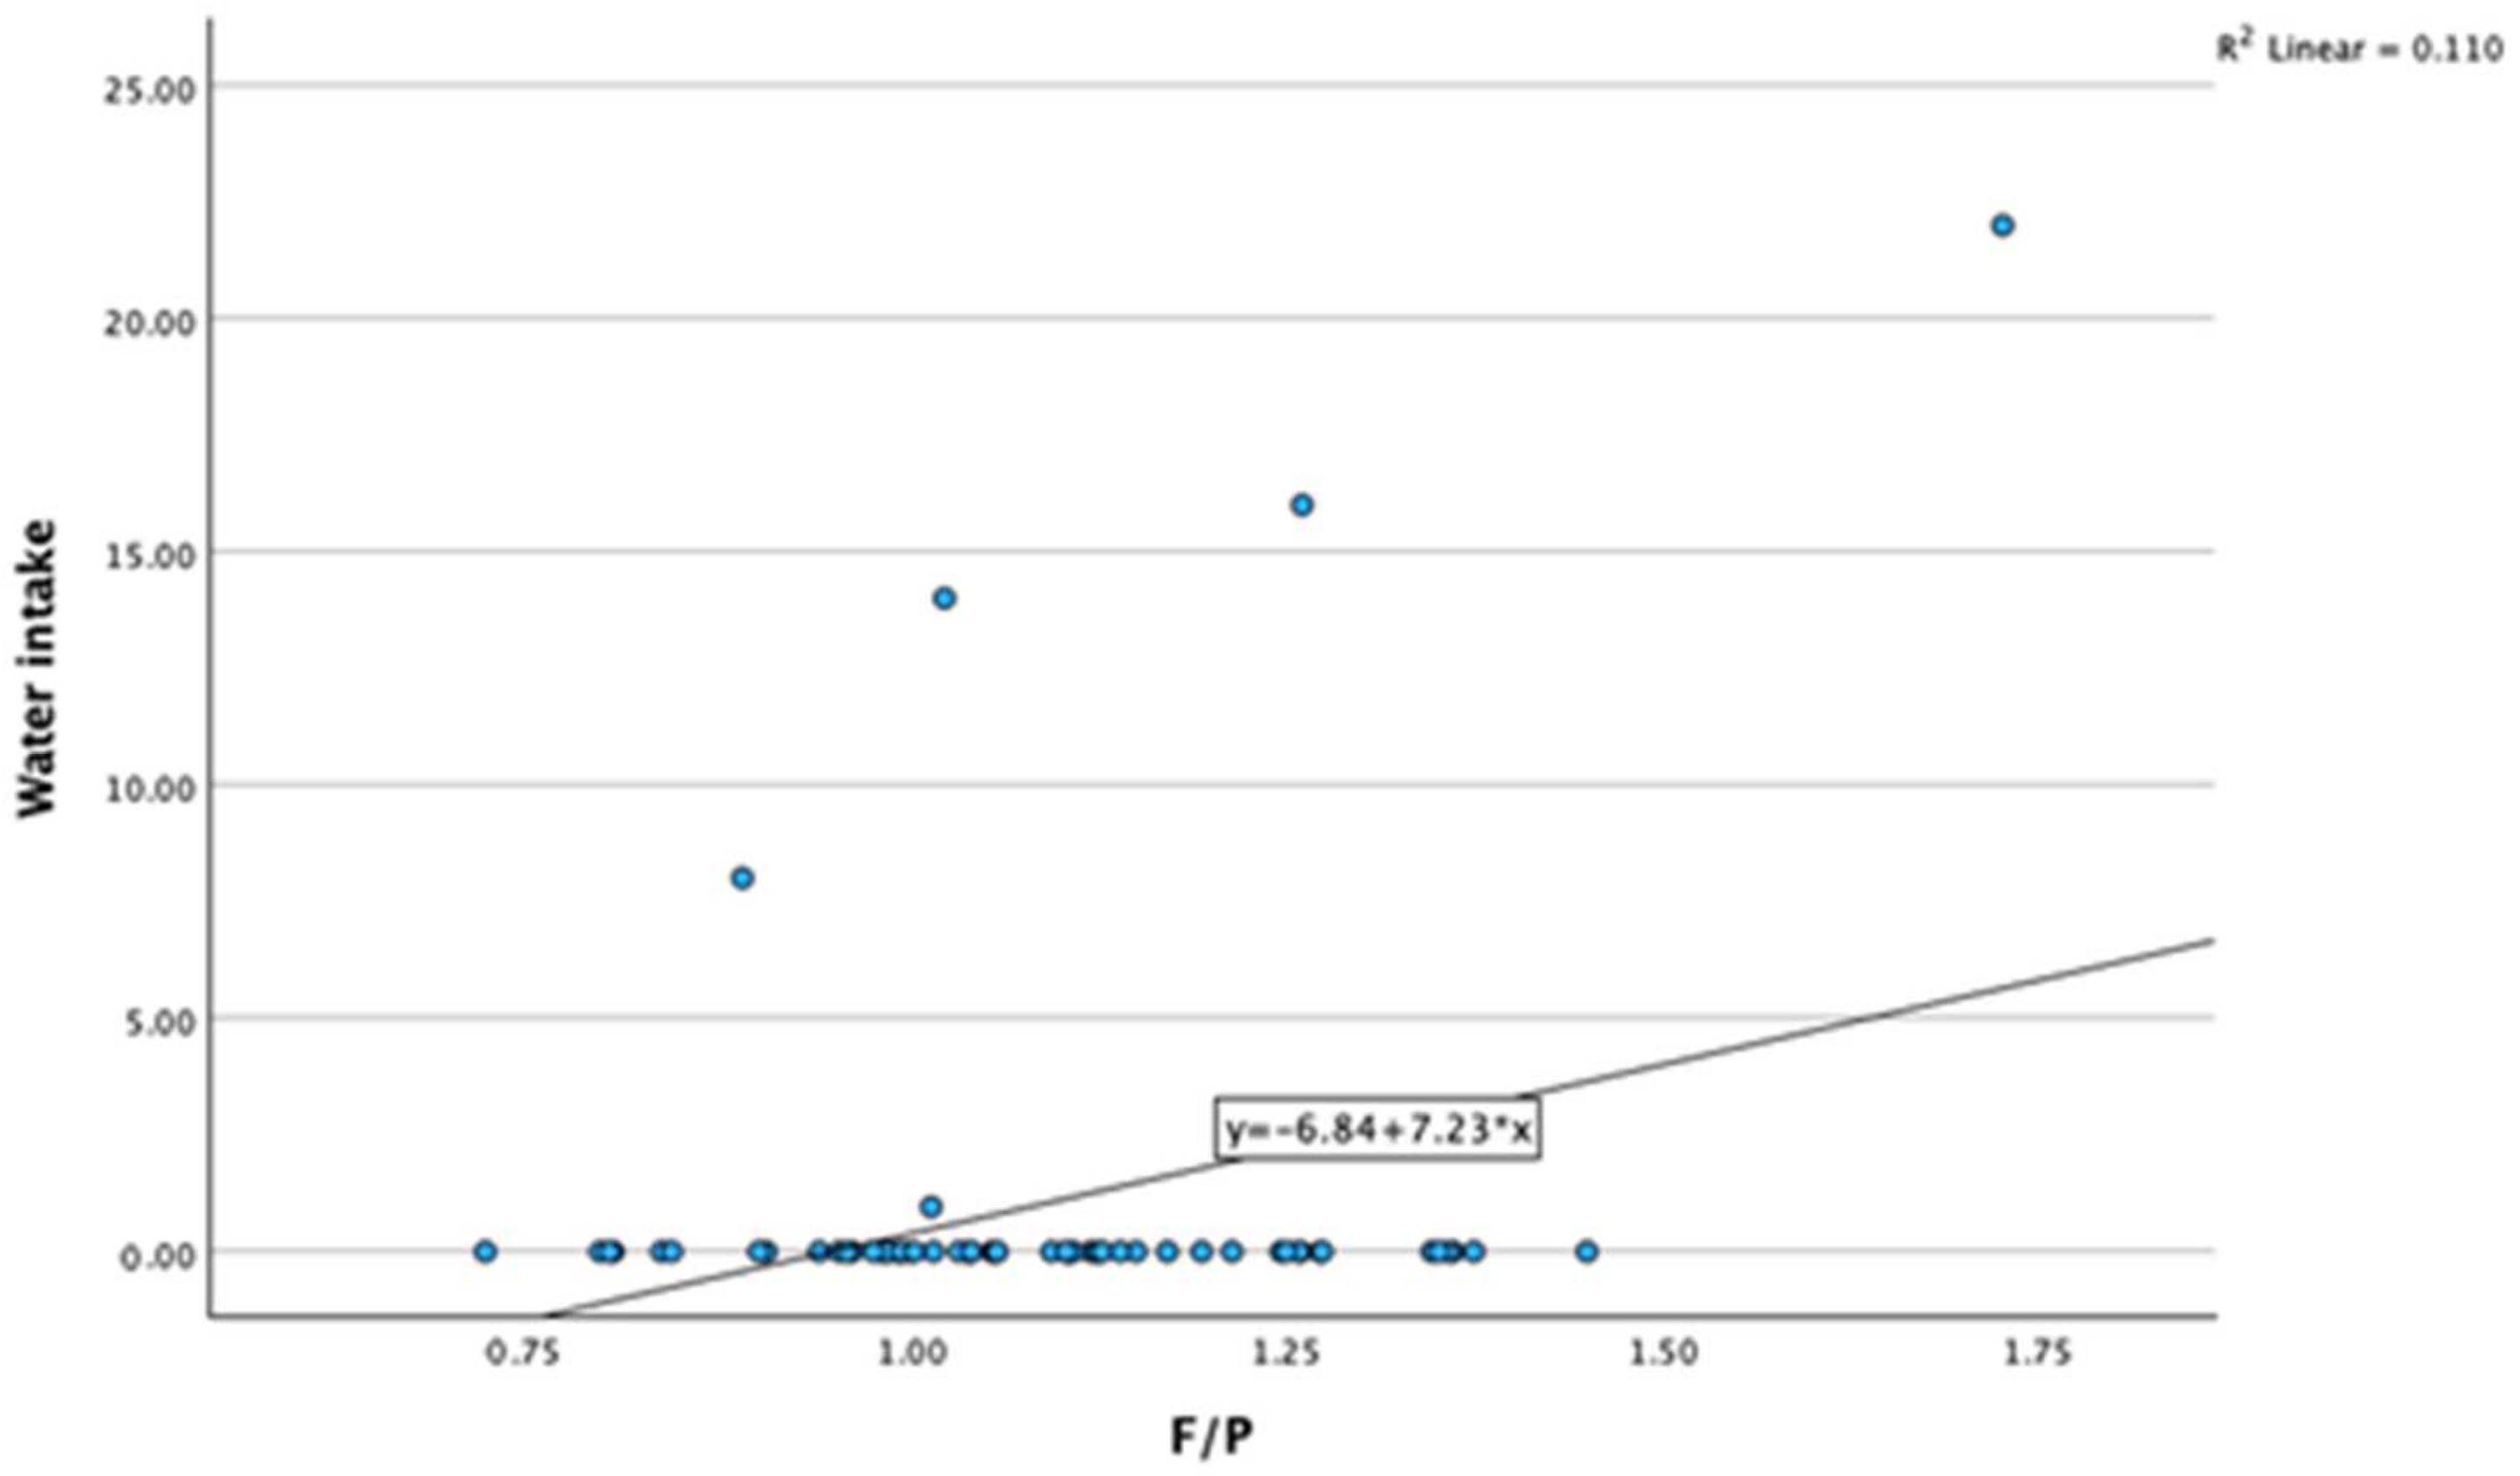
3.2. Correlations between Milk Fat-to-Protein Ratio and Other Variables

We found a significant association between the milk fat-to-protein ratio and reticulorumen pH, milk yield (MY), cow activity, and water intake (Table 3).
We found a positive association between the fat-to-protein ratio (F/P) and reticulorumen pH (r = 0.344, p < 0.001). As reticulorumen pH increases, the milk fat-to-protein ratio also increases. (Figure 1).
A negative association was found between the fat-to-protein ratio (F/P) and milk yield (r = −0.474, p < 0.001). As milk yield increases, the milk fat-to-protein ratio decreases (Figure 2).
A significant negative correlation was found between milk fat-to-protein ratio (F/P) and cow activity (r = −0.328, p < 0.01). As cow activity increases, the milk F/P decreases (Figure 3).
A significant positive correlation was found between water intake and the milk fat-to-protein ratio (F/P) (r = 0.332, p < 0.01). As water intake increases, the milk F/P also increases (Figure 4).

4. Discussion

According to our results, the activity of subclinical acidotic cows was 57.19% higher than that of healthy cows; they exhibited the following characteristics: an 18.8% lower reticulorumen pH, a 10.49% decrease in milk yield, an 11.88% lower milk fat-to-protein ratio, and a 6.59% decrease in rumination time.
We found that cows with SCA had 18.8% lower reticulorumen pH, an 11.88% lower milk fat-to-protein ratio, and a 0.49% decrease in milk yield. A positive correlation (r = 0.344, p < 0.001) between the reticulorumen pH and the fat-to-protein ratio (F/P) was found. The ratio of milk fat to protein rises in tandem with an increase in reticulorumen pH. Significant correlations were discovered by Zschiesche et al. [26] between the ruminal pH and the milk F/P ratio. However, their findings indicated a negative correlation that did not align with ours. The milk F/P ratio has been identified as a valuable indicator for assessing the SCA status on a farm. Yet, additional research is required to obtain more precise findings [8]. In reality, the milk F/P ratio is often calculated in the dairy industry, and a number of studies have supported the idea that the ratio is a reliable SARA indicator (eight Holstein Friesian cows were reported to produce 25 kg of milk under trial conditions, for instance) [12]. However, other research did not find a strong enough correlation between the ruminal pH and the F/P ratio. For instance, research using 24 transition Holstein Friesian cows on a commercial farm examined the limitations of the F/P ratio as a SARA indicator [28].
Both a reduction in milk fat and a rise in milk protein content were necessary for changes in the F/P ratio. It has long been known that an excess in highly fermentable carbohydrates and inadequate structural effectiveness of diet are the possible causes of milk fat depression, which is characterized by a change in volatile fatty acids (VFAs) in the rumen with increased propionate and decreased acetate [26]. Sutton [29] suggested that up to 80% of the variance in milk fat might be explained by changes in the molar proportions of VFAs in the rumen. Moreover, it is currently believed that a decrease in milk fat synthesis caused by particular byproducts of ruminal fat biohydrogenation offers a somewhat convincing explanation [30]. While the association between low ruminal pH and low milk fat is well-established from a physiological perspective, the same cannot be stated for milk protein. A low pH is linked to less efficient bacterial development generally, which will have the opposite impact of the decrease in protozoa that is frequently observed with SARA diets, which will boost the efficiency of bacterial growth via reduced predation [31].
Conversely, as rumen volatile FA production (acetate and butyrate) acts as a precursor for mammary FA synthesis, a reduced F/P ratio may indicate (subacute) rumen acidosis [10]. Certain trials have shown indications of a relationship between the two indicators and that SARA is not solely rumen pH dependent [8,12]. In a recent exploratory meta-analysis, Mensching et al. [32] revealed milk F/P ratio as an indicator for rumen pH parameters; however, it was left out of the final prediction model. Conversely, it has been regularly noted that the F/P ratio limits in SARA prediction are significant [33]. We may infer that cows with a higher risk of subclinical acidosis can be identified using the in-line F/P ratio based on our findings and those found in the literature [22]. In previous research, we discovered that the healthy cows had the longest RT in comparison to the SARA group (4.29%) [34]. On the day of diagnosis, there were consistent decreases in rumination activity for each health condition, both within the cow and in comparison to cohorts of healthy cows [35]. In multiparous cows, rumination monitoring throughout the transition period may help detect sub-acute ketosis (SCK) and other health issues, according to Kaufman [36].
Cows seem to change their diurnal rumination pattern, rising during the day and decreasing during the night when they are fed large amounts of concentrates at night [33]. Rumination activity for each health issue was consistently lower on the day of diagnosis, both within the cow and when compared to cohorts of healthy mates [35]. Rumination times can be utilized to automatically detect health problems, like metritis and ketosis, that develop after calving. More research is needed to determine how RT and activity data may be used to predict the occurrence of such periparturient diseases in individuals before they occur, according to Liboreiro et al. [37]. While there may be differences in RT and activity between populations of cows that have already experienced periparturient diseases and those that were healthy, it is important to note that this association represents only one potential explanation among several. These results highlight the significant influence of SCA on feeding patterns and highlight crucial issues regarding the management of subclinical acidosis in dairy production. The productivity and well-being of the impacted cows depend heavily on the early detection and correction of such changes [38].
We found that cows with subclinical acidosis were 57.19% as active as healthy cows. According to Edwards and Tozer [39], there is a correlation between the symptoms used to describe a health condition and cattle activity, which typically rises prior to the appearance of clinical symptoms. Animal activity levels and variations in milk production are thought to be reliable indicators of pathological changes occurring in the body. Rising stress may be linked to an increase in animal activity prior to the discovery of an illness [40].

5. Conclusions

Changes in biomarkers measured using innovative technologies were able to identify cows with subclinical acidosis. Cows with subclinical acidosis had 18.8% lower reticulorumen pH, a 10.49% decrease in milk yield, an 11.88% lower milk fat-to-protein ratio, and a 6.59% decrease in rumination time, while the activity of these cows was 57.19% higher compared with healthy cows. From a practical point of view, we suggest that veterinarians and farmers track parameters such as reticulorumen pH, milk yield, milk fat-to-protein ratio, rumination time, and activity for the identification of subclinical acidosis.

Author Contributions

R.A.: supervision of the whole study. R.A., R.S., G.D., L.V. and J.C.: writing—review and editing, and software. K.D., J.K., M.T. and D.M.: data collection and investigation. All authors have read and agreed to the published version of the manuscript.

Funding

Lithuanian Council for Research. Project identification: S-MIP-22-137.

Institutional Review Board Statement

This study was conducted according to the guidelines of the Declaration of Helsinki and approved by the ethics committee (study approval number: PK016965, 6 June 2017).

Informed Consent Statement

Written informed consent has been obtained from the owner of the animals involved in this study.

Data Availability Statement

The data provided in this study can be found in the publication.

Conflicts of Interest

The authors declare no conflicts of interest.

References

  1. Reist, M.; Erdin, D.; von Euw, D.; Tschuemperlin, K.; Leuenberger, H.; Chilliard, Y.; Hammon, H.M.; Morel, C.; Philipona, C.; Zbinden, Y.; et al. Estimation of Energy Balance at the Individual and Herd Level Using Blood and Milk Traits in High-Yielding Dairy Cows1,2. J. Dairy Sci. 2002, 85, 3314–3327. [Google Scholar] [CrossRef] [PubMed]
  2. Erickson, P.S.; Kalscheur, K.F. Chapter 9—Nutrition and Feeding of Dairy Cattle. In Animal Agriculture; Bazer, F.W., Lamb, G.C., Wu, G., Eds.; Academic Press: Cambridge, MA, USA, 2020; pp. 157–180. ISBN 978-0-12-817052-6. [Google Scholar]
  3. Albornoz, R.I.; Harvatine, K.J.; Allen, M.S. Diet Starch Concentration and Starch Fermentability Affect Energy Intake and Energy Balance of Cows in the Early Postpartum Period. J. Dairy Sci. 2019, 102, 5161–5171. [Google Scholar] [CrossRef] [PubMed]
  4. Oetzel, G.R. Herd-Level Ketosis—Diagnosis and Risk Factors. In Proceedings of the Preconference Seminar 7C: Dairy Herd Problem Investigation Strategies: Transition Cow Troubleshooting, Vancouver, BC, Canada, 19 September 2007; pp. 67–91. [Google Scholar]
  5. Krause, K.M. To Buffer or Not? Supplemental Bicarb and Subacute Ruminal Acidosis. In Proceedings of the Southwest Animal Nutrition Conference, Tempe, AZ, USA, 11 August 2008. [Google Scholar]
  6. Krause, K.M.; Oetzel, G.R. Understanding and Preventing Subacute Ruminal Acidosis in Dairy Herds: A Review. Anim. Feed Sci. Technol. 2006, 126, 215–236. [Google Scholar] [CrossRef]
  7. Plaizier, J.C.; Krause, D.O.; Gozho, G.N.; McBride, B.W. Subacute Ruminal Acidosis in Dairy Cows: The Physiological Causes, Incidence and Consequences. Vet. J. Lond. Eng. 2008, 176, 21–31. [Google Scholar] [CrossRef] [PubMed]
  8. Enemark, J.M.D. The Monitoring, Prevention and Treatment of Sub-Acute Ruminal Acidosis (SARA): A Review. Vet. J. 2008, 176, 32–43. [Google Scholar] [CrossRef] [PubMed]
  9. Antanaitis, R.; Zilaitis, V.; Juozaitiene, V.; Stoskus, R.; Televicius, M. Changes in Reticulorumen Content Temperature and pH According to Time of Day and Yearly Seasons. Pol. J. Vet. Sci. 2016, 19, 771–776. [Google Scholar] [CrossRef] [PubMed]
  10. Kleen, J.L.; Cannizzo, C. Incidence, Prevalence and Impact of SARA in Dairy Herds. Anim. Feed Sci. Technol. 2012, 172, 4–8. [Google Scholar] [CrossRef]
  11. Elmhadi, M.E.; Ali, D.K.; Khogali, M.K.; Wang, H. Subacute Ruminal Acidosis in Dairy Herds: Microbiological and Nutritional Causes, Consequences, and Prevention Strategies. Anim. Nutr. 2022, 10, 148–155. [Google Scholar] [CrossRef] [PubMed]
  12. Li, S.; Gozho, G.N.; Gakhar, N.; Khafipour, E.; Krause, D.O.; Plaizier, J.C. Evaluation of Diagnostic Measures for Subacute Ruminal Acidosis in Dairy Cows. Can. J. Anim. Sci. 2012, 92, 353–364. [Google Scholar] [CrossRef]
  13. Francesio, A.; Viora, L.; Denwood, M.J.; Tulley, W.; Brady, N.; Hastie, P.; Hamilton, A.; Davison, C.; Michie, C.; Jonsson, N.N. Contrasting Effects of High-Starch and High-Sugar Diets on Ruminal Function in Cattle. J. Dairy Res. 2020, 87, 175–183. [Google Scholar] [CrossRef]
  14. Capuzzello, G.; Viora, L.; Borelli, E.; Jonsson, N.N. Evaluation of an Indwelling Bolus Equipped with a Triaxial Accelerometer for the Characterisation of the Diurnal Pattern of Bovine Reticuloruminal Contractions. J. Dairy Res. 2023, 90, 9–15. [Google Scholar] [CrossRef]
  15. Mutsvangwa, T.; Walton, J.P.; Plaizier, J.C.; Duffield, T.F.; Bagg, R.; Dick, P.; Vessie, G.; McBride, B.W. Effects of a Monensin Controlled-Release Capsule or Premix on Attenuation of Subacute Ruminal Acidosis in Dairy Cows. J. Dairy Sci. 2002, 85, 3454–3461. [Google Scholar] [CrossRef] [PubMed]
  16. Aquilani, C.; Confessore, A.; Bozzi, R.; Sirtori, F.; Pugliese, C. Review: Precision Livestock Farming Technologies in Pasture-Based Livestock Systems. Animal 2022, 16, 100429. [Google Scholar] [CrossRef] [PubMed]
  17. Cantor, M.C.; Costa, J.H.C.; Bewley, J.M. Impact of Observed and Controlled Water Intake on Reticulorumen Temperature in Lactating Dairy Cattle. Animals 2018, 8, 194. [Google Scholar] [CrossRef] [PubMed]
  18. AlZahal, O.; AlZahal, H.; Steele, M.A.; Van Schaik, M.; Kyriazakis, I.; Duffield, T.F.; McBride, B.W. The Use of a Radiotelemetric Ruminal Bolus to Detect Body Temperature Changes in Lactating Dairy Cattle. J. Dairy Sci. 2011, 94, 3568–3574. [Google Scholar] [CrossRef] [PubMed]
  19. Cooper-Prado, M.J.; Long, N.M.; Wright, E.C.; Goad, C.L.; Wettemann, R.P. Relationship of Ruminal Temperature with Parturition and Estrus of Beef Cows1. J. Dairy Sci. 2011, 89, 1020–1027. [Google Scholar] [CrossRef] [PubMed]
  20. Jenkins, N.T.; Peña, G.; Risco, C.; Barbosa, C.C.; Vieira-Neto, A.; Galvão, K.N. Utility of Inline Milk Fat and Protein Ratio to Diagnose Subclinical Ketosis and to Assign Propylene Glycol Treatment in Lactating Dairy Cows. Can. Vet. J. 2015, 56, 850–854. [Google Scholar] [PubMed]
  21. Caja, G.; Castro-Costa, A.; Knight, C.H. Engineering to Support Wellbeing of Dairy Animals. J. Dairy Res. 2016, 83, 136–147. [Google Scholar] [CrossRef] [PubMed]
  22. Antanaitis, R.; Džermeikaitė, K.; Januškevičius, V.; Šimonytė, I.; Baumgartner, W. In-Line Registered Milk Fat-to-Protein Ratio for the Assessment of Metabolic Status in Dairy Cows. Animals 2023, 13, 3293. [Google Scholar] [CrossRef] [PubMed]
  23. Djokovic, R.; Cincovic, M.; Ilic, Z.; Kurcubic, V.; Andjelic, B.; Petrovic, M.; Lalic, N.; Jasovic, B. Relationships Between Contents of Biochemical Metabolites in Blood and Milk in Dairy Cows During Transition and Mid Lactation. Int. J. Appl. Res. Vet. Med. 2019, 17, 771–776. [Google Scholar]
  24. Duffield, T. Subclinical Ketosis in Lactating Dairy Cattle. Vet. Clin. N. Am. Food Anim. Pract. 2000, 16, 231–253. [Google Scholar] [CrossRef] [PubMed]
  25. Hall, M.B. Invited Review: Corrected Milk: Reconsideration of Common Equations and Milk Energy Estimates. J. Dairy Sci. 2023, 106, 2230–2246. [Google Scholar] [CrossRef] [PubMed]
  26. Zschiesche, M.; Mensching, A.; Sharifi, A.R.; Hummel, J. The Milk Fat-to-Protein Ratio as Indicator for Ruminal pH Parameters in Dairy Cows: A Meta-Analysis. Dairy 2020, 1, 259–268. [Google Scholar] [CrossRef]
  27. Antanaitis, R.; Juozaitienė, V.; Malašauskienė, D.; Televičius, M. Inline Reticulorumen pH as an Indicator of Cows Reproduction and Health Status. Sensors 2020, 20, 1022. [Google Scholar] [CrossRef] [PubMed]
  28. Stein, S.K. Determination of Subclinical Metabolic Disorders in Transition Dairy Cows. Ph.D. Dissertation, University of Kassel, Witzenhausen, Germany, 2017. [Google Scholar]
  29. Sutton, J.D. Altering Milk Composition by Feeding. J. Dairy Sci. 1989, 72, 2801–2814. [Google Scholar] [CrossRef]
  30. Harvatine, K.J.; Boisclair, Y.R.; Bauman, D.E. Recent Advances in the Regulation of Milk Fat Synthesis. Animal 2009, 3, 40–54. [Google Scholar] [CrossRef] [PubMed]
  31. Meneses, J.A.M.; de Sá, O.A.A.L.; Coelho, C.F.; Pereira, R.N.; Batista, E.D.; Ladeira, M.M.; Casagrande, D.R.; Gionbelli, M.P. Effect of Heat Stress on Ingestive, Digestive, Ruminal and Physiological Parameters of Nellore Cattle Feeding Low- or High-Energy Diets. Livest. Sci. 2021, 252, 104676. [Google Scholar] [CrossRef]
  32. Mensching, A.; Hummel, J.; Sharifi, A.R. Statistical Modeling of Ruminal pH Parameters from Dairy Cows Based on a Meta-Analysis. J. Dairy Sci. 2020, 103, 750–767. [Google Scholar] [CrossRef]
  33. Humer, E.; Petri, R.M.; Aschenbach, J.R.; Bradford, B.J.; Penner, G.B.; Tafaj, M.; Südekum, K.-H.; Zebeli, Q. Invited Review: Practical Feeding Management Recommendations to Mitigate the Risk of Subacute Ruminal Acidosis in Dairy Cattle. J. Dairy Sci. 2018, 101, 872–888. [Google Scholar] [CrossRef]
  34. Antanaitis, R.; Juozaitienė, V.; Malašauskienė, D.; Televičius, M. Can Rumination Time and Some Blood Biochemical Parameters Be Used as Biomarkers for the Diagnosis of Subclinical Acidosis and Subclinical Ketosis? Vet. Anim. Sci. 2019, 8, 100077. [Google Scholar] [CrossRef]
  35. Paudyal, S. Rumination, Activity, Milk Yield and Milk Components Analysis for Disease Detection During the Transition Period of Dairy Cows. Master’s Thesis, West Texas A&M University Canyon, Canyon, TX, USA, 2016. [Google Scholar]
  36. Kaufman, E.I.; LeBlanc, S.J.; McBride, B.W.; Duffield, T.F.; DeVries, T.J. Association of Rumination Time with Subclinical Ketosis in Transition Dairy Cows. J. Dairy Sci. 2016, 99, 5604–5618. [Google Scholar] [CrossRef] [PubMed]
  37. Liboreiro, D.N.; Machado, K.S.; Silva, P.R.B.; Maturana, M.M.; Nishimura, T.K.; Brandão, A.P.; Endres, M.I.; Chebel, R.C. Characterization of Peripartum Rumination and Activity of Cows Diagnosed with Metabolic and Uterine Diseases. J. Dairy Sci. 2015, 98, 6812–6827. [Google Scholar] [CrossRef] [PubMed]
  38. Antanaitis, R.; Džermeikaitė, K.; Krištolaitytė, J.; Ribelytė, I.; Bespalovaitė, A.; Bulvičiūtė, D.; Rutkauskas, A. Alterations in Rumination, Eating, Drinking and Locomotion Behavior in Dairy Cows Affected by Subclinical Ketosis and Subclinical Acidosis. Animals 2024, 14, 384. [Google Scholar] [CrossRef] [PubMed]
  39. Edwards, J.L.; Tozer, P.R. Using Activity and Milk Yield as Predictors of Fresh Cow Disorders. J. Dairy Sci. 2004, 87, 524–531. [Google Scholar] [CrossRef] [PubMed]
  40. Antanaitis, R.; Žilaitis, V.; Kucinskas, A.; Juozaitienė, V.; Leonauskaite, K. Changes in Cow Activity, Milk Yield, and Milk Conductivity before Clinical Diagnosis of Ketosis, and Acidosis. Vet. Ir Zootech. 2015, 70, 3–9. [Google Scholar]
Figure 1. Association between reticulorumen pH and milk fat-to-protein ratio. F/P—milk fat-to-protein ratio.
Animals 14 01883 g001
Figure 2. Association between milk yield and milk fat-to-protein ratio. MY—milk yield; F/P—milk fat-to-protein ratio.
Animals 14 01883 g002
Figure 3. Association between cows activity and milk fat-to-protein ratio. Activity—activity of cows; F/P—milk fat-to-protein ratio.
Animals 14 01883 g003
Figure 4. Association between water intake and milk fat-to-protein ratio. F/P—milk fat-to-protein ratio.
Animals 14 01883 g004
Table 1. Chemical composition of feeding rations for dry and fresh dairy cows.
ParametersUnitsDairy Cows
Dry matter%48.8
Net energy lactationMcal/kg1.6
Crude protein%15.8
Nonfiber carbohydrates%38.7
Neutral detergent fiber%28.2
Acid detergent fiber%19.8
Table 2. Descriptive statistics of the investigated parameters.
Descriptives
GroupNMeanStd. DeviationStd. Error95% Confidence Interval for MeanMinimumMaximump
Lower BoundUpper Bound
pHHC366.220.336.94 × 10−8 M of H+ ion6.116.3357
SCA235.280.112.42 × 10−7 M of H+ ion.5.235.3356
Total595.850.531.56 × 10−7 M of H+ ion.5.715.9957<0.01
DIMHC3617.850.840.3211.5214.235.0030.00
SCA2319.320.760.2213.2315.235.0030.00
Total59154.9517.962.31150.30159.59126.00227.000.19
MY (kg/d)HC3632.521.350.228.549.46713
SCA2329.431.600.3212.6614.01716
Total5930.972.580.3310.0711.40716<0.01
Fat (%)HC364.320.810.134.054.6036
SCA233.670.250.053.573.7834
Total594.060.720.093.884.2536<0.01
Protein (%)HC363.810.120.023.773.8544
SCA233.630.050.013.603.6544
Total593.740.130.013.703.7744<0.01
Temperature (°C)HC3638.791.520.2538.2739.303340
SCA2338.881.200.2538.3639.403540
Total5938.821.400.1838.4639.1933400.80
Cow activityHC362.920.970.162.593.2515
SCA234.591.010.214.155.0336
Total593.571.280.163.243.9116<0.01
Rumination time (min/d.)HC36520.5147.358.00504.25536.78393618
SCA23488.3132.516.93473.89502.73433554
Total59508.0944.815.93496.20519.983936180.01
Water_intakeHC361.054.470.74−0.452.560.0022.00
SCA230.953.290.68−0.462.380.0014.00
Total591.014.020.52−0.0312.060.0022.000.97
F/PHC361.130.210.031.061.200.711.72
SCA231.010.060.010.981.040.881.13
Total591.080.180.021.031.130.711.720.01
DIM—days in milk; MY—milk yield; min/d.—minutes per day; HC—healthy cows group; SCA—subclinical acidosis group.
Table 3. Correlation between milk fat-to-protein ratio and other parameters.
.pHDIMMYFatProteinTemperatureActivityRTWater_Intake
F/PPearson Correlation0.344 **0.222−0.474 **0.981 **0.167−0.180−0.328 *0.1100.332 **
Sig. (two-tailed)0.0070.086<0.001<0.0010.1970.1700.0100.4090.010
N606161616160605860
** Correlation is significant at the 0.01 level (two-tailed); * Correlation is significant at the 0.05 level (two-tailed). F/P—milk fat-to-protein ratio; DIM—days in milk; MY—milk yield; fat—milk fat; protein—milk protein; temperature—reticulorumen temperature; RT—rumination time.
Disclaimer/Publisher’s Note: The statements, opinions and data contained in all publications are solely those of the individual author(s) and contributor(s) and not of MDPI and/or the editor(s). MDPI and/or the editor(s) disclaim responsibility for any injury to people or property resulting from any ideas, methods, instructions or products referred to in the content.

