
Dietary L-Lysine Requirement of Coho Salmon (Oncorhynchus kisutch) Alevins

 ,
,
Abstract
:Simple Summary
Abstract
1. Introduction
2. Materials and Methods
2.1. Experimental Diets
2.2. Animals and Experimental Protocols
2.3. Sampling Procedures
2.4. Analytical Methods
2.5. Calculation Methods
2.6. Statistical Analysis
3. Results
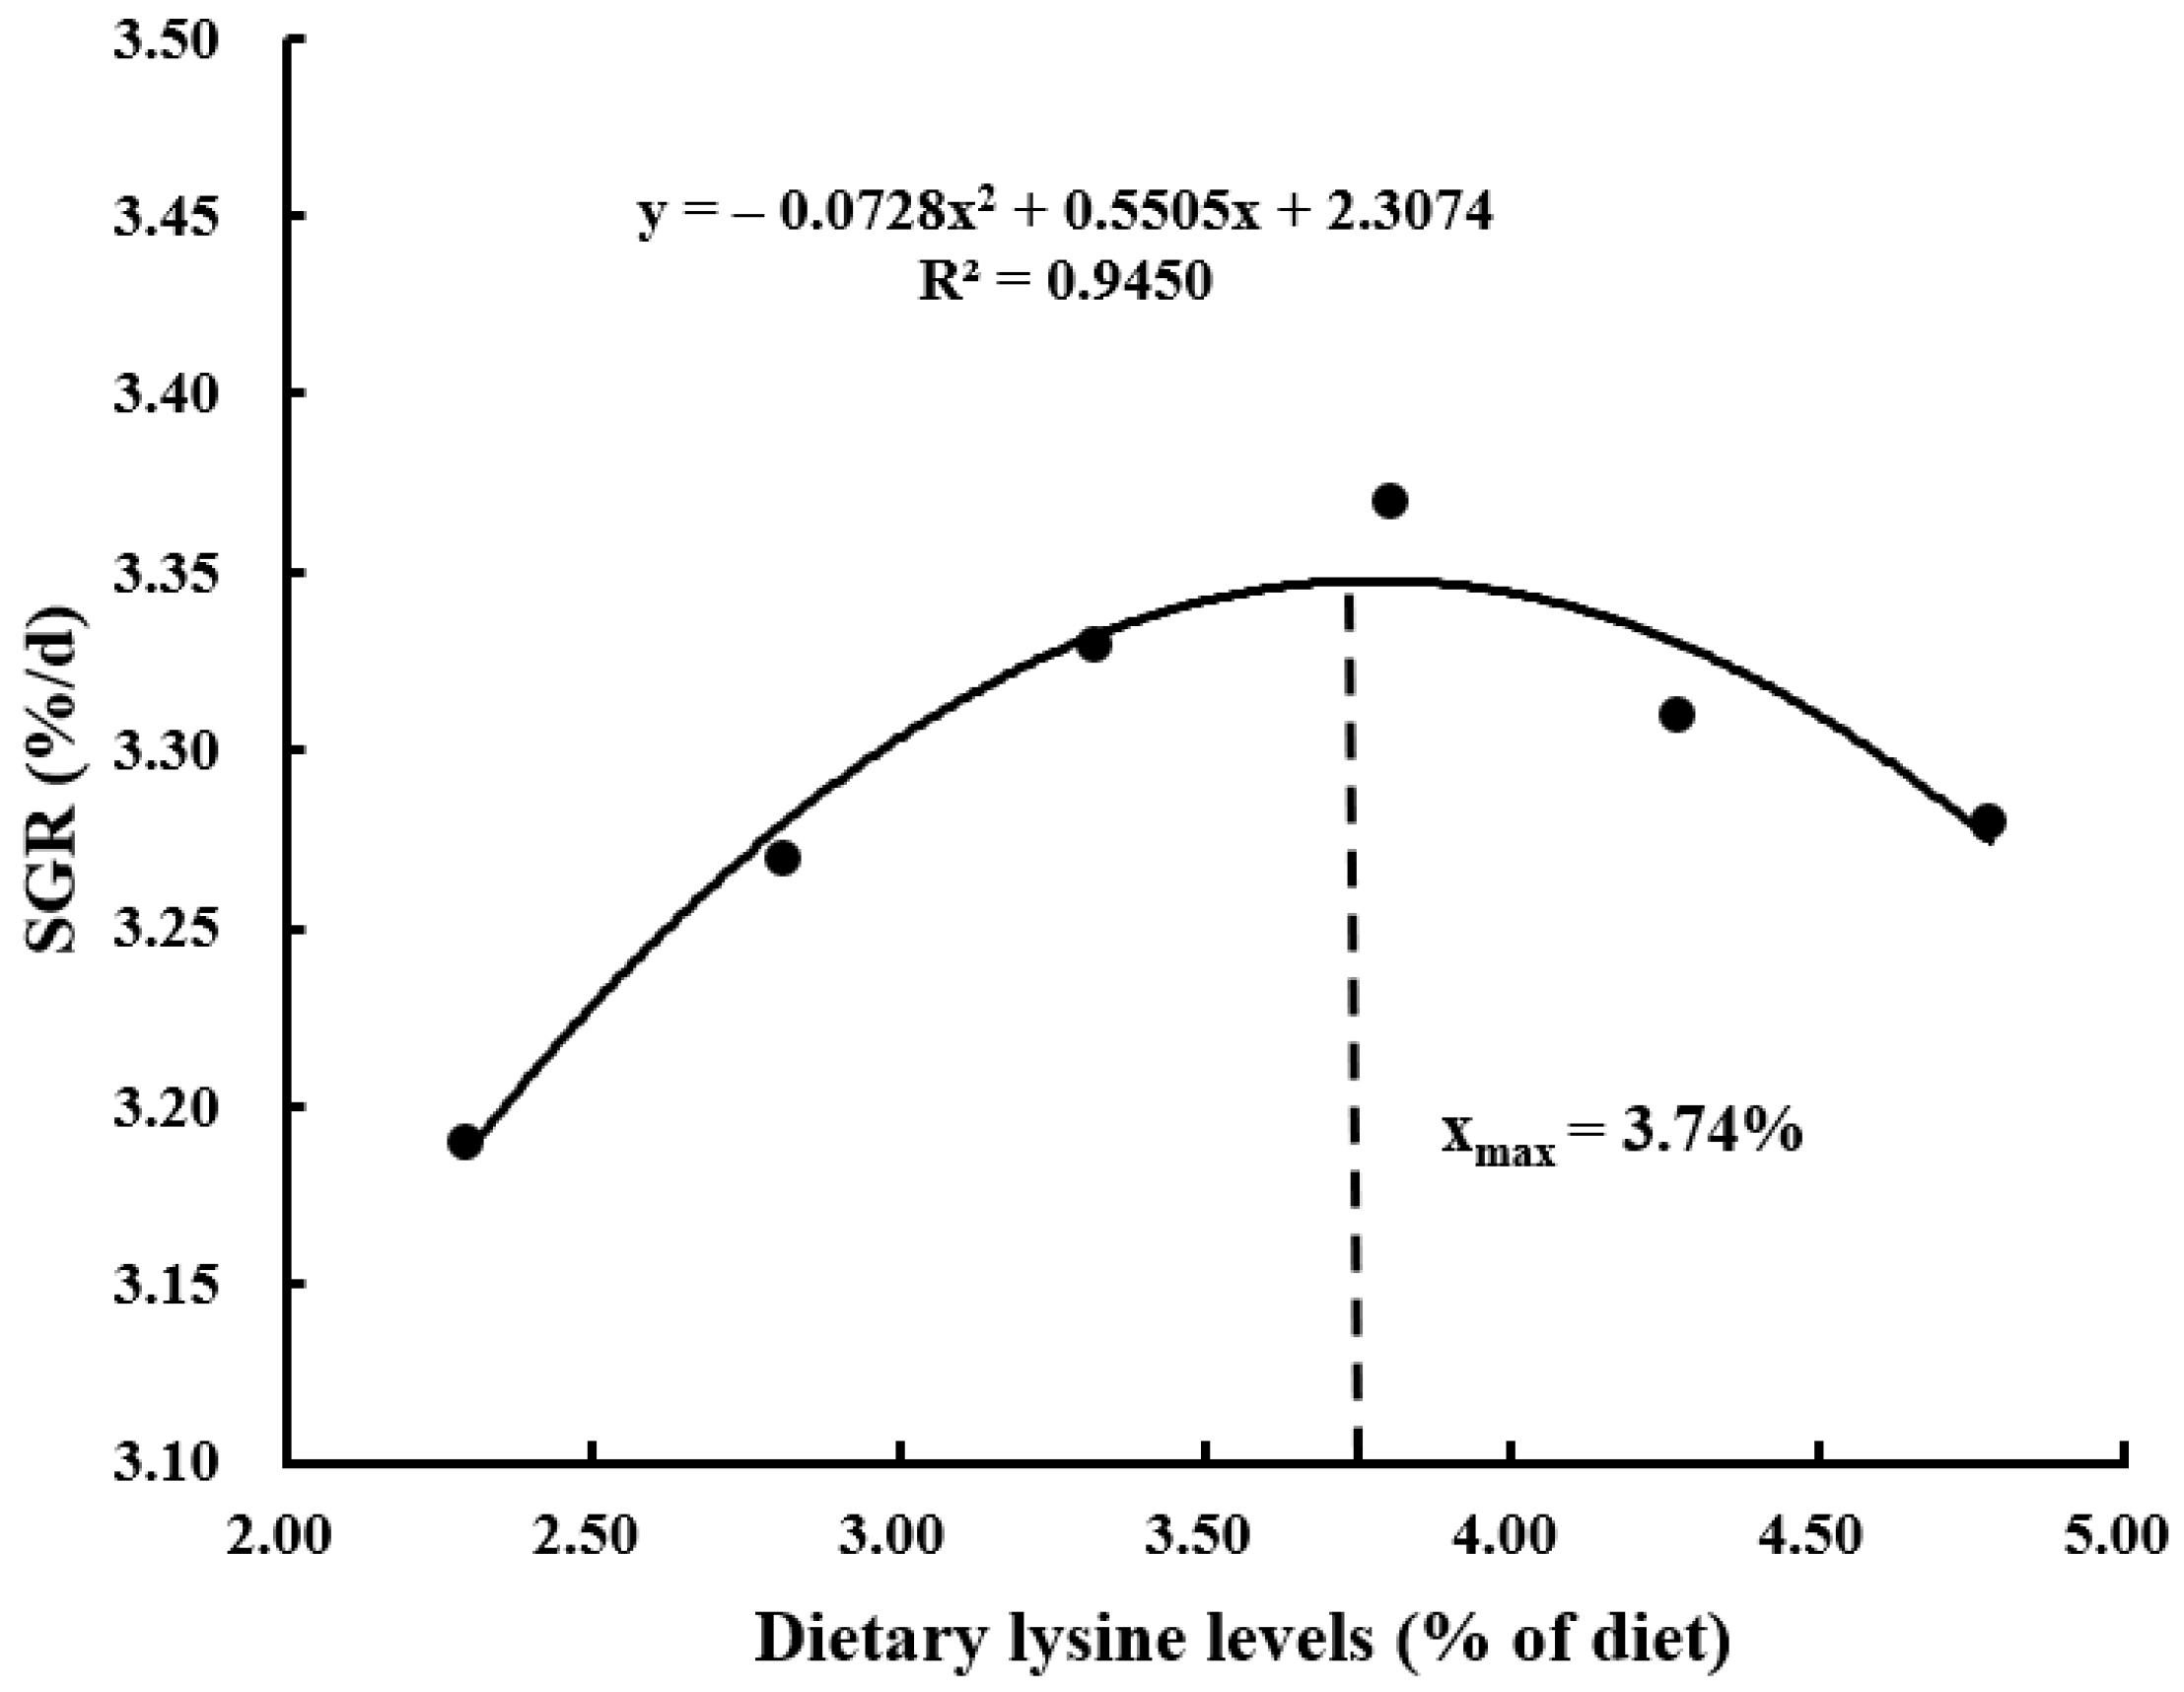
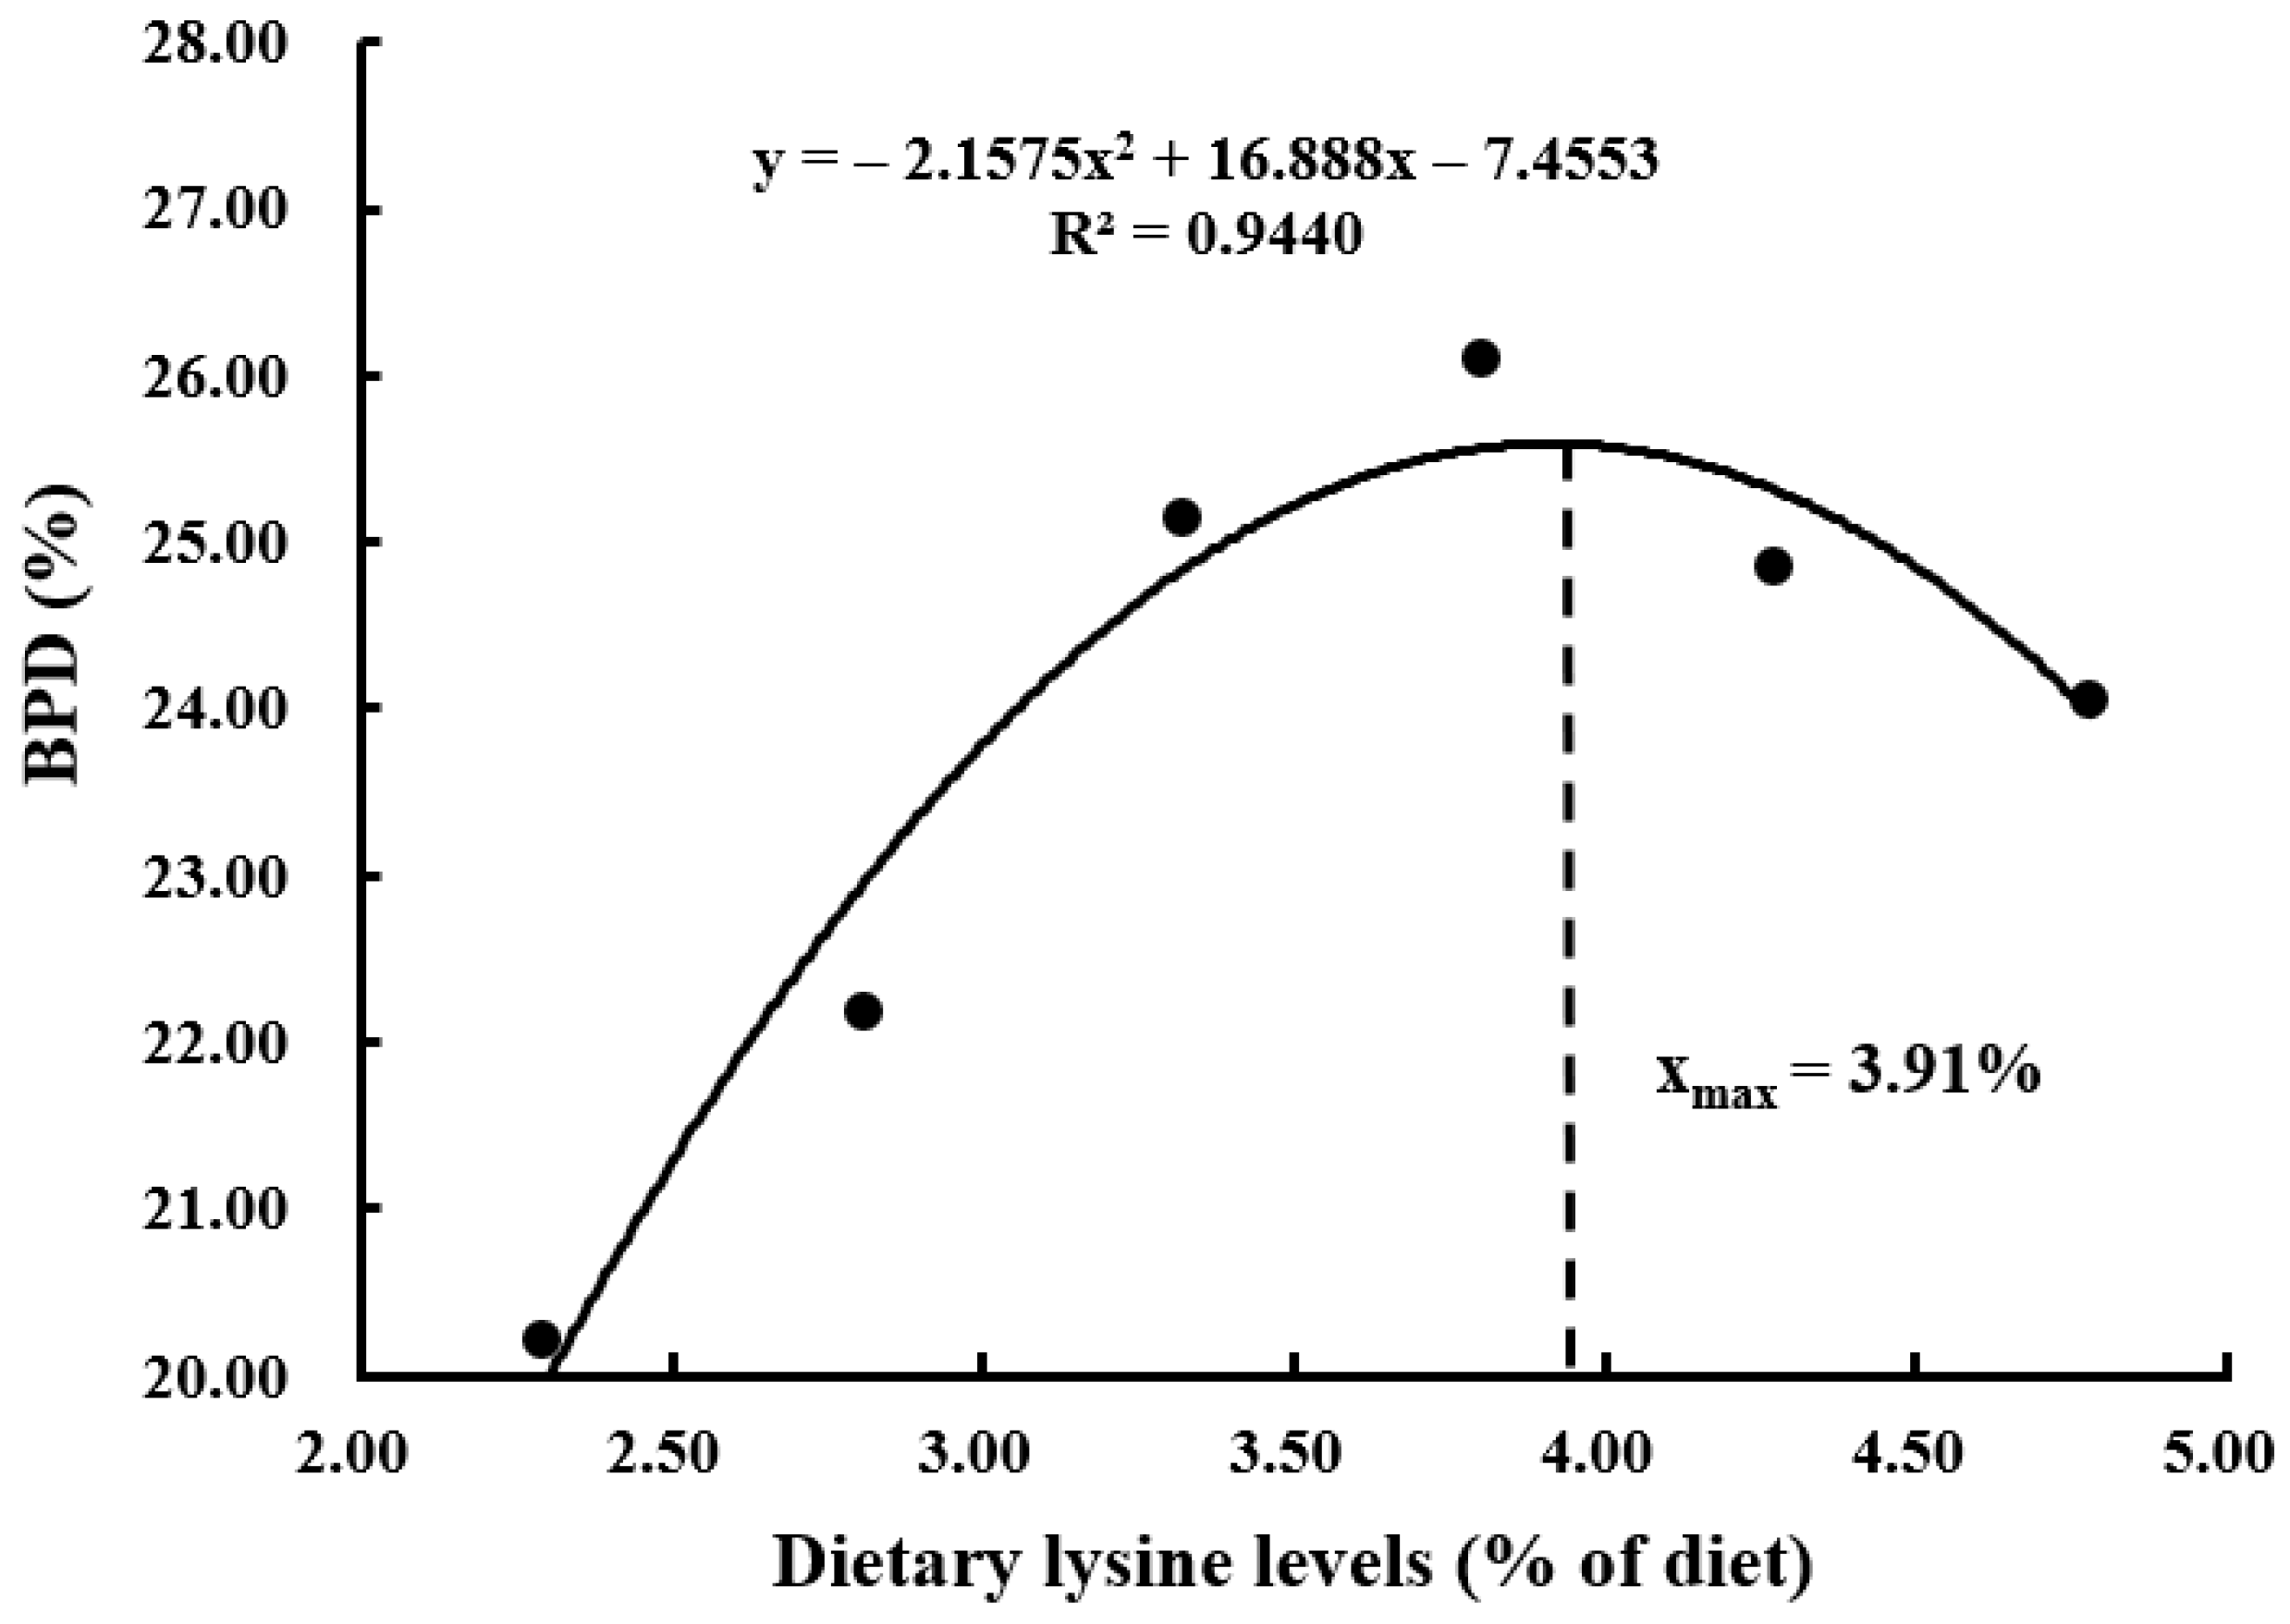
3.1. Survival and Growth Performance
3.2. Proximate Whole-Body Composition
3.3. Whole-Body EAA Profile
4. Discussion
5. Conclusions
Author Contributions
Funding
Institutional Review Board Statement
Informed Consent Statement
Data Availability Statement
Conflicts of Interest
References
- Abasubong, K.P.; Liu, W.B.; Zhang, D.D.; Yuan, X.Y.; Xia, S.L.; Xu, C.; Li, X.F. Fishmeal replacement by rice protein concentrate with xylooligosaccharides supplement benefits the growth performance, antioxidant capability and immune responses against Aeromonas hydrophila in blunt snout bream (Megalobrama amblycephala). Fish Shellfish Immunol. 2018, 78, 177–186. [Google Scholar] [CrossRef] [PubMed]
- Egerton, S.; Wan, A.; Murphy, K.; Collins, F.; Ahern, G.; Sugrue, I.; Busca, K.; Egan, F.; Muller, N.; Whooley, J.; et al. Replacing fishmeal with plant protein in Atlantic salmon (Salmo salar) diets by supplementation with fish protein hydrolysate. Sci. Rep. 2020, 10, 4194. [Google Scholar] [CrossRef] [PubMed]
- Liu, Y.L.; Lu, Q.S.; Xi, L.W.; Gong, Y.L.; Su, J.Z.; Han, D.; Zhang, Z.M.; Liu, H.K.; Jin, J.Y.; Yang, Y.X.; et al. Effects of replacement of dietary fishmeal by cottonseed protein concentrate on growth performance, liver health, and intestinal histology of largemouth bass (Micropterus salmoides). Front. Physiol. 2021, 12, 764987. [Google Scholar] [CrossRef]
- Lee, M.J.; Kim, J.; Baek, S., II; Cho, S.H. Substitution effect of fish meal with meat meal in diet on growth performance, feed consumption, feed utilization, chemical composition, hematology, and innate immune responses of rockfish (Sebastes schlegeli). Aquaculture 2023, 571, 739467. [Google Scholar] [CrossRef]
- Naylor, R.L.; Hardy, R.W.; Bureau, D.P.; Chiu, A.; Elliott, M.; Farrell, A.P.; Forster, I.; Gatlin, D.M.; Goldburg, R.J.; Hua, K.; et al. Feeding aquaculture in an era of finite resources. Proc. Natl. Acad. Sci. USA 2009, 106, 15103–15110. [Google Scholar] [CrossRef] [PubMed]
- Turchini, G.M.; Trushenski, J.T.; Glencross, B.D. Thoughts for the future of aquaculture nutrition: Realigning perspectives to reflect contemporary issues related to judicious use of marine resources in aquafeeds. N. Am. J. Aquac. 2019, 81, 13–39. [Google Scholar] [CrossRef]
- Gougbedji, A.; Detilleux, J.; Lalèyè, P.A.; Francis, F.; Caparros Megido, R. Can Insect Meal Replace Fishmeal? A meta-analysis of the effects of black soldier fly on fish growth performances and nutritional values. Animals 2022, 12, 1700. [Google Scholar] [CrossRef] [PubMed]
- Ma, Z.H.; Hassan, M.M.; Allais, L.; He, T.; Leterme, S.; Ellis, A.; McGraw, B.; Qin, J.G. Comparison of partial replacement of fishmeal with soybean meal and EnzoMeal on growth performance of Asian seabass Lates calcarifer. Comp. Biochem. Physiol. C Toxicol. Pharmacol. 2019, 216, 29–37. [Google Scholar] [CrossRef]
- Wang, J.; Mai, K.S.; Ai, Q.H. Conventional soybean meal as fishmeal alternative in diets of Japanese seabass (Lateolabrax japonicus): Effects of functional additives on growth, immunity, antioxidant capacity and disease resistance. Antioxidants 2022, 11, 951. [Google Scholar] [CrossRef]
- Vo, B.V.; Siddik, M.A.B.; Chaklader, M.R.; Fotedar, R.; Nahar, A.; Foysal, M.J.; Bui, D.P.; Nguyen, H.Q. Growth and health of juvenile barramundi (Lates calcarifer) challenged with DO hypoxia after feeding various inclusions of germinated, fermented and untreated peanut meals. PLoS ONE 2020, 15, e0232278. [Google Scholar] [CrossRef]
- Prabu, D.L.; Vijayagopal, P.; Ebeneezar, S.; Kalidas, C.; Rameshkumar, P.; Varghese, E.; Muniswaran, B.R. Enzymological, histological, and serum biomarker responses of snubnose pompano on complete replacement of fishmeal using cottonseed meal supplemented with lysine and methionine in the diet. Fish Physiol. Biochem. 2022, 48, 785–804. [Google Scholar] [CrossRef] [PubMed]
- Xu, W.J.; Jin, J.Y.; Han, D.; Liu, H.K.; Zhu, X.M.; Yang, Y.X.; Xie, S.Q. Physiological and transcriptomic responses to fishmeal-based diet and rapeseed meal-based diet in two strains of gibel carp (Carassius gibelio). Fish Physiol. Biochem. 2019, 45, 267–286. [Google Scholar] [CrossRef] [PubMed]
- Yao, J.T.; Chen, P.; Ring, E.; Zhang, G.G.; Huang, Z.Y.; Hua, X.M. Effect of diet supplemented with rapeseed meal or hydrolysable tannins on the growth, nutrition, and intestinal microbiota in grass carp (Ctenopharyngodon idellus). Front. Nutr. 2019, 6, 154. [Google Scholar] [CrossRef] [PubMed]
- Qin, Y.W.; He, C.Q.; Geng, H.Y.; Wang, W.Q.; Yang, P.; Mai, K.S.; Song, F. Muscle nutritive metabolism changes after dietary fishmeal replaced by cottonseed meal in golden pompano (Trachinotus ovatus). Metabolites 2022, 12, 576. [Google Scholar] [CrossRef] [PubMed]
- Wang, H.M.; Hu, X.; Zheng, Y.D.; Chen, J.; Tan, B.P.; Shi, L.L.; Zhang, S. Effects of replacing fish meal with cottonseed protein concentrate on the growth, immune responses, digestive ability and intestinal microbial flora in Litopenaeus vannamei. Fish Shellfish Immunol. 2022, 128, 91–100. [Google Scholar] [CrossRef] [PubMed]
- Gatlin, D.M., III; Barrows, F.T.; Brown, P.; Dabrowski, K.; Gaylord, T.G.; Hardy, R.W.; Herman, E.; Hu, G.S.; Krogdahl, A.; Nelson, R.; et al. Expanding the utilization of sustainable plant products in aquafeeds: A review. Aquac. Res. 2007, 38, 551–579. [Google Scholar] [CrossRef]
- Glencross, B.D.; Baily, J.; Berntssen, M.H.G.; Hardy, R.; MacKenzie, S.; Tocher, D.R. Risk assessment of the use of alternative animal and plant raw material resources in aquaculture feeds. Rev. Aquac. 2020, 12, 703–758. [Google Scholar] [CrossRef]
- NRC (National Research Council). Nutrient Requirements of Fish and Shrimp; The National Academies Press: Washington, DC, USA, 2011. [Google Scholar]
- Gómez-Requeni, P.; de Vareilles, M.; Kousoulaki, K.; Jordal, A.E.; Conceição, L.E.; Rønnestad, I. Whole body proteome response to a dietary lysine imbalance in zebrafish Danio rerio. Comp. Biochem. Physiol. Part D Genom. Proteom. 2011, 6, 178–186. [Google Scholar] [CrossRef]
- Hu, Y.Y.; Feng, L.; Jiang, W.D.; Wu, P.; Liu, Y.; Kuang, S.Y.; Tang, L.; Zhou, X.Q. Lysine deficiency impaired growth performance and immune response and aggravated inflammatory response of the skin, spleen and head kidney in grown-up grass carp (Ctenopharyngodon idella). Anim. Nutr. 2021, 7, 556–568. [Google Scholar] [CrossRef]
- Yang, P.; Wang, W.Q.; Chi, S.Y.; Mai, K.S.; Song, F.; Wang, L. Effects of dietary lysine on regulating GH-IGF system, intermediate metabolism and immune response in largemouth bass (Micropterus salmoides). Aquac. Rep. 2020, 17, 100323. [Google Scholar] [CrossRef]
- Liebl, A.R.D.S.; Nascimento, M.D.S.; Aride, P.H.R.; Pantoja-Lima, J.; Bussons, M.R.F.M.; Furuya, W.M.; Oliveira, A.T.D. Lysine effect on the characterization of fillet, by-products, residues, and morphometry of tambaqui Colossoma macropomum (Cuvier, 1818). Lat. Am. J. Aquat. Res. 2021, 49, 620–631. [Google Scholar] [CrossRef]
- Reda, R.M.; Nasr, M.A.F.; Ismail, T.A.; Moustafa, A. Immunological responses and the antioxidant status in African catfish (Clarias gariepinus) following replacement of dietary fish meal with plant protein. Animals 2021, 11, 1223. [Google Scholar] [CrossRef] [PubMed]
- Da Silva Liebl, A.R.; Cáo, M.A.; Nascimento, M.D.S.; Castro, P.D.D.S.; Duncan, W.L.P.; Pantoja-Lima, J.; Aride, P.H.R.; Bussons, M.R.M.F.; Furuya, W.M.; Faggio, C.; et al. Dietary lysine requirements of Colossoma macropomum (Cuvier, 1818) based on growth performance, hepatic and intestinal morphohistology and hematology. Vet. Res. Commun. 2022, 46, 9–25. [Google Scholar] [CrossRef] [PubMed]
- Hua, K.; Suwendi, E.; Bureau, D.P. Effect of body weight on lysine utilization efficiency in Nile tilapia (Oreochromis niloticus). Aquaculture 2019, 505, 47–53. [Google Scholar] [CrossRef]
- Ahmed, I.; Khan, M.A. Dietary lysine requirement of fingerling Indian major carp, Cirrhinus mrigala (Hamilton). Aquaculture 2004, 235, 499–511. [Google Scholar] [CrossRef]
- Zhang, C.X.; Ai, Q.H.; Mai, K.S.; Tan, B.P.; Li, H.T.; Zhang, L. Dietary lysine requirement of large yellow croaker, Pseudosciaena crocea R. Aquaculture 2008, 283, 123–127. [Google Scholar] [CrossRef]
- Huang, D.Y.; Maulu, S.; Ren, M.C.; Liang, H.L.; Ge, X.P.; Ji, K.; Yu, H. Dietary lysine levels improved antioxidant capacity and immunity via the TOR and p38 MAPK signaling pathways in grass carp, Ctenopharyngodon idellus fry. Front. Immunol. 2021, 12, 635015. [Google Scholar] [CrossRef]
- Wilson, R.P. Protein and amino acid requirements of fishes. Annu. Rev. Nutr. 1986, 6, 225–244. [Google Scholar] [CrossRef]
- Xu, C.M.; Yu, H.R.; Li, L.Y.; Li, M.; Qiu, X.Y.; Zhao, S.S.; Fan, X.Q.; Fan, Y.L.; Shan, L.L. Dietary vitamin A requirements of coho salmon Oncorhynchus kisutch (Walbaum, 1792) post-smolts. Aquaculture 2022, 560, 738448. [Google Scholar] [CrossRef]
- Ma, Q.L.; Teter, B.; Ubeda, O.J.; Morihara, T.; Dhoot, D.; Nyby, M.D.; Tuck, M.L.; Frautschy, S.A.; Cole, G.M. Omega-3 fatty acid docosahexaenoic acid increases SorLA/LR11, a sorting protein with reduced expression in sporadic Alzheimer’s disease (AD): Relevance to AD prevention. J. Neurosci. 2007, 27, 14299–14307. [Google Scholar] [CrossRef]
- Swanson, D.; Block, R.; Mousa, S.A. Omega-3 fatty acids EPA and DHA: Health benefits throughout life. Adv. Nutr. 2012, 3, 1–7. [Google Scholar] [CrossRef] [PubMed]
- Wilson, R.P. Amino Acid and Proteins. In Fish Nutrition, 2nd ed.; Halver, J.E., Ed.; Academic Press: New York, NY, USA, 1989; pp. 115–119. [Google Scholar]
- AOAC (Association of Official Analytical Chemists). Official Methods of Analysis of Official Analytical Chemists International, 16th ed.; Association of Official Analytical Chemists: Arlington, VA, USA, 2005. [Google Scholar]
- Yossa, R.; Verdegem, M.C.J. Misuse of multiple comparison tests and underuse of contrast procedures in aquaculture publications. Aquaculture 2015, 437, 344–350. [Google Scholar] [CrossRef]
- Li, X.Y.; Tang, L.; Hu, K.; Liu, Y.; Jiang, W.D.; Jiang, J.; Wu, P.; Chen, G.F.; Li, S.H.; Kuang, S.Y.; et al. Effect of dietary lysine on growth, intestinal enzymes activities and antioxidant status of sub-adult grass carp (Ctenopharyngodon idella). Fish Physiol. Biochem. 2014, 40, 659–671. [Google Scholar] [CrossRef] [PubMed]
- Mai, K.S.; Zhang, L.; Ai, Q.H.; Duan, Q.Y.; Zhang, C.X.; Li, H.T.; Wan, J.L.; Liufu, Z.G. Dietary lysine requirement of juvenile Japanese seabass, Lateolabrax japonicus. Aquaculture 2006, 258, 535–542. [Google Scholar] [CrossRef]
- Kroeckel, S.; Dietz, C.; Schulz, C.; Susenbeth, A. Effect of diet composition and lysine supply on growth and body composition in juvenile turbot (Psetta maxima). Arch. Anim. Nutr. 2013, 67, 330–345. [Google Scholar] [CrossRef]
- Walton, M.J.; Cowey, C.B.; Adron, J.W. The effect of dietary lysine levels on growth and metabolism of rainbow trout (Salmo gairdneri). Br. J. Nutr. 1984, 52, 115–122. [Google Scholar] [CrossRef]
- Van Larebeke, M.; Dockx, G.; Larondelle, Y.; Rollin, X. Relative influence of dietary protein and energy contents on lysine requirements and voluntary feed intake of rainbow trout fry. Br. J. Nutr. 2018, 119, 42–56. [Google Scholar] [CrossRef]
- Zhou, F.; Shao, J.; Xu, R.; Ma, J.J.; Xu, Z.R. Quantitative L-lysine requirement of juvenile black sea bream (Sparus macrocephalus). Aquac. Nutr. 2010, 162, 194–204. [Google Scholar] [CrossRef]
- Ravi, J.; Devaraj, K.V. Quantitative essential amino acid requirements for growth of catla, Catla catla (Hamilton). Aquaculture 1991, 96, 281–291. [Google Scholar] [CrossRef]
- Ketola, H.G. Requirement for dietary lysine and arginine by fry of rainbow trout. J. Anim. Sci. 1983, 56, 101–107. [Google Scholar] [CrossRef]
- Rollin, X.; Mambrini, M.; Abboudi, T.; Larondelle, Y.; Kaushik, S. The optimum dietary indispensable amino acid pattern for growing Atlantic salmon (Salmo salar) fry. Br. J. Nutr. 2003, 90, 865–876. [Google Scholar] [CrossRef] [PubMed]
- Zhou, Q.C.; Wu, Z.H.; Chi, S.Y.; Yang, Q.H. Dietary lysine requirement of juvenile cobia (Rachycentron canadum). Aquaculture 2007, 273, 634–640. [Google Scholar] [CrossRef]
- Deng, D.F.; Dominy, W.; Ju, Z.Y.; Koshio, S.; Murashige, R.; Wilson, R.P. Dietary lysine requirement of juvenile Pacific threadfin (Polydactylus sexfilis). Aquaculture 2010, 308, 44–48. [Google Scholar] [CrossRef]
- Liu, B.; Zhao, Z.X.; Brown, P.B.; Cui, H.H.; Xie, J.; Habte-Tsion, H.M.; Ge, X.P. Dietary vitamin A requirement of juvenile Wuchang bream (Megalobrama amblycephala) determined by growth and disease resistance. Aquaculture 2016, 450, 23–30. [Google Scholar] [CrossRef]
- Conceiçào, L.E.C.; Ronnestad, I.; Tonheim, S.K. Metabolic budgets for lysine and glutamate in unfed herring (Clupea harengus) larvae. Aquaculture 2002, 206, 305–312. [Google Scholar] [CrossRef]
- Abboudi, T.; Mambrini, M.; Ooghe, W.; Larondelle, Y.; Rollin, X. Protein and lysine requirements for maintenance and for tissue accretion in Atlantic salmon (Salmo salar) fry. Aquaculture 2018, 261, 369–383. [Google Scholar] [CrossRef]
- Cai, W.C.; Liu, W.B.; Jiang, G.Z.; Wang, K.Z.; Sun, C.X.; Li, X.F. Lysine supplement benefits the growth performance, protein synthesis, and muscle development of Megalobrama amblycephala fed diets with fish meal replaced by rice protein concentrate. Fish Physiol. Biochem. 2018, 44, 1159–1174. [Google Scholar] [CrossRef]
- Kim, J.D.; Lall, S.P. Effects of dietary protein level on growth and utilization of protein and energy by juvenile haddock (Melanogrammus aeglefinus). Aquaculture 2001, 195, 311–319. [Google Scholar] [CrossRef]
- Helland, S.J.; Grisdale-Helland, B. Replacement of fish meal with wheat gluten in diets for Atlantic halibut (Hippoglossus hippoglossus): Effect on whole-body amino acid concentrations. Aquaculture 2006, 261, 1363–1370. [Google Scholar] [CrossRef]
- Burtle, G.J.; Liu, Q. Dietary carnitine and lysine affect channel catfish lipid and protein composition. J. World Aquac. Soc. 1994, 25, 169–174. [Google Scholar] [CrossRef]
- Ozório, R.O.; Uktoseja, J.L.; Huisman, E.A.; Verreth, J.A. Changes in fatty acid concentrations in tissues of African catfish, Clarias gariepinus Burchell, as a consequence of dietary carnitine, fat and lysine supplementation. Br. J. Nutr. 2001, 86, 623–636. [Google Scholar] [CrossRef] [PubMed]
- Kroeckel, S.; Dietz, C.; Schulz, C.; Susenbeth, A. Bioavailability of free lysine and protein-bound lysine from casein and fishmeal in juvenile turbot (Psetta maxima). Br. J. Nutr. 2015, 113, 718–727. [Google Scholar] [CrossRef] [PubMed]
- Wei, Y.L.; Li, B.X.; Xu, H.G.; Liang, M.Q. Effects of lysine and leucine in free and different dipeptide forms on the growth, amino acid profile and transcription of intestinal peptide, and amino acid transporters in turbot (Scophthalmus maximus). Fish Physiol. Biochem. 2020, 46, 1795–1807. [Google Scholar] [CrossRef] [PubMed]
- Gahl, M.J.; Crenshaw, T.D.; Benevenga, N.J. Diminishing returns in weight, nitrogen, and lysine gain of pigs fed six levels of lysine from three supplemental sources. J. Anim. Sci. 1994, 72, 3177–3187. [Google Scholar] [CrossRef]
- Rodehutscord, M.; Borchert, F.; Gregus, Z.; Pfeffer, E. Availability and utilisation of free lysine in rainbow trout (Oncorhynchus mykiss): 2. Comparison of l-lysine·HCl and l-lysine sulphate. Aquaculture 2000, 187, 177–183. [Google Scholar] [CrossRef]
- Cheng, Z.J.; Hardy, R.W.; Usry, J.L. Effects of lysine supplementation in plant protein-based diets on the performance of rainbow trout (Oncorhynchus mykiss) and apparent digestibility coefficients of nutrients. Aquaculture 2003, 215, 255–265. [Google Scholar] [CrossRef]
- Ruohonen, K.; Simpson, S.J.; Raubenheimer, D. A new approach to diet optimisation: A re-analysis using European whitefish (Coregonus lavaretus). Aquaculture 2007, 267, 147–156. [Google Scholar] [CrossRef]
- Simpson, S.J.; Raubenheimer, D. The Nature of Nutrition: A Unifying Framework from Animal Adaptation to Human Obesity; Princeton University Press: Princeton, NJ, USA, 2012. [Google Scholar]


| Composition | Coho Salmon Eggs in Eyed Stage | Percentage of Amino Acid in Relation to Lysine |
|---|---|---|
| Proximate composition | ||
| Crude protein | 55.78 ± 0.39 | |
| Crude lipid | 18.97 ± 0.46 | |
| Ash | 5.74 ± 0.41 | |
| Essential amino acid (EAA) profile 2 | ||
| Arginine | 3.18 ± 0.06 | 78.33 ± 0.52 |
| Histidine | 1.59 ± 0.04 | 39.16 ± 0.56 |
| Isoleucine | 3.07 ± 0.06 | 75.62 ± 0.65 |
| Leucine | 4.83 ± 0.08 | 118.97 ± 0.72 |
| Lysine | 4.06 ± 0.06 | |
| Methionine | 2.28 ± 0.03 | 56.16 ± 0.35 |
| Phenylalanine | 2.78 ± 0.03 | 68.47 ± 0.29 |
| Threonine | 2.70 ± 0.05 | 66.50 ± 0.51 |
| Valine | 3.82 ± 0.04 | 94.09 ± 0.43 |
| Non-essential amino acid (NEAA) profile | ||
| Alanine | 4.11 ± 0.05 | 101.23 ± 0.53 |
| Aspartic acid | 4.94 ± 0.04 | 121.67 ± 0.49 |
| Glutamic acid | 6.38 ± 0.07 | 157.14 ± 0.86 |
| Glycine | 2.14 ± 0.02 | 52.71 ± 0.36 |
| Proline | 2.78 ± 0.02 | 68.48 ± 0.29 |
| Serine | 3.47 ± 0.05 | 85.47 ± 0.67 |
| Tyrosine | 1.99 ± 0.02 | 49.01 ± 0.47 |
| Cysteine | 0.49 ± 0.01 | 12.07 ± 0.07 |
| Dietary Groups | Analyzed Dietary L-Lysine Level (% of Diet) | |||||
|---|---|---|---|---|---|---|
| 2.29 | 2.81 | 3.32 | 3.80 | 4.27 | 4.78 | |
| Fish meal (Peruvian) 1 | 15.00 | 15.00 | 15.00 | 15.00 | 15.00 | 15.00 |
| Poultry by-product meal 1 | 10.00 | 10.00 | 10.00 | 10.00 | 10.00 | 10.00 |
| Soy protein concentrate 1 | 15.00 | 15.00 | 15.00 | 15.00 | 15.00 | 15.00 |
| Corn gluten meal 1 | 10.00 | 10.00 | 10.00 | 10.00 | 10.00 | 10.00 |
| Wheat gluten meal 1 | 10.00 | 10.00 | 10.00 | 10.00 | 10.00 | 10.00 |
| Beer yeast 1 | 5.00 | 5.00 | 5.00 | 5.00 | 5.00 | 5.00 |
| L-lysine.HCl | 0.00 | 0.64 | 1.28 | 1.92 | 2.56 | 3.20 |
| Glycine 1 | 2.55 | 2.04 | 1.53 | 1.02 | 0.51 | 0.00 |
| Amino acid mixture 2 | 7.59 | 7.59 | 7.59 | 7.59 | 7.59 | 7.59 |
| Cellulose | 0.65 | 0.52 | 0.39 | 0.26 | 0.13 | 0.00 |
| α-starch | 10.78 | 10.78 | 10.78 | 10.78 | 10.78 | 10.78 |
| Fish oil | 5.00 | 5.00 | 5.00 | 5.00 | 5.00 | 5.00 |
| Soybean oil | 5.00 | 5.00 | 5.00 | 5.00 | 5.00 | 5.00 |
| Soy lecithin | 1.00 | 1.00 | 1.00 | 1.00 | 1.00 | 1.00 |
| Monocalcium phosphate | 1.00 | 1.00 | 1.00 | 1.00 | 1.00 | 1.00 |
| Vitamin premix 3 | 0.50 | 0.50 | 0.50 | 0.50 | 0.50 | 0.50 |
| Mineral premix 4 | 0.50 | 0.50 | 0.50 | 0.50 | 0.50 | 0.50 |
| Choline chloride | 0.30 | 0.30 | 0.30 | 0.30 | 0.30 | 0.30 |
| Ascorbyl polyphosphate | 0.10 | 0.10 | 0.10 | 0.10 | 0.10 | 0.10 |
| Antioxidant | 0.03 | 0.03 | 0.03 | 0.03 | 0.03 | 0.03 |
| Proximate composition (n = 3) | ||||||
| Crude protein | 54.81 | 54.88 | 55.06 | 55.02 | 55.05 | 55.14 |
| Crude lipid | 15.33 | 15.35 | 15.29 | 15.25 | 15.31 | 15.47 |
| Ash | 8.21 | 8.26 | 8.34 | 8.37 | 8.29 | 8.38 |
| Gross energy (KJ/g DM) | 21.55 | 21.61 | 21.52 | 21.46 | 21.67 | 21.63 |
| Amino acid profile (% of diet) | ||||||
| Essential amino acid (EAA) profile | ||||||
| Lysine (% of dietary protein) | 4.13 | 5.11 | 6.04 | 6.91 | 7.76 | 8.69 |
| Lysine | 2.29 | 2.81 | 3.32 | 3.80 | 4.27 | 4.78 |
| Arginine | 3.15 | 3.17 | 3.19 | 3.15 | 3.16 | 3.18 |
| Histidine | 1.58 | 1.56 | 1.55 | 1.57 | 1.58 | 1.57 |
| Isoleucine | 3.07 | 3.06 | 3.10 | 3.04 | 3.07 | 3.08 |
| Leucine | 4.43 | 4.45 | 4.44 | 4.46 | 4.45 | 4.47 |
| Methionine | 2.25 | 2.26 | 2.24 | 2.28 | 2.27 | 2.26 |
| Phenylalanine | 2.73 | 2.75 | 2.74 | 2.76 | 2.74 | 2.77 |
| Threonine | 2.70 | 2.71 | 2.67 | 2.74 | 2.72 | 2.69 |
| Valine | 3.80 | 3.83 | 3.85 | 3.82 | 3.84 | 3.81 |
| Total EAA | 26.00 | 26.60 | 27.10 | 27.62 | 28.10 | 28.61 |
| Non-essential amino acid (NEAA) profile | ||||||
| Alanine | 2.39 | 2.40 | 2.45 | 2.42 | 2.43 | 2.41 |
| Aspartic acid | 3.71 | 3.75 | 3.70 | 3.71 | 3.73 | 3.72 |
| Cysteine | 0.47 | 0.49 | 0.48 | 0.47 | 0.50 | 0.51 |
| Glutamic acid | 7.62 | 7.63 | 7.65 | 7.65 | 7.61 | 7.60 |
| Glycine | 5.24 | 4.69 | 4.23 | 3.69 | 3.17 | 2.68 |
| Proline | 2.74 | 2.75 | 2.79 | 2.77 | 2.78 | 2.76 |
| Serine | 2.12 | 2.11 | 2.08 | 2.09 | 2.10 | 2.13 |
| Tyrosine | 1.52 | 1.53 | 1.56 | 1.55 | 1.53 | 1.51 |
| Total NEAA | 25.81 | 25.35 | 24.94 | 24.35 | 23.85 | 23.32 |
| EAAs | 15% Fish Meal | 10% Poultry By-Product Meal | 15% Soy Protein Concentrate | 10% Corn Gluten Meal | 10% Wheat Gluten Meal | 5% Beer Yeast | 55.78% Coho Salmon Eyed Egg Protein | Supplied EAA |
|---|---|---|---|---|---|---|---|---|
| Arginine | 0.71 | 0.38 | 0.81 | 0.22 | 0.33 | 0.12 | 3.18 | 0.61 |
| Histidine | 0.26 | 0.10 | 0.25 | 0.13 | 0.19 | 0.06 | 1.59 | 0.60 |
| Methionine | 0.35 | 0.09 | 0.14 | 0.15 | 0.14 | 0.04 | 2.28 | 1.37 |
| Phenylalanine | 0.54 | 0.19 | 0.53 | 0.46 | 0.35 | 0.22 | 2.78 | 0.49 |
| Leucine | 0.76 | 0.32 | 0.84 | 1.03 | 0.33 | 0.25 | 4.43 | 0.90 |
| Isoleucine | 0.50 | 0.16 | 0.48 | 0.43 | 0.60 | 0.15 | 3.07 | 0.75 |
| Threonine | 0.53 | 0.20 | 0.43 | 0.30 | 0.23 | 0.12 | 2.70 | 0.89 |
| Valine | 0.53 | 0.21 | 0.51 | 0.33 | 0.37 | 0.18 | 3.82 | 1.69 |
| Lysine | 0.90 | 0.28 | 0.56 | 0.12 | 0.16 | 0.18 | 4.06 | Variable |
| Diets Groups | Analyzed Dietary L-Lysine Level (% of Diet) | |||||
|---|---|---|---|---|---|---|
| 2.29 | 2.81 | 3.32 | 3.80 | 4.27 | 4.78 | |
| Survival (%) | 94.67 ± 1.53 | 96.33 ± 1.15 | 98.00 ± 1.00 | 97.00 ± 1.00 | 96.33 ± 0.58 | 95.67 ± 1.53 |
| Initial body weight (g) | 0.30 ± 0.01 | 0.30 ± 0.01 | 0.30 ± 0.01 | 0.30 ± 0.01 | 0.30 ± 0.01 | 0.30 ± 0.01 |
| Final body weight (g) | 4.39 ± 0.05 c | 4.70 ± 0.06 b | 4.94 ± 0.05 a | 5.09 ± 0.05 a | 4.86 ± 0.04 ab | 4.76 ± 0.02 b |
| SGR (%/d) | 3.19 ± 0.01 c | 3.27 ± 0.02 b | 3.33 ± 0.01 a | 3.37 ± 0.01 a | 3.31 ± 0.01 ab | 3.28 ± 0.01 b |
| Feed intake (g) | 4.89 ± 0.03 a | 4.84 ± 0.04 a | 4.69 ± 0.03 b | 4.73 ± 0.03 b | 4.79 ± 0.03 ab | 4.88 ± 0.02 a |
| FCR | 1.20 ± 0.02 a | 1.11 ± 0.02 b | 1.01 ± 0.02 c | 0.99 ± 0.01 c | 1.05 ± 0.01 bc | 1.09 ± 0.02 b |
| PER (%) | 1.52 ± 0.02 c | 1.65 ± 0.03 b | 1.80 ± 0.03 a | 1.84 ± 0.02 a | 1.73 ± 0.02 ab | 1.66 ± 0.03 b |
| BPD (%) | 20.22 ± 0.16 c | 22.18 ± 0.33 b | 25.15 ± 0.38 a | 26.10 ± 0.46 a | 24.85 ± 0.41 ab | 24.05 ± 0.39 b |
| CF (%) | 1.25 ± 0.07 | 1.34 ± 0.11 | 1.23 ± 0.13 | 1.30 ± 0.09 | 1.36 ± 0.16 | 1.21 ± 0.20 |
| HSI (%) | 1.69 ± 0.07 | 1.71 ± 0.06 | 1.74 ± 0.09 | 1.64 ± 0.12 | 1.62 ± 0.14 | 1.56 ± 0.17 |
| VSI (%) | 7.51 ± 0.10 | 7.35 ± 0.09 | 7.47 ± 0.07 | 7.42 ± 0.11 | 7.26 ± 0.06 | 7.32 ± 0.08 |
| Dietary Groups (L-Lysine Level, % of Diet) | Moisture | Crude Protein | Crude Lipid | Ash |
|---|---|---|---|---|
| The alevins at the start of feeding trial | ||||
| 77.85 ± 0.39 | 12.55 ± 0.22 | 6.01 ± 0.13 | 4.41 ± 0.18 | |
| The alevins at the end of feeding trial | ||||
| 2.29 | 78.02 ± 0.21 | 13.25 ± 0.16 c | 5.57 ± 0.20 a | 4.07 ± 0.29 |
| 2.81 | 77.56 ± 0.15 | 13.44 ± 0.12 c | 5.40 ± 0.09 a | 4.12 ± 0.31 |
| 3.32 | 77.70 ± 0.23 | 13.91 ± 0.09 b | 5.35 ± 0.11 ab | 4.18 ± 0.16 |
| 3.80 | 77.48 ± 0.25 | 14.11 ± 0.07 ab | 5.23 ± 0.14 b | 4.09 ± 0.25 |
| 4.27 | 77.63 ± 0.17 | 14.26 ± 0.08 ab | 5.17 ± 0.16 bc | 4.20 ± 0.33 |
| 4.78 | 77.56 ± 0.32 | 14.33 ± 0.11 a | 4.96 ± 0.17 c | 3.98 ± 0.22 |
| Amino Acids | Analyzed Dietary L-Lysine Level (% of Diet) | |||||
|---|---|---|---|---|---|---|
| 2.29 | 2.81 | 3.32 | 3.80 | 4.27 | 4.78 | |
| Essential amino acid (EAA) profile | ||||||
| Arginine | 3.03 ± 0.04 b | 3.16 ± 0.03 b | 3.28 ± 0.03 a | 3.33 ± 0.02 a | 3.39 ± 0.03 a | 3.36 ± 0.03 a |
| Histidine | 1.05 ± 0.02 | 1.01 ± 0.03 | 1.11 ± 0.03 | 1.14 ± 0.02 | 1.08 ± 0.02 | 1.16 ± 0.03 |
| Isoleucine | 2.82 ± 0.03 | 2.73 ± 0.03 | 2.66 ± 0.02 | 2.77 ± 0.03 | 2.69 ± 0.03 | 2.64 ± 0.02 |
| Leucine | 4.03 ± 0.03 | 4.09 ± 0.03 | 4.14 ± 0.03 | 4.17 ± 0.03 | 4.11 ± 0.03 | 4.06 ± 0.03 |
| Lysine | 3.94 ± 0.03 b | 4.02 ± 0.03 b | 4.15 ± 0.03 a | 4.22 ± 0.04 a | 4.25 ± 0.04 a | 4.19 ± 0.03 a |
| Methionine | 2.15 ± 0.02 | 2.03 ± 0.03 | 2.07 ± 0.03 | 2.13 ± 0.03 | 2.23 ± 0.03 | 2.17 ± 0.03 |
| Phenylalanine | 2.56 ± 0.04 | 2.65 ± 0.04 | 2.73 ± 0.03 | 2.72 ± 0.03 | 2.62 ± 0.03 | 2.69 ± 0.03 |
| Threonine | 2.35 ± 0.03 | 2.26 ± 0.03 | 2.29 ± 0.03 | 2.19 ± 0.03 | 2.37 ± 0.03 | 2.15 ± 0.03 |
| Valine | 3.95 ± 0.04 b | 4.10 ± 0.03 b | 4.22 ± 0.03 a | 4.30 ± 0.05 a | 4.33 ± 0.04 a | 4.41 ± 0.04 a |
| Total EAA2 | 25.88 ± 0.07 b | 26.05 ± 0.06 b | 26.65 ± 0.05 a | 26.97 ± 0.08 a | 27.07 ± 0.06 a | 26.83 ± 0.07 a |
| Non-essential amino acid (NEAA) profile | ||||||
| Alanine | 3.50 ± 0.03 | 3.44 ± 0.03 | 3.53 ± 0.04 | 3.57 ± 0.04 | 3.46 ± 0.03 | 3.51 ± 0.03 |
| Aspartic acid | 4.45 ± 0.03 | 4.43 ± 0.03 | 4.51 ± 0.04 | 4.48 ± 0.03 | 4.46 ± 0.03 | 4.47 ± 0.03 |
| Cystine | 0.53 ± 0.02 | 0.51 ± 0.03 | 0.55 ± 0.03 | 0.54 ± 0.03 | 0.56 ± 0.02 | 0.52 ± 0.03 |
| Glutamic acid | 7.22 ± 0.04 | 7.27 ± 0.04 | 7.33 ± 0.05 | 7.35 ± 0.04 | 7.19 ± 0.04 | 7.26 ± 0.04 |
| Glycine | 3.72 ± 0.03 a | 3.67 ± 0.03 a | 3.56 ± 0.02 b | 3.49 ± 0.03 b | 3.38 ± 0.03 bc | 3.31 ± 0.03 c |
| Proline | 2.67 ± 0.02 | 2.66 ± 0.02 | 2.62 ± 0.03 | 2.69 ± 0.03 | 2.76 ± 0.03 | 2.72 ± 0.03 |
| Serine | 2.23 ± 0.03 | 2.29 ± 0.03 | 2.25 ± 0.03 | 2.31 ± 0.03 | 2.26 ± 0.03 | 2.23 ± 0.03 |
| Tyrosine | 2.39 ± 0.03 | 2.35 ± 0.03 | 2.34 ± 0.03 | 2.41 ± 0.03 | 2.37 ± 0.03 | 2.45 ± 0.03 |
| Total NEAA | 26.71 ± 0.05 | 26.62 ± 0.05 | 26.69 ± 0.07 | 26.84 ± 0.06 | 26.44 ± 0.05 | 26.47 ± 0.06 |
Disclaimer/Publisher’s Note: The statements, opinions and data contained in all publications are solely those of the individual author(s) and contributor(s) and not of MDPI and/or the editor(s). MDPI and/or the editor(s) disclaim responsibility for any injury to people or property resulting from any ideas, methods, instructions or products referred to in the content. |
© 2023 by the authors. Licensee MDPI, Basel, Switzerland. This article is an open access article distributed under the terms and conditions of the Creative Commons Attribution (CC BY) license (https://creativecommons.org/licenses/by/4.0/).
Share and Cite
Yu, L.; Yu, H.; Yuan, Z.; Zhang, J.; Li, L.; Ma, C.; Kong, W. Dietary L-Lysine Requirement of Coho Salmon (Oncorhynchus kisutch) Alevins. Animals 2023, 13, 3670. https://doi.org/10.3390/ani13233670
Yu L, Yu H, Yuan Z, Zhang J, Li L, Ma C, Kong W. Dietary L-Lysine Requirement of Coho Salmon (Oncorhynchus kisutch) Alevins. Animals. 2023; 13(23):3670. https://doi.org/10.3390/ani13233670
Chicago/Turabian StyleYu, Leyong, Hairui Yu, Ziyi Yuan, Jiayi Zhang, Lingyao Li, Chengyu Ma, and Weiguang Kong. 2023. "Dietary L-Lysine Requirement of Coho Salmon (Oncorhynchus kisutch) Alevins" Animals 13, no. 23: 3670. https://doi.org/10.3390/ani13233670
APA StyleYu, L., Yu, H., Yuan, Z., Zhang, J., Li, L., Ma, C., & Kong, W. (2023). Dietary L-Lysine Requirement of Coho Salmon (Oncorhynchus kisutch) Alevins. Animals, 13(23), 3670. https://doi.org/10.3390/ani13233670