Simple Summary
Population genetic structure and individual multilocus heterozygosity are vital for wildlife management. Traditionally, microsatellite markers have been used to estimate population genetic parameters, but single-nucleotide polymorphisms (SNPs) have gained popularity due to their greater measurement precision. This study compared genetic estimates at the population and individual levels using microsatellite and SNP markers in red deer (Cervus elaphus). The findings revealed correlations between parameters estimated with both markers that were associated with the level of genetic diversity and genetic differentiation. However, microsatellites showed lower accuracy in representing the distribution of genetic diversity among individuals.
Abstract
The analysis of population genetic structure and individual multilocus heterozygosity are crucial for wildlife management and conservation. Microsatellite markers have traditionally been used to assess these genetic parameters. However, single-nucleotide polymorphisms (SNPs) are becoming increasingly popular. Our goal here was to determine to what extent SNPs can provide better insights than microsatellites into the overall genetic status and population genetic processes in the species. To this end, we genotyped 210 red deer (Cervus elaphus) in the Spanish wild population with both 11 microsatellites and 31,712 SNPs. We compared parameters related to population genetic structure and individual multilocus heterozygosity obtained with both types of markers. Our results showed correlations between parameters measured using both microsatellites and SNPs, particularly those related to the level of genetic diversity and genetic differentiation. However, we found notably lower precision of microsatellites in measuring the distribution of genetic diversity among individuals. We conclude that microsatellites can be used to monitor the overall genetic status and detect broad patterns in red deer populations. Nevertheless, the greater precision of SNPs in inferring genetic structure and multilocus heterozygosity leads us to encourage scientists and wildlife managers to prioritize their use whenever possible.
1. Introduction
Genetic structure plays a crucial role in wildlife management as it provides essential knowledge. The assessment of the spatial distribution of genetic diversity enables the identification of migration barriers [1], the connection between distant populations [2], eventual reductions of local variability [3], risks for the spread of infectious diseases [4,5], and aids in making inferences about population dynamics [6]. Therefore, genetic structure can be important in decision-making for population management, particularly in endangered species and faunal resources such as fisheries or game species [7,8,9,10,11,12,13]. Furthermore, genetic diversity can be associated with inbreeding and population viability [14], and heterozygosity-fitness correlations (HFCs) have been detected in endangered species and game populations [15,16]. Therefore, the assessment of the significance of local genetic diversity within the genetic structure of populations can help in the identification of inbreeding or in evaluating the feasibility of eventual restocking in wildlife management contexts.
Microsatellite markers (short tandem repeat loci or STRs) have been widely used in conservation genetics to estimate genetic structure [17,18] and detect HFCs [19]. These highly polymorphic loci not only allow for the detection of fine-scale genetic variation [20] but also serve as cost-effective and simple-to-use markers, rendering them accessible to researchers. Nevertheless, these markers have limitations, such as homoplasy [21], and they are prone to genotyping errors [22]. Moreover, studies on genetic structure and HFC using STR are often conducted with a relatively small number of markers [23]. Despite the high number of alleles per locus in microsatellites, the low number of loci can reduce the power of analyses related to the genetic structure of populations, such as analyses of spatial genetic patterns [24]. Moreover, the relationships between individual genetic diversity estimated from microsatellites and actual inbreeding are generally weak [25], and it has been suggested that the observed heterozygosity-fitness correlations (HFCs) may be due to linkage disequilibrium with fitness-linked loci rather than the effect of multilocus heterozygosity [26].
In recent years, the use of single-nucleotide polymorphisms SNPs to study genetic structure has increased [27,28,29]. Despite the fact that SNPs are mostly di-allelic, the advent of next-generation sequencing techniques has automated genome-wide SNP detection and favors the simplified genotyping of thousands of markers [30,31,32]. Consequently, a large number of SNPs significantly overcomes the higher number of alleles per locus in microsatellites and can greatly increase the power of analyses of genetic structure [24]. Moreover, analyses of genetic structure using candidate adaptive SNPs can offer insights into potential adaptive divergence among populations and the likelihood of local adaptations [33]. Furthermore, Fernández et al. [34] suggested that 2–3 SNPs per STR can suffice to achieve comparable power values between both types of markers in the genetic identification of individuals. Multilocus heterozygosity at thousands of SNP loci has been shown to be highly correlated with the inbreeding coefficient of known pedigrees [35]. Therefore, HFCs due to inbreeding depression are expected to be more easily detected by estimating genome-wide heterozygosity using SNPs than by using microsatellites.
The red deer (Cervus elaphus) is a widely distributed large mammal, ecosystem engineer, and an important game species in Europe [36]. Despite the abundance of red deer in most of its range, concerns have been raised regarding the preservation of their genetic composition in specific areas [37,38]. Furthermore, game management practices have the potential to impact the genetic structure of red deer populations through activities such as translocating individuals [39], preventing dispersal [40], modifying female aggregation patterns and polygyny degree [41], and altering population structures [42,43]. Additionally, low levels of genetic diversity might increase individuals’ susceptibility to pathogens [44] and might also have implications for antler development in stags [45].
Genetic structure analyses have been conducted in red deer populations across various European regions including the Iberian Peninsula [46,47,48,49], France [50,51], Luxemburg [52], Belgium [53], Scotland [20,54], Ireland [55], Germany [56,57], Denmark [58], Poland [59], Sweden [60], Norway [61], Czech Republic [62], Hungary [63], Croatia [64], Italy [65], or Greece [66]. Furthermore, assessments of genetic structure at a continental scale have also been carried out [67]. These studies have not only contributed to our understanding of the evolutionary history of European red deer but have also provided valuable insights into the impact of anthropogenic and environmental factors on population dynamics. Additionally, they contributed to conservation management framework of the European red deer. All these studies examining genetic structure and HFCs have been conducted using microsatellite markers. The advancements in SNP technology may offer new possibilities for the management of red deer populations. However, no study so far has compared the performance of both types of markers, microsatellite and SNP, for wild red deer populations.
In this study, we aimed to compare the genetic structure and multilocus heterozygosity of wild red deer populations from Spain using 11 microsatellites and over 30,000 SNPs. Our objective was to determine the extent to which SNPs can offer better insights than microsatellites into the overall genetic status and population genetic processes. The comparisons encompassed genetic analyses commonly employed in wildlife management.
2. Materials and Methods
2.1. Study Area and Sample Collection
The study was conducted in six red deer populations located in various regions of Spain, including western, south-central, and northern areas (Figure S1). For western Spain, we included three populations, two of which were from the Sierra de San Pedro (SP1 and SP2; see [46]) and one from the Monfragüe National Park (MO). For south-central Spain, our study included two red deer populations from the Sierra Morena (SM1 and SM2; see [46,48]). These five red deer populations are situated within the native range of the Iberian red deer (Cervus elaphus hispanicus). For northern Spain, we included a population from the southern Pyrenees (PYS, see [38]). In PYS, red deer were introduced from various areas of the Iberian Peninsula, primarily from central Spain areas with populations genetically related to the SM2 [38].
We collected a piece of ear cartilage from 210 red deer culled by hunters. Sample sizes for each population were as follows: SP1 (n = 59), SP2 (n = 7), MO (n = 19), SM1 (n = 75), SM2 (n = 24), and PYS (n = 26). Specimens were hunted between 2020 and 2021 during regular sport hunting and management culling under local regulated hunting plans. This study never provoked hunters to shoot additional deer.
2.2. DNA Extraction, Microsatellite and SNP Genotyping
We isolated genomic DNA from ear tags using the BioSprint® 96 DNA Tissue Kit (Qiagen, Carlsbad, CA, USA) according to the manufacturer’s protocol. We genotyped the individuals with 12 microsatellite markers (BM1818, CP29, CSSM19, CSSM43, ETH225, FCB193, FCB304, FCB5, JP38, MM12, RME25, and TGLA53) according to the methodology described in [47]. We used positive and negative controls during the polymerase chain reactions. In all polymerase chain reactions, the positive control had the same genotype, and the negative control did not have amplification. Linkage disequilibrium (LD) for each pair of loci and departures from Hardy–Weinberg equilibrium (HWE) were assessed with Genepop 3.4 [68] (Table S1). No loci pair showed significant LD. Microchecker 2.2.3 [69] was used to determine the existence of null alleles, stuttering and large allele dropout. The CSSM43 marker was removed due to the existence of null alleles and a high proportion of missing data. The TGLA53 locus also had a relatively high proportion of missing data (Table S1), but repeating all the subsequent analyses with and without this marker did not alter the result. We present the results including TGLA53.
For SNPs, the individuals were genotyped using the cervine 50K Illumina Infinium iSelect HD Custom BeadChip [70,71] including 50,841 SNPs. Plink [72] was used to detect and remove SNPs with more than 10% of missing data, linkage disequilibrium (variance inflation factor of 1.25), and less than 1% of minor allele frequencies, remaining 31.712 markers. The total genotyping rate was 0.993. The chromosome location and SNP position were referenced according to the assembly and annotation of the red deergenome version CerEla1.1 [73].
2.3. Genetic Analyses
The genetic diversity of each population was quantified with observed and expected heterozygosities (HO and HE, respectively). Moreover, the relationship between both heterozygosities was determined with the FIS parameter (inbreeding coefficient at population level). For microsatellites, genetic diversity measures were obtained with Genetix 4.05 [74]. For SNPs, these estimates were conducted with the dartR package [75] in R [76]. We calculated pairwise FST values and assessed their significance using Genetix (with 1000 permutations) for microsatellites and dartR (with 1000 bootstraps) for SNPs. Pairwise FST values obtained with both types of markers were compared with correlations and a Mantel test (10,000 permutations) in the vegan package [77]. Principal Component Analyses (PCAs) for both microsatellites and SNPs were conducted with the adegenet package [78]. The most probable number of genetic clusters in the study area, as well as the probability of assigning individuals to each cluster, were inferred with Structure 2.3.4 [79] for microsatellites. To determine the number of genetic clusters (K), ten independent runs of K = 1–7 were carried out with 500,000 iterations, following a burn-in period of 100,000 iterations. The Structure analyses utilized models of admixture ancestry and correlated allele frequencies. We used both the de novo and LOCPRIOR tests, and the results were similar. We present the results of the de novo test. We analyzed the model output using Structure Harvester [80] according to the ΔK method described in [81]. For SNPs, the most probable number of clusters was obtained by using the cross entropy method implemented in the LEA package [82]. LEA was also used to calculate the admixture coefficients of individuals.
We inferred the expected relationship between multilocus heterozygosity and inbreeding for both types of genetic markers using the inbreedR package [83]. InbreedR was used to estimate the identity disequilibrium parameter (g2), heterozygosity-heterozygosity correlation [26], and the expected r2 between multilocus heterozygosity and inbreeding. Standard deviations were obtained after 1000 permutations and 1000 bootstraps for g2, 1000 repetitions for HHC, and 1000 bootstraps for the expected r2. Finally, we quantified the correlation between multilocus heterozygosity obtained with both microsatellite and SNP markers.
3. Results
3.1. Genetic Diversity and Population Structure
Regarding microsatellite genetic diversity at the population level, MO had the lowest HO, while SP2 showed the lowest HE (Table 1). SM1 exhibited the highest heterozygosity (HO and HE) at microsatellite markers. In terms of SNPs, SP2 displayed the lowest heterozygosity (HO and HE), while the highest heterozygosity (HO and HE) was observed in SM2 (Table 1). The populations with the lowest and highest FIS values using microsatellites were SP2 and MO, respectively (Table 1). In contrast, with respect to SNPs, SP2 had the lowest FIS value and PYS exhibited the highest one (Table 1). HO obtained with microsatellites and SNPs did not exhibit a correlation (Pearson’s r = 0.280, t = 0.583, df = 4, p = 0.591; Figure 1A). The values of HE from microsatellite and SNP markers were positively correlated (Figure 1B) (Pearson’s r = 0.828, t = 2.957, df = 4, p = 0.042). In terms of FIS, the values obtained with microsatellites and SNPs were not significantly related (Pearson’s r = −0.164, t = −0.332, df = 4, p = 0.757; Figure 1C). HO and HE were not correlated for microsatellites (Pearson’s r = 0.641, t = 1.669, df = 4, p = 0.170; Figure S2A), but they were significantly correlated for SNPs (Pearson’s r = 0.904, t = 2.242, df = 4, p = 0.013; Figure S2B). In the case of microsatellites, the lack of correlation was mainly due to one population (SP2; Figure S2A).

Table 1.
Genetic diversity of red deer populations for microsatellite and SNP markers. SP2: Sierra de San Pedro 2. SP1: Sierra de San Pedro 1. MO: Monfragüe National Park. SM1: Sierra Morena 1. SM2: Sierra Morena 2. PYS: southern Pyrenees. Order of populations: west to east (see Figure S1). All: sum of sample sizes in N; mean values in the remaining variables.

Figure 1.
Relationship of different genetic diversity measures obtained with microsatellite and SNP markers in red deer populations. (A) Observed heterozygosity (HO). (B) Expected heterozygosity (HE). (C) Inbreeding coefficient at population level (FIS).
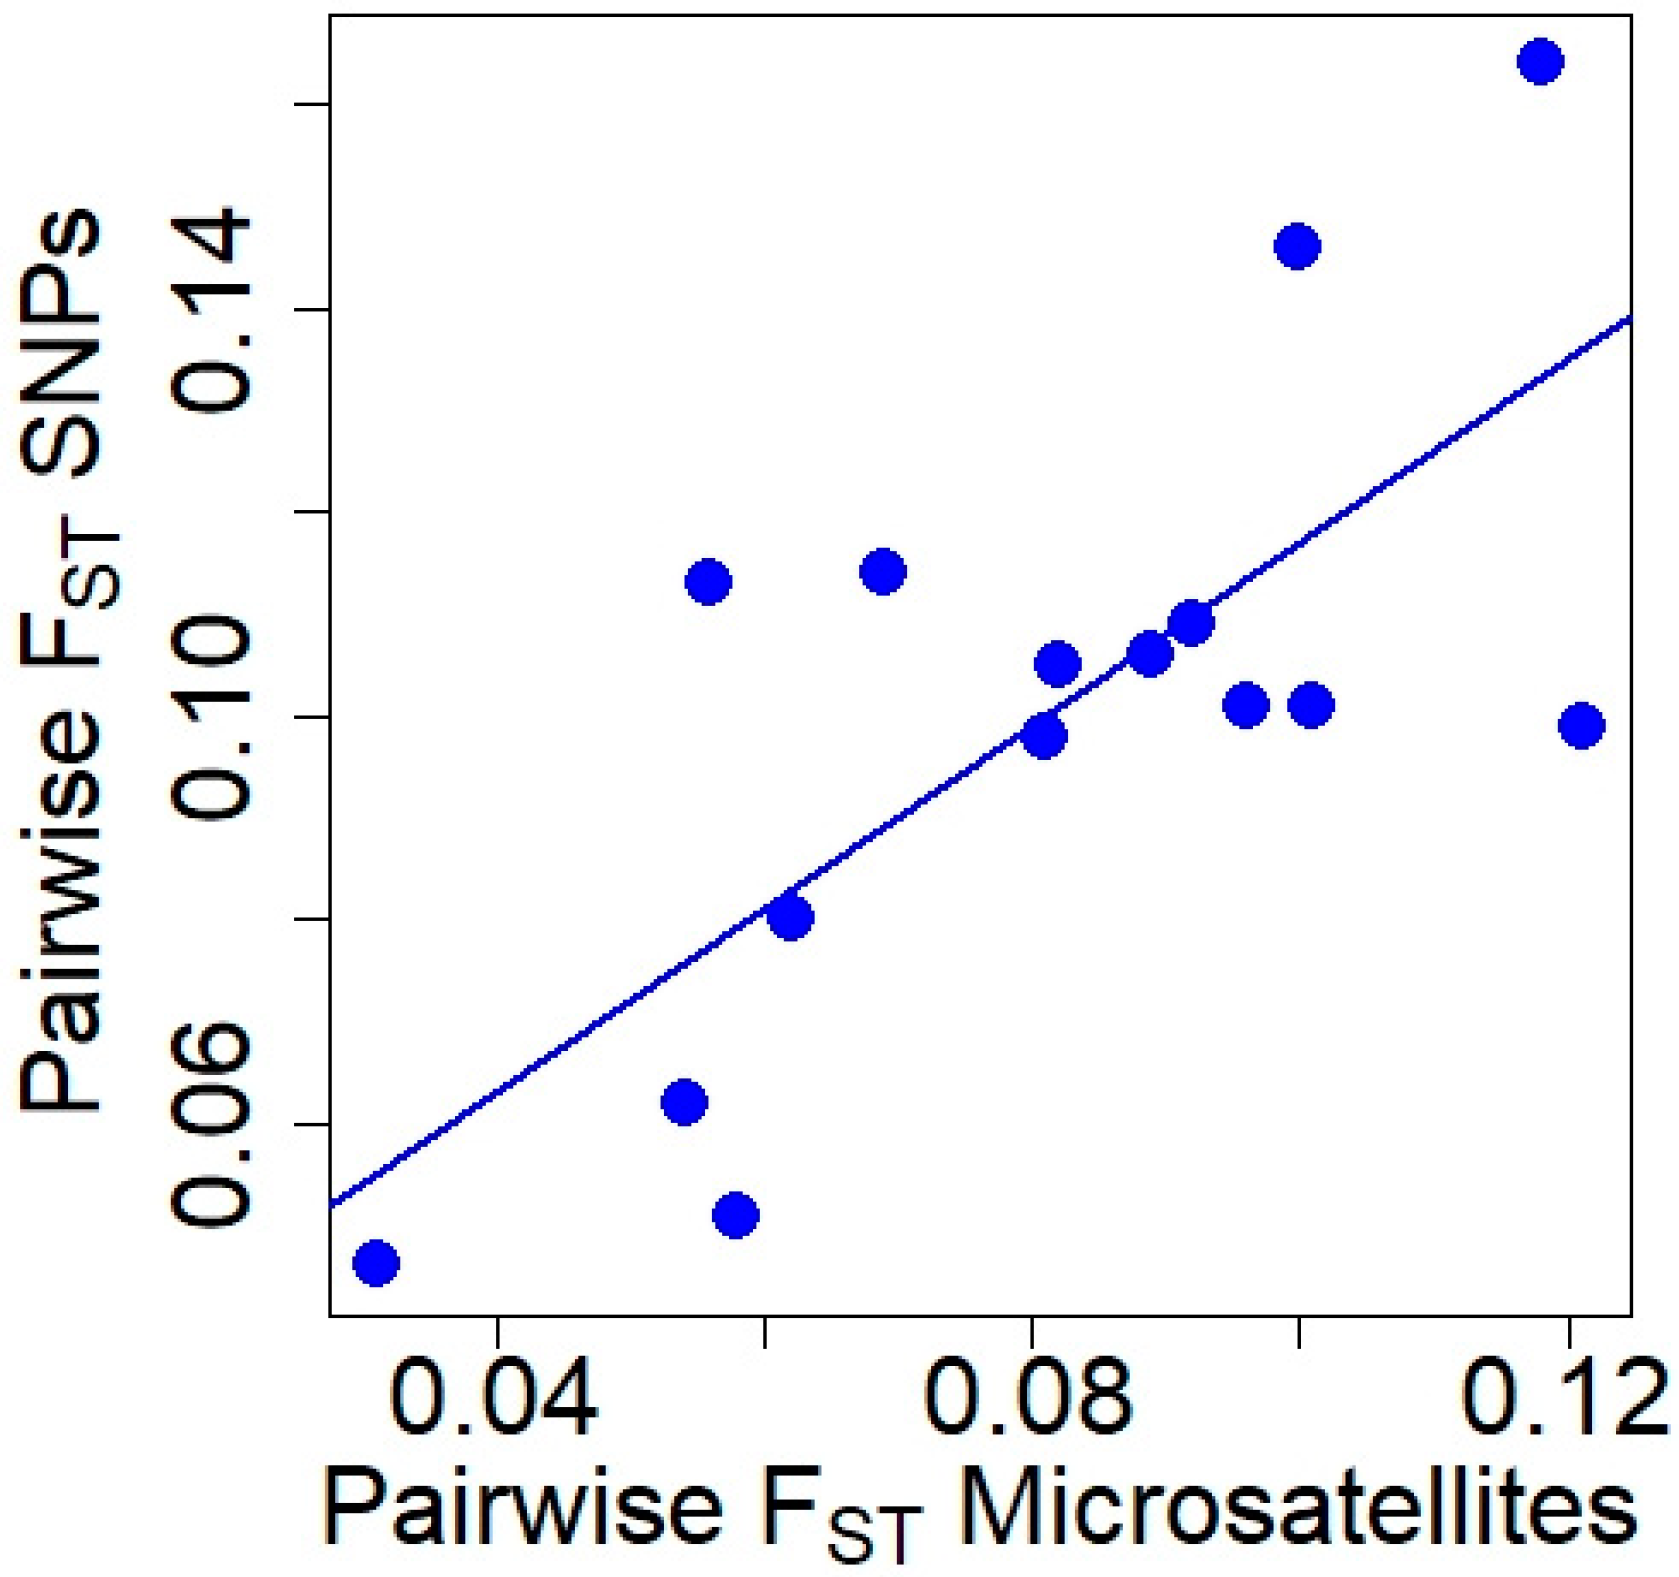
Pairwise FST values obtained with microsatellite and SNP markers (Table 2) were positively correlated (Pearson’s r = 0.726, t = 3.805, df = 13, p = 0.002; Figure 2), although the Mantel test did not reach significance (Mantel statistical r = 0.519, p = 0.067). The genetic differentiation between all pairs of populations was significant for both types of markers (p ≤ 0.001).

Table 2.
Pairwise FST values calculated using microsatellites (above the diagonal) and SNPs (below the diagonal) in the studied red deer populations. SP2: Sierra de San Pedro 2. SP1: Sierra de San Pedro 1. MO: Monfragüe National Park. SM1: Sierra Morena 1. SM2: Sierra Morena 2. PYS: southern Pyrenees. Order of populations: west to east (see Figure S1).
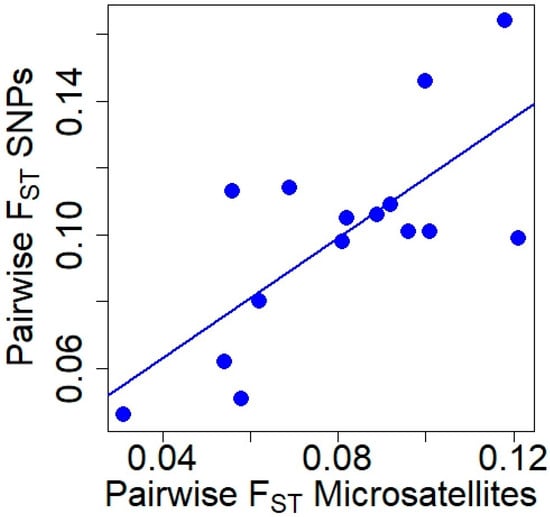
Figure 2.
Relationship between pairwise FST values obtained with microsatellite and SNP markers in red deer populations.
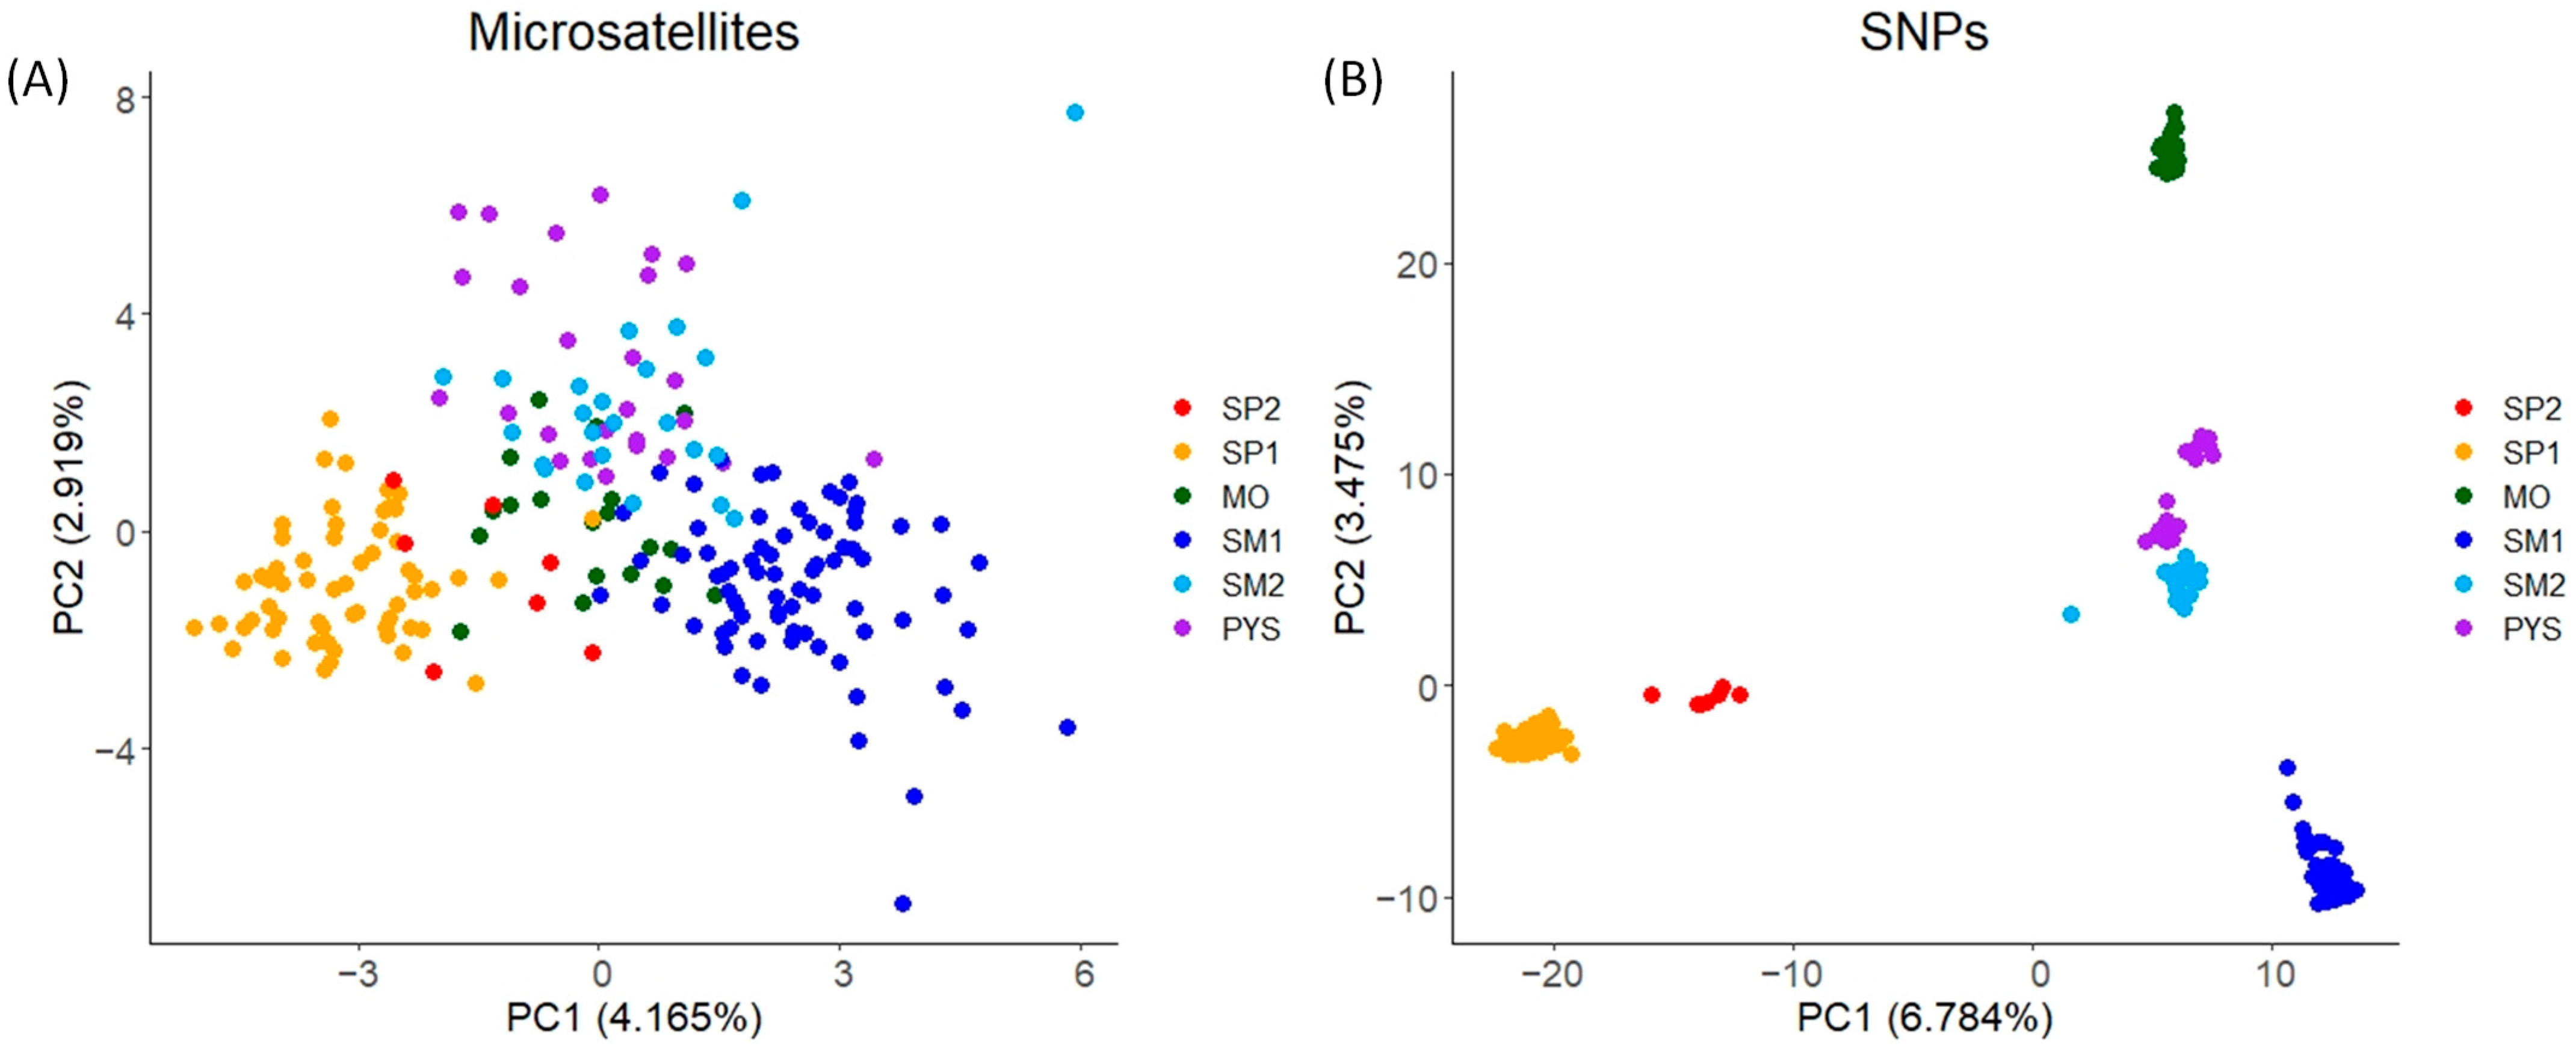
In the PCA obtained with microsatellites, individuals from the same populations tended to have similar PC1 and PC2 scores (mainly individuals from SP1 and SM1; Figure 3A). These scores displayed relatively low variation among populations (Figure 3A). Conversely, for SNPs, the PCA scores exhibited higher variation, with PC1 mainly differentiating SP1 and SM1, and PC2 mainly differentiating MO from the remaining populations (Figure 3B).
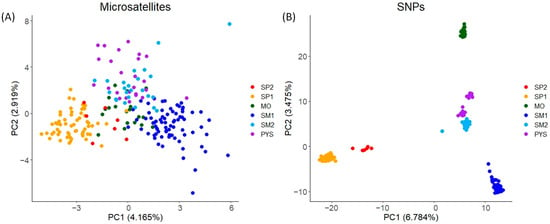
Figure 3.
PCA plots for the two PCs with the highest eigenvalues obtained in red deer populations. (A) PCA obtained with microsatellite markers. (B) PCA obtained with SNPs. The figure shows the percentage of the total variance explained by each PC (in brackets). SP2: Sierra de San Pedro 2. SP1: Sierra de San Pedro 1. MO: Monfragüe National Park. SM1: Sierra Morena 1. SM2: Sierra Morena 2. PYS: southern Pyrenees. Order of populations: west to east (see Figure S1).
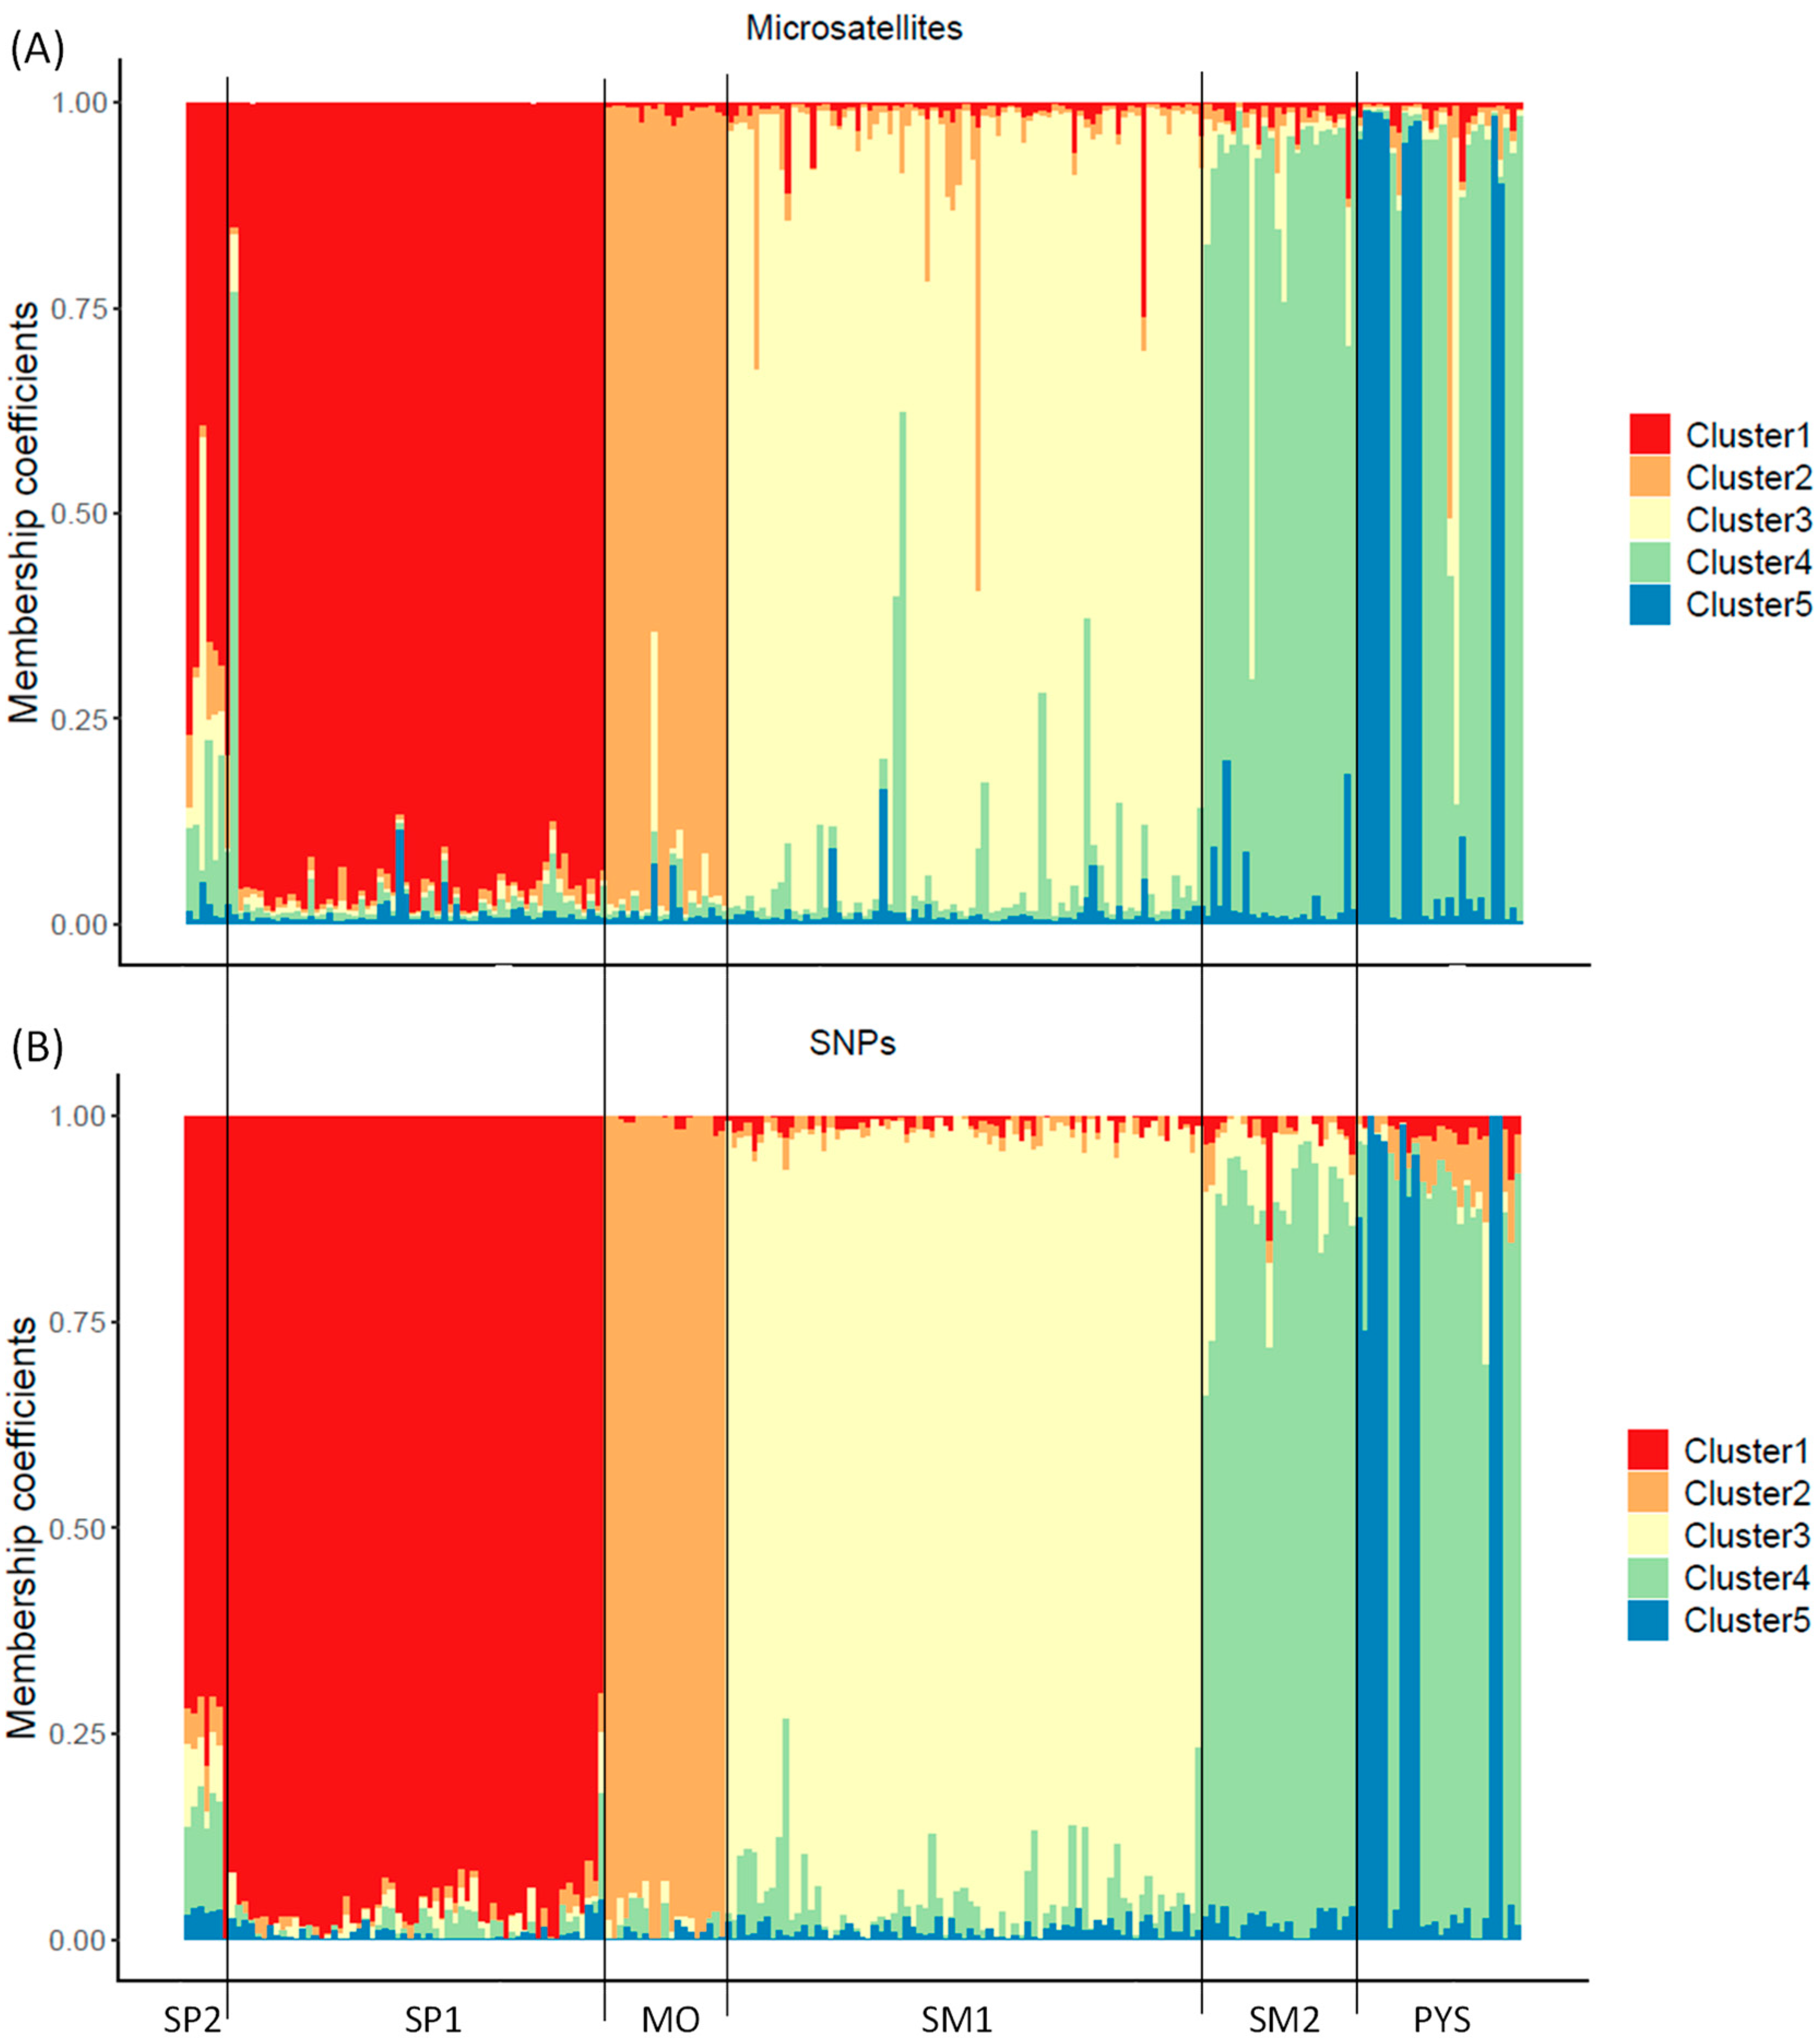
From the Structure analyses, ΔK showed that K = 2 was the most probable number of clusters in the studied populations (highest ΔK; Figure S3A). However, for the SNP assay, the cross-entropy results showed that K = 5 was the most probable number of genetic clusters (lowest cross-entropy; Figure S3B). Despite the Structure analyses with microsatellites not resulting in K = 5 as the most probable number of clusters, the membership coefficients (qi) were similar to the ancestry coefficients obtained with SNPs (Figure 4 and Figure S4). Similar results with both genetic markers were also obtained for K = 2 (Figures S5 and S6). However, intrapopulation membership/ancestry coefficients had higher variation for microsatellites than for SNP markers: individuals with similar ancestry coefficients (SNP analysis) had different membership coefficients (microsatellite analysis), mainly at intermediate values (Figures S4 and S6).
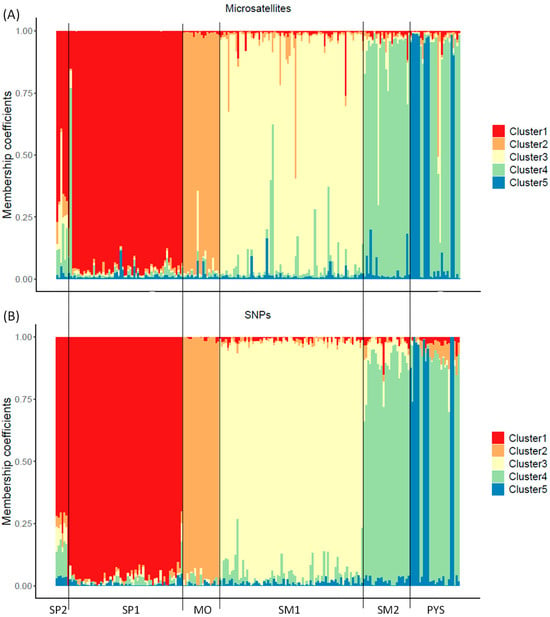
Figure 4.
Membership/ancestry coefficients obtained with microsatellite (A) and SNP markers (B) for K = 5 in red deer populations. Each individual is represented by a thin vertical line, which is portioned into 5 segments with different colors representing the individual’s estimated membership fraction in K clusters. SP2: Sierra de San Pedro 2. SP1: Sierra de San Pedro 1. MO: Monfragüe National Park. SM1: Sierra Morena 1. SM2: Sierra Morena 2. PYS: southern Pyrenees. Order of populations: west to east (see Figure S1).
3.2. Multilocus Heterozygosity and Inbreeding
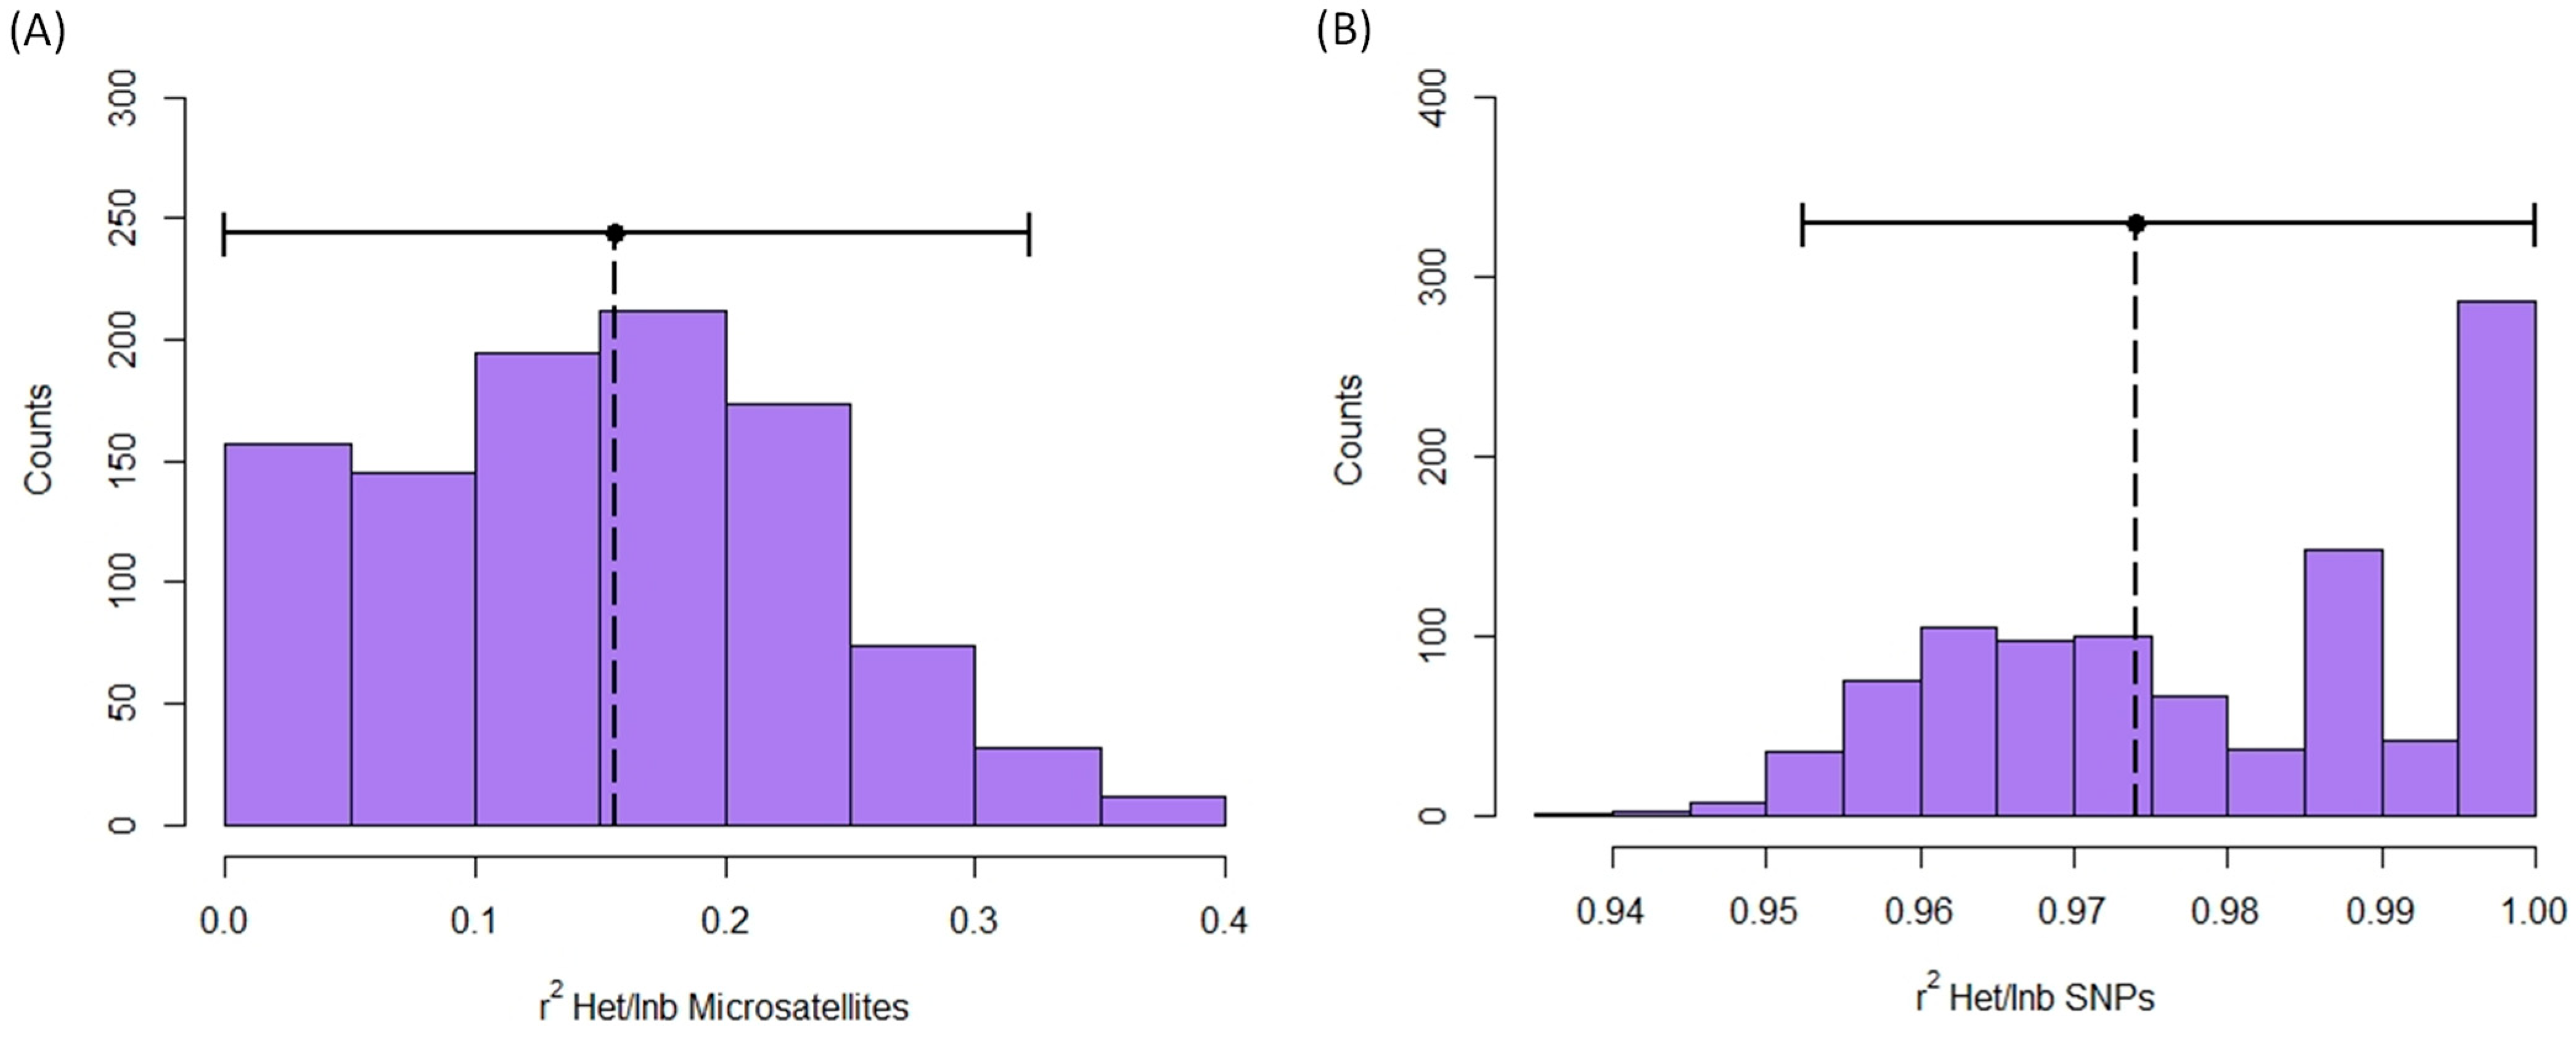
Identity disequilibrium was not significantly different from 0 when it was quantified with microsatellites (g2 = 0.008, S.E. = 0.005, C.I. (5%/95%): −0.002/0.018; Figure S7A). Contrarily, identity disequilibrium with SNPs was significantly greater than 0 (g2 = 0.0049, S.E. = 0.0005, C.I. (2.5%/97.5%): 0.0038/0.0059; Figure S7B). Moreover, the heterozygosity-heterozygosity correlation was only significantly different from 0 for SNPs (microsatellites: HHC = 0.096, S.D. = 0.049, C.I. (5%/95%) = −0.006/0.187, Figure S8A; SNPs: HHC = 0.974, S.D. = 0.003, C.I. = 0.969/0.979, Figure S8B). Finally, the expected r2 between inbreeding level and multilocus heterozygosity (MLH) was only significantly greater than 0 for SNPs (Microsatellites: r2 = 0.164, C.I. = 0.000/0.314, Figure 5A; SNPs: r2 = 0.974, C.I. (5%/95%) = 0.951/1.000, Figure 5B).
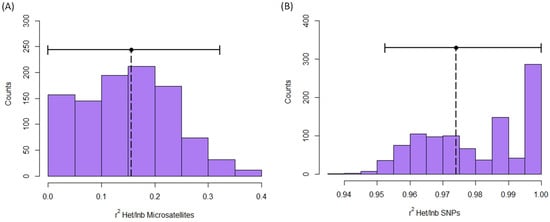
Figure 5.
Expected r2 between inbreeding and multilocus heterozygosity obtained with microsatellites (A) and SNPs (B) in red deer populations. Figure shows the histogram of r2 values in permutations. Observed r2 is represented by a vertical dotted line. Horizontal continuous lines represent the confidence intervals.
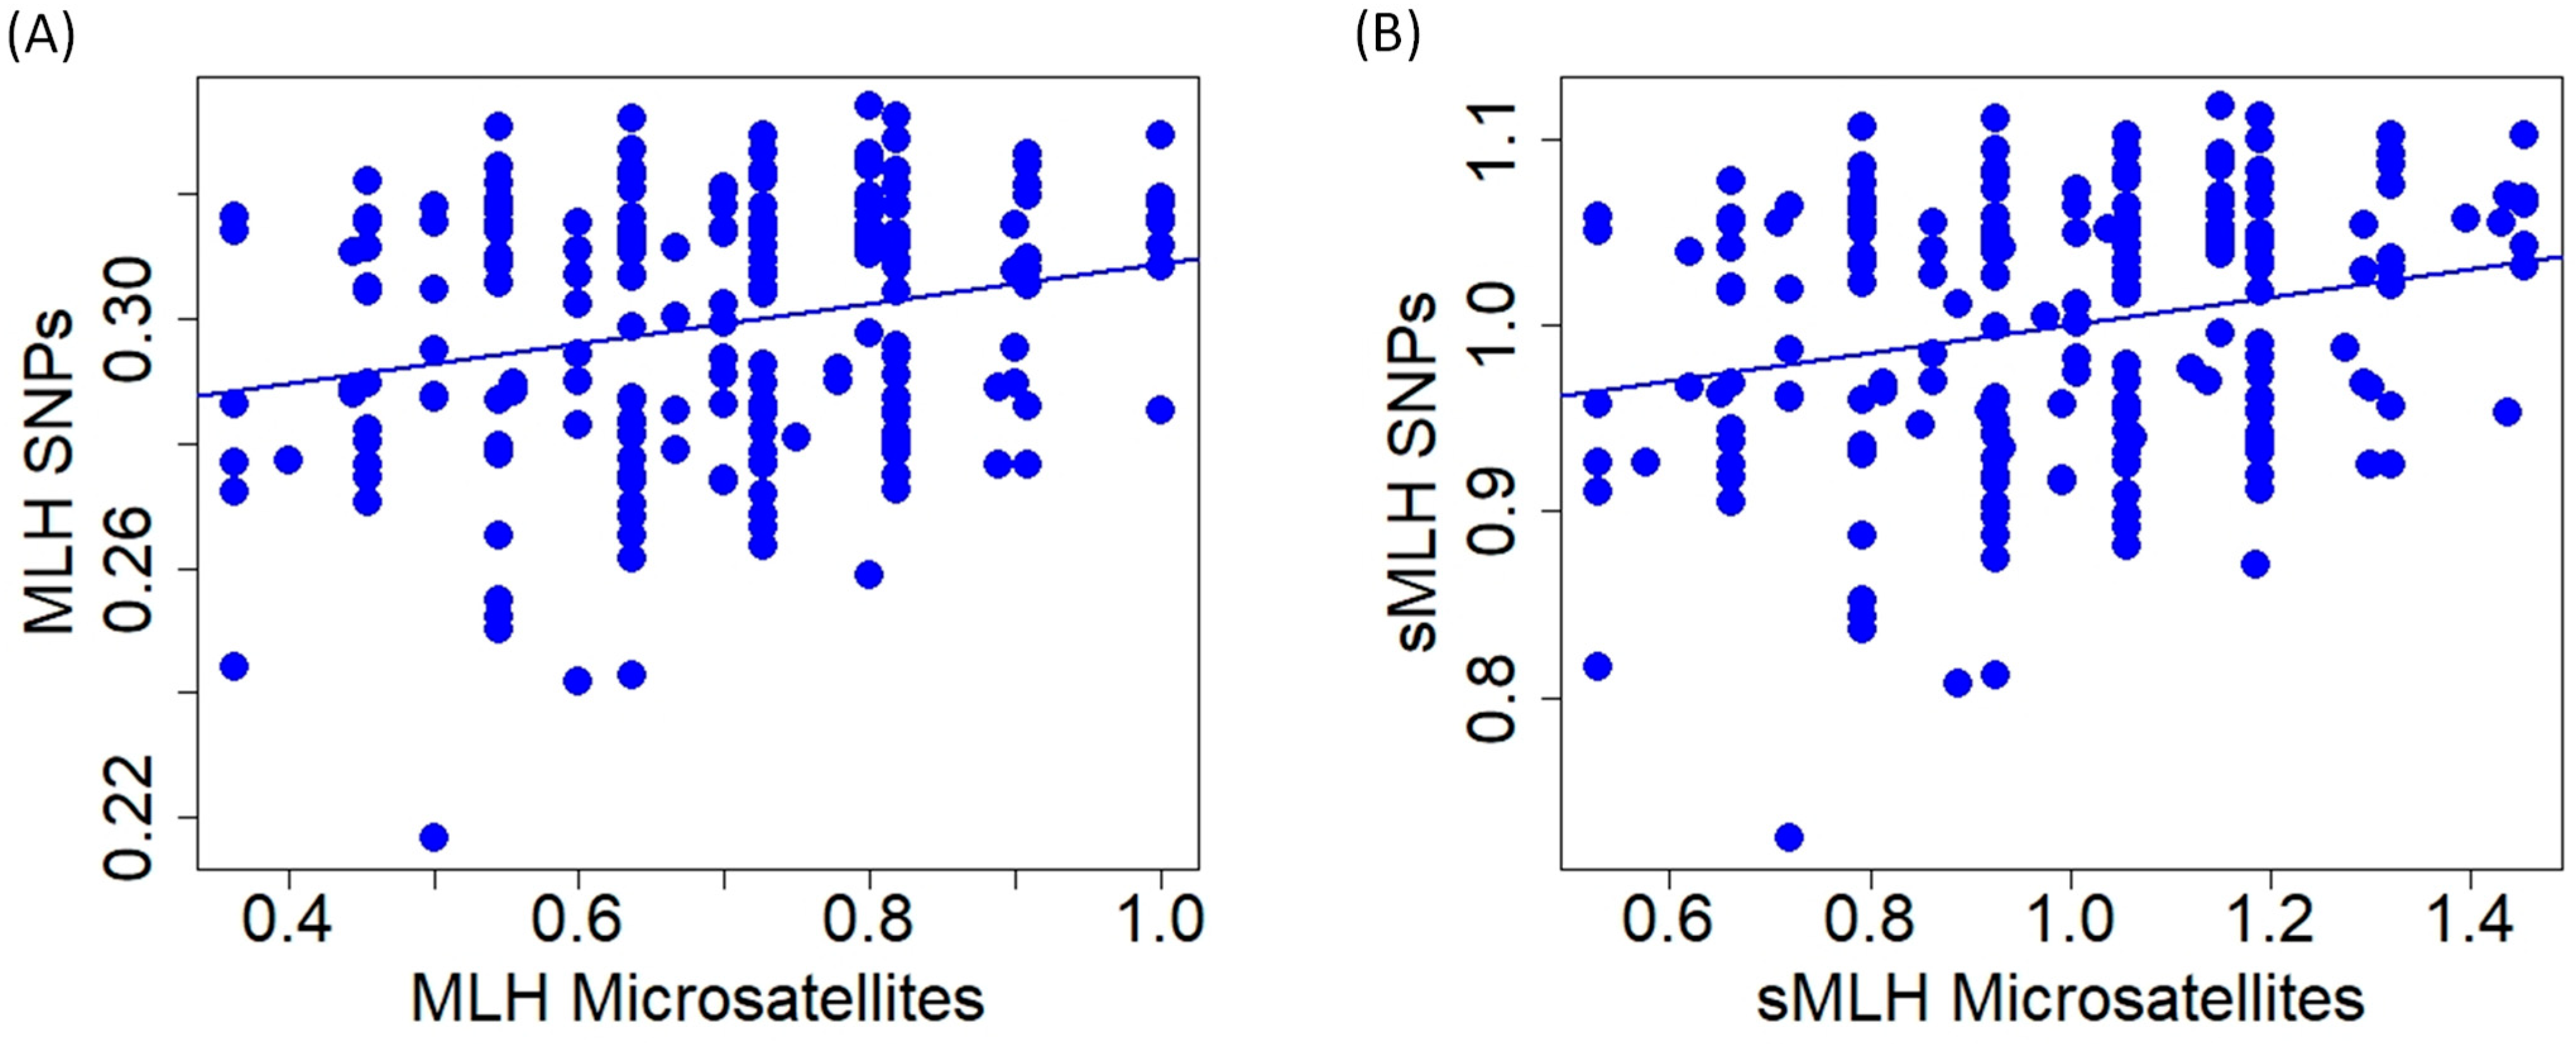
At the individual level, multilocus heterozygosity and standardized multilocus heterozygosity obtained with microsatellites and SNPs were significantly correlated, but relationships show high variability (MLH: r = 0.234, t = 3.480, p < 0.001; sMLH: r = 0.228, t = 3.382, p < 0.001; Figure 6).
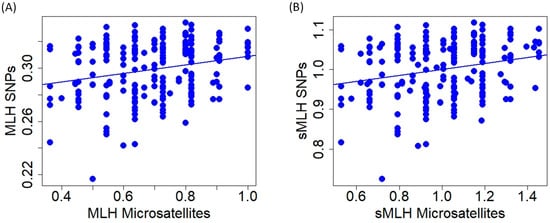
Figure 6.
Relationship of multilocus heterozygosity (A); (MLH) and standardized multilocus heterozygosity (B); (sMLH) of red deer individuals obtained with microsatellite and SNP markers.
4. Discussion
In the case of red deer, we found that the SNPs improved the assessment of specific parameters in relation to microsatellites, particularly in those analyses related to the distribution of genetic diversity across individuals. Nonetheless, our results revealed statistically significant correlations between certain parameters quantified using both types of genetic markers.
In our red deer populations, two parameters related to the genetic structure were correlated when we used microsatellites and SNPs: HE and pairwise FST values. Therefore, microsatellite markers captured the amount of genetic diversity within the studied populations as well as the genetic differentiation among populations. Contrarily, the comparison in HO and FIS quantified with microsatellites and SNPs exhibited low correlation. Accordingly, the limited number of microsatellites might have low precision in detecting how the genetic diversity in the population is distributed across the individuals in our studied red deer populations. Similar correlations between the assessed parameters with both types of markers have been observed in other species, such as the Gunnison sage-grouse (Centrocercus minimus, [33]) and the Atlantic salmon (Salmon salar; [84]). However, studies with similar objectives in other species did not show the same correlations between the estimated parameters (e.g., [23] with Arabidopsis halleri, [85] with Armillaria cepistipes). Therefore, our results indicate that the relationship between the parameters describing the genetic structure of populations obtained with microsatellites and SNPs varies depending on the studied species. Moreover, we cannot rule out the potential impact of sample sizes (number of populations and number of individuals per population), which might differentially affect the correlation of each genetic parameter [24]. In this sense, the small sample size in SP2 might impact the observed correlations. For instance, since HE is sample size dependent, the small sample size might contribute to the low HE in SP2. Therefore, it might affect the low correlations between HO and HE at microsatellites. However, the absence of correlations between genetic measurements obtained with microsatellites and SNPs was not limited to one population (Figure 1A,C).
We found differences in the principal component analysis obtained with both types of markers, indicating high levels of genetic differentiation for SNPs compared to the results with microsatellites. Despite these differences, the percentages of explained variance of PC1 and PC2 were low in both types of markers. The low percentages might be due to the lower capacity to detect population-specific genetic variations of microsatellites and the noise provided by irrelevant SNPs. The genetic differentiation observed in the PCA, obtained with SNPs, was further supported by the admixture analysis conducted using SNPs. The cross-entropy analysis in the admixture procedure identified five clusters as the most likely number of genetic groups. The number of clusters and the membership scores can be readily discerned in the PCA obtained using SNPs. In contrast, with the microsatellites, the genetic structure is less discernible in the PCA plot, and the ΔK procedure applied to the Structure results suggested the existence of a smaller number of clusters. Similar discrepancies in the PCA plots between markers were observed in the Mediterranean tortoise (Testudo hermanni, [86]). Variations in the optimal number of clusters were also detected in amphibians (Hyla molleri and Pelobates cultripes, [87]). Therefore, our findings in red deer support that SNPs can provide additional insights into the genetic substructure of populations. On the other hand, the distribution of membership coefficients across individuals was similar for both microsatellites and SNPs, although the within-population variation of these values was higher when microsatellites were used. This result suggests the existence of risks when using microsatellites for assigning admixture or introduction/translocations of specific individuals in a population (see, e.g., [49,88]). Therefore, there is a clear need to develop approaches that leverage SNP technology to enhance the accuracy and reliability of such analyses.
Concerning the utility of using multilocus heterozygosity at the individual level, we obtained positive values for g2, HFC and expected r2 with inbreeding when microsatellites were used. However, the C.I. of these values included zero. Contrarily, the positive values of these parameters at SNPs did not include zero, even HHC and expected r2 values were close to one. Despite the significant relationship between multilocus heterozygosity in our sample of red deer at both genetic markers, the use of a high number of SNPs represents a clear advantage in the study of inbreeding in natural populations of red deer. Similarly, Miller et al. [89] reported high differences in the estimates of g2 and r2 between small numbers of microsatellites and a large number of SNPs. Thus, despite the existence of studies that have detected HFCs with microsatellites in red deer [44,45], the utilization of SNPs holds great potential in the investigation of processes related to inbreeding in natural populations. These advantages in detecting HFC and inbreeding-related processes are expected under all the hypotheses that explain the relationship between heterozygosity and fitness [90].
5. Conclusions
The results regarding the genetic structure of populations and the multilocus heterozygosity of the individuals, obtained with microsatellite markers, generally correlated with those obtained using SNPs. Despite the heterogeneous sample sizes and the limited number of red deer populations, microsatellites provided insights into the overall genetic status and the existence of population processes in red deer. Nevertheless, the greater precision in inferring genetic structure and the increased power to detect HFCs encourage scientists and wildlife managers to use SNPs wherever possible. In our red deer populations, the utilization of SNPs revealed patterns that were not apparent in the analyses conducted with microsatellites. Moreover, SNP technology holds high potential for detecting inbreeding events in a species like red deer, which has important ecological, health, and economic implications.
Supplementary Materials
The following supporting information can be downloaded at: https://www.mdpi.com/article/10.3390/ani13213374/s1, Figure S1: Locations of red deer populations in Spain; Table S1: Description of 11 microsatellite markers used for genotyping red deer in this study; Figure S2: Relationship between HO and HE for microsatellites and SNPs in red deer populations. Figure S3: Probability of the assessed number of genetic clusters (K) in red deer; Figure S4: Relationship between membership/ancestry coefficients obtained with both microsatellites and SNPs for each of the five clusters in red deer populations; Figure S5: Membership/ancestry coefficients obtained with both microsatellite and SNP markers for K = 2 in six red deer populations; Figure S6: Relationship between membership/ancestry coefficients obtained with both microsatellites and SNPs for the first cluster at K = 2 in six red deer populations; Figure S7: Identity disequilibrium (g2) obtained with microsatellite and SNP markers in red deer populations; Figure S8: Heterozygosity-heterozygosity correlation (HHC) obtained with microsatellites and SNPs in red deer populations.
Author Contributions
Conceptualization, J.P.-G., J.C. and A.M.; Data curation, G.A., A.M., C.B., G.V. and E.d.l.P.; Formal analysis, J.P.-G. and G.A.; Funding acquisition, J.C. and A.M.; Investigation, J.P.-G., J.C., G.A., A.M. and C.B.; Methodology, J.P.-G., G.A., A.M., C.B., G.V. and E.d.l.P.; Project administration, A.M. and J.C.; Supervision, J.C., J.P.-G. and A.M.; Writing—original draft, J.P.-G.; Writing—review and editing, J.C., G.A. and C.B. All authors have read and agreed to the published version of the manuscript.
Funding
Projects UCO-1262830 and P18-RT-4642 (Regional Government of Andalusia and European Union) to JC contributed to financial support.
Institutional Review Board Statement
No animal was harvested for the purpose of this study. All samples were collected from carcasses of individuals hunted during ordinary hunting activities, based on hunting plans approved by autonomous government of Extremadura, Andalusia, and Catalonia (Spain).
Informed Consent Statement
We collected tissue samples from discarded parts of the carcasses that were related to neither the trophy nor the parts used to human consumption. We attended hunted events with permissions from private owners or agencies organizing the event. These hunting events took place in Sierra de San Pedro, Monfragüe National Park, Sierra Morena, and the southern Pyrenees. Informed consent was obtained from all subjects involved in the study.
Data Availability Statement
The data presented in this study are available on request from the corresponding author.
Acknowledgments
We thank Cheyanne Qian and three anonymous reviewers for assistance and comments to the manuscript. Special thanks to all members of Biology and Ethology Unit (University of Extremadura), and UIRCP (University of Córdoba), as well as to the owners of the hunting estates, wildlife managers and the remaining subject involved in hunting activities to provide permissions and facilities for fieldwork.
Conflicts of Interest
The authors declare no conflict of interest.
References
- Biesack, E.E.; Dang, B.T.; Ackiss, A.S.; Bird, C.E.; Chheng, P.; Phounvisouk, L.; Truong, O.T.; Carpenter, K.E. Evidence for population genetic structure in two exploited Mekong River fishes across a natural riverine barrier. J. Fish Biol. 2020, 97, 696–707. [Google Scholar] [CrossRef] [PubMed]
- Baird, H.P.; Moon, K.L.; Janion-Scheepers, C.; Chown, S.L. Springtail phylogeography highlights biosecurity risks of repeated invasions and intraregional transfers among remote islands. Evol. Appl. 2020, 13, 960–973. [Google Scholar] [CrossRef]
- Naito, T.; Nakayama, K.; Takeshima, H.; Hashiguchi, Y.; Akita, T.; Yamasaki, Y.Y.; Mishina, T.; Takeshita, N.; Nagano, A.J.; Takahashi, H. The detailed population genetic structure of the rare endangered latid fish akame Lates japonicus with extremely low genetic diversity revealed from single-nucleotide polymorphisms. Conserv. Genet. 2023, 24, 523–535. [Google Scholar] [CrossRef]
- Allen, T.; Murray, K.A.; Zambrana-Torrelio, C.; Morse, S.S.; Rondinini, C.; Di Marco, M.; Breit, N.; Olival, K.J.; Daszak, P. Global hotspots and correlates of emerging zoonotic diseases. Nat. Commun. 2017, 8, 1124. [Google Scholar] [CrossRef] [PubMed]
- Lively, C.M. The effect of host genetic diversity on disease spread. Am. Nat. 2010, 175, E149–E152. [Google Scholar] [CrossRef] [PubMed]
- Milot, E.; Weimerskirch, H.; Bernatchez, L. The seabird paradox: Dispersal, genetic structure and population dynamics in a highly mobile, but philopatric albatross species. Mol. Ecol. 2008, 17, 1658–1673. [Google Scholar] [CrossRef] [PubMed]
- Barbanera, F.; Pergams, O.R.W.; Guerrini, M.; Forcina, G.; Panayides, P.; Dini, F. Genetic consequences of intensive management in game birds. Biol. Conserv. 2010, 143, 1259–1268. [Google Scholar] [CrossRef]
- Frankham, R. Challenges and opportunities of genetic approaches to biological conservation. Biol. Conserv. 2010, 143, 1919–1927. [Google Scholar] [CrossRef]
- Morgan, R.P.; Kazyak, D.C.; King, T.L.; Lubinski, B.A.; Sell, M.T.; Heft, A.A.; Jones, J.W. Genetic Structure of Maryland Brook Trout Populations: Management Implications for a Threatened Species. N. Am. J. Fish. Manag. 2021, 41, 1097–1119. [Google Scholar] [CrossRef]
- Kaya, S.; Kabasakal, B.; Erdogan, A. Geographic Genetic Structure of Alectoris chukar in Türkiye: Post-LGM-Induced Hybridization-Mediated Contaminations. Biology 2023, 12, 401. [Google Scholar] [CrossRef]
- Olsen, M.T.; Andersen, L.W.; Dietz, R.; Teilmann, J.; Härkönen, T.; Siegismund, H.R. Integrating genetic data and population viability analyses for the identification of harbour seal (Phoca vitulina) populations and management units. Mol. Ecol. 2014, 23, 815–831. [Google Scholar] [CrossRef]
- Sharma, S.; Dutta, T.; Maldonado, J.E.; Wood, T.C.; Panwar, H.S.; Seidensticker, J. Forest corridors maintain historical gene flow in a tiger metapopulation in the highlands of central India. Proc. R. Soc. B Biol. Sci. 2013, 280, 20131506. [Google Scholar] [CrossRef] [PubMed]
- Weeks, A.R.; Sgro, C.M.; Young, A.G.; Frankham, R.; Mitchell, N.J.; Miller, K.A.; Byrne, M.; Coates, D.J.; Eldridge, M.D.; Sunnucks, P.; et al. Assessing the benefits and risks of translocations in changing environments: A genetic perspective. Evol. Appl. 2011, 11, 709–725. [Google Scholar] [CrossRef] [PubMed]
- Frankham, R. Genetics and extinction. Biol. Conserv. 2005, 126, 131–140. [Google Scholar] [CrossRef]
- Amos, W.; Acevedo-Whitehouse, K. A new test for genotype-fitness associations reveals a single microsatellite allele that strongly predicts the nature of tuberculosis infections in wild boar. Mol. Ecol. Resour. 2009, 9, 1102–1111. [Google Scholar] [CrossRef] [PubMed]
- Ruiz-López, M.J.; Gañan, N.; Godoy, J.A.; Del Olmo, A.; Garde, J.; Espeso, G.; Vargas, A.; Martinez, F.; Roldán, E.R.S.; Gomendio, M. Heterozygosity-fitness correlations and inbreeding depression in two critically endangered mammals. Conserv. Biol. 2012, 26, 1121–1129. [Google Scholar] [CrossRef]
- Beebee, T.J.C. Conservation genetics of amphibians. Heredity 2005, 95, 423–427. [Google Scholar] [CrossRef]
- Selkoe, K.A.; Toonen, R.J. Microsatellites for ecologists: A practical guide to using and evaluating microsatellite markers. Ecol. Lett. 2006, 9, 615–629. [Google Scholar] [CrossRef]
- Forstmeier, W.; Schielzeth, H.; Mueller, J.C.; Elllegren, H.; Kempenaers, B. Heterozygosity-fitness correlations in zebra finches: Microsatellite markers can be better than their reputation. Mol. Ecol. 2012, 21, 3237–3249. [Google Scholar] [CrossRef]
- Nussey, D.H.; Cotlman, D.W.; Coulson, T.; Kruuk, L.E.B.; Donald, A.; Morris, S.J.; Clutton-Brock, T.H.; Pemberton, J. Rapidly declining fine-scale spatial genetic structure in female red deer. Mol. Ecol. 2005, 14, 3395–3405. [Google Scholar] [CrossRef]
- Estoup, A.; Jarne, P.; Cornuet, J.-M. Homoplasy and mutation model at microsatellite loci and their consequences for population genetics analysis. Mol. Ecol. 2002, 11, 1591–1604. [Google Scholar] [CrossRef]
- Hoffman, J.I.; Amos, W. Microsatellite genotyping errors: Detection approaches, common sources and consequences for paternal exclusion. Mol. Ecol. 2004, 14, 599–612. [Google Scholar] [CrossRef] [PubMed]
- Fischer, M.C.; Rellstab, C.; Leuzinger, M.; Roumet, M.; Gugerli, F.; Shimizu, K.K.; Holderegger, R.; Widmer, A. Estimating genomic diversity and population differentiation—An empirical comparison of microsatellite and SNP variation in Arabidopsis halleri. BMC Genom. 2017, 18, 69. [Google Scholar] [CrossRef] [PubMed]
- Landguth, E.L.; Fedy, B.C.; Oyler-McCance, S.J.; Garey, A.L.; Emel, S.L.; Mumma, M.; Wagner, H.H.; Fortin, M.; Cushman, S.A. Effects of sample size, number of markers, and allelic richness on the detection of spatial genetic pattern. Mol. Ecol. Resour. 2012, 12, 276–284. [Google Scholar] [CrossRef]
- Coltman, D.W.; Slate, J. Microsatellite measures of inbreeding: A meta-analysis. Evolution 2003, 57, 971–983. [Google Scholar] [CrossRef] [PubMed]
- Balloux, F.; Amos, W.; Coulson, T. Does heterozygosity estimate inbreeding in real populations? Mol. Ecol. 2004, 13, 3021–3031. [Google Scholar] [CrossRef] [PubMed]
- Brumfield, R.T.; Beerli, P.; Nickerson, D.A.; Edwards, S.V. The utility of single nucleotide polymorphisms in inferences of population history. Trends Ecol. Evol. 2003, 18, 249–256. [Google Scholar] [CrossRef]
- Msalya, G.; Kim, E.-S.; Laisser, E.L.K.; Kipanyula, M.J.; Karimuribo, E.D.; Kusiluka, L.J.M.; Chenyambuga, S.W.; Rothschild, M.F. Determination of genetic structure and signatures of selection in three strains of Tanzania shorthorn zebu, boran and friesian cattle by genome-wide SNP analyses. PLoS ONE 2017, 12, e0171088. [Google Scholar] [CrossRef]
- Liu, Q.; Lin, H.; Chen, J.; Ma, J.; Liu, R.; Ding, S. Genetic variation and population genetic structure of the large yellow croaker (Larimichthys crocea) based on genome-wide single nucleotide polymorphisms in farmed and wild populations. Fish. Res. 2020, 232, 105718. [Google Scholar] [CrossRef]
- Guichoux, E.; Lagache, L.; Wagner, S.; Chaumeil, P.; Leger, P.; Lepais, O.; Lepoittevin, C.; Malausa, T.; Revardel, E.; Salin, F.; et al. Current trends in microsatellite genotyping. Mol. Ecol. Resour. 2011, 11, 591–611. [Google Scholar] [CrossRef]
- Davey, J.W.; Hohenlohe, P.A.; Etter, P.D.; Boone, J.Q.; Catchen, J.M.; Blaxter, M.L. Genome-wide genetic marker discovery and genotyping using next-generation sequencing. Nat. Rev. Genet. 2011, 12, 499–510. [Google Scholar] [CrossRef] [PubMed]
- Schlötterer, C.; Tobler, R.; Kofler, R.; Nolte, V. Sequencing pools of individuals—Mining genome-wide polymorphism data without big funding. Nat. Rev. Genet. 2014, 15, 749–763. [Google Scholar] [CrossRef] [PubMed]
- Zimmerman, S.J.; Aldridge, C.L.; Oyler-McCance, S.J. An empirical comparison of population genetic analyses using microsatellite and SNP data for a species of conservation concern. BMC Genom. 2020, 21, 382. [Google Scholar] [CrossRef] [PubMed]
- Fernández, M.E.; Goszczynski, D.E.; Lirón, J.P.; Villegas-Castagnasso, E.E.; Carino, M.H.; Ripoli, M.V.; Rogberg-Muñoz, A.; Posik, D.M.; Peral-García, P.; Giovambattista, G. Comparison of the effectiveness of microsatellites and SNP panels for genetic identification, traceability and assessment of parentage in an inbred Angus herd. Genet. Mol. Biol. 2013, 36, 185–191. [Google Scholar] [CrossRef] [PubMed]
- Hoffman, J.I.; Simpson, F.; David, P.; Rijks, J.M.; Kuiken, T.; Thorne, M.A.S.; Lacy, R.C.; Dasmahapatra, K.K. High-throughput sequencing reveals inbreeding depression in a natural population. Proc. Natl. Acad. Sci. USA 2014, 111, 3775–3780. [Google Scholar] [CrossRef]
- Apollonio, M.; Andersen, R.; Putman, R. European Ungulates and Their Management in the 21st Century; Cambridge University Press: Cambridge, UK, 2010. [Google Scholar]
- Zachos, F.E.; Hartl, G.B. Phylogeography, population genetics and conservation of the European red deer Cervus elaphus. Mammal Rev. 2011, 41, 138–150. [Google Scholar] [CrossRef]
- Pérez-González, J.; Gort-Esteve, A.; Ruiz-Olmo, J.; Anaya, G.; Broggini, C.; Millán, M.F.; Vedel, G.; de la Peña, E.; Membrillo, A.; Seoane, J.M.; et al. Red deer in the Pyrenees: A risky secondary contact zone for conservation genetics. J. Wildl. Manag. 2023, 87, e22454. [Google Scholar] [CrossRef]
- Iacolina, L.; Corlatti, L.; Buzan, E.; Safner, T.; Šprem, N. Hybridisation in European ungulates: An overview of the current status, causes, and consequences. Mammal Rev. 2019, 49, 45–59. [Google Scholar] [CrossRef]
- Martinez, J.G.; Carranza, J.; Fernandez-Garcia, J.L.; Sanchez-Prieto, C.B. Genetic variation of red deer populations under hunting exploitation in southwestern Spain. J. Wildl. Manag. 2002, 66, 1273. [Google Scholar] [CrossRef]
- Pérez-González, J.; Barbosa, A.M.; Carranza, J.; Torres-Porras, J. Relative effect of food supplementation and natural resources on female red deer distribution in a Mediterranean ecosystem. J. Wildl. Manag. 2010, 74, 1701–1708. [Google Scholar] [CrossRef]
- Pérez-González, J.; Carranza, J. Female-biased dispersal under conditions of low male mating competition in a polygynous mammal. Mol. Ecol. 2009, 18, 4617–4630. [Google Scholar] [CrossRef]
- Torres-Porras, J.; Carranza, J.; Pérez-González, J.; Mateos, C.; Alarcos, S. The tragedy of the commons: Unsustainable population structure of Iberian red deer in hunting estates. Eur. J. Wildl. Res. 2014, 60, 351–357. [Google Scholar] [CrossRef]
- Queirós, J.; Vicente, J.; Alves, P.C.; de la Fuente, J.; Gortazar, C. Tuberculosis, genetic diversity and fitness in the red deer, Cervus elaphus. Infect. Genet. Evol. 2016, 43, 203–212. [Google Scholar] [CrossRef] [PubMed]
- Pérez-González, J.; Carranza, J.; Torres-Porras, J.; Fernández-García, J.L. Low heterozygosity at microsatellite markers in Iberian red deer with small antlers. J. Hered. 2010, 101, 553–561. [Google Scholar] [CrossRef]
- Pérez-González, J.; Frantz, A.C.; Torres-Porras, J.; Castillo, L.; Carranza, J. Population structure, habitat features and genetic structure of managed red deer populations. Eur. J. Wildl. Res. 2012, 58, 933–943. [Google Scholar] [CrossRef]
- Carranza, J.; Salinas, M.; Andrés, D.; Pérez-González, J. Iberian red deer: Paraphyletic nature at mtDNA but nuclear markers support its genetic identity. Ecol. Evol. 2016, 6, 905–922. [Google Scholar] [CrossRef] [PubMed]
- Galarza, J.A.; Sanchez-Fernandez, B.; Fandos, P.; Soriguer, R. The genetic landscape of the Iberian red deer (Cervus elaphus hispanicus) after 30 years of big-game hunting in southern Spain. J. Wildl. Manag. 2015, 79, 500–504. [Google Scholar] [CrossRef]
- Queirós, J.; Gortázar, C.; Alves, P.C. Deciphering anthropogenic effects on the genetic background of the red deer in the Iberian Peninsula. Front. Ecol. Evol. 2020, 8, 147. [Google Scholar] [CrossRef]
- Frantz, A.C.; Hamann, J.-L.; Klein, F. Fine-scale genetic structure of red deer (Cervus elaphus) in a French temperate forest. Eur. J. Wildl. Res. 2008, 54, 44–52. [Google Scholar] [CrossRef]
- Dellicour, S.; Frantz, A.C.; Colyn, M.; Bertouille, S.; Chaumont, F.; Flamand, M.C. Population structure and genetic diversity of red deer (Cervus elaphus) in forest fragments in north-western France. Conserv. Genet. 2011, 12, 1287–1297. [Google Scholar] [CrossRef]
- Frantz, A.C.; Pourtois, J.T.; Heuertz, M.; Schley, L.; Flamand, M.C.; Krier, A.; Bertouille, S.; Chaumont, F.; Burke, T. Genetic structure and assignment tests demonstrate illegal translocation of red deer (Cervus elaphus) into a continuous population. Mol. Ecol. 2006, 15, 3191–3203. [Google Scholar] [CrossRef]
- Frantz, A.C.; Bertouille, S.; Eloy, M.C.; Licoppe, A.; Chaumont, F.; Flamand, M.C. Comparative landscape genetic analyses show a Belgian motorway to be a gene flow barrier for red deer (Cervus elaphus), but not wild boars (Sus scrofa). Mol. Ecol. 2012, 21, 3445–3457. [Google Scholar] [CrossRef] [PubMed]
- Pérez-Espona, S.; Pérez-Barbería, F.J.; Mcleod, J.E.; Jiggins, C.D.; Gordon, I.J.; Pemberton, J.M. Landscape features affect gene flow of Scottish Highland red deer (Cervus elaphus). Mol. Ecol. 2008, 17, 981–996. [Google Scholar] [CrossRef]
- McDevitt, A.D.; Edwards, C.J.; O’Toole, P.; O’Sullivan, P.; O’Reilly, C.; Carden, R.F. Genetic structure of, and hybridisation between, red (Cervus elaphus) and sika (Cervus nippon) deer in Ireland. Mammal Biol. 2009, 74, 263–273. [Google Scholar] [CrossRef]
- Kuehn, R.; Schroeder, W.; Pirchner, F.; Rottmann, O. Genetic diversity, gene flow and drift in Bavarian red deer populations (Cervus elaphus). Conserv. Genet. 2003, 4, 157–166. [Google Scholar] [CrossRef]
- Edelhoff, H.; Zachos, F.E.; Fickel, J.; Epps, C.W.; Balkenhol, N. Genetic analysis of red deer (Cervus elaphus) administrative management units in a human-dominated landscape. Conserv. Genet. 2020, 21, 261–276. [Google Scholar] [CrossRef]
- Nielsen, E.K.; Olesen, C.R.; Pertoldi, C.; Gravlund, P.; Barker, J.S.F.; Mucci, N.; Randi, E.; Loeschcke, V. Genetic structure of the Danish red deer (Cervus elaphus). Biol. J. Linn. Soc. 2008, 95, 688–701. [Google Scholar] [CrossRef][Green Version]
- Niedziałkowska, M.; Jędrzejewska, B.; Wójcik, J.M.; Goodman, S.J. Genetic structure of red deer population in northeastern Poland in relation to the history of human interventions. J. Wildl. Manag. 2012, 76, 1264–1276. [Google Scholar] [CrossRef]
- Höglund, J.; Cortazar-Chinarro, M.; Jarnemo, A.; Thulin, C.-G. Genetic variation and structure in Scandinavian red deer (Cervus elaphus): Influence of ancestry, past hunting, and restoration management. Biol. J. Linn. Soc. 2013, 109, 43–53. [Google Scholar] [CrossRef]
- Haanes, H.; Røed, K.H.; Mysterud, A.; Langvatn, R.; Rosef, O. Consequences for genetic diversity and population performance of introducing continental red deer into the northern distribution range. Conserv. Genet. 2010, 11, 1653–1665. [Google Scholar] [CrossRef]
- Krojerová-Prokešová, J.; Barančeková, M.; Koubek, P. Admixture of Eastern and Western European red deer lineages as a result of postglacial recolonization of the Czech Republic (Central Europe). J. Hered. 2015, 106, 375–385. [Google Scholar] [CrossRef]
- Frank, K.; Szepesi, K.; Bleier, N.; Sugár, L.; Kusza, S.; Barta, E.; Horn, P.; Orosz, L.; Stéger, V. Genetic traces of dispersal and admixture in red deer (Cervus elaphus) populations from the Carpathian Basin. Eur. J. Wildl. Res. 2022, 68, 55. [Google Scholar] [CrossRef]
- Šprem, N.; Frantz, A.C.; Cubric-Curik, V.; Safner, T.; Curik, I. Influence of habitat fragmentation on population structure of red deer in Croatia. Mammal Biol. 2013, 78, 290–295. [Google Scholar] [CrossRef]
- Hmwe, S.S.; Zachos, F.E.; Eckert, I.; Lorenzini, R.; Fico, R.; Hartl, G.B. Conservation genetics of the endangered red deer from Sardinia and Mesola with further remarks on the phylogeography of Cervus elaphus corsicanus. Biol. J. Linn. Soc. 2006, 88, 691–701. [Google Scholar] [CrossRef]
- Karaiskou, N.; Tsakogiannis, A.; Gkagkavouzis, K.; Papika, S.; Latsoudis, P.; Kavakiotis, I.; Pantis, J.; Abatzopoulos, T.J.; Triantaphyllidis, C.; Triantafyllidis, A. Greece: A Balkan Subrefuge for a Remnant Red Deer (Cervus elaphus) Population. J. Hered. 2014, 105, 334–344. [Google Scholar] [CrossRef]
- Zachos, F.E.; Frantz, A.C.; Kuehn, R.; Bertouille, S.; Colyn, M.; Niedziałkowska, M.; Pérez-González, J.; Skog, A.; Sprěm, N.; Flamand, M.-C. Genetic structure and effective population sizes in European red deer (Cervus elaphus) at a continental scale: Insights from microsatellite DNA. J. Hered. 2016, 107, 318–326. [Google Scholar] [CrossRef] [PubMed]
- Raymond, M.; Rousset, F. GENEPOP (Version 1.2): Population Genetics Software for Exact Tests and Ecumenicism. J. Hered. 1995, 86, 248–249. [Google Scholar] [CrossRef]
- Van Oosterhout, C.; Hutchinson, W.F.; Wills, D.P.M.; Shipley, P. micro-checker: Software for identifying and correcting genotyping errors in microsatellite data. Mol. Ecol. Notes 2004, 4, 535–538. [Google Scholar] [CrossRef]
- Brauning, R.; Fisher, P.J.; McCullock, A.F.; Smithies, R.J.; Ward, J.F.; Bixley, M.J.; Lawley, C.T.; Rowe, S.J.; McEwan, J.C. Utilization of high throughput genome sequencing technology for large scale single nucleotide polymorphism discovery in red deer and Canadian elk. bioRxiv 2015. [Google Scholar] [CrossRef]
- Kasarda, R.; Moravčíková, N.; Trakovická, A.; Krupová, Z.; Ondrej, K. Genomic variation across cervid species in respect to the estimation of red deer diversity. Acta Vet. 2017, 67, 43–56. [Google Scholar] [CrossRef]
- Purcell, S.; Neale, B.; Todd-Brown, K.; Thomas, L.; Ferreira, M.A.R.; Bender, D.; Maller, J.; Sklar, P.; de Bakker, P.I.W.; Daly, M.J.; et al. PLINK: A Tool dor Whole-Genome Association and Population-Based Linkage Analyses. Am. J. Hum. Gen. 2007, 81, 559–575. [Google Scholar] [CrossRef] [PubMed]
- Pemberton, J.; Johnston, S.E.; Fletcher, T.J. The genome sequence of the red deer, Cervus elaphus Linnaeus 1758. Wellcome Open Res. 2021, 6, 336. [Google Scholar] [CrossRef]
- Belkhir, K. GENETIX, version 4.05. Logiciel sous Windows TM Pour la Génétique des Populations. University of Montperllier II: Montpellier, France, 2004.
- Gruber, B.; Unmack, P.J.; Berry, O.F.; Georges, A. Dartr: An r package to facilitate analysis of SNP data generated from reduced representation genome sequencing. Mol. Ecol. Resour. 2018, 18, 691–699. [Google Scholar] [CrossRef] [PubMed]
- R Core Team. R: A Language and Environment for Statistical Computing; R Foundation for Statistical Computing: Vienna, Austria, 2021; Available online: https://www.R-project.org (accessed on 30 November 2022).
- Dixon, P. VEGAN, a package of R functions for community ecology. J. Veg. Sci. 2003, 14, 927–930. [Google Scholar] [CrossRef]
- Jombart, T. ADEGENET: A R package for the multivariate analysis of genetic markers. Bioinformatics 2008, 24, 1403–1405. [Google Scholar] [CrossRef] [PubMed]
- Pritchard, J.K.; Stephens, M.; Donnelly, P. Inference of population structure using multilocus genotype data. Genetics 2000, 155, 945–959. [Google Scholar] [CrossRef] [PubMed]
- Earl, D.A.; VonHoldt, B.M. STRUCTURE HARVESTER: A website and program for visualizing STRUCTURE output and implementing the Evanno method. Conserv. Genet. Resour. 2012, 4, 359–361. [Google Scholar] [CrossRef]
- Evanno, G.; Regnaut, S.; Goudet, J. Detecting the number of clusters of individuals using the software structure: A simulation study. Mol. Ecol. 2005, 14, 2611–2620. [Google Scholar] [CrossRef]
- Frichot, E.; François, O. LEA: An R package for landscape and ecological association studies. Methods Ecol. Evol. 2015, 6, 925–929. [Google Scholar] [CrossRef]
- Stoffel, M.A.; Esser, M.; Kardos, M.; Humble, E.; Nichols, H.; David, P.; Hoffman, J.I. inbreedR: An R package for the analysis of inbreeding based on genetic markers. Methods Ecol. Evol. 2016, 7, 1331–1339. [Google Scholar] [CrossRef]
- Glover, K.A.; Hansen, M.M.; Lien, S.; Als, T.D.; Høyheim, B.; Skaala, Ø. A comparison of SNP and STR loci for delineating population structure and performing individual genetic assignment. BMC Genet. 2010, 11, 2. [Google Scholar] [CrossRef] [PubMed]
- Tsykun, T.; Rellstab, C.; Dutech, C.; Sipos, G.; Prospero, S. Comparative assessment of SSR and SNP markers for inferring the population genetic structure of the common fungus Armillaria cepistipes. Heredity 2017, 119, 371–380. [Google Scholar] [CrossRef] [PubMed]
- Biello, R.; Zampiglia, M.; Fuselli, S.; Fabbri, G.; Bisconti, R.; Chiocchio, A.; Mazzotti, S.; Trucchi, E.; Canestrelli, D.; Bertorelle, G. From STRs to SNPs via ddRAD-seq: Geographic assignment of confiscated tortoises at reduced costs. Evol. Appl. 2022, 15, 1344–1359. [Google Scholar] [CrossRef]
- Camacho-Sanchez, M.; Velo-Antón, G.; Hanson, J.O.; Veríssimo, A.; Martínez-Solano, Í.; Marques, A.; Moritz, C.; Carvalho, S.B. Comparative assessment of range-wide patterns of genetic diversity and structure with SNPs and microsatellites: A case study with Iberian amphibians. Ecol. Evol. 2020, 10, 10353–10363. [Google Scholar] [CrossRef]
- Carranza, J.; Martínez, J.G.; Sánchez-Prieto, C.B.; Fernández-García, J.L.; Sánchez-Fernández, B.; Álvarez-Álvarez, R.; Valencia, J.; Alarcos, S. Game species: Extinction hidden by census numbers. Anim. Biodivers. Conserv. 2003, 26, 81–84. [Google Scholar]
- Miller, J.M.; Malenfant, R.M.; David, P.; Davis, C.S.; Poissant, J.; Hogg, J.T.; Festa-Bianchet, M.; Coltman, D.W. Estimating genome-wide heterozygosity: Effects of demographic history and marker type. Heredity 2014, 112, 240–247. [Google Scholar] [CrossRef] [PubMed]
- Hansson, B.; Westerberg, L. On the correlation between heterozygosity and fitness in natural populations. Mol. Ecol. 2002, 11, 2467–2474. [Google Scholar] [CrossRef]
Disclaimer/Publisher’s Note: The statements, opinions and data contained in all publications are solely those of the individual author(s) and contributor(s) and not of MDPI and/or the editor(s). MDPI and/or the editor(s) disclaim responsibility for any injury to people or property resulting from any ideas, methods, instructions or products referred to in the content. |
© 2023 by the authors. Licensee MDPI, Basel, Switzerland. This article is an open access article distributed under the terms and conditions of the Creative Commons Attribution (CC BY) license (https://creativecommons.org/licenses/by/4.0/).


