
Timing Differences in Stride Cycle Phases in Retired Racehorses Ridden in Rising and Two-Point Seat Positions at Trot on Turf, Artificial and Tarmac Surfaces


Abstract
Simple Summary
Abstract
1. Introduction
2. Materials and Methods
2.1. Ethics
2.2. Horse and Rider Participants
2.3. Equipment
2.4. Trial Conditions
2.5. Statistics
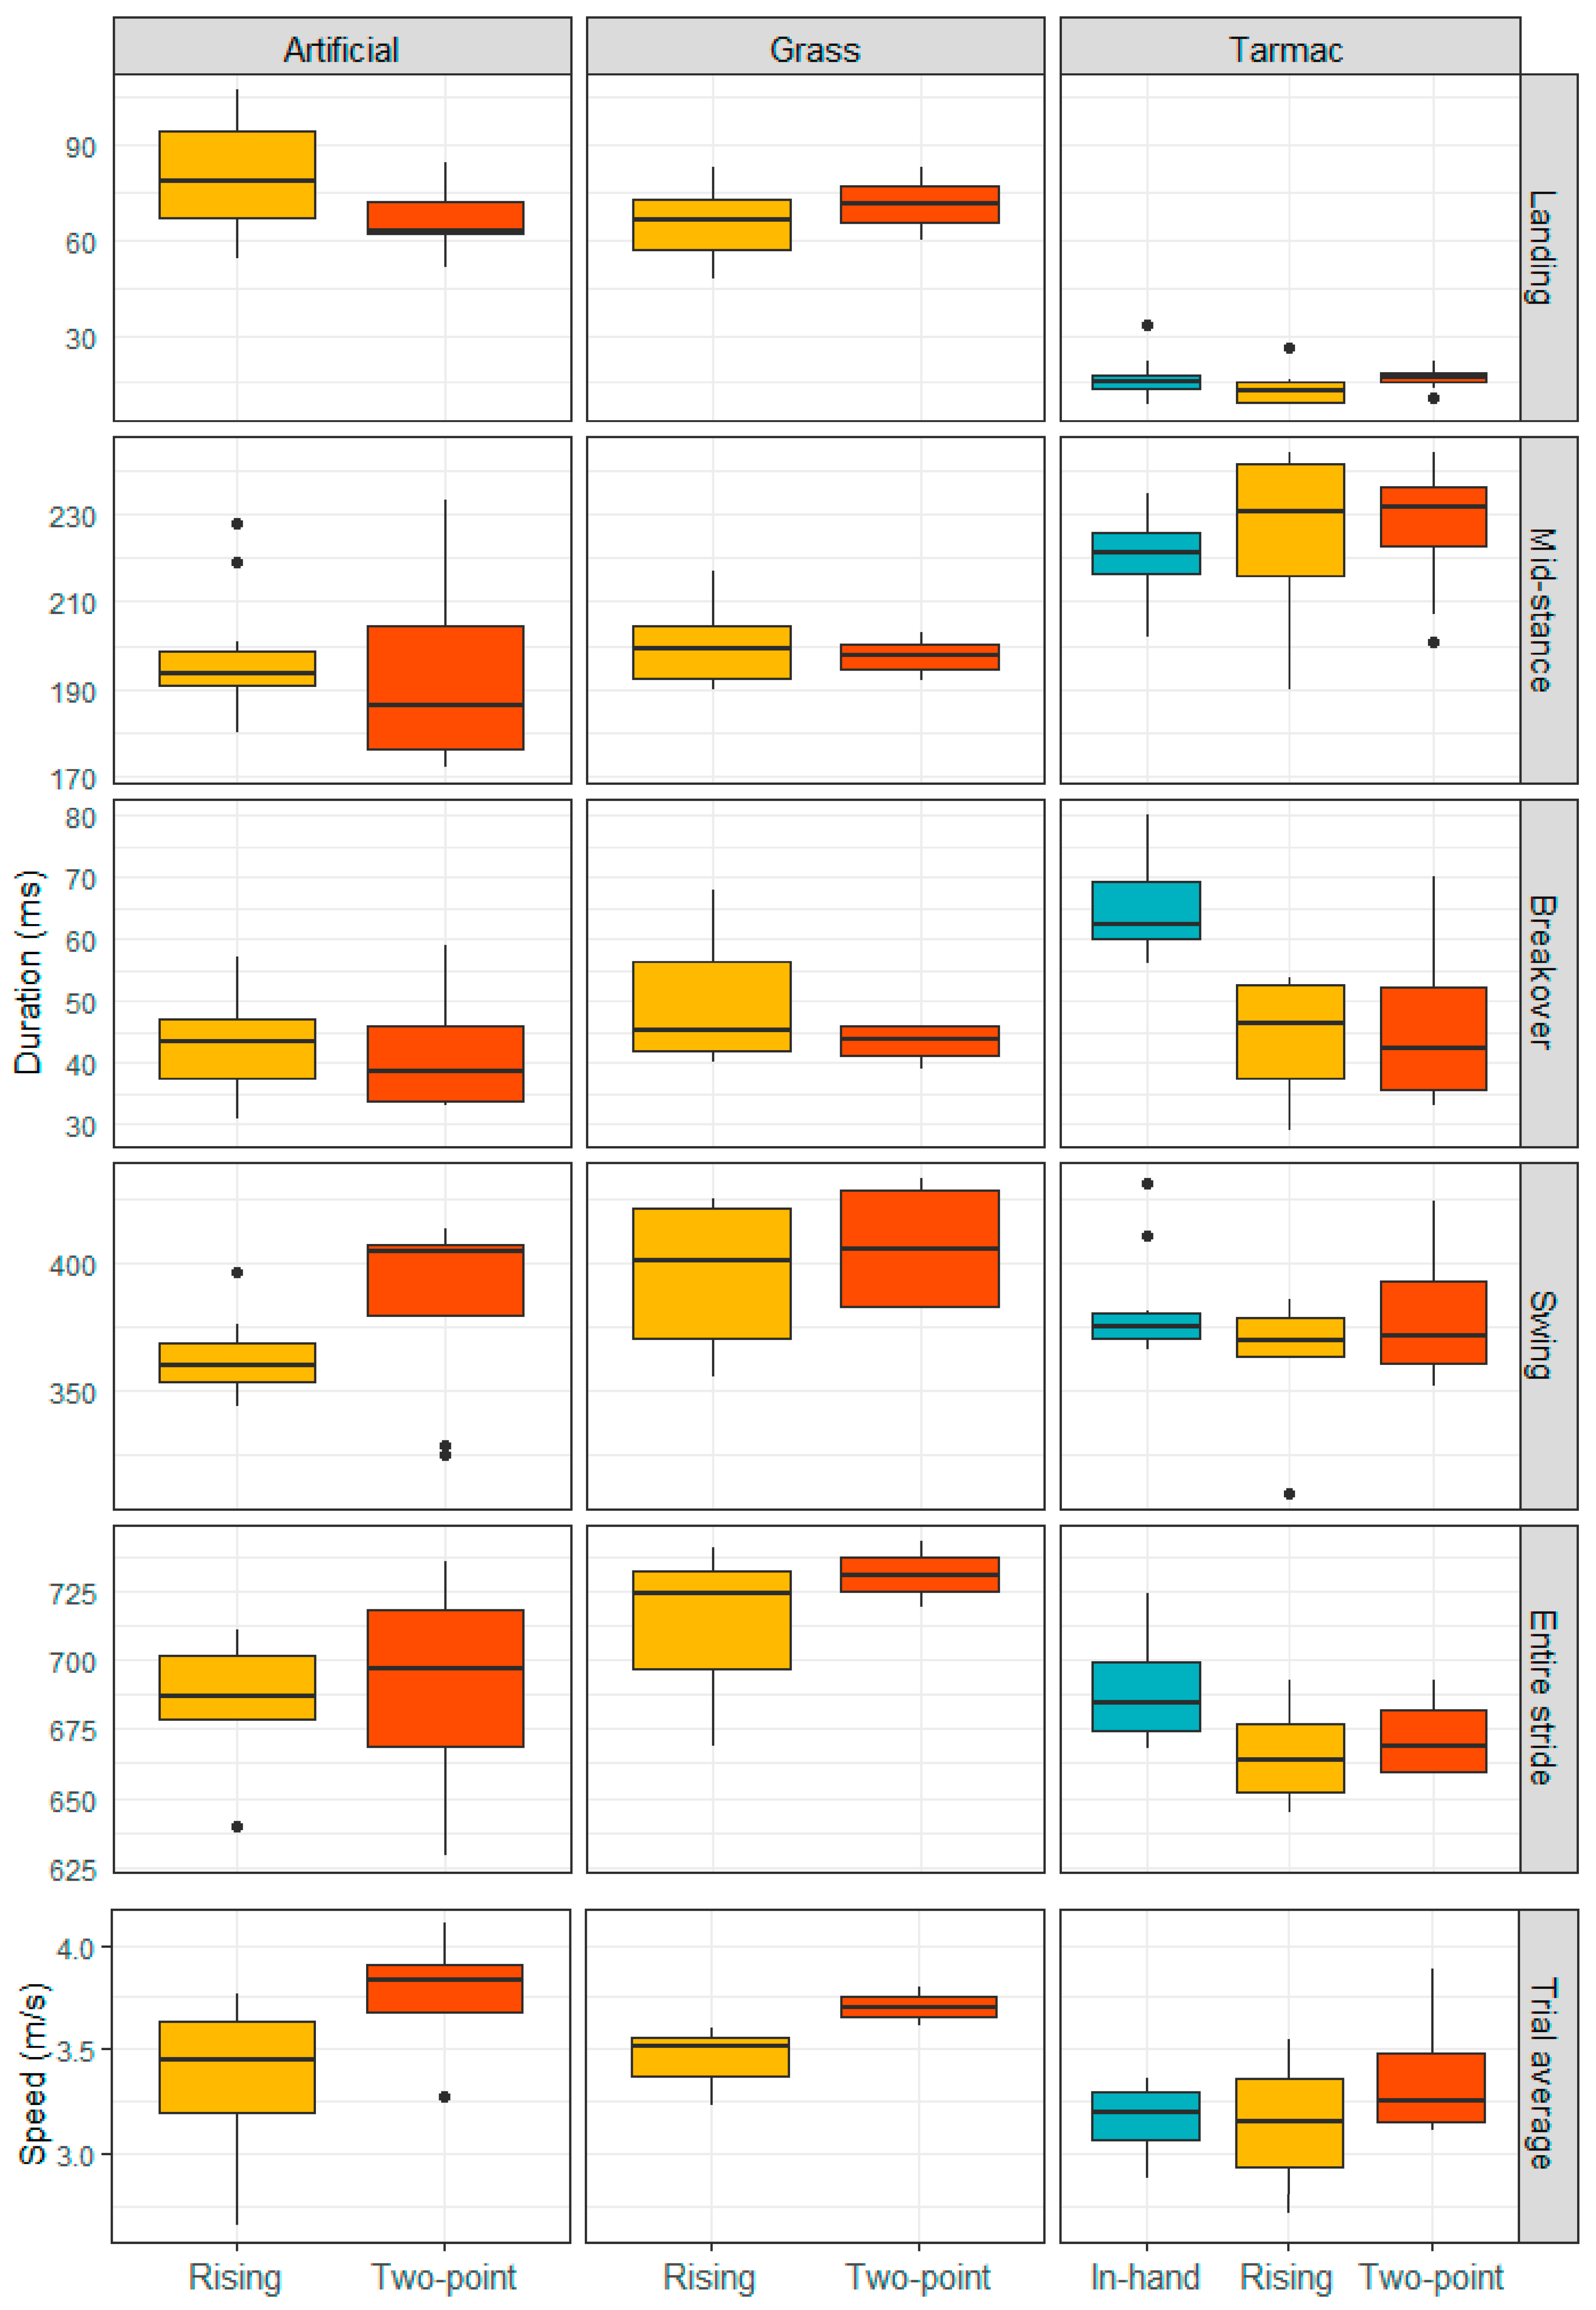
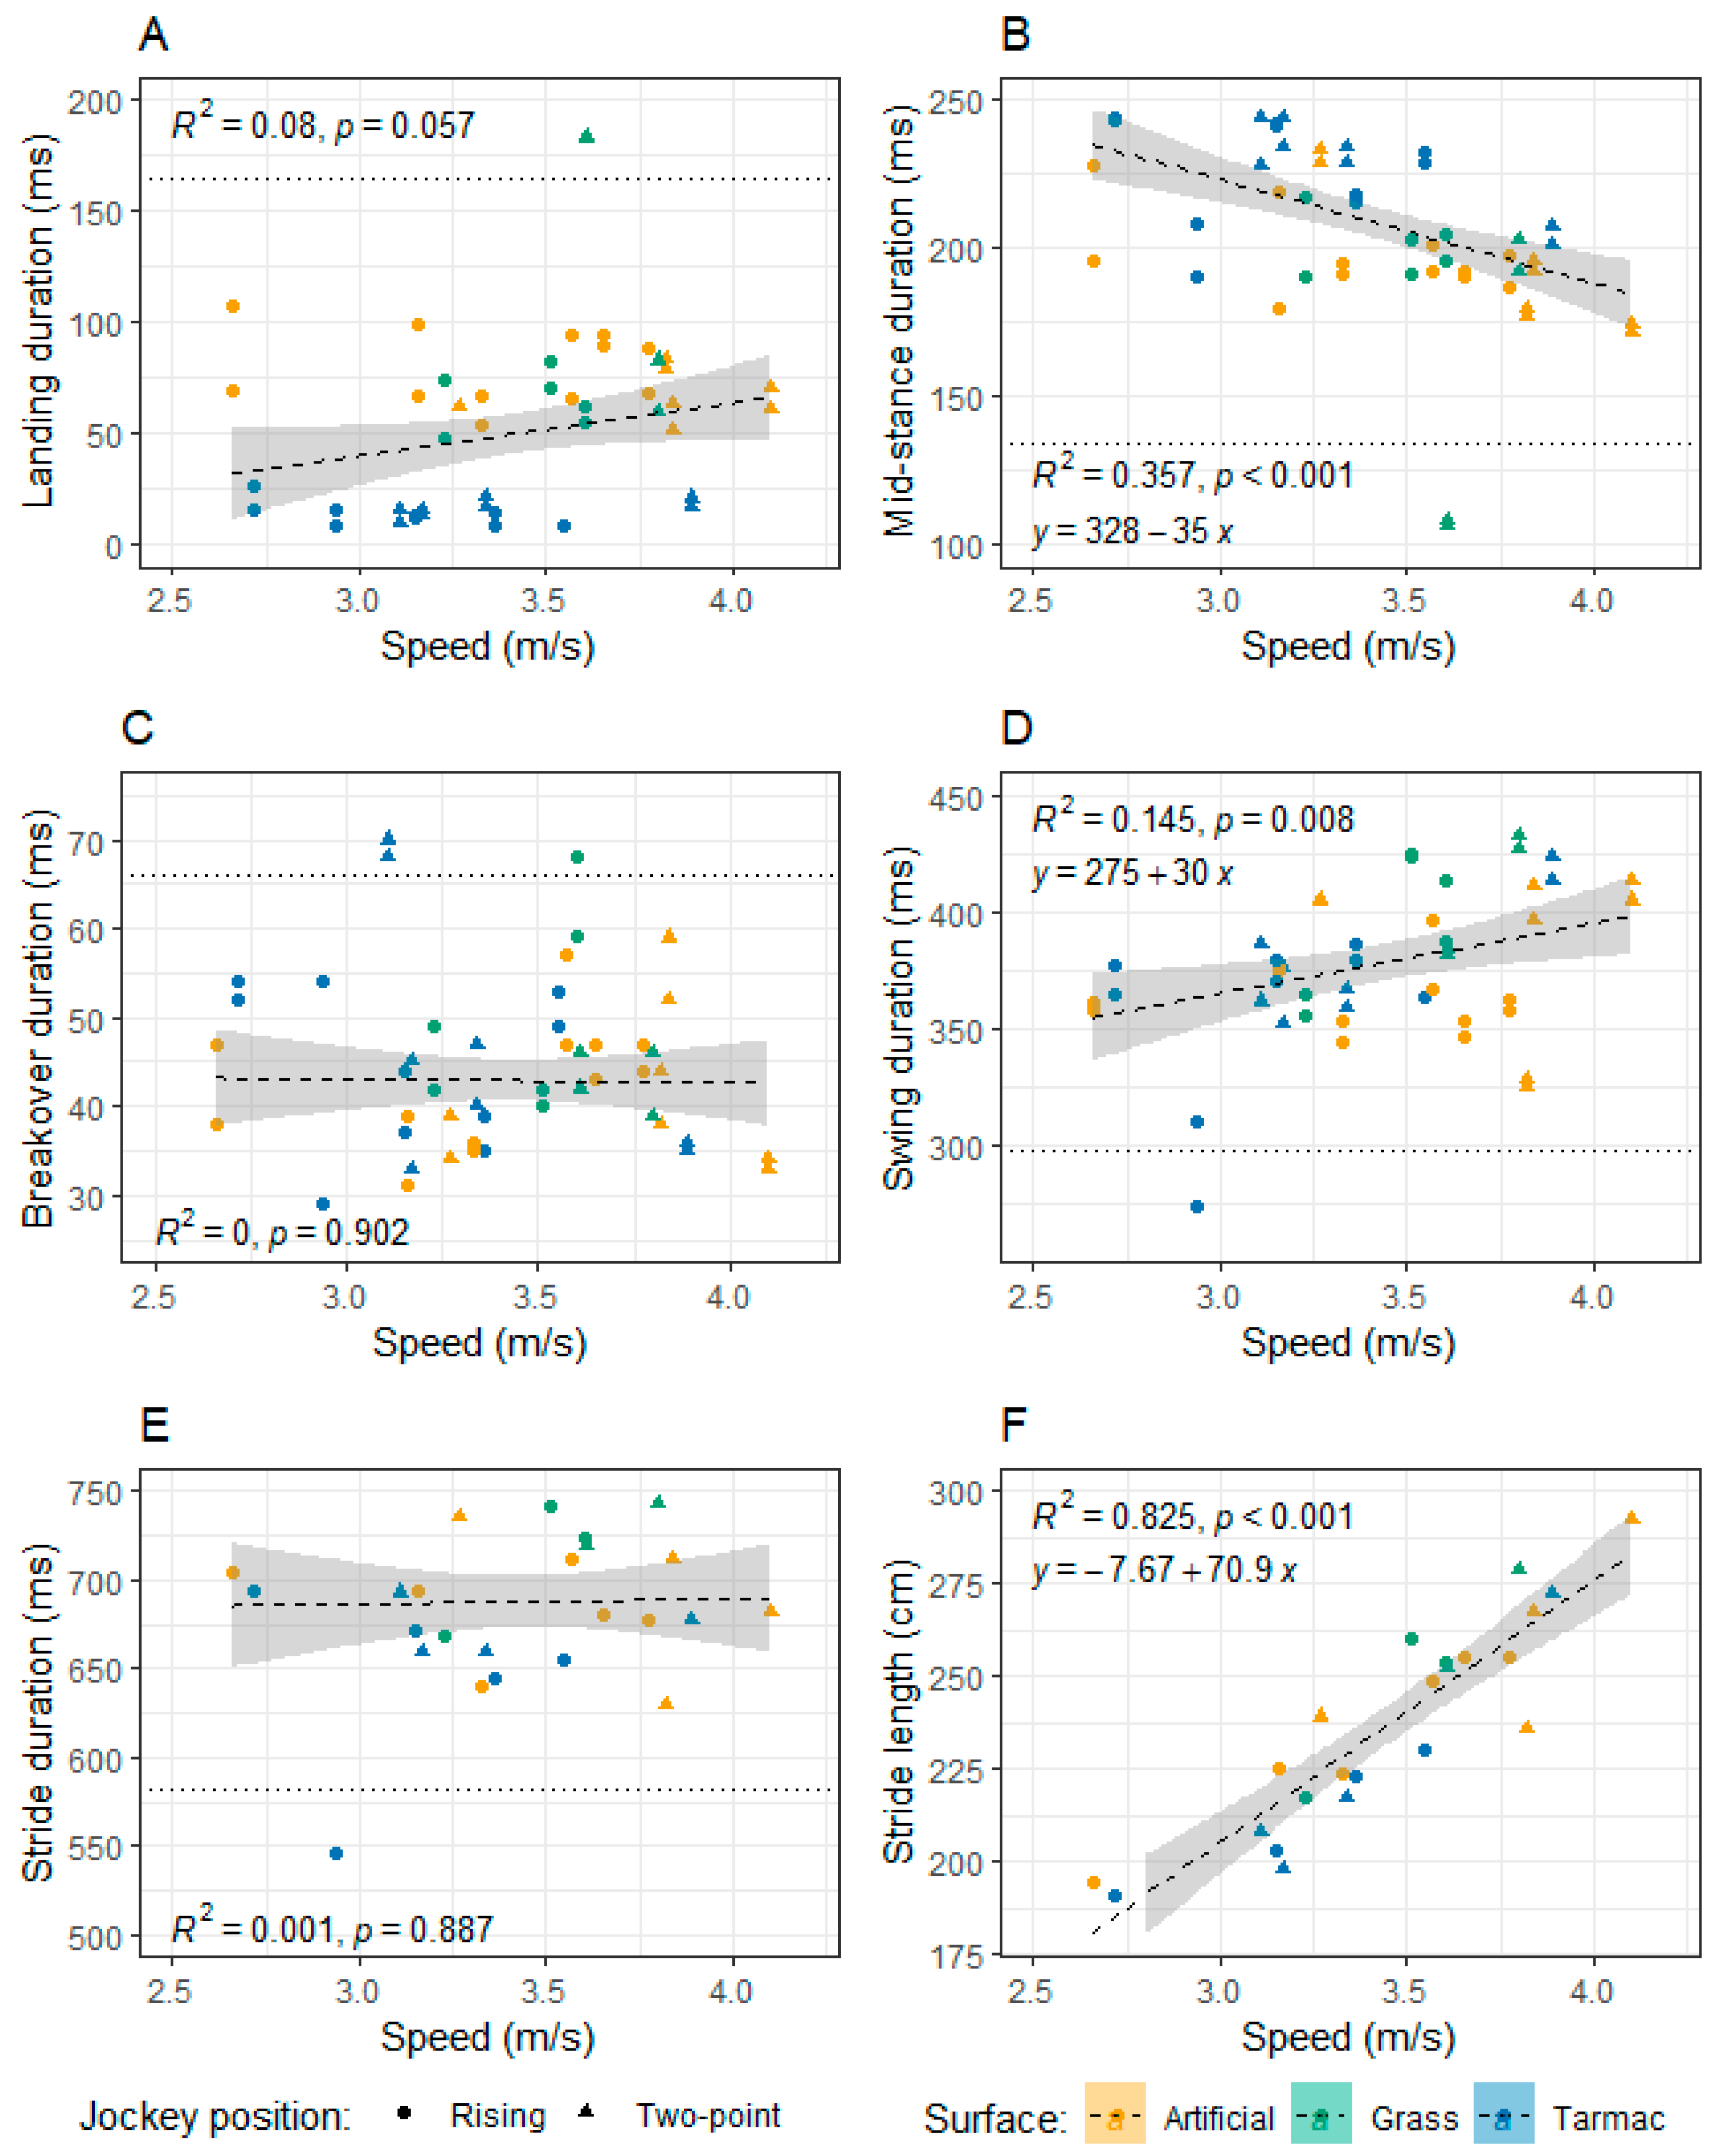
3. Results
3.1. Landing Duration
3.2. Mid-Stance Duration
3.3. Breakover Duration
3.4. Swing Duration
3.5. Stride Duration
3.6. Relative Stance Time
3.7. Stride Length
3.8. Speed
4. Discussion
5. Conclusions
Supplementary Materials
Author Contributions
Funding
Institutional Review Board Statement
Informed Consent Statement
Acknowledgments
Conflicts of Interest
References
- Barnard, A. Racehorse Community Says Slippery Roads Could Lead to Accidents. Available online: https://www.thenorthernecho.co.uk/news/local/northyorkshire/13582488.racehorse-community-says-slippery-roads-lead-accidents/ (accessed on 15 March 2023).
- Minting, S. Proposals Unveiled to Secure Safety of Racehorses and Riders in Middleham. Available online: https://www.richmondshiretoday.co.uk/proposals-unveiled-to-secure-safety-of-racehorses-and-riders-in-middleham/ (accessed on 15 March 2023).
- Cheney, J.A.; Shen, C.K.; Wheat, J.D. Relationship of racetrack surface to lameness in the thoroughbred racehorse. Am. J. Vet. Res. 1973, 34, 1285–1289. [Google Scholar]
- Moyer, W.; Spencer, P.A.; Kallish, M. Relative incidence of dorsal metacarpal disease in young Thoroughbred racehorses training on two different surfaces. Equine Vet. J. 1991, 23, 166–168. [Google Scholar] [CrossRef]
- Murray, R.C.; Walters, J.M.; Snart, H.; Dyson, S.; Parkin, T. How do features of dressage arenas influence training surface properties which are potentially associated with lameness? Vet. J. 2010, 186, 172–179. [Google Scholar] [CrossRef]
- Murray, R.C.; Walters, J.M.; Snart, H.; Dyson, S.; Parkin, T. Identification of risk factors for lameness in dressage horses. Vet. J. 2010, 184, 27–36. [Google Scholar] [CrossRef]
- Egenvall, A.; Tranquille, C.A.; Lönnell, A.C.; Bitschnau, C.; Oomen, A.; Hernlund, E.; Montavon, S.; Franko, M.A.; Murray, R.C.; Weishaupt, M.A.; et al. Days-lost to training and competition in relation to workload in 263 elite show-jumping horses in four European countries. Prev. Vet. Med. 2013, 112, 387–400. [Google Scholar] [CrossRef] [PubMed]
- Bailey, C.J.; Reid, S.W.J.; Hodgson, D.R.; Bourke, J.M.; Rose, R.J. Flat, hurdle and steeple racing: Risk factors for muscuIoskeIetal injury. Equine Vet. J. 1998, 30, 498–503. [Google Scholar] [CrossRef] [PubMed]
- Williams, R.B.; Harkins, L.S.; Hammond, C.J.; Wood, J.L.N. Racehorse injuries, clinical problems and fatalities recorded on British racecourses from flat racing and National Hunt racing during 1996, 1997 and 1998. Equine Vet. J. 2001, 33, 478–486. [Google Scholar] [CrossRef]
- Parkin, T.D.H.; Clegg, P.D.; French, N.P.; Proudman, C.J.; Riggs, C.M.; Singer, E.R.; Webbon, P.M.; Morgan, K.L. Race- and course-level risk factors for fatal distal limb fracture in racing Thoroughbreds. Equine Vet. J. 2004, 36, 521–526. [Google Scholar] [CrossRef] [PubMed]
- Setterbo, J.J.; Garcia, T.C.; Campbell, I.P.; Reese, J.L.; Morgan, J.M.; Kim, S.Y.; Hubbard, M.; Stover, S.M. Hoof accelerations and ground reaction forces of Thoroughbred racehorses measured on dirt, synthetic, and turf track surfaces. Am. J. Vet. Res. 2009, 70, 1220–1229. [Google Scholar] [CrossRef]
- Barstow, A.; Bailey, J.; Campbell, J.; Harris, C.; Weller, R.; Pfau, T. Does ‘hacking’ surface type affect equine forelimb foot placement, movement symmetry or hoof impact deceleration during ridden walk and trot exercise? Equine Vet. J. 2019, 51, 108–114. [Google Scholar] [CrossRef]
- Horan, K.; Coburn, J.; Kourdache, K.; Day, P.; Carnall, H.; Brinkley, L.; Harborne, D.; Hammond, L.; Peterson, M.; Millard, S.; et al. Hoof Impact and Foot-Off Accelerations in Galloping Thoroughbred Racehorses Trialling Eight Shoe–Surface Combinations Kate. Animals 2022, 12, 2161. [Google Scholar] [CrossRef] [PubMed]
- Chateau, H.; Robin, D.; Falala, S.; Pourcelot, P.; Valette, J.P.; Ravary, B.; Denoix, J.M.; Crevier-Denoix, N. Effects of a synthetic all-weather waxed track versus a crushed sand track on 3D acceleration of the front hoof in three horses trotting at high speed. Equine Vet. J. 2009, 41, 247–251. [Google Scholar] [CrossRef] [PubMed]
- Chateau, H.; Holden, L.; Robin, D.; Falala, S.; Pourcelot, P.; Estoup, P.; Denoix, J.M.; Crevier-Denoix, N. Biomechanical analysis of hoof landing and stride parameters in harness trotter horses running on different tracks of a sand beach (from wet to dry) and on an asphalt road. Equine Vet. J. 2010, 42, 488–495. [Google Scholar] [CrossRef] [PubMed]
- Ratzlaff, M.H.; Wilson, P.D.; Hutton, D.V.; Slinker, B.K. Relationships between hoof-acceleration patterns of galloping horses and dynamic properties of the track. Am. J. Vet. Res. 2005, 66, 589–595. [Google Scholar] [CrossRef]
- Horan, K.; Coburn, J.; Kourdache, K.; Day, P.; Harborne, D.; Brinkley, L.; Carnall, H.; Hammond, L.; Peterson, M.; Millard, S.; et al. Influence of speed, ground surface and shoeing Condition on hoof breakover duration in galloping Thoroughbred racehorses. Animals 2021, 11, 2588. [Google Scholar] [CrossRef]
- Horan, K.; Kourdache, K.; Coburn, J.; Day, P.; Carnall, H.; Harborne, D.; Brinkley, L.; Hammond, L.; Millard, S.; Lancaster, B.; et al. The effect of horseshoes and surfaces on horse and jockey centre of mass displacements at gallop. PLoS ONE 2021, 16, e0257820. [Google Scholar] [CrossRef]
- Vos, N.J.; Riemersma, D.J. Determination of coefficient of friction between the equine foot and different ground surfaces: An in vitro study. Equine Comp. Exerc. Physiol. 2006, 3, 191–198. [Google Scholar] [CrossRef]
- Gustas, P.; Johnston, C.; Roepstorfft, L.; Drevemo, S. In vivo transmission of impact shock waves in the distal forelimb of the horse. Equine Vet. J. 2001, 33, 11–15. [Google Scholar] [CrossRef]
- Gustås, P.; Johnston, C.; Drevemo, S. Ground reaction force and hoof deceleration patterns on two different surfaces at the trot. Equine Comp. Exerc. Physiol. 2006, 3, 209–216. [Google Scholar] [CrossRef]
- Pardoe, C.H.; McGuigan, M.P.; Rogers, K.M.; Rowe, L.L.; Wilson, A.M. The effect of shoe material on the kinetics and kinematics of foot slip at impact on concrete. Equine Vet. J. Suppl. 2001, 33, 70–73. [Google Scholar] [CrossRef]
- Holden-Douilly, L.; Pourcelot, P.; Desquilbet, L.; Falala, S.; Crevier-Denoix, N.; Chateau, H. Equine hoof slip distance during trot at training speed: Comparison between kinematic and accelerometric measurement techniques. Vet. J. 2013, 197, 198–204. [Google Scholar] [CrossRef]
- Henley, W.E.; Rogers, K.; Harkins, L.; Wood, J.L.N. A comparison of survival models for assessing risk of racehorse fatality. Prev. Vet. Med. 2006, 74, 3–20. [Google Scholar] [CrossRef] [PubMed]
- Arthur, R.M. Comparison of Racing Fatality Rates on Dirt, Synthetic, and Turf at Four California Racetracks. AAEP Proc. 2010, 56, 405–408. [Google Scholar]
- Hitchens, P.L.; Hill, A.E.; Stover, S.M. Jockey Falls, Injuries, and fatalities associated with thoroughbred and Quarter Horse racing in California, 2007–2011. Orthop. J. Sport. Med. 2013, 1, 2325967113492625. [Google Scholar] [CrossRef] [PubMed]
- Walker, A.M.; Applegate, C.; Pfau, T.; Sparkes, E.L.; Wilson, A.M.; Witte, T.H. The kinematics and kinetics of riding a racehorse: A quantitative comparison of a training simulator and real horses. J. Biomech. 2016, 49, 3368–3374. [Google Scholar] [CrossRef]
- Hagen, J.; Jung, F.T.; Brouwer, J.; Bos, R. Detection of Equine Hoof Motion by Using a Hoof-Mounted Inertial Measurement Unit Sensor in Comparison to Examinations with an Optoelectronic Technique—A Pilot Study. J. Equine Vet. Sci. 2021, 101, 103454. [Google Scholar] [CrossRef]
- HoofBeat Technology. Available online: https://hoofbeat.nl/technology/ (accessed on 12 May 2023).
- Upton, G.J.C.; Cook, I. Understanding Statistics; Oxford University Press: Oxford, UK, 1996; ISBN 0199143919. [Google Scholar]
- Kai, M.; Takahashi, T.; Aoki, O.; Oki, H. Influence of rough track surfaces on components of vertical forces in cantering thoroughbred horses. Equine Vet. J. Suppl. 1999, 30, 214–217. [Google Scholar] [CrossRef]
- Crevier-Denoix, N.; Falala, S.; Holden-Douilly, L.; Camus, M.; Martino, J.; Ravary-Plumioen, B.; Vergari, C.; Desquilbet, L.; Denoix, J.M.; Chateau, H.; et al. Comparative kinematic analysis of the leading and trailing forelimbs of horses cantering on a turf and a synthetic surface. Equine Vet. J. 2013, 45, 54–61. [Google Scholar] [CrossRef]
- Crevier-Denoix, N.; Robin, D.; Pourcelot, P.; Falala, S.; Holden, L.; Estoup, P.; Desquilbet, L.; Denoix, J.M.; Chateau, H. Ground reaction force and kinematic analysis of limb loading on two different beach sand tracks in harness trotters. Equine Vet. J. 2010, 42, 544–551. [Google Scholar] [CrossRef]
- Burn, J.F.; Usmar, S.J. Hoof landing velocity is related to track surface properties in trotting horses. Equine Comp. Exerc. Physiol. 2005, 2, 37–41. [Google Scholar] [CrossRef][Green Version]
- Symons, J.E.; Garcia, T.C.; Stover, S.M. Distal hindlimb kinematics of galloping Thoroughbred racehorses on dirt and synthetic racetrack surfaces. Equine Vet. J. 2014, 46, 227–232. [Google Scholar] [CrossRef]
- Chateau, H.; Camus, M.; Holden-Douilly, L.; Falala, S.; Ravary, B.; Vergari, C.; Lepley, J.; Denoix, J.M.; Pourcelot, P.; Crevier-Denoix, N. Kinetics of the forelimb in horses circling on different ground surfaces at the trot. Vet. J. 2013, 198, e20–e26. [Google Scholar] [CrossRef]
- Munoz-Nates, F.; Pourcelot, P.; Camus, M.; Ravary-Plumioen, B.; Hamme, A.V.; Litaise, C.; Emond, A.-L.; Beaud, L.; Chateau, H.; Crevier-Denoix, N. External forces and impulses applied to the hind limb of 3 jumping horses at take-off-effects of the fence’s height. Comput. Methods Biomech. Biomed. Engin. 2019, 22, S516–S518. [Google Scholar] [CrossRef]
- Parsons, K.J.; Spence, A.J.; Morgan, R.; Thompson, J.A.; Wilson, A.M. High speed field kinematics of foot contact in elite galloping horses in training. Equine Vet. J. 2011, 43, 216–222. [Google Scholar] [CrossRef]
- Harvey, A.M.; Williams, S.B.; Singer, E.R. The effect of lateral heel studs on the kinematics of the equine digit while cantering on grass. Vet. J. 2012, 192, 217–221. [Google Scholar] [CrossRef] [PubMed]
- Johnston, C.; Back, W. Hoof ground interaction: When biomechanical stimuli challenge the tissues of the distal limb. Equine Vet. J. 2006, 38, 634–641. [Google Scholar] [CrossRef] [PubMed]
- Witte, T.H.; Knill, K.; Wilson, A.M. Determination of peak vertical ground reaction force from duty factor in the horse (Equus caballus). J. Exp. Biol. 2004, 207, 3639–3648. [Google Scholar] [CrossRef]
- Alexander, R.M.; Maloiy, G.M.O.; Hunter, B.; Jayes, A.S.; Nturibi, J. Mechanical stresses in fast locomotion of buffalo (Syncews coffer) and elephant (Loxodonta africana). J. Zool. 1979, 189, 135–144. [Google Scholar] [CrossRef]
- Logan, A.A.; Nielsen, B.D.; Hallock, D.B.; Robison, C.I.; Popovich, J.M. Evaluation of Within- and Between- Session Reliability of the TekscanTM Hoof System With a Glue-on Shoe. J. Equine Vet. Sci. 2022, 110, 103862. [Google Scholar] [CrossRef] [PubMed]
- Northrop, A.J.; Dagg, L.A.; Martin, J.H.; Brigden, C.V.; Owen, A.G.; Blundell, E.L.; Peterson, M.L.; Hobbs, S.J. The effect of two preparation procedures on an equine arena surface in relation to motion of the hoof and metacarpophalangeal joint. Vet. J. 2013, 198, e137–e142. [Google Scholar] [CrossRef] [PubMed]
- Northrop, A.J.; Hobbs, S.J.; Holt, D.; Clayton-Smith, E.; Martin, J.H. Spatial Variation of the Physical and Biomechanical Properties Within an Equestrian Arena Surface. Procedia Eng. 2016, 147, 866–871. [Google Scholar] [CrossRef][Green Version]
- McGuigan, M.P.; Wilson, A.M. The effect of gait and digital flexor muscle activation on limb compliance in the forelimb of the horse Equus caballus. J. Exp. Biol. 2003, 206, 1325–1336. [Google Scholar] [CrossRef]
- Ferris, D.P.; Liang, K.; Farley, C.T. Runners adjust leg stiffness for their first step on a new running surface. J. Biomech. 1999, 32, 787–794. [Google Scholar] [CrossRef]
- Pfau, T.; Spence, A.; Starke, S.; Ferrari, M.; Wilson, A. Modern riding style improves horse racing times. Science 2009, 325, 289. [Google Scholar] [CrossRef]
- Mahaffey, C.A.; Peterson, M.L.; Roepstorff, L. The effects of varying cushion depth on dynamic loading in shallow sand thoroughbred horse dirt racetracks. Biosyst. Eng. 2013, 114, 178–186. [Google Scholar] [CrossRef]
- Witte, T.H.; Hirst, C.V.; Wilson, A.M. Effect of speed on stride parameters in racehorses at gallop in field conditions. J. Exp. Biol. 2006, 209, 4389–4397. [Google Scholar] [CrossRef] [PubMed]
- Butcher, M.T.; Ashley-Ross, M.A. Fetlock joint kinematics differ with age in thoroughbred racehorses. J. Biomech. 2002, 35, 563–571. [Google Scholar] [CrossRef] [PubMed]
- Addis, P.R.; Lawson, S.E.M. The role of tendon stiffness in development of equine locomotion with age. Equine Vet. J. 2010, 42, 556–560. [Google Scholar] [CrossRef] [PubMed]
- Powers, P.N.; Kavanagh, A.M. Effect of rider experience on the jumping kinematics of riding horses. Equine Comp. Exerc. Physiol. 2005, 2, 263–267. [Google Scholar] [CrossRef]
- Wong, A.S.M.; Morrice-West, A.V.; Whitton, R.C.; Hitchens, P.L. Changes in Thoroughbred speed and stride characteristics over successive race starts and their association with musculoskeletal injury. Equine Vet. J. 2022, 55, 194–204. [Google Scholar] [CrossRef]


| Horse | Year Born | Height (hh) | Mass (kg) | Jockey position | Surface | Limb | No. of Strides | Trot Speed (m s−1) | Median Stride Length (m) | Mid-Stance (s) | Error Mid-Stance +/− (s) * | Median Breakover Duration (s) | Error Breakover +/− (s) | Swing (s) | Swing Error +/− (s) | Median Landing Duration (s) | Landing Error +/− (s) | Stride Duration (s) | Relative Stance Time (%) |
|---|---|---|---|---|---|---|---|---|---|---|---|---|---|---|---|---|---|---|---|
| 1 | 2004 | 16.1 | 550 | Rising | Artificial | LF | 47 | 3.65 | 2.55 | 0.192 | 0.023 | 0.043 | 0.007 | 0.354 | 0.039 | 0.09 | 0.04 | 0.68 | 47.8 |
| Rising | Artificial | RF | 47 | 3.65 | 2.55 | 0.19 | 0.036 | 0.047 | 0.008 | 0.347 | 0.032 | 0.094 | 0.038 | 0.68 | 49 | ||||
| Two-point | Artificial | LF | 14 | 3.82 | 2.36 | 0.177 | 0.058 | 0.038 | 0.009 | 0.329 | 0.058 | 0.084 | 0.075 | 0.629 | 47.7 | ||||
| Two-point | Artificial | RF | 14 | 3.82 | 2.36 | 0.18 | 0.038 | 0.044 | 0.007 | 0.325 | 0.043 | 0.079 | 0.042 | 0.629 | 48.3 | ||||
| 2 | 2007 | 16 | 520 | Rising | Tarmac | LF | 5 | 2.94 | 1.64 † | 0.19 | 0.019 | 0.029 | 0.01 | 0.31 | 0.05 | 0.016 | 0.007 | 0.547 ‡ | 43.3 |
| Rising | Tarmac | RF | 5 | 2.94 | 1.64 † | 0.208 | 0.016 | 0.054 | 0.004 | 0.274 ‡ | 0.059 | 0.009 | 0.001 | 0.547 ‡ | 49.8 | ||||
| Two-point | Tarmac | LF | 58 | 3.89 | 2.72 | 0.207 | 0.024 | 0.036 | 0.01 | 0.414 | 0.021 | 0.021 | 0.012 | 0.678 | 39 | ||||
| Two-point | Tarmac | RF | 58 | 3.89 | 2.72 | 0.201 | 0.013 | 0.035 | 0.008 | 0.424 | 0.031 | 0.017 | 0.013 | 0.678 | 37.5 | ||||
| Rising | Artificial | LF | 26 | 2.66 | 1.94 | 0.196 | 0.055 | 0.038 | 0.016 | 0.362 | 0.063 | 0.107 | 0.051 | 0.704 | 48.5 | ||||
| Rising | Artificial | RF | 27 | 2.66 | 1.94 | 0.228 | 0.053 | 0.047 | 0.01 | 0.358 | 0.086 | 0.069 | 0.063 | 0.704 | 49.1 | ||||
| Two-point | Artificial | LF | 10 | 3.27 | 2.39 | 0.233 | 0.023 | 0.034 | 0.007 | 0.406 | 0.021 | 0.062 | 0.04 | 0.736 | 44.9 | ||||
| Two-point | Artificial | RF | 11 | 3.27 | 2.39 | 0.229 | 0.037 | 0.039 | 0.009 | 0.405 | 0.021 | 0.062 | 0.022 | 0.736 | 44.9 | ||||
| Rising | Grass | LF | 54 | 3.51 | 2.6 | 0.191 | 0.072 | 0.04 | 0.009 | 0.425 | 0.028 | 0.083 | 0.074 | 0.741 | 42.6 | ||||
| Rising | Grass | RF | 56 | 3.51 | 2.6 | 0.203 | 0.041 | 0.042 | 0.009 | 0.424 | 0.04 | 0.07 | 0.045 | 0.741 | 42.7 | ||||
| Two-point | Grass | LF | 45 | 3.8 | 2.79 | 0.192 | 0.053 | 0.039 | 0.006 | 0.427 | 0.02 | 0.083 | 0.054 | 0.743 | 42.5 | ||||
| Two-point | Grass | RF | 46 | 3.8 | 2.79 | 0.203 | 0.026 | 0.046 | 0.008 | 0.433 | 0.024 | 0.06 | 0.036 | 0.743 | 41.7 | ||||
| 3 | 2014 | 16 | 530 | Rising | Tarmac | LF | 42 | 3.55 | 2.3 | 0.232 | 0.025 | 0.049 | 0.012 | 0.364 | 0.026 | 0.009 | 0.006 | 0.655 | 44.5 |
| Rising | Tarmac | RF | 42 | 3.55 | 2.3 | 0.229 | 0.022 | 0.053 | 0.009 | 0.364 | 0.016 | 0.008 | 0.006 | 0.655 | 44.4 | ||||
| Two-point | Tarmac | LF | 18 | 3.11 | 2.08 | 0.244 | 0.008 | 0.070 ‡ | 0.006 | 0.362 | 0.015 | 0.016 | 0.009 | 0.693 | 47.8 | ||||
| Two-point | Tarmac | RF | 18 | 3.11 | 2.08 | 0.228 | 0.014 | 0.068 ‡ | 0.01 | 0.386 | 0.014 | 0.01 | 0.005 | 0.693 | 44.3 | ||||
| Rising | Artificial | LF | 43 | 3.77 | 2.55 | 0.198 | 0.031 | 0.047 | 0.007 | 0.363 | 0.033 | 0.068 | 0.048 | 0.678 | 46.5 | ||||
| Rising | Artificial | RF | 42 | 3.77 | 2.55 | 0.187 | 0.075 | 0.044 | 0.01 | 0.358 | 0.029 | 0.088 | 0.078 | 0.678 | 47.2 | ||||
| Two-point | Grass | LF | 9 | 3.61 | 2.52 | 0.108 ‡ | 0.032 | 0.042 | 0.007 | 0.384 | 0.013 | 0.183 ‡ | 0.029 | 0.719 | 46.6 | ||||
| Two-point | Grass | RF | 7 | 3.61 | 2.52 | 0.106 ‡ | 0.043 | 0.046 | 0.004 | 0.382 | 0.013 | 0.184 ‡ | 0.035 | 0.719 | 46.9 | ||||
| 4 | 2012 | 17 | 580 | Rising | Tarmac | LF | 10 | 2.72 | 1.91 | 0.244 | 0.031 | 0.052 | 0.015 | 0.377 | 0.047 | 0.016 | 0.017 | 0.693 | 46 |
| Rising | Tarmac | RF | 9 | 2.72 | 1.91 | 0.243 | 0.037 | 0.054 | 0.015 | 0.365 | 0.029 | 0.026 | 0.034 | 0.693 | 47 | ||||
| Two-point | Tarmac | LF | 13 | 3.17 | 1.98 | 0.234 | 0.018 | 0.033 | 0.005 | 0.376 | 0.04 | 0.013 | 0.003 | 0.659 | 42.8 | ||||
| Two-point | Tarmac | RF | 12 | 3.17 | 1.98 | 0.244 | 0.018 | 0.045 | 0.011 | 0.352 | 0.017 | 0.016 | 0.007 | 0.659 | 46.5 | ||||
| Rising | Artificial | LF | 55 | 3.57 | 2.49 | 0.201 | 0.032 | 0.047 | 0.013 | 0.397 | 0.029 | 0.066 | 0.048 | 0.711 | 44.2 | ||||
| Rising | Artificial | RF | 52 | 3.57 | 2.49 | 0.192 | 0.045 | 0.057 | 0.009 | 0.367 | 0.05 | 0.094 | 0.06 | 0.711 | 48.4 | ||||
| Two-point | Artificial | LF | 26 | 3.84 | 2.67 | 0.196 | 0.039 | 0.052 | 0.007 | 0.411 | 0.025 | 0.051 | 0.039 | 0.712 | 42.3 | ||||
| Two-point | Artificial | RF | 26 | 3.84 | 2.67 | 0.192 | 0.039 | 0.059 | 0.011 | 0.396 | 0.034 | 0.063 | 0.043 | 0.712 | 44.3 | ||||
| Rising | Grass | LF | 49 | 3.6 | 2.54 | 0.196 | 0.044 | 0.059 | 0.026 | 0.414 | 0.036 | 0.055 | 0.047 | 0.724 | 42.9 | ||||
| Rising | Grass | RF | 49 | 3.6 | 2.54 | 0.205 | 0.031 | 0.068 ‡ | 0.013 | 0.388 | 0.035 | 0.062 | 0.038 | 0.724 | 46.4 | ||||
| 5 | 2007 | 16 | 510 | Rising | Tarmac | LF | 7 | 3.36 | 2.23 | 0.218 | 0.01 | 0.035 | 0.006 | 0.386 | 0.006 | 0.008 | 0.002 | 0.645 | 40.3 |
| Rising | Tarmac | RF | 9 | 3.36 | 2.23 | 0.215 | 0.022 | 0.039 | 0.007 | 0.379 | 0.015 | 0.014 | 0.015 | 0.645 | 41.4 | ||||
| Rising | Artificial | LF | 11 | 3.16 | 2.25 | 0.219 | 0.016 | 0.031 | 0.006 | 0.376 | 0.03 | 0.067 | 0.039 | 0.694 | 47.2 | ||||
| Rising | Artificial | RF | 9 | 3.16 | 2.25 | 0.18 | 0.042 | 0.039 | 0.007 | 0.375 | 0.027 | 0.099 | 0.054 | 0.694 | 46.1 | ||||
| Two-point | Artificial | LF | 8 | 4.1 | 2.92 | 0.172 | 0.022 | 0.034 | 0.006 | 0.414 | 0.03 | 0.061 | 0.029 | 0.682 | 39.1 | ||||
| Two-point | Artificial | RF | 6 | 4.1 | 2.92 | 0.174 | 0.018 | 0.033 | 0.005 | 0.405 | 0.025 | 0.07 | 0.025 | 0.682 | 39.8 | ||||
| 6 | 2002 | 16.3 | 550 | Rising | Artificial | LF | 50 | 3.33 | 2.24 | 0.191 | 0.058 | 0.036 | 0.01 | 0.344 | 0.051 | 0.067 | 0.062 | 0.64 | 46.2 |
| Rising | Artificial | RF | 53 | 3.33 | 2.24 | 0.195 | 0.035 | 0.035 | 0.007 | 0.354 | 0.045 | 0.054 | 0.039 | 0.64 | 44.6 | ||||
| Rising | Tarmac | LF | 11 | 3.15 | 2.03 | 0.242 | 0.014 | 0.044 | 0.007 | 0.37 | 0.025 | 0.013 | 0.007 | 0.672 | 44.7 | ||||
| Rising | Tarmac | RF | 11 | 3.15 | 2.03 | 0.241 | 0.015 | 0.037 | 0.005 | 0.379 | 0.011 | 0.012 | 0.006 | 0.672 | 43.2 | ||||
| Two-point | Tarmac | LF | 12 | 3.34 | 2.17 | 0.229 | 0.039 | 0.047 | 0.009 | 0.359 | 0.022 | 0.022 | 0.024 | 0.66 | 45.4 | ||||
| Two-point | Tarmac | RF | 12 | 3.34 | 2.17 | 0.234 | 0.022 | 0.04 | 0.01 | 0.367 | 0.028 | 0.017 | 0.009 | 0.66 | 43.4 | ||||
| Rising | Grass | LF | 7 | 3.23 | 2.17 | 0.217 | 0.021 | 0.049 | 0.007 | 0.356 | 0.03 | 0.048 | 0.03 | 0.669 | 46.5 | ||||
| Rising | Grass | RF | 7 | 3.23 | 2.17 | 0.19 | 0.058 | 0.042 | 0.009 | 0.365 | 0.032 | 0.074 | 0.059 | 0.669 | 45.2 |
| Parameter | Source | F Value | Significance |
|---|---|---|---|
| Landing duration (ms) | Jockey position | 0.23 | 0.636 |
| Surface | 100.88 | <0.001 | |
| Speed | 0.17 | 0.679 | |
| Jockey position*Surface | 3.71 | 0.035 | |
| Mid-stance duration (ms) | Jockey position | 13.34 | <0.001 |
| Surface | 8.25 | 0.001 | |
| Speed | 30.71 | <0.001 | |
| Jockey position*Surface | 1.40 | 0.258 | |
| Jockey position*Speed | 12.22 | 0.001 | |
| Breakover duration (ms) | Jockey position | 3.34 | 0.076 |
| Surface | 0.72 | 0.495 | |
| Speed | 0.35 | 0.556 | |
| Swing duration (ms) | Jockey position | 1.26 | 0.268 |
| Surface | 3.54 | 0.039 | |
| Speed | 12.34 | 0.001 | |
| Stride duration (ms) | Jockey position | 0.62 | 0.446 |
| Surface | 6.30 | 0.011 | |
| Speed | 0.93 | 0.351 | |
| Relative stance time (%) | Jockey position | 0.16 | 0.688 |
| Surface | 14.74 | <0.001 | |
| Speed | 51.45 | <0.001 | |
| Stride length (cm) | Jockey position | 0.24 | 0.63 |
| Surface | 4.25 | 0.036 | |
| Speed | 133.28 | <0.001 |
| Parameter | Jockey Position | Mean | Std. Error | df | 95% Confidence Interval (Lower Bound) | 95% Confidence Interval (Upper Bound) |
|---|---|---|---|---|---|---|
| Landing duration (ms) | Two-point | 51.6 | 4.3 | 12.0 | 42.2 | 61.0 |
| Rising | 53.7 | 3.1 | 4.7 | 45.5 | 61.9 | |
| Mid-stance duration | Two-point | 219.7 | 4.3 | 38.0 | 211.0 | 228.5 |
| Rising | 206.7 | 2.6 | 38.0 | 201.5 | 211.9 | |
| Breakover duration (ms) | Two-point | 40.9 | 2.7 | 9.4 | 34.7 | 47.0 |
| Rising | 44.8 | 2.5 | 6.7 | 38.9 | 50.7 | |
| Swing duration (ms) | Two-point | 380.2 | 10.0 | 6.3 | 356.2 | 404.3 |
| Rising | 373.5 | 9.5 | 5.3 | 349.5 | 397.5 | |
| Stride duration (ms) | Rising | 684.6 | 9.9 | 7.3 | 661.3 | 707.8 |
| Two-point | 692.8 | 10.9 | 9.5 | 668.3 | 717.2 | |
| Relative stance (%) | Two-point | 45.0 | 1.0 | 6.1 | 42.7 | 47.4 |
| Rising | 45.2 | 0.9 | 5.3 | 42.9 | 47.6 | |
| Stride length (cm) | Rising | 237.0 | 3.9 | 6.9 | 227.7 | 246.4 |
| Two-point | 235.1 | 4.3 | 8.9 | 225.4 | 244.8 |
| Parameter | Surface | Mean | Std. Error | df | 95% Confidence Interval (Lower Bound) | 95% Confidence Interval (Upper Bound) |
|---|---|---|---|---|---|---|
| Landing duration (ms) | Grass | 68.9 | 5.6 | 20.3 | 57.3 | 80.6 |
| Tarmac | 16.0 | 3.5 | 7.3 | 7.7 | 24.3 | |
| Artificial | 72.9 | 3.4 | 6.8 | 64.7 | 81.0 | |
| Mid-stance duration (ms) | Grass | 210.3 | 5.5 | 38.0 | 199.2 | 221.4 |
| Tarmac | 224.1 | 3.2 | 38.0 | 217.7 | 230.4 | |
| Artificial | 205.3 | 3.4 | 38.0 | 198.5 | 212.1 | |
| Breakover duration (ms) | Grass | 44.7 | 3.1 | 13.7 | 38.1 | 51.3 |
| Tarmac | 42.1 | 2.7 | 8.6 | 36.1 | 48.2 | |
| Artificial | 41.7 | 2.5 | 7.5 | 35.8 | 47.6 | |
| Swing duration (ms) | Grass | 388.5 | 10.9 | 8.7 | 363.8 | 413.2 |
| Tarmac | 373.2 | 10.0 | 6.3 | 349.1 | 397.2 | |
| Artificial | 368.9 | 9.7 | 5.8 | 344.9 | 392.9 | |
| Stride duration (ms) | Grass | 713.8 | 13.1 | 13.9 | 685.7 | 741.9 |
| Tarmac | 665.1 | 11.2 | 10.3 | 640.4 | 689.8 | |
| Artificial | 687.1 | 10.3 | 8.5 | 663.6 | 710.7 | |
| Relative stance time (%) | Grass | 45.6 | 1.0 | 8.0 | 43.2 | 48.0 |
| Tarmac | 43.4 | 1.0 | 6.0 | 41.0 | 45.8 | |
| Artificial | 46.4 | 0.9 | 5.6 | 44.1 | 48.8 | |
| Stride length (cm) | Grass | 242.3 | 5.1 | 13.3 | 231.3 | 253.2 |
| Tarmac | 228.2 | 4.4 | 9.7 | 218.4 | 238.0 | |
| Artificial | 237.8 | 4.1 | 8.0 | 228.3 | 247.2 |
| Parameter | Jockey Position | Surface | Mean | Std. Error | df | 95% Confidence Interval (Lower Bound) | 95% Confidence Interval (Upper Bound) |
|---|---|---|---|---|---|---|---|
| Landing duration (ms) | Two-point | Grass | 70.8 | 9.0 | 36.6 | 52.6 | 89.0 |
| Tarmac | 18.2 | 4.6 | 16.7 | 8.6 | 27.8 | ||
| Artificial | 65.6 | 5.0 | 21.0 | 55.3 | 75.9 | ||
| Rising | Grass | 67.0 | 5.2 | 21.2 | 56.2 | 77.8 | |
| Tarmac | 13.9 | 4.4 | 16.4 | 4.6 | 23.1 | ||
| Artificial | 80.1 | 3.8 | 11.1 | 71.7 | 88.5 | ||
| Mid-stance duration (ms) | Two-point | Grass | 219.8 | 9.7 | 38.0 | 200.2 | 239.4 |
| Tarmac | 225.5 | 4.4 | 38.0 | 216.5 | 234.5 | ||
| Artificial | 213.9 | 5.7 | 38.0 | 202.5 | 225.4 | ||
| Rising | Grass | 200.8 | 5.1 | 38.0 | 190.4 | 211.1 | |
| Tarmac | 222.7 | 4.5 | 38.0 | 213.6 | 231.7 | ||
| Artificial | 196.7 | 3.6 | 38.0 | 189.3 | 204.0 | ||
| Breakover duration (ms) | Two-point | Grass | 42.7 | 3.4 | 18.3 | 35.6 | 49.9 |
| Tarmac | 40.1 | 2.9 | 11.5 | 33.8 | 46.5 | ||
| Artificial | 39.7 | 2.9 | 12.1 | 33.4 | 46.1 | ||
| Rising | Grass | 46.7 | 3.1 | 14.4 | 40.0 | 53.3 | |
| Tarmac | 44.1 | 2.8 | 11.0 | 37.9 | 50.3 | ||
| Artificial | 43.7 | 2.6 | 8.2 | 37.7 | 49.7 | ||
| Swing duration (ms) | Two-point | Grass | 391.9 | 11.7 | 11.3 | 366.3 | 417.5 |
| Tarmac | 376.5 | 10.3 | 7.1 | 352.3 | 400.7 | ||
| Artificial | 372.3 | 10.4 | 7.7 | 348.0 | 396.5 | ||
| Rising | Grass | 385.2 | 10.9 | 8.8 | 360.5 | 409.8 | |
| Tarmac | 369.8 | 10.5 | 7.8 | 345.5 | 394.1 | ||
| Artificial | 365.5 | 9.9 | 6.1 | 341.5 | 389.5 | ||
| Relative stance time (%) | Two-point | Grass | 45.5 | 1.1 | 9.9 | 43.0 | 48.0 |
| Tarmac | 43.3 | 1.0 | 6.7 | 40.9 | 45.7 | ||
| Artificial | 46.3 | 1.0 | 7.1 | 43.9 | 48.7 | ||
| Rising | Grass | 45.7 | 1.0 | 7.9 | 43.3 | 48.1 | |
| Tarmac | 43.5 | 1.0 | 7.0 | 41.1 | 45.9 | ||
| Artificial | 46.5 | 1.0 | 5.9 | 44.2 | 48.9 | ||
| Stride duration (ms) | Rising | Grass | 709.7 | 13.2 | 14.5 | 681.6 | 737.9 |
| Tarmac | 661.0 | 12.8 | 14.2 | 633.6 | 688.4 | ||
| Artificial | 683.0 | 10.8 | 9.9 | 658.9 | 707.2 | ||
| Two-point | Grass | 717.9 | 15.0 | 16.4 | 686.2 | 749.6 | |
| Tarmac | 669.2 | 11.8 | 12.1 | 643.4 | 695.0 | ||
| Artificial | 691.2 | 12.3 | 13.4 | 664.8 | 717.7 | ||
| Stride length (cm) | Rising | Grass | 243.2 | 5.1 | 13.7 | 232.3 | 254.2 |
| Tarmac | 229.2 | 5.0 | 13.3 | 218.5 | 239.9 | ||
| Artificial | 238.7 | 4.3 | 9.1 | 229.1 | 248.3 | ||
| Two-point | Grass | 241.3 | 5.8 | 15.9 | 229.1 | 253.6 | |
| Tarmac | 227.3 | 4.6 | 11.2 | 217.1 | 237.4 | ||
| Artificial | 236.8 | 4.8 | 12.4 | 226.4 | 247.2 |
Disclaimer/Publisher’s Note: The statements, opinions and data contained in all publications are solely those of the individual author(s) and contributor(s) and not of MDPI and/or the editor(s). MDPI and/or the editor(s) disclaim responsibility for any injury to people or property resulting from any ideas, methods, instructions or products referred to in the content. |
© 2023 by the authors. Licensee MDPI, Basel, Switzerland. This article is an open access article distributed under the terms and conditions of the Creative Commons Attribution (CC BY) license (https://creativecommons.org/licenses/by/4.0/).
Share and Cite
Horan, K.; Price, H.; Day, P.; Mackechnie-Guire, R.; Pfau, T. Timing Differences in Stride Cycle Phases in Retired Racehorses Ridden in Rising and Two-Point Seat Positions at Trot on Turf, Artificial and Tarmac Surfaces. Animals 2023, 13, 2563. https://doi.org/10.3390/ani13162563
Horan K, Price H, Day P, Mackechnie-Guire R, Pfau T. Timing Differences in Stride Cycle Phases in Retired Racehorses Ridden in Rising and Two-Point Seat Positions at Trot on Turf, Artificial and Tarmac Surfaces. Animals. 2023; 13(16):2563. https://doi.org/10.3390/ani13162563
Chicago/Turabian StyleHoran, Kate, Haydn Price, Peter Day, Russell Mackechnie-Guire, and Thilo Pfau. 2023. "Timing Differences in Stride Cycle Phases in Retired Racehorses Ridden in Rising and Two-Point Seat Positions at Trot on Turf, Artificial and Tarmac Surfaces" Animals 13, no. 16: 2563. https://doi.org/10.3390/ani13162563
APA StyleHoran, K., Price, H., Day, P., Mackechnie-Guire, R., & Pfau, T. (2023). Timing Differences in Stride Cycle Phases in Retired Racehorses Ridden in Rising and Two-Point Seat Positions at Trot on Turf, Artificial and Tarmac Surfaces. Animals, 13(16), 2563. https://doi.org/10.3390/ani13162563