
Dietary Zinc Supplemented in Organic Form Affects the Expression of Inflammatory Molecules in Swine Intestine
 , , ,
, , ,  ,
,  and
and
Abstract
Simple Summary
Abstract
1. Introduction
2. Materials and Methods
2.1. In Vivo Study
2.1.1. Sample Collection
2.1.2. RNA Sequencing and Differential Expression Analysis
2.1.3. Quantitative PCR (qPCR) for Gene Expression Analysis
2.2. In Vitro Study
2.2.1. Swine Enteroids
2.2.2. Zn-Restriction of Swine Enteroids Pilot
2.2.3. Swine Enteroids Treatments
3. Data Analyses
4. Results
4.1. Animal Growth
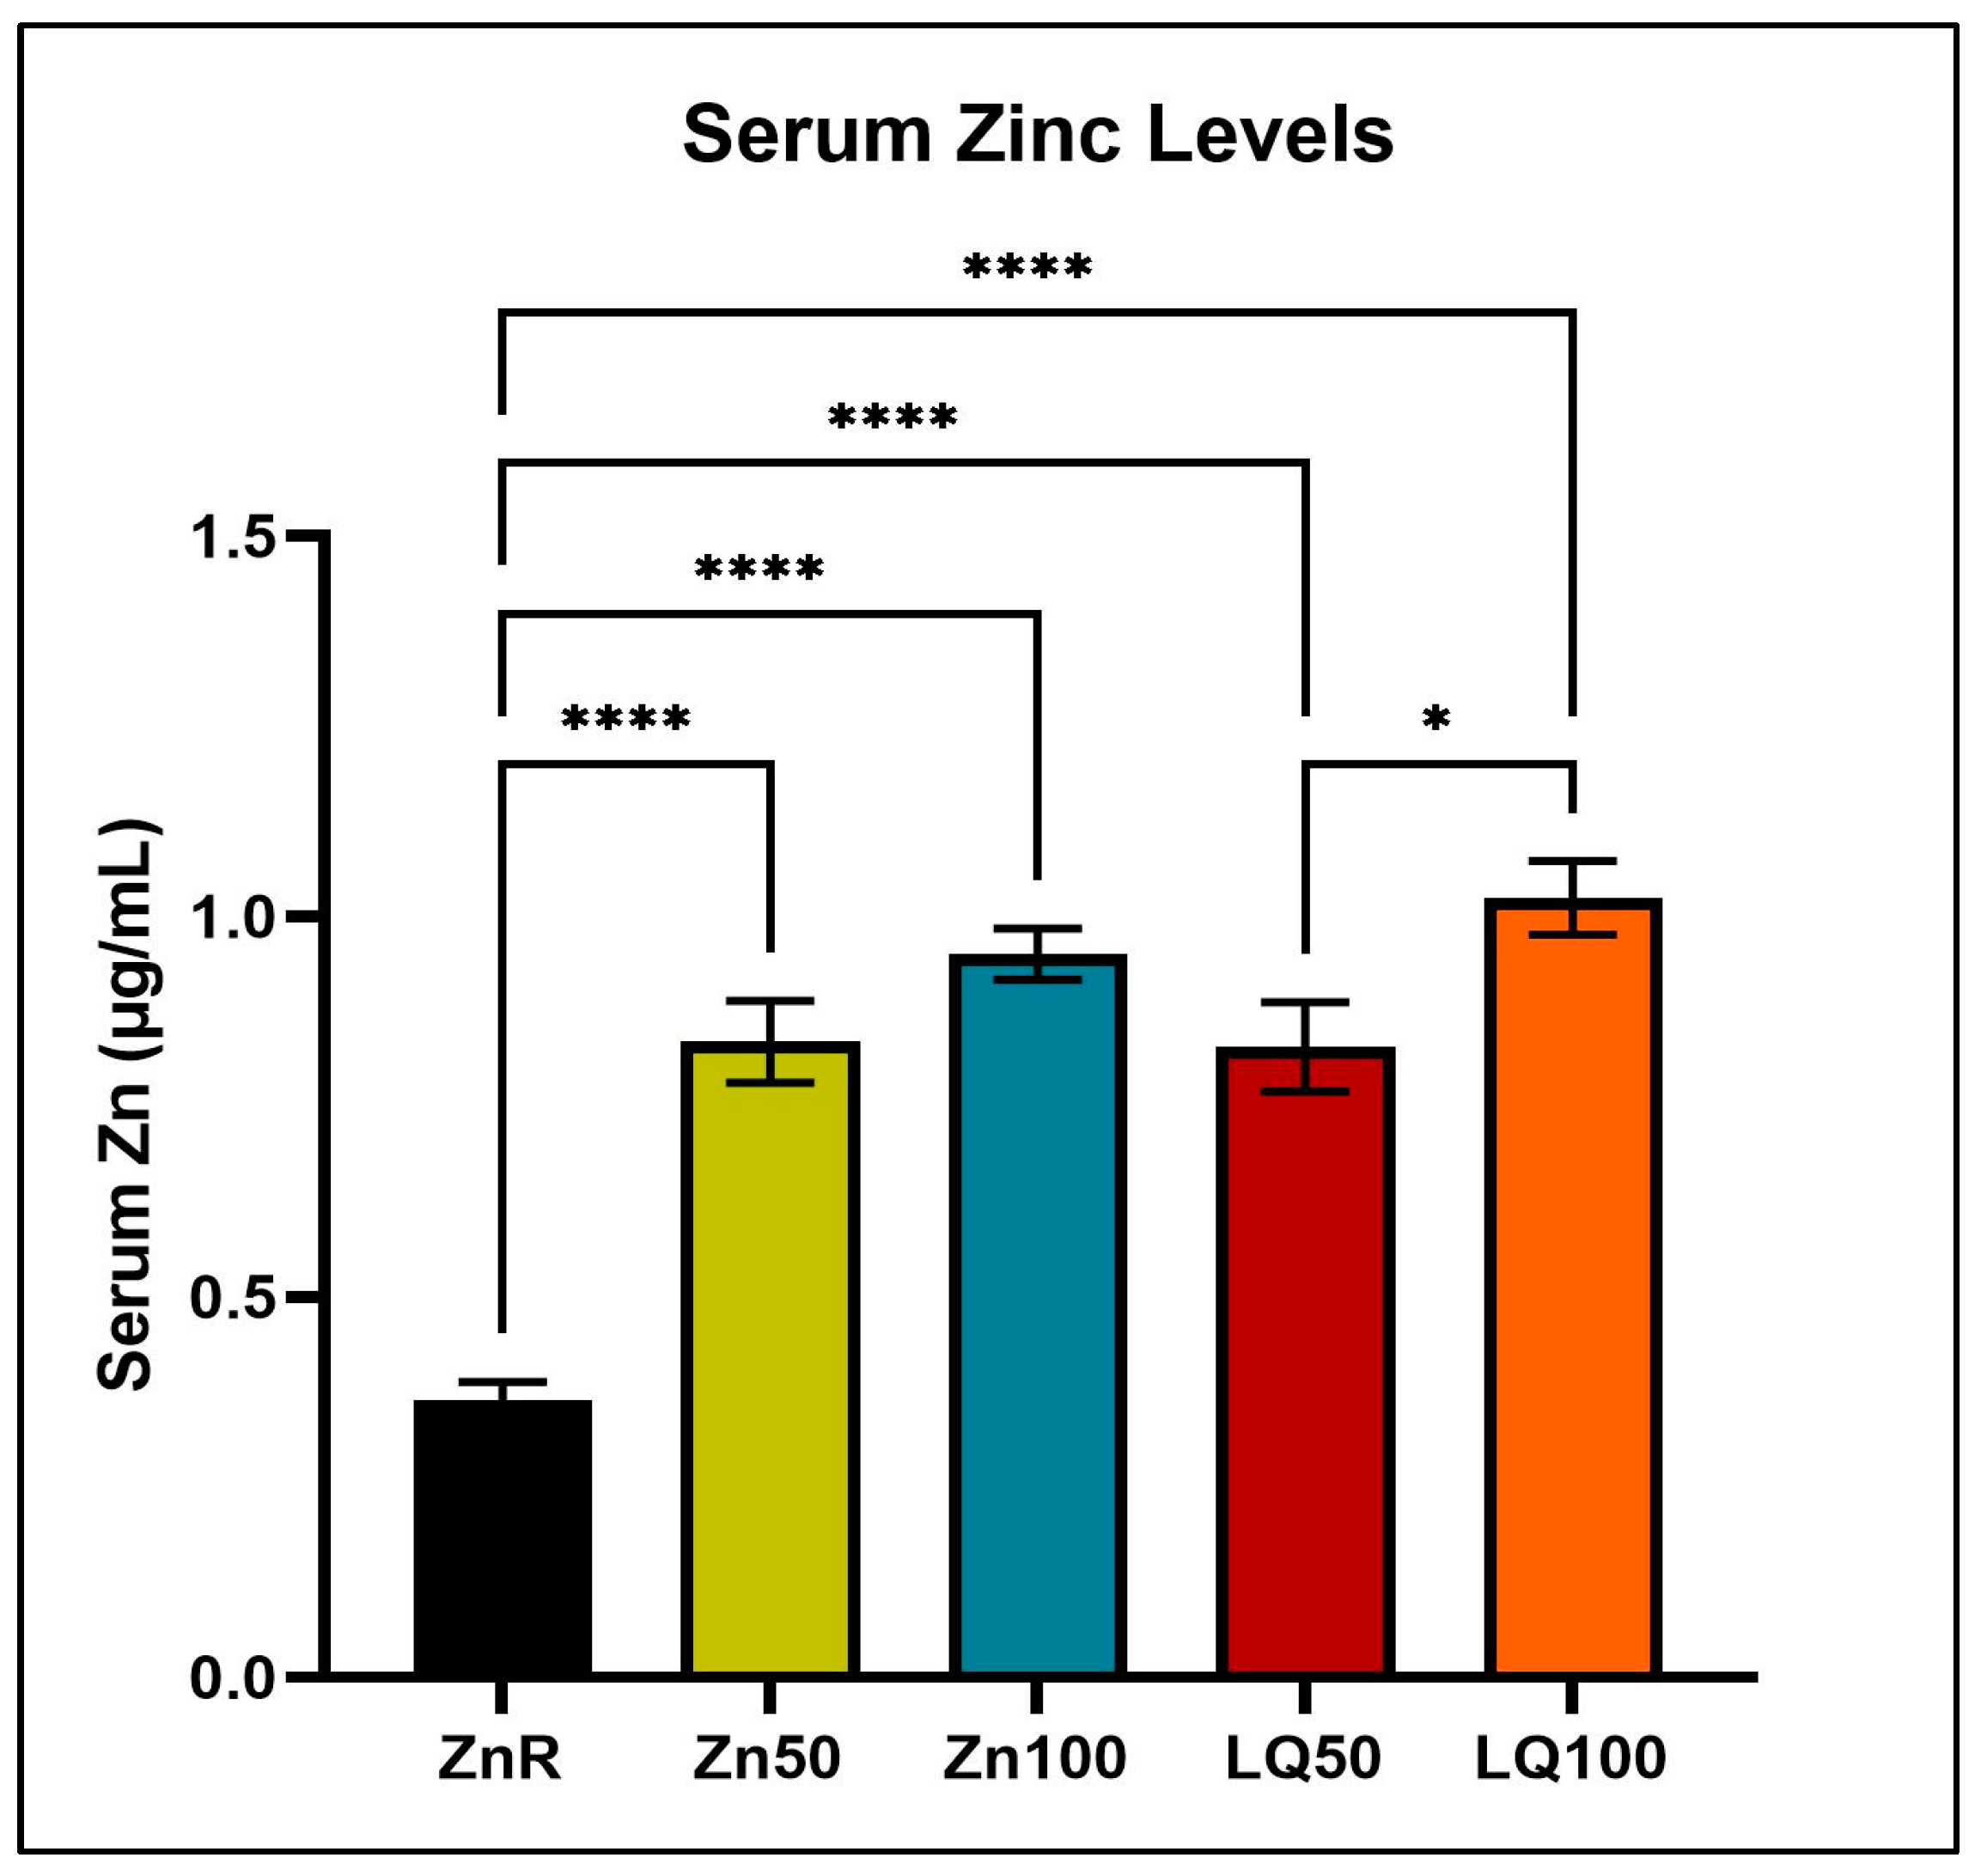
4.2. Serum Zinc Levels
4.3. Differentially Expressed Genes (DEGs)
4.4. In Vitro Study
5. Discussion
6. Conclusions
Supplementary Materials
Author Contributions
Funding
Institutional Review Board Statement
Informed Consent Statement
Data Availability Statement
Conflicts of Interest
References
- King, J.C. Zinc: An Essential but Elusive Nutrient. Am. J. Clin. Nutr. 2011, 94, 679S–684S. [Google Scholar] [CrossRef] [PubMed]
- King, J.C.; Brown, K.H.; Gibson, R.S.; Krebs, N.F.; Lowe, N.M.; Siekmann, J.H.; Raiten, D.J. Biomarkers of Nutrition for Development (BOND)—Zinc Review. J. Nutr. 2015, 146, 858S–885S. [Google Scholar] [CrossRef] [PubMed]
- Prasad, A.S. Clinical Manifestations of Zinc Deficiency. Annu. Rev. Nutr. 1985, 5, 341–363. [Google Scholar] [CrossRef] [PubMed]
- John, E.; Laskow, T.C.; Buchser, W.J.; Pitt, B.R.; Basse, P.H.; Butterfield, L.H.; Kalinski, P.; Lotze, M.T. Zinc in Innate and Adaptive Tumor Immunity. J. Transl. Med. 2010, 8, 118. [Google Scholar] [CrossRef]
- National Research Council. Nutrient Requirements of Swine, 11th ed.; Committee on Nutrient Requirements of Swine, Ed.; The National Academies Press: Washington, DC, USA, 2012; Volume 56, ISBN 0-309-05993-3. [Google Scholar]
- Hollis, G.R.; Carter, S.D.; Cline, T.R.; Crenshaw, T.D.; Cromwell, G.L.; Hill, G.M.; Kim, S.W.; Lewis, A.J.; Mahan, D.C.; Miller, P.S.; et al. Effects of Replacing Pharmacological Levels of Dietary Zinc Oxide with Lower Dietary Levels of Various Organic Zinc Sources for Weanling Pigs. J. Anim. Sci. 2005, 83, 2123–2129. [Google Scholar] [CrossRef]
- Hill, G.M.; Mahan, D.C.; Jolliff, J.S. Comparison of Organic and Inorganic Zinc Sources to Maximize Growth and Meet the Zinc Needs of the Nursery Pig. J. Anim. Sci. 2014, 92, 1582–1594. [Google Scholar] [CrossRef]
- Lisgara, Μ.; Skampardonis, V.; Leontides, L. Effect of Diet Supplementation with Chelated Zinc, Copper and Manganese on Hoof Lesions of Loose Housed Sows. Porcine Health Manag. 2016, 2, 6. [Google Scholar] [CrossRef]
- Sanz Fernandez, M.V.; Pearce, S.C.; Gabler, N.K.; Patience, J.F.; Wilson, M.E.; Socha, M.T.; Torrison, J.L.; Rhoads, R.P.; Baumgard, L.H. Effects of Supplemental Zinc Amino Acid Complex on Gut Integrity in Heat-Stressed Growing Pigs. Animal 2014, 8, 43–50. [Google Scholar] [CrossRef]
- Mayorga, E.J.; Kvidera, S.K.; Horst, E.A.; Al-Qaisi, M.; Dickson, M.J.; Seibert, J.T.; Lei, S.; Keating, A.F.; Ross, J.W.; Rhoads, R.P.; et al. Effects of Zinc Amino Acid Complex on Biomarkers of Gut Integrity and Metabolism during and Following Heat Stress or Feed Restriction in Pigs. J. Anim. Sci. 2018, 96, 4173–4185. [Google Scholar] [CrossRef]
- Mani, V.; Rubach, J.K.; Sanders, D.J.; Pham, T.; Koltes, D.A.; Gabler, N.K.; Poss, M.J. Evaluation of the Protective Effects of Zinc Butyrate in IPEC-J2 Cells and Grower Pigs under Heat Stress. Transl. Anim. Sci. 2019, 3, 842–854. [Google Scholar] [CrossRef]
- Pearce, S.C.; Sanz Fernandez, M.V.; Torrison, J.; Wilson, M.E.; Baumgard, L.H.; Gabler, N.K. Dietary Organic Zinc Attenuates Heat Stress–Induced Changes in Pig Intestinal Integrity and Metabolism. J. Anim. Sci. 2015, 93, 4702–4713. [Google Scholar] [CrossRef] [PubMed]
- Nagalakshmi, D.; Sridhar, K.; Satyanarayana, M.; Ramulu, S.P.; Narwade, V.S.; Vikram, L. Effect of Replacing Inorganic Zinc with a Lower Level of Organic Zinc (Zinc Propionate) on Performance, Biochemical Constituents, Antioxidant, Immune and Mineral Status in Buffalo Calves. Indian J. Anim. Res. 2018, 52, 1292–1297. [Google Scholar] [CrossRef]
- Troche, C.; Eicher, S.D.; Applegate, T.J. The Influence of Dietary Zinc Source and Coccidial Vaccine Exposure on Intracellular Zinc Homeostasis and Immune Status in Broiler Chickens. Br. J. Nutr. 2015, 114, 202–212. [Google Scholar] [CrossRef] [PubMed][Green Version]
- Nagalakshmi, D.; Sridhar, K.; Parashuramulu, S. Replacement of Inorganic Zinc with Lower Levels of Organic Zinc (Zinc Nicotinate) on Performance, Hematological and Serum Biochemical Constituents, Antioxidants Status, and Immune Responses in Rats. Vet. World 2015, 8, 1156–1162. [Google Scholar] [CrossRef]
- Sedigh, A.; Modaresi, M.; Pirestani, A. Effect of Organic and Mineral Zinc Supplement in Diet on Reproductive Hormones in Mice. Int. J. Anim. Vet. Adv. 2014, 6, 77–79. [Google Scholar] [CrossRef]
- Nitrayova, S.; Windisch, W.; von Heimendahl, E.; Müller, A.; Bartelt, J. Bioavailability of Zinc from Different Sources in Pigs. J. Anim. Sci. 2012, 90, 185–187. [Google Scholar] [CrossRef]
- Hill, D.A.; Peo, E.R.; Lewis, A.J.; Crenshaw, J.D. Zinc-Amino Acid Complexes for Swine. J. Anim. Sci. 1986, 63, 121–130. [Google Scholar] [CrossRef][Green Version]
- van Heugten, E.; Spears, J.W.; Kegley, E.B.; Ward, J.D.; Qureshi, M.A. Effects of Organic Forms of Zinc on Growth Performance, Tissue Zinc Distribution, and Immune Response of Weanling Pigs. J. Anim. Sci. 2003, 81, 2063–2071. [Google Scholar] [CrossRef]
- Wedekind, K.J.; Lewis, A.J.; Giesemann, M.A.; Miller, P.S. Bioavailability of Zinc from Inorganic and Organic Sources for Pigs Fed Corn-Soybean Meal Diets. J. Anim. Sci. 1994, 72, 2681–2689. [Google Scholar] [CrossRef]
- Medida, R.L.; Sharma, A.K.; Guo, Y.; Johnston, L.; Urriola, P.E.; Gomez, A.; Saqui-Salces, M. Dietary Zinc Restriction Affects the Expression of Genes Related to Immunity and Stress Response in the Small Intestine of Pigs. J. Nutr. Sci. 2022, 11, e104. [Google Scholar] [CrossRef]
- Bolger, A.M.; Lohse, M.; Usadel, B. Trimmomatic: A Flexible Trimmer for Illumina Sequence Data. Bioinformatics 2014, 30, 2114–2120. [Google Scholar] [CrossRef]
- Bray, N.L.; Pimentel, H.; Melsted, P.; Pachter, L. Near-Optimal Probabilistic RNA-Seq Quantification. Nat. Biotechnol. 2016, 34, 525–527. [Google Scholar] [CrossRef] [PubMed]
- Love, M.I.; Huber, W.; Anders, S. Moderated Estimation of Fold Change and Dispersion for RNA-Seq Data with DESeq2. Genome Biol. 2014, 15, 550. [Google Scholar] [CrossRef] [PubMed]
- Anders, S.; Huber, W. Differential Expression of RNA-Seq. Data at the Gene Level–the DESeq Package; European Molecular Biology Laboratory (EMBL): Heidelberg, Germany, 2012; ISBN 0926-3373. [Google Scholar]
- Thomas, P.D.; Campbell, M.J.; Kejariwal, A.; Mi, H.; Karlak, B.; Daverman, R.; Diemer, K.; Muruganujan, A.; Narechania, A. PANTHER: A Library of Protein Families and Subfamilies Indexed by Function. Genome Res. 2003, 13, 2129–2141. [Google Scholar] [CrossRef]
- Hung, Y.-T.; Zhu, J.; Shurson, G.C.; Urriola, P.E.; Saqui-Salces, M. Decreased Nutrient Digestibility Due to Viscosity Is Independent of the Amount of Dietary Fibre Fed to Growing Pigs. Br. J. Nutr. 2022, 127, 177–187. [Google Scholar] [CrossRef]
- Huan, Y.W.; Bengtsson, R.J.; MacIntyre, N.; Guthrie, J.; Finlayson, H.; Smith, S.H.; Archibald, A.L.; Ait-Ali, T. Lawsonia Intracellularis Exploits β-Catenin/Wnt and Notch Signalling Pathways during Infection of Intestinal Crypt to Alter Cell Homeostasis and Promote Cell Proliferation. PLoS ONE 2017, 12, e0173782. [Google Scholar] [CrossRef]
- Smith, S.H.; Wilson, A.D.; Van Ettinger, I.; Macintyre, N.; Archibald, A.L.; Ait-Ali, T. Down-Regulation of Mechanisms Involved in Cell Transport and Maintenance of Mucosal Integrity in Pigs Infected with Lawsonia Intracellularis. Vet. Res. 2014, 45, 55. [Google Scholar] [CrossRef]
- Huggett, J.; Dheda, K.; Bustin, S.; Zumla, A. Real-Time RT-PCR Normalisation; Strategies and Considerations. Genes. Immun. 2005, 6, 279–284. [Google Scholar] [CrossRef]
- Livak, K.J.; Schmittgen, T.D. Analysis of Relative Gene Expression Data Using Real-Time Quantitative PCR and the 2−ΔΔCT Method. Methods 2001, 25, 402–408. [Google Scholar] [CrossRef]
- Resende, T.P.; Medida, R.L.; Vannucci, F.A.; Saqui-Salces, M.; Gebhart, C. Evaluation of Swine Enteroids as in Vitro Models for Lawsonia Intracellularis Infection. J. Anim. Sci. 2020, 98, skaa011. [Google Scholar] [CrossRef] [PubMed]
- Szczurek, E.I.; Bjornsson, C.S.; Taylor, C.G. Dietary Zinc Deficiency and Repletion Modulate Metallothionein Immunolocalization and Concentration in Small Intestine and Liver of Rats. J. Nutr. 2001, 131, 2132–2138. [Google Scholar] [CrossRef] [PubMed]
- Brugger, D.; Buffler, M.; Windisch, W. Development of an Experimental Model to Assess the Bioavailability of Zinc in Practical Piglet Diets. Arch. Anim. Nutr. 2014, 68, 73–92. [Google Scholar] [CrossRef] [PubMed]
- Martin, L.; Lodemann, U.; Bondzio, A.; Gefeller, E.-M.; Vahjen, W.; Aschenbach, J.R.; Zentek, J.; Pieper, R. A High Amount of Dietary Zinc Changes the Expression of Zinc Transporters and Metallothionein in Jejunal Epithelial Cells in Vitro and in Vivo but Does Not Prevent Zinc Accumulation in Jejunal Tissue of Piglets. J. Nutr. 2013, 143, 1205–1210. [Google Scholar] [CrossRef] [PubMed]
- Brugger, D.; Hanauer, M.; Ortner, J.; Windisch, W.M. The Response of Zinc Transporter Gene Expression of Selected Tissues in a Pig Model of Subclinical Zinc Deficiency. J. Nutr. Biochem. 2020, 90, 108576. [Google Scholar] [CrossRef]
- Yi, G.F.; Carroll, J.A.; Allee, G.L.; Gaines, A.M.; Kendall, D.C.; Usry, J.L.; Toride, Y.; Izuru, S. Effect of Glutamine and Spray-Dried Plasma on Growth Performance, Small Intestinal Morphology, and Immune Responses of Escherichia Coli K88 +-Challenged Weaned Pigs. J. Anim. Sci. 2005, 83, 634–643. [Google Scholar] [CrossRef]
- Hyun, Y.; Ellis, M.; Riskowski, G.; Johnson, R.W. Growth Performance of Pigs Subjected to Multiple Concurrent Environmental Stressors. J. Anim. Sci. 1998, 76, 721–727. [Google Scholar] [CrossRef]
- da Fonseca de Oliveira, A.C.; Vanelli, K.; Sotomaior, C.S.; Weber, S.H.; Costa, L.B. Impacts on Performance of Growing-Finishing Pigs under Heat Stress Conditions: A Meta-Analysis. Vet. Res. Commun. 2019, 43, 37–43. [Google Scholar] [CrossRef]
- Thomke, S.; Elwinger, K. Growth Promotants in Feeding Pigs and Poultry. I. Growth and Feed Efficiency Responses to Antibiotic Growth Promotants. Ann. Zootech. 1998, 47, 85–97. [Google Scholar] [CrossRef]
- Borah, S.; Sarmah, B.C.; Chakravarty, P.; Naskar, S.; Dutta, D.J.; Kalita, D. Effect of Zinc Supplementation on Serum Biochemicals in Grower Pig. J. Appl. Anim. Res. 2014, 42, 244–248. [Google Scholar] [CrossRef]
- Roberts, E.S.; Van Heugten, E.; Lloyd, K.; Almond, G.W.; Spears, J.W. Dietary Zinc Effects on Growth Performance and Immune Response of Endotoxemic Growing Pigs. Asian Australas. J. Anim. Sci. 2002, 15, 1496–1501. [Google Scholar] [CrossRef]
- Hill, G.M.; Miller, E.R.; Stowe, H.D. Effect of Dietary Zinc Levels on Health and Productivity of Gilts and Sows through Two Parities. J. Anim. Sci. 1983, 57, 114–122. [Google Scholar] [CrossRef] [PubMed]
- Pieper, R.; Dadi, T.H.; Pieper, L.; Vahjen, W.; Franke, A.; Reinert, K.; Zentek, J. Concentration and Chemical Form of Dietary Zinc Shape the Porcine Colon Microbiome, Its Functional Capacity and Antibiotic Resistance Gene Repertoire. ISME J. 2020, 14, 2783–2793. [Google Scholar] [CrossRef] [PubMed]
- Gack, M.U.; Shin, Y.C.; Joo, C.H.; Urano, T.; Liang, C.; Sun, L.; Takeuchi, O.; Akira, S.; Chen, Z.; Inoue, S.; et al. TRIM25 RING-Finger E3 Ubiquitin Ligase Is Essential for RIG-I-Mediated Antiviral Activity. Nature 2007, 446, 916–920. [Google Scholar] [CrossRef] [PubMed]
- Nowarski, R.; Jackson, R.; Gagliani, N.; de Zoete, M.R.; Palm, N.W.; Bailis, W.; Low, J.S.; Harman, C.C.D.; Graham, M.; Elinav, E.; et al. Epithelial IL-18 Equilibrium Controls Barrier Function in Colitis. Cell 2015, 163, 1444–1456. [Google Scholar] [CrossRef]
- Bortoluzzi, C.; Lumpkins, B.; Mathis, G.F.; França, M.; King, W.D.; Graugnard, D.E.; Dawson, K.A.; Applegate, T.J. Zinc Source Modulates Intestinal Inflammation and Intestinal Integrity of Broiler Chickens Challenged with Coccidia and Clostridium Perfringens. Poult. Sci. 2019, 98, 2211–2219. [Google Scholar] [CrossRef]


| Item | Diet Composition |
|---|---|
| Ingredients (%) | |
| Corn | 68.15 |
| Soybean meal | 27.50 |
| Soybean oil | 1.00 |
| Zn-free vitamin and mineral premix | 3.35 |
| Total | 100.00 |
| Calculated (%) | |
| Dry matter | 85.93 |
| Crude protein | 18.74 |
| Metabolizable energy (kcal/kg) | 3305 |
| SID AA (%) * | |
| Lys | 0.88 |
| Met | 0.27 |
| Thr | 0.58 |
| Trp | 0.20 |
| Leu | 1.45 |
| Ile | 0.68 |
| Val | 0.75 |
| Calcium (%) | 0.77 |
| Phosphorus (%) | 0.66 |
| Vitamin/Trace Mineral | Concentration Per kg of Premix |
|---|---|
| Vitamin A | 245,152 I.U. * |
| Vitamin D3 | 45,966 I.U. |
| Vitamin E | 919 I.U. |
| Vitamin K | 92 mg |
| Niacin | 919 mg |
| Pantothenic acid | 613 mg |
| Riboflavin | 153 mg |
| Vitamin B12 | 919 µg |
| Copper | 107 mg |
| Iodine | 8.2 mg |
| Iron | 917 mg |
| Manganese | 153 mg |
| Selenium | 8.2 mg |
| Calcium | 21.4% of mix |
| Phosphorus | 8.53% of mix |
| Salt | 12.4% of mix |
| Gene * | Forward Primer | Reverse Primer |
|---|---|---|
| GAPDH | ATCCTGGGCTACACTGAGGAC | AAGTGGTCGTTGAGGGCAATG |
| IL18 | ACCCGTATCCCCAAGATCCA | TTGCGCTTGATGAGGACAG |
| MT1 | GCTGTGCCTGATGTGACGAA | AGGAAGACGCTGGGTTGGT |
| TLR2 | TCCCCAGCGTTTCTGTAAGC | ATGAACGCAGCCCAGGACTA |
| ZIP4 | CTGCACACACATGATGGGGA | GGTTGAAAAGGCTCTCGAACA |
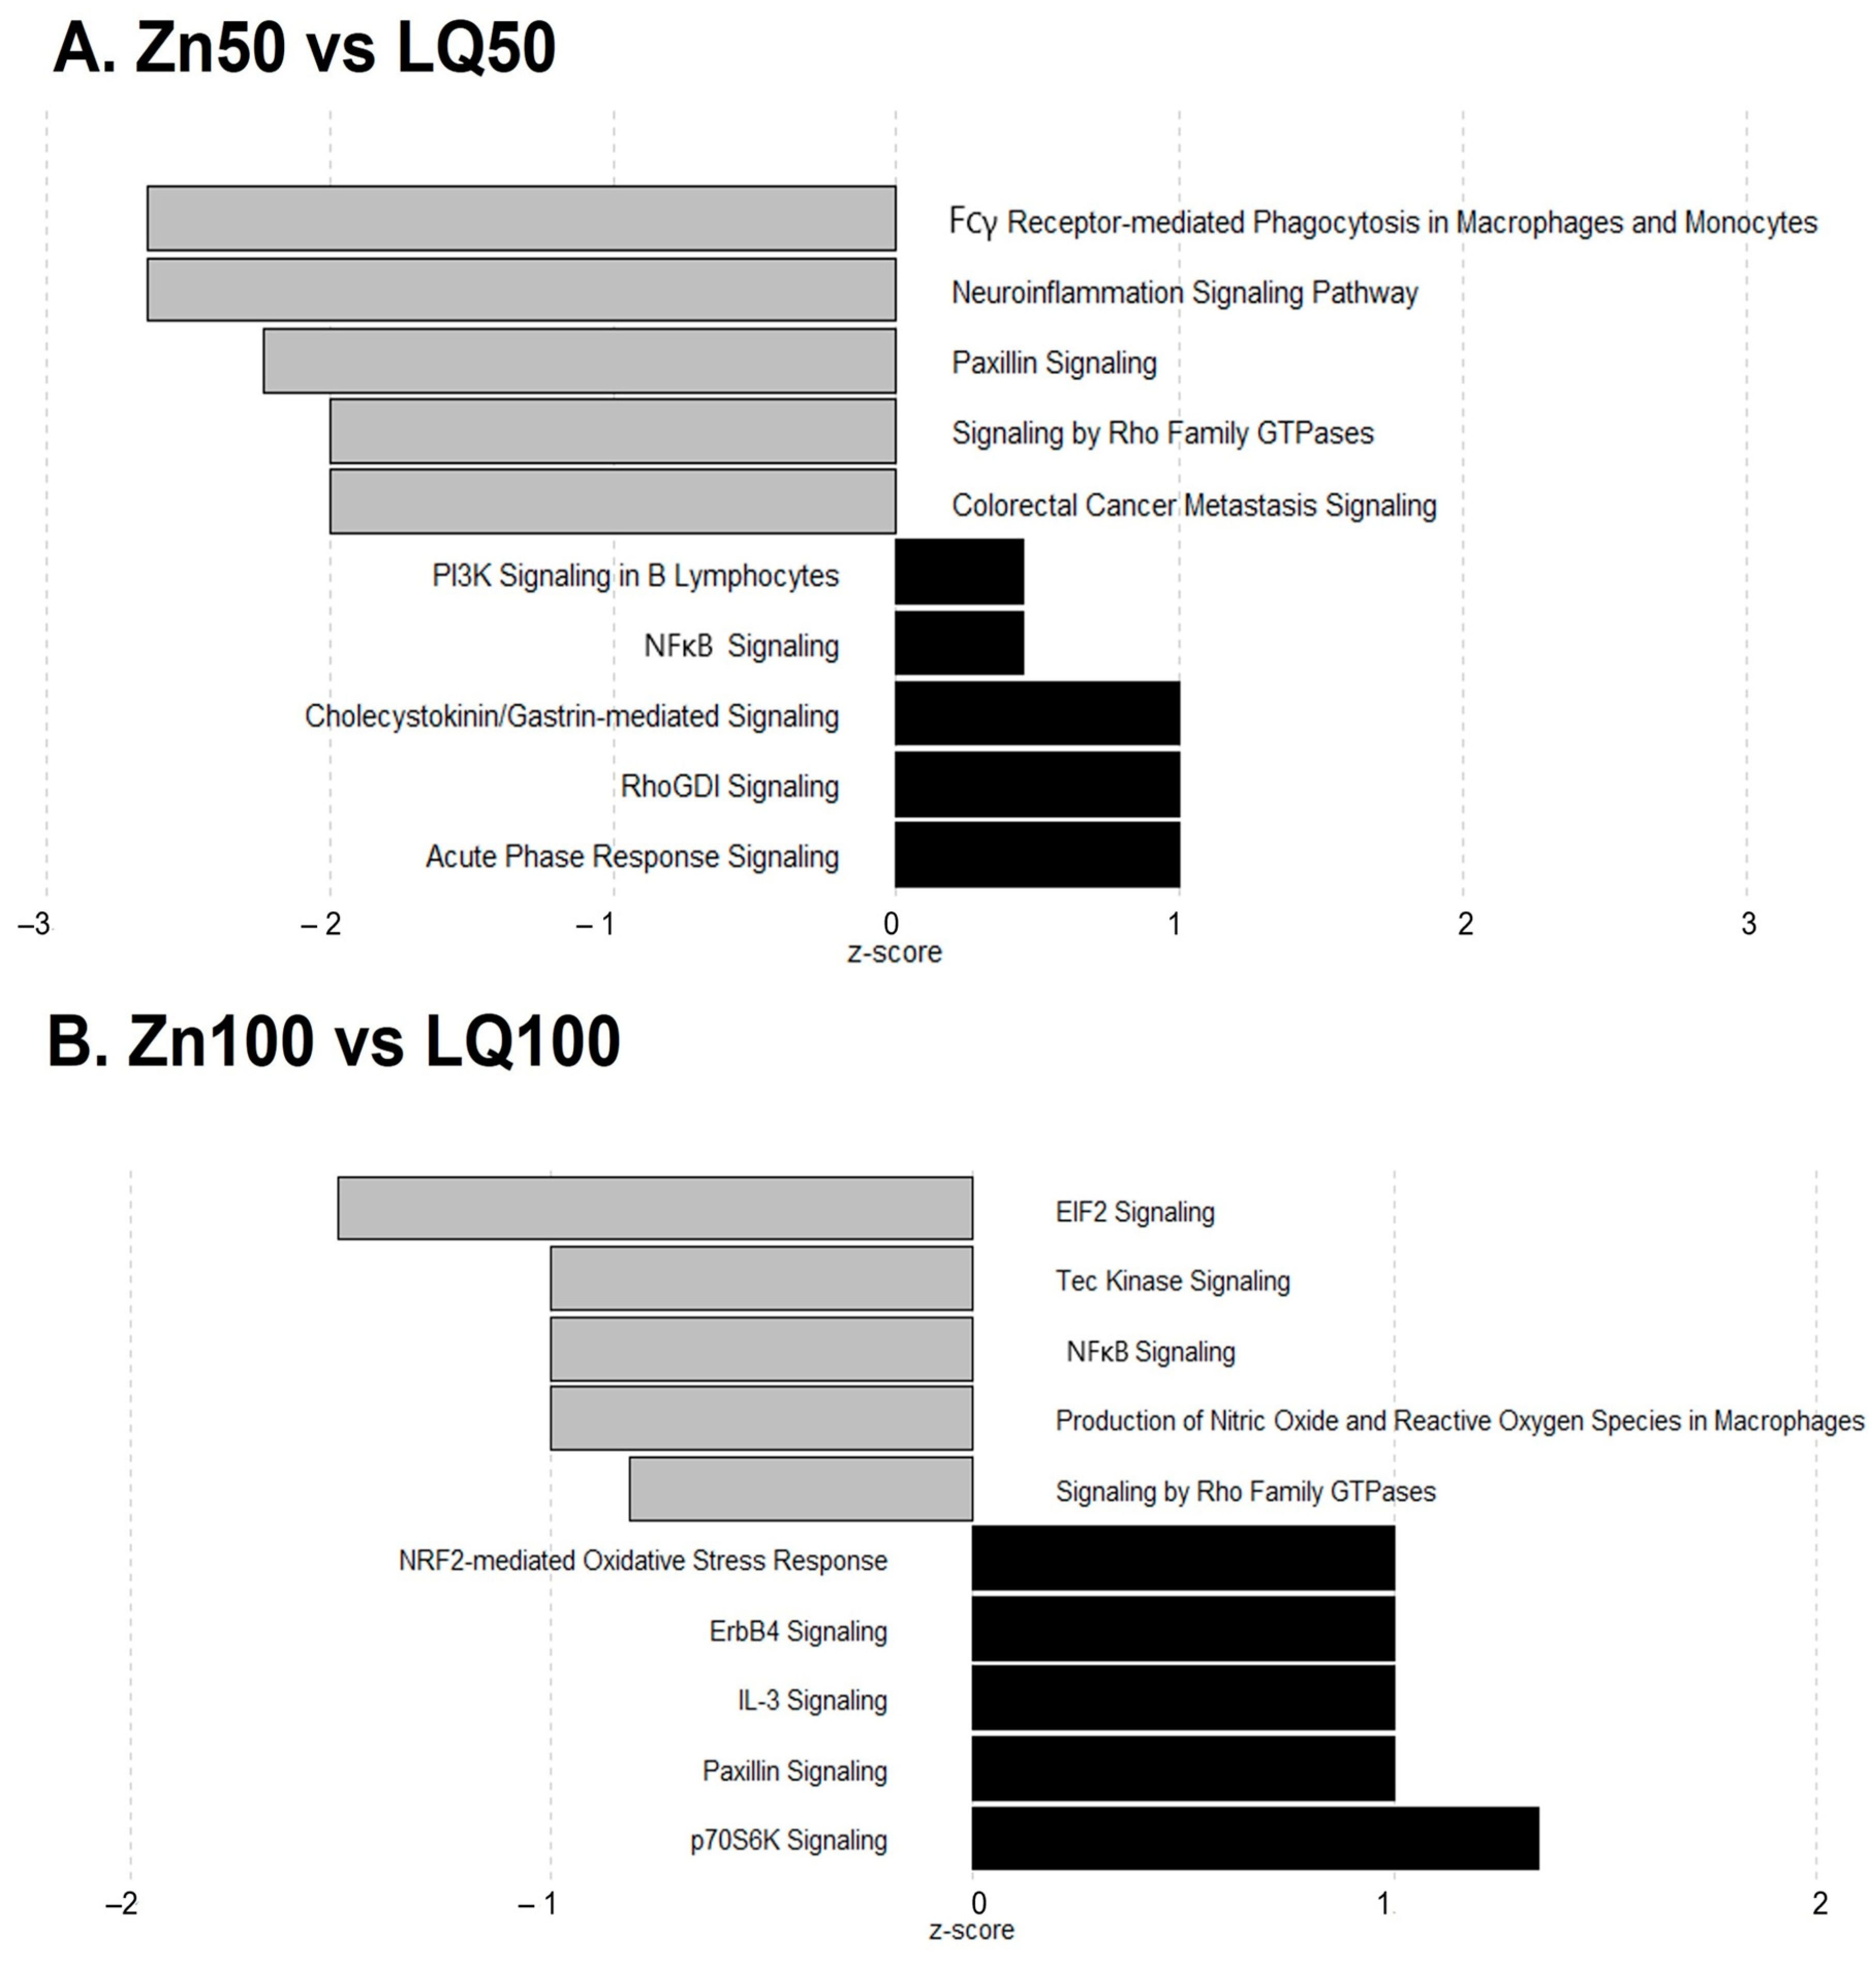
| Pathways | −log (p-Value) | z Score | Ratio | Genes |
|---|---|---|---|---|
| Neuroinflammation Signaling Pathway | 1.87 × 100 | −2.646 | 2.24 × 10⁻² | IL18, IRF7, NOS2, NFATC2, TLR2, TBK1, MAPK3 |
| Fcγ Receptor-mediated Phagocytosis in Macrophages and Monocytes | 5.02 × 100 | −2.646 | 7.61 × 10⁻² | ACTG1, ACTB, NCK2, FYB1, ARF6, RAC1, MAPK3 |
| Paxillin Signaling | 2.53 × 100 | −2.236 | 4.13 × 10⁻² | ACTG1, ACTB, NCK2, ARF6, RAC1 |
| Colorectal Cancer Metastasis Signaling | 8.24 × 10⁻¹ | −2.000 | 1.57 × 10⁻² | NOS2, TLR2, RAC1, MAPK3 |
| Signaling by Rho Family GTPases | 8.37 × 10⁻¹ | −2.000 | 1.59 × 10⁻² | ACTG1, ACTB, RAC1, MAPK3 |
| Agrin Interactions at Neuromuscular Junction | 2.50 × 100 | −2.000 | 5.33 × 10⁻² | ACTG1, ACTB, RAC1, MAPK3 |
| Integrin Signaling | 4.11 × 100 | −1.414 | 4.07 × 10⁻² | TSPAN1, ACTG1, ACTB, CAPN1, NCK2, ARF6, TNK2, RAC1, MAPK3 |
| Actin Cytoskeleton Signaling | 1.41 × 100 | −1.342 | 2.16 × 10⁻² | ACTG1, ACTB, MYH11, RAC1, MAPK3 |
| Death Receptor Signaling | 3.03 × 100 | −1.342 | 5.38 × 10⁻² | APAF1, ACTG1, ACTB, PARP9, TBK1 |
| Production of Nitric Oxide and Reactive Oxygen Species in Macrophages | 2.97 × 100 | −1.134 | 3.57 × 10⁻² | NOS2, PTPA, ARG2, APOC3, TLR2, RAC1, MAPK3 |
| Opioid Signaling Pathway | 8.64 × 10⁻¹ | −1.000 | 1.63 × 10⁻² | CLTA, RAC1, AP1B1, MAPK3 |
| Huntington’s Disease Signaling | 1.79 × 100 | −1.000 | 2.38 × 10⁻² | APAF1, CLTA, TCERG1, PLCB4, CAPN1, MAPK3 |
| Role of Pattern Recognition Receptors in Recognition of Bacteria and Viruses | 2.27 × 100 | −1.000 | 3.60 × 10⁻² | IL18, IRF7, C3, TLR2, MAPK3 |
| ILK Signaling | 2.96 × 100 | −0.816 | 3.55 × 10⁻² | NOS2, ACTG1, ACTB, PTPA, NCK2, MYH11, MAPK3 |
| LXR/RXR Activation | 3.35 × 100 | −0.816 | 4.96 × 10⁻² | IL18, NOS2, C3, ARG2, APOC3, IL33 |
| Protein Kinase A Signaling | 6.61 × 10⁻¹ | −0.447 | 1.25 × 10⁻² | ANAPC13, SMPDL3B, NFATC2, PLCB4, MAPK3 |
| Dendritic Cell Maturation | 1.67 × 100 | 0.447 | 2.55 × 10⁻² | IL18, PLCB4, TLR2, IL33, MAPK3 |
| NF-κB Signaling | 1.75 × 100 | 0.447 | 2.67 × 10⁻² | IL18, TNIP1, TLR2, IL33, TBK1 |
| PI3K Signaling in B Lymphocytes | 2.32 × 100 | 0.447 | 3.70 × 10⁻² | NFATC2, C3, PLCB4, RAC1, MAPK3 |
| Acute Phase Response Signaling | 1.27 × 100 | 1.000 | 2.27 × 10⁻² | IL18, C3, IL33, MAPK3 |
| RhoGDI Signaling | 1.28 × 100 | 1.000 | 2.29 × 10⁻² | ACTG1, ACTB, ARHGDIA, RAC1 |
| Cholecystokinin/Gastrin-mediated Signaling | 1.96 × 100 | 1.000 | 3.74 × 10⁻² | IL18, PLCB4, IL33, MAPK3 |
| Pathways | −log (p-Value) | z Score | Ratio | Genes |
|---|---|---|---|---|
| EIF2 Signaling | 1.19 × 101 | −1.508 | 8.30 × 10⁻² | EIF3G, RPL32, RPL13, SOS1, RPL26, RPS3, RALB, RPL8, ATF4, EIF3E, RPS9, RPL18, RPL24, RPS11, EIF3H, EIF3K, RPS28, PIK3C3, RPL10A |
| Production of Nitric Oxide and Reactive Oxygen Species in Macrophages | 9.06 × 10⁻¹ | −1.000 | 2.04 × 10⁻² | RHOH, PRKCD, IRF8, PIK3C3 |
| NF-κB Signaling | 9.60 × 10⁻¹ | −1.000 | 2.14 × 10⁻² | RALB, MAP4K4, LCK, PIK3C3 |
| Tec Kinase Signaling | 1.07 × 100 | −1.000 | 2.34 × 10⁻² | RHOH, PRKCD, LCK, PIK3C3 |
| Signaling by Rho Family GTPases | 1.43 × 100 | −0.816 | 2.38 × 10⁻² | RHOH, ARHGEF2, ARPC4, MYLK, PLD1, PIK3C3 |
| Superpathway of Inositol Phosphate Compounds | 1.54 × 100 | −0.816 | 2.53 × 10⁻² | DUSP5, IPPK, LCK, PPM1H, PTPRF, PIK3C3 |
| ERK/MAPK Signaling | 1.82 × 100 | −0.816 | 2.93 × 10⁻² | RALB, PRKCD, ATF4, SOS1, PIK3C3, PLA2G2A |
| Colorectal Cancer Metastasis Signaling | 9.85 × 10⁻¹ | −0.447 | 1.96 × 10⁻² | RALB, RHOH, TCF3, SOS1, PIK3C3 |
| 3-phosphoinositide Biosynthesis | 1.32 × 100 | −0.447 | 2.48 × 10⁻² | DUSP5, LCK, PPM1H, PTPRF, PIK3C3 |
| PPARα/RXRα Activation | 1.45 × 100 | −0.447 | 2.69 × 10⁻² | RALB, MAP4K4, ACOX1, SOS1, GPD2 |
| Gαq Signaling | 1.67 × 100 | −0.447 | 3.09 × 10⁻² | RHOH, PRKCD, PLD3, PLD1, PIK3C3 |
| ILK Signaling | 1.89 × 100 | −0.447 | 3.05 × 10⁻² | RHOH, MYH14, ATF4, FBLIM1, PARVA, PIK3C3 |
| SAPK/JNK Signaling | 2.32 × 100 | −0.447 | 4.46 × 10⁻² | RALB, MAP4K4, LCK, SOS1, PIK3C3 |
| IL-8 Signaling | 2.41 × 100 | −0.378 | 3.43 × 10⁻² | RALB, RHOH, PRKCD, MAP4K4, PLD3, PLD1, PIK3C3 |
| Endothelin-1 Signaling | 2.47 × 100 | 0.378 | 3.52 × 10⁻² | RALB, PRKCD, PLD3, PLD1, SOS1, PIK3C3, PLA2G2A |
| Integrin Signaling | 2.83 × 100 | 0.378 | 3.62 × 10⁻² | RALB, RHOH, ARPC4, MYLK, TSPAN5, PARVA, SOS1, PIK3C3 |
| Opioid Signaling Pathway | 1.03 × 100 | 0.447 | 2.03 × 10⁻² | RALB, PRKCD, ATF4, LCK, SOS1 |
| Fc Epsilon RI Signaling | 2.09 × 100 | 0.447 | 3.94 × 10⁻² | RALB, PRKCD, SOS1, PIK3C3, PLA2G2A |
| NGF Signaling | 2.12 × 100 | 0.447 | 4.00 × 10⁻² | RALB, PRKCD, ATF4, SOS1, PIK3C3 |
| VEGF Family Ligand–Receptor Interactions | 2.61 × 100 | 0.447 | 5.21 × 10⁻² | RALB, PRKCD, SOS1, PIK3C3, PLA2G2A |
| Glioblastoma Multiforme Signaling | 2.19 × 100 | 0.816 | 3.53 × 10⁻² | RALB, RHOH, PRKCD, TCF3, SOS1, PIK3C3 |
| Thrombin Signaling | 2.33 × 100 | 0.816 | 3.32 × 10⁻² | RALB, RHOH, PRKCD, ARHGEF2, MYLK, SOS1, PIK3C3 |
| GNRH Signaling | 1.07 × 100 | 1.000 | 2.35 × 10⁻² | RALB, PRKCD, ATF4, SOS1 |
| Role of NFAT in Cardiac Hypertrophy | 1.15 × 100 | 1.000 | 2.21 × 10⁻² | RALB, PRKCD, SLC8A1, SOS1, PIK3C3 |
| Insulin Receptor Signaling | 1.26 × 100 | 1.000 | 2.72 × 10⁻² | RALB, PTPRF, SOS1, PIK3C3 |
| Renin-Angiotensin Signaling | 1.42 × 100 | 1.000 | 3.08 × 10⁻² | RALB, PARVA, SOS1, PIK3C3 |
| Glioma Signaling | 1.50 × 100 | 1.000 | 3.28 × 10⁻² | RALB, PARVA, SOS1, PIK3C3 |
| HGF Signaling | 1.52 × 100 | 1.000 | 3.31 × 10⁻² | RALB, PARVA, SOS1, PIK3C3 |
| Paxillin Signaling | 1.52 × 100 | 1.000 | 3.31 × 10⁻² | RALB, PARVA, SOS1, PIK3C3 |
| Cholecystokinin/Gastrin-mediated Signaling | 1.69 × 100 | 1.000 | 3.74 × 10⁻² | RALB, RHOH, PRKCD, SOS1 |
| ErbB Signaling | 1.70 × 100 | 1.000 | 3.77 × 10⁻² | RALB, PRKCD, SOS1, PIK3C3 |
| Prolactin Signaling | 1.92 × 100 | 1.000 | 4.40 × 10⁻² | RALB, PRKCD, SOS1, PIK3C3 |
| IL-3 Signaling | 1.94 × 100 | 1.000 | 4.44 × 10⁻² | RALB, PRKCD, SOS1, PIK3C3 |
| ErbB4 Signaling | 2.11 × 100 | 1.000 | 5.00 × 10⁻² | RALB, PRKCD, SOS1, PIK3C3 |
| Thrombopoietin Signaling | 2.27 × 100 | 1.000 | 5.56 × 10⁻² | RALB, PRKCD, SOS1, PIK3C3 |
| NRF2-mediated Oxidative Stress Response | 2.43 × 100 | 1.000 | 3.47 × 10⁻² | RALB, DNAJC6, PRKCD, ATF4, GSR, MGST3, PIK3C3 |
| p70S6K Signaling | 1.92 × 100 | 1.342 | 3.57 × 10⁻² | RALB, PRKCD, PLD1, SOS1, PIK3C3 |
Disclaimer/Publisher’s Note: The statements, opinions and data contained in all publications are solely those of the individual author(s) and contributor(s) and not of MDPI and/or the editor(s). MDPI and/or the editor(s) disclaim responsibility for any injury to people or property resulting from any ideas, methods, instructions or products referred to in the content. |
© 2023 by the authors. Licensee MDPI, Basel, Switzerland. This article is an open access article distributed under the terms and conditions of the Creative Commons Attribution (CC BY) license (https://creativecommons.org/licenses/by/4.0/).
Share and Cite
Medida, R.L.; Sharma, A.K.; Guo, Y.; Johnston, L.J.; Urriola, P.E.; Gomez, A.; Saqui-Salces, M. Dietary Zinc Supplemented in Organic Form Affects the Expression of Inflammatory Molecules in Swine Intestine. Animals 2023, 13, 2519. https://doi.org/10.3390/ani13152519
Medida RL, Sharma AK, Guo Y, Johnston LJ, Urriola PE, Gomez A, Saqui-Salces M. Dietary Zinc Supplemented in Organic Form Affects the Expression of Inflammatory Molecules in Swine Intestine. Animals. 2023; 13(15):2519. https://doi.org/10.3390/ani13152519
Chicago/Turabian StyleMedida, Ramya Lekha, Ashok Kumar Sharma, Yue Guo, Lee J. Johnston, Pedro E. Urriola, Andres Gomez, and Milena Saqui-Salces. 2023. "Dietary Zinc Supplemented in Organic Form Affects the Expression of Inflammatory Molecules in Swine Intestine" Animals 13, no. 15: 2519. https://doi.org/10.3390/ani13152519
APA StyleMedida, R. L., Sharma, A. K., Guo, Y., Johnston, L. J., Urriola, P. E., Gomez, A., & Saqui-Salces, M. (2023). Dietary Zinc Supplemented in Organic Form Affects the Expression of Inflammatory Molecules in Swine Intestine. Animals, 13(15), 2519. https://doi.org/10.3390/ani13152519