Article

De Novo Assembly, Characterization and Comparative Transcriptome Analysis of the Mature Gonads in Spinibarbus hollandi

1
School of Life Sciences, Guangzhou University, Guangzhou 510006, China
2
Key Laboratory for Water Quality and Conservation of the Pearl River Delta, Ministry of Education, School of Environmental Science and Engineering, Guangzhou University, Guangzhou 510006, China
*
Authors to whom correspondence should be addressed.
Animals 2023, 13(1), 166; https://doi.org/10.3390/ani13010166
Submission received: 1 December 2022 / Revised: 26 December 2022 / Accepted: 29 December 2022 / Published: 31 December 2022

Abstract

:

Simple Summary

Spinibarbus hollandi has been recognized as an economically important aquaculture species in southeastern China. However, the information on its reproductive regulation is scarce. The long maturity period and low egg laying amount remain a major challenge for large-scale breeding of S. hollandi. In the current study, the gonad transcriptomes of S. hollandi were first obtained through Illumina Novaseq technology. By transcriptome comparing of ovary and testis, a lot of differential expression genes were identified and most of them were supposed to participate in gonad formation, differentiation and gametogenesis. Moreover, the expression levels of some typic reproductive genes indicated they might play similar roles in gonad differentiation and development of S. hollandi. Finally, the gonad transcriptome information can help researchers understand the regulatory functions of sex-related genes in S. hollandi.

Abstract

Spinibarbus hollandi is an important commercial aquaculture species in southeastern China, but with long maturity period and low egg laying amount. However, there has been little study of its gonad development and reproductive regulation, which limits aquaculture production. Here, for the first time, gonadal transcriptomes of male and female S. hollandi were analyzed. A total of 167,152 unigenes were assembled, with only 48,275 annotated successfully. After comparison, a total of 21,903 differentially expressed genes were identified between male and female gonads, of which 16,395 were upregulated and 5508 were downregulated in the testis. In addition, a large number of differentially expressed genes participating in reproduction, gonad formation and differentiation, and gametogenesis were screened out and the differential expression profiles of partial genes were further validated using quantitative real-time PCR. These results will provide basic information for further research on gonad differentiation and development in S. hollandi.

1. Introduction

Spinibarbus hollandi, belonging to the subfamily Barbinae of Cyprinidae, is an important commercial aquaculture species in southeastern China, which is mainly distributed in Guangdong, Guangxi, Hunan, Hubei, Fujian, Anhui and Taiwan Provinces. S. hollandi has high nutritional value and medicinal value, and is popular as a table fish [1]. S. hollandi is an omnivorous species, which feeds mainly on aquatic insects, small fish, shrimp, and even blue-green algae and organic detritus [2]. Although S. hollandi is easy-to-raise, its growth rate is relatively slow, which limits the aquaculture efficiency and popularization of S. hollandi [3]. In recent years, due to its good taste and beautiful appearance, S. hollandi is increasingly becoming a popular fish with considerable economic value especially in south China. S. hollandi is a gonochoristic fish species, where males mature earlier than females. The age of first maturation of S. hollandi normally takes 3 to 4 years in south China. In addition, although S. hollandi is a cyprinid fish, only a few thousand eggs are laid at one time for female fish [4]. However, dozens to millions of eggs are laid at one time in grass carp and common carp. In short, long maturity period and low egg laying amount are critical factors limiting the yield increase of S. hollandi. Thus, it is extremely important to develop our understanding of the reproductive biology of this species.
For fish, gonadal development, differentiation and maturation are more complex than other vertebrates, which are easily influenced by the environmental factors [5]. In recent years, cumulative practices have shown that understanding the mechanisms of reproductive regulation is critically important for reproduction management and breeding practice. However, previous studies mainly focused on genetic resources, rearing conditions, morphology and molecular markers associated with growth of S. hollandi [3], whereas less attention was paid to gonadal development, differentiation, maturation and gametogenesis. Thus, to better understand the reproductive mechanisms and facilitate reproductive regulation, it is necessary to explore the functional genes associated with gonad development and differentiation, and gametogenesis.
Despite the rapid development of next generation sequencing (NGS) technology, the available genetic information on S. hollandi is rather limited. Only brain and muscle transcriptome data were published to explore the mechanism of starvation response and compensatory growth [6,7]. Up to now, nearly no reproduction-related gene was characterized and fundamental information of their expression is still lacking. Due to low cost and high throughput, NGS-based transcriptome sequencing has been a most effective method to generate a large number of transcripts and gene expression profiles in recent years [8]. It has been widely used for functional gene discovery and analysis of gene expression in teleosts. In addition, using gonad comparative transcriptome analysis, the expression patterns of reproduction-related genes have been revealed in many fish species such as Spot-fin porcupine fish (Diodon hystrix) [9], spotted scat (Scatophagus argus) [10], spotted knifejaw (Oplegnathus punctatus) [11], yellow catfish (Pleteobagrus fulvidraco) [12], mandarin fish (Siniperca chuatsi) [13] and so on. All these studies characterized a lot of candidate reproduction-related genes and provided basic information for reproductive regulation.
In this study, for the first time, Illumina-based transcriptome sequencing and de novo assembly of female and male gonads was carried out in S. hollandi. After comparative transcriptome analysis, a large number of sex-biased genes were uncovered and differentially expressed genes involved in reproductive regulation were also identified and discussed. Our data will enrich the currently available genetic and genomic data on S. hollandi, and identify candidate genes participating in gonad differentiation, development, maturation, and gametogenesis.

2. Materials and Methods

2.1. Sample Collection

In this study, six 4-year-old S. hollandi individuals (three males and three females) were obtained from an aquaculture farm in Shaoguan, Guangdong province. The fish were anesthetized with MS-222 before euthanizing them. Gonads from each individual were collected and stored in liquid nitrogen immediately. All animal handling procedures and experimental protocols were approved by the Experimental Animal Ethics Committee of the Guangzhou University of China (No. GURBBB210405).

2.2. RNA Extraction and Library Construction

Total RNA was extracted from fresh frozen tissue using RNA isolater Total RNA Extraction Reagent (Vazyme, Nanjing, China) according to the manufacturer’s instructions. The RNA concentration and purity were detected preliminarily using the Nanodrop2000 (Thermo Scientific, Wilmington, DE, USA). Then, integrity detection and quantification of RNA was carried out by Agilent 4200 Bioanalyzer (Agilent Technologies, Santa Clara, CA, USA). Eukaryotic transcriptome libraries were constructed using NEBNext® Ultra™ RNA Library Prep Kit for Illumina® (NEB, Ipswich, MA, USA). Eukaryotic mRNAs were enriched using magnetic beads with Oligo (dT). In a high temperature environment with metal ions, the RNA was fragmented and the first cDNA chain was synthesized with random hexamers, followed by the addition of enzyme, buffer, dNTPs (dATP, dTTP, dGTP, dCTP) to synthesis the second chain of cDNA. The synthesized double-stranded cDNA was purified by magnetic beads and repaired, and additional A was ligated to the tail end of cDNA, and the sequencing connector was connected. The sorted magnetic beads were used for fragment size sorting, and the sorted fragments were enriched by PCR, and finally purified to obtain the final library.

2.3. Library Sequencing, De Novo Assembly and Annotation

Using the Illumina Novaseq 6000 (Illumina, Inc., San Diego, CA, USA) high-throughput sequencing platform, the qualified libraries were sequenced with the sequencing strategy was Pair-End 150 (PE150). The amount of sequencing data for each library was not less than 6 Gb.
In order to obtain high quality assembly results for subsequent analysis, the raw reads were filtered, and low-quality reads with unknown base N beyond 5% and joint contamination were discarded. The remaining reads, also called “Clean reads”, were saved in FASTQ format. Then, using Trinity software, de novo assembly was carried out [14].
The coding region of Unigene was predicted by three forward and reverse reading frames, which could produce altogether 6 kinds of coding protein sequences. After obtaining the coding protein sequences, the protein sequences were compared with the non-redundant protein sequences (Nr) (https://www.ncbi.nlm.nih.gov/ (accessed on 20 April 2021)) and the Uniprot protein (https://www.uniprot.org/ (accessed on 20 June 2021)) database. The encoding method with the best alignment (the largest alignment score) was chosen as the encoding method of the gene.
Using homology searches, unigenes were annotated against five major public databases including Nr database, the Clusters of euKaryotic Orthologous Groups (KOG, http://www.ncbi.nlm.nih.gov/KOG (accessed on 27 June 2021)) database, the Kyoto Encyclopedia of Genes and Genomes (KEGG, http://www.genome.jp/kegg (accessed on 17 July 2021)) and the Uniprot protein database using BLASTx or Diamond. The NR results were further annotated by Blast2GO [15], and the unigenes were further grouped (GO, http://geneontology.org (accessed on 25 July 2021)) according to the classification of biological process, cell composition and molecular function.

2.4. Identification of Differentially Expressed Genes and Enrichment Analysis

The clean reads of each sample are first mapped to the assembled transcripts using hisat2 v2.1.0 [16]. Then, the transcripts per million (TPM), fragments per kilobase of exon model per million mapped fragments (FPKM), coverage and other gene-expression-related values were further calculated using stringtie v1.3.3b according to the comparison results [17]. Finally, using python prepDE.py, the output result of stringtie software was converted into a format recognized by the “edgeR” package (V3.6) [18,19], and the differential gene expression was analyzed using edgeR. The genes with p-value < 0.05 and |log2FC| > 2 are set as significantly differentially expressed genes (DEGs). The number of differentially expressed genes was counted by statistical significance, and then the clusterProfiler program of the R package [20] was applied against the background of DEGs. Based on Fisher’s exact test and Benjamini correction, the pathways that were significantly enriched in differentially expressed genes compared with the whole genome background with p value < 0.05 were considered to be significantly enriched.

2.5. Validation of DEGs Using Quantitative Real-Time PCR

The quantitative real-time PCR (qRT-PCR) analysis was used to validate the reliability of these DEGs. A total of 14 differentially expressed reproduction-related genes were randomly selected for validation. First, based on the sequences of 14 differentially expressed reproduction-related genes and reference gene β-actin, specific primers were designed by Primer Premier 5.0 (Table 1). Then, the HiScript III RT SuperMix for qPCR (+gDNA wiper) (Vazyme, Nanjing, China) was used for synthesizing cDNA template. Each qRT-PCR was carried out using SYBR Green qPCR Mix (GDSBIO, Guangzhou, China) on a LightCycle 480 system. The qRT-PCR reaction included an initial denaturation step at 95 °C for 3 min, followed by 40 cycles of 95 °C for 10 s, 60 °C for 20 s and 72 °C for 20 s, and a final extension at 72 °C for 5 min, ending with a dissociation curve process. Each sample was amplified in triplicate, and the expression of each gene was normalized using β-actin by the comparative CT method (2-ΔΔCT) [21] and was shown as mean ± standard error.

3. Results

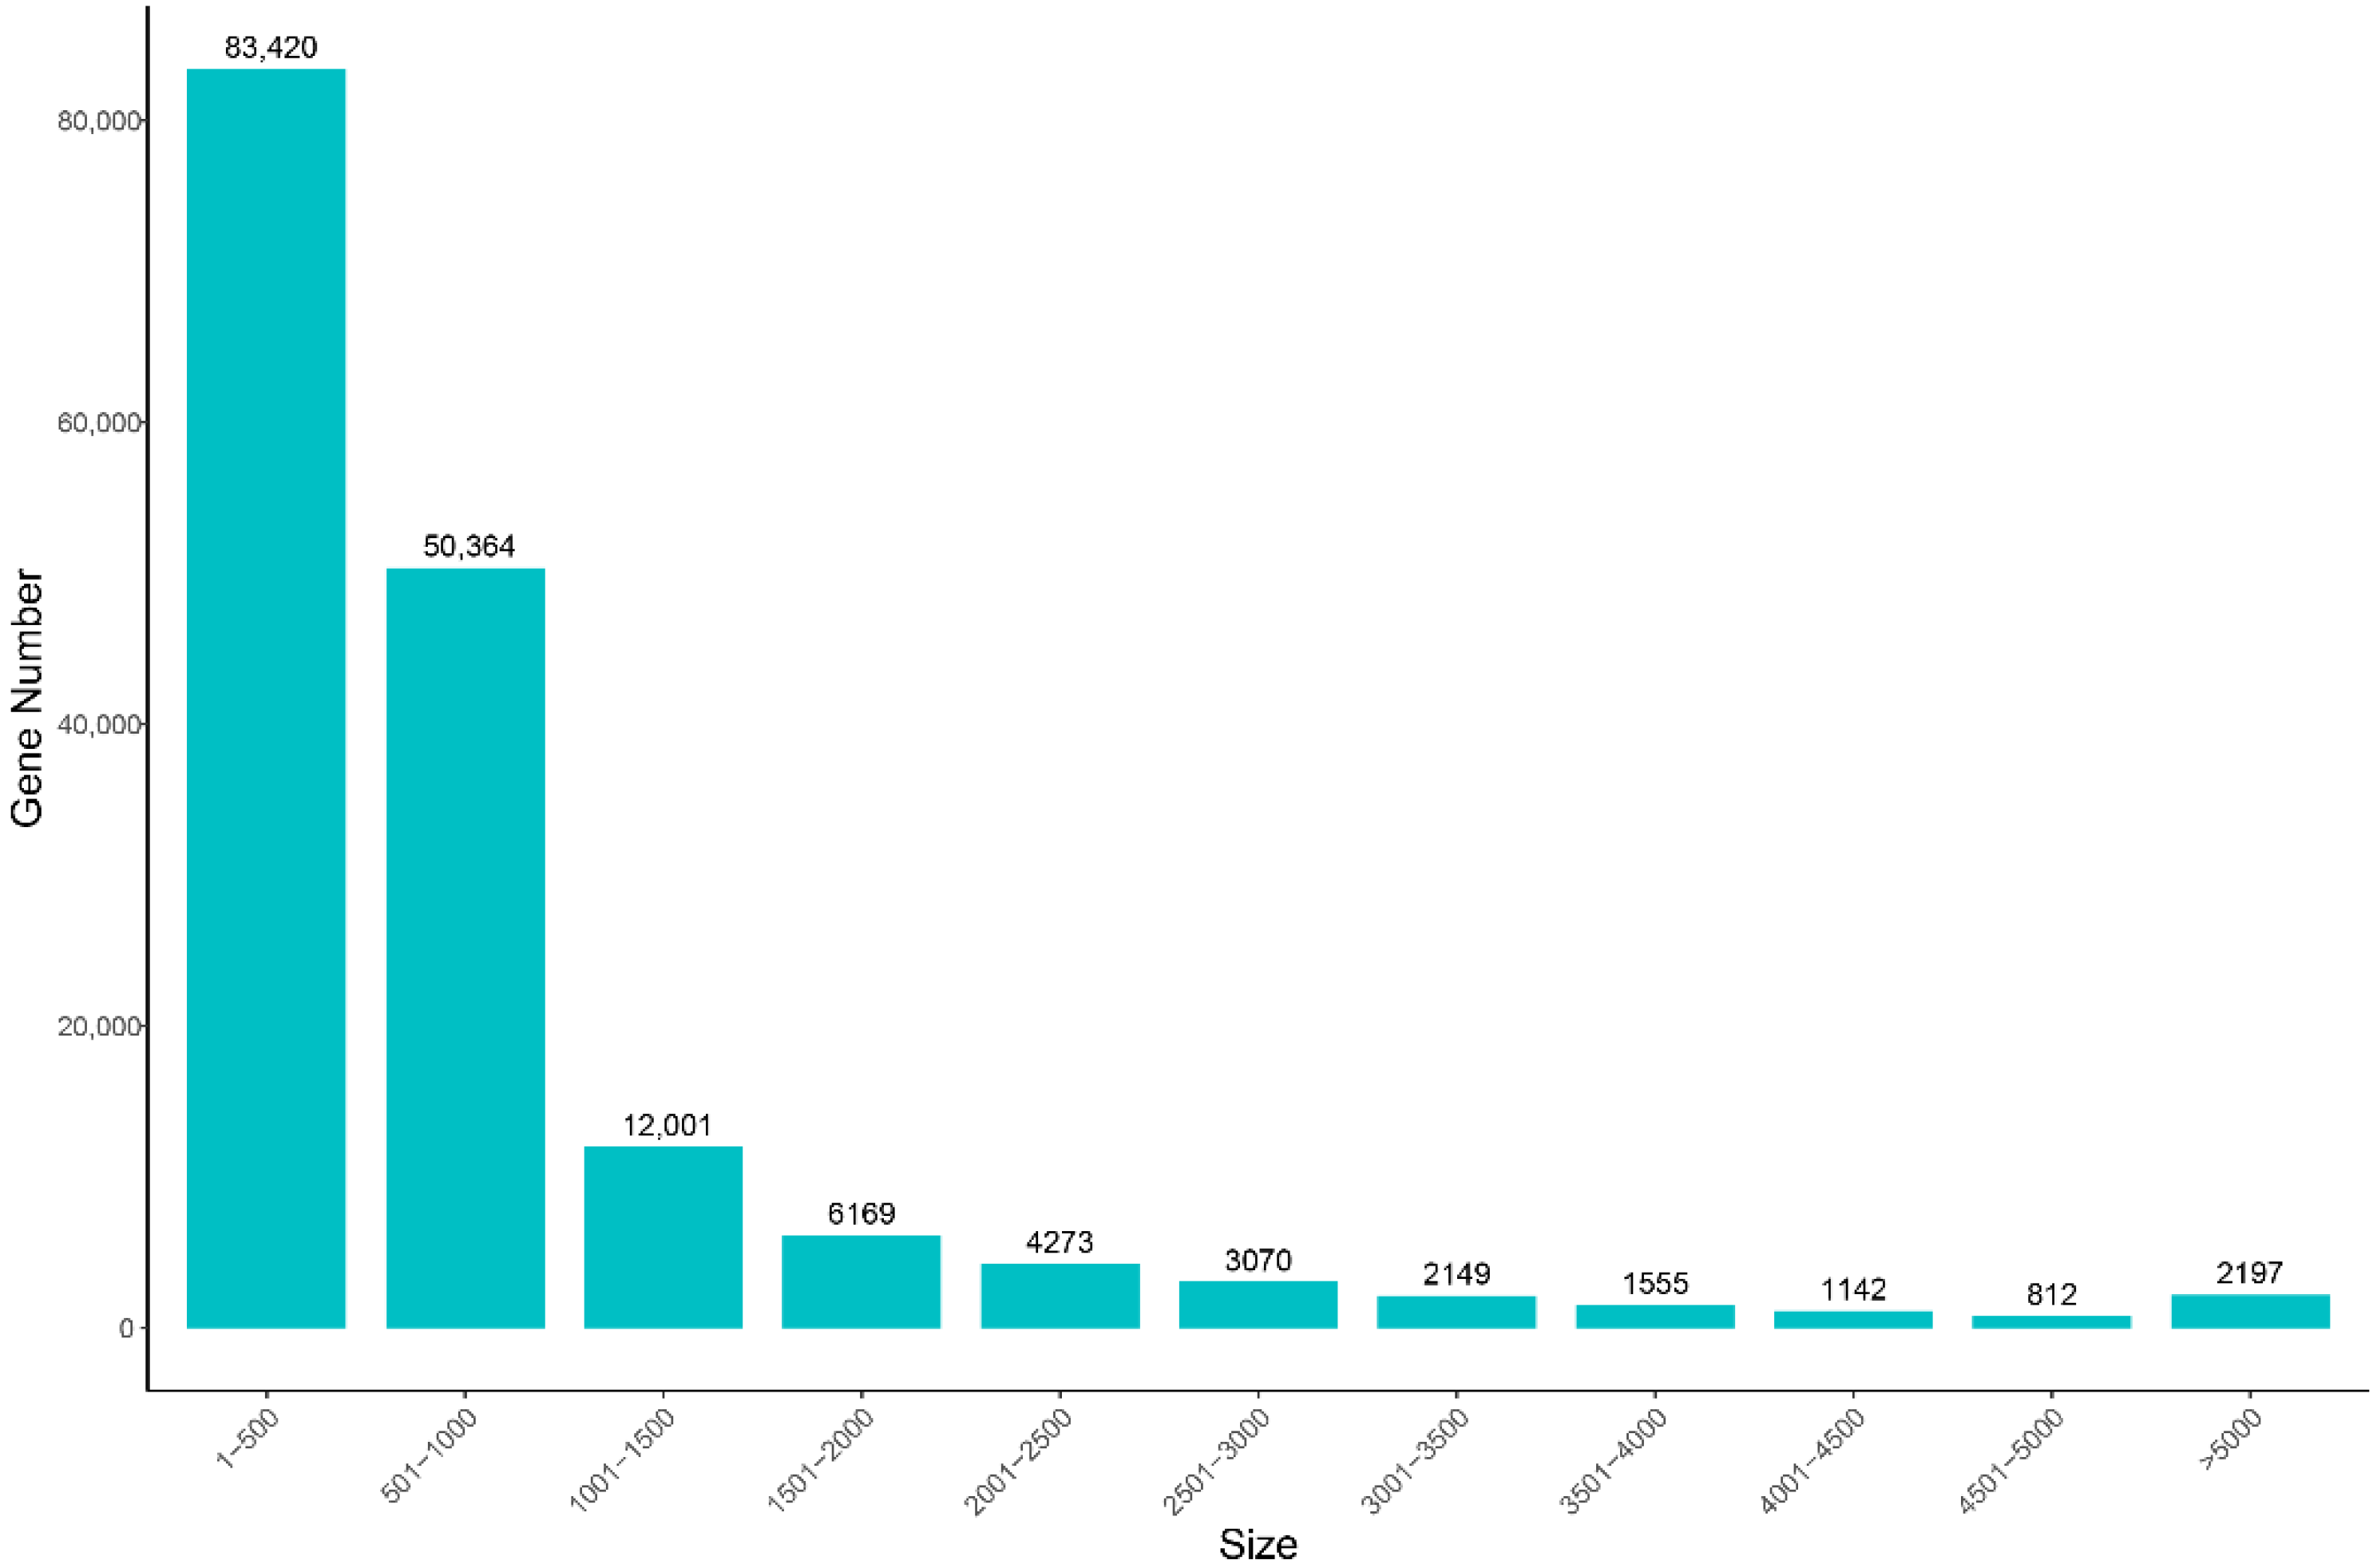
3.1. Overview of Transcriptome Assembly Quality

A sum of six cDNA libraries was constructed in triplicates from testes (JC) and ovaries (LC). After quality control and data filtering, a total of 39.72 Gb clean reads was generated using an Illumina HiSeq platform, with a mean of 6.62 Gb, ranging from 6.0 to 7.28 Gb per sample. The mean values of Q20 and Q30 are higher than 95% (Table 2). After de novo assembly, 167,152 unigenes were assembled, with mean length and N50 of 871 bp and 1198 bp, respectively (Table 3). About 30.13% unigenes were in length of 300–500 bp, and 33,368 of them (19.97%) were more than 1000 bp in length (Figure 1).

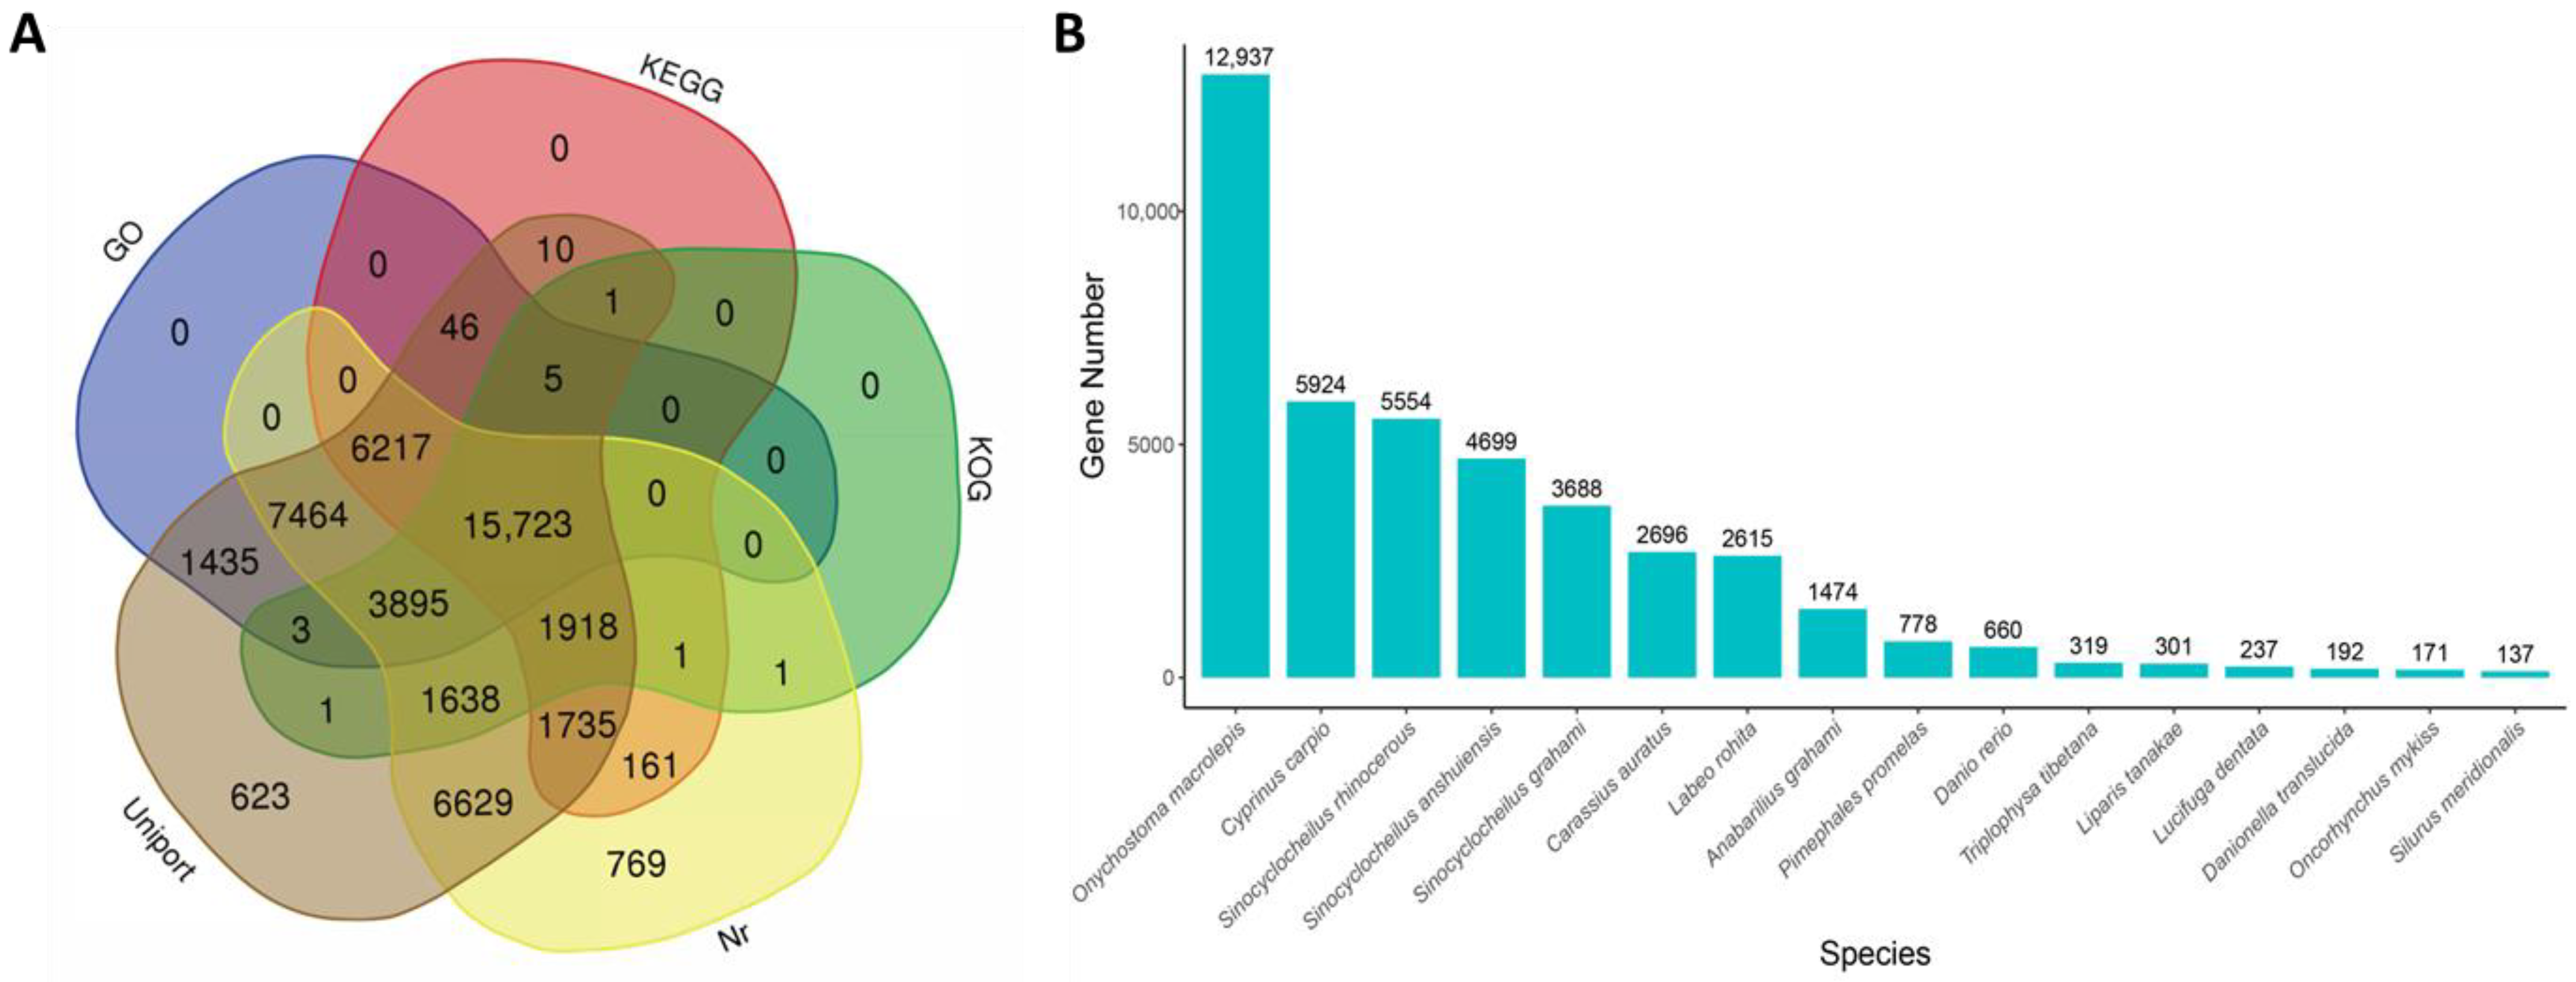
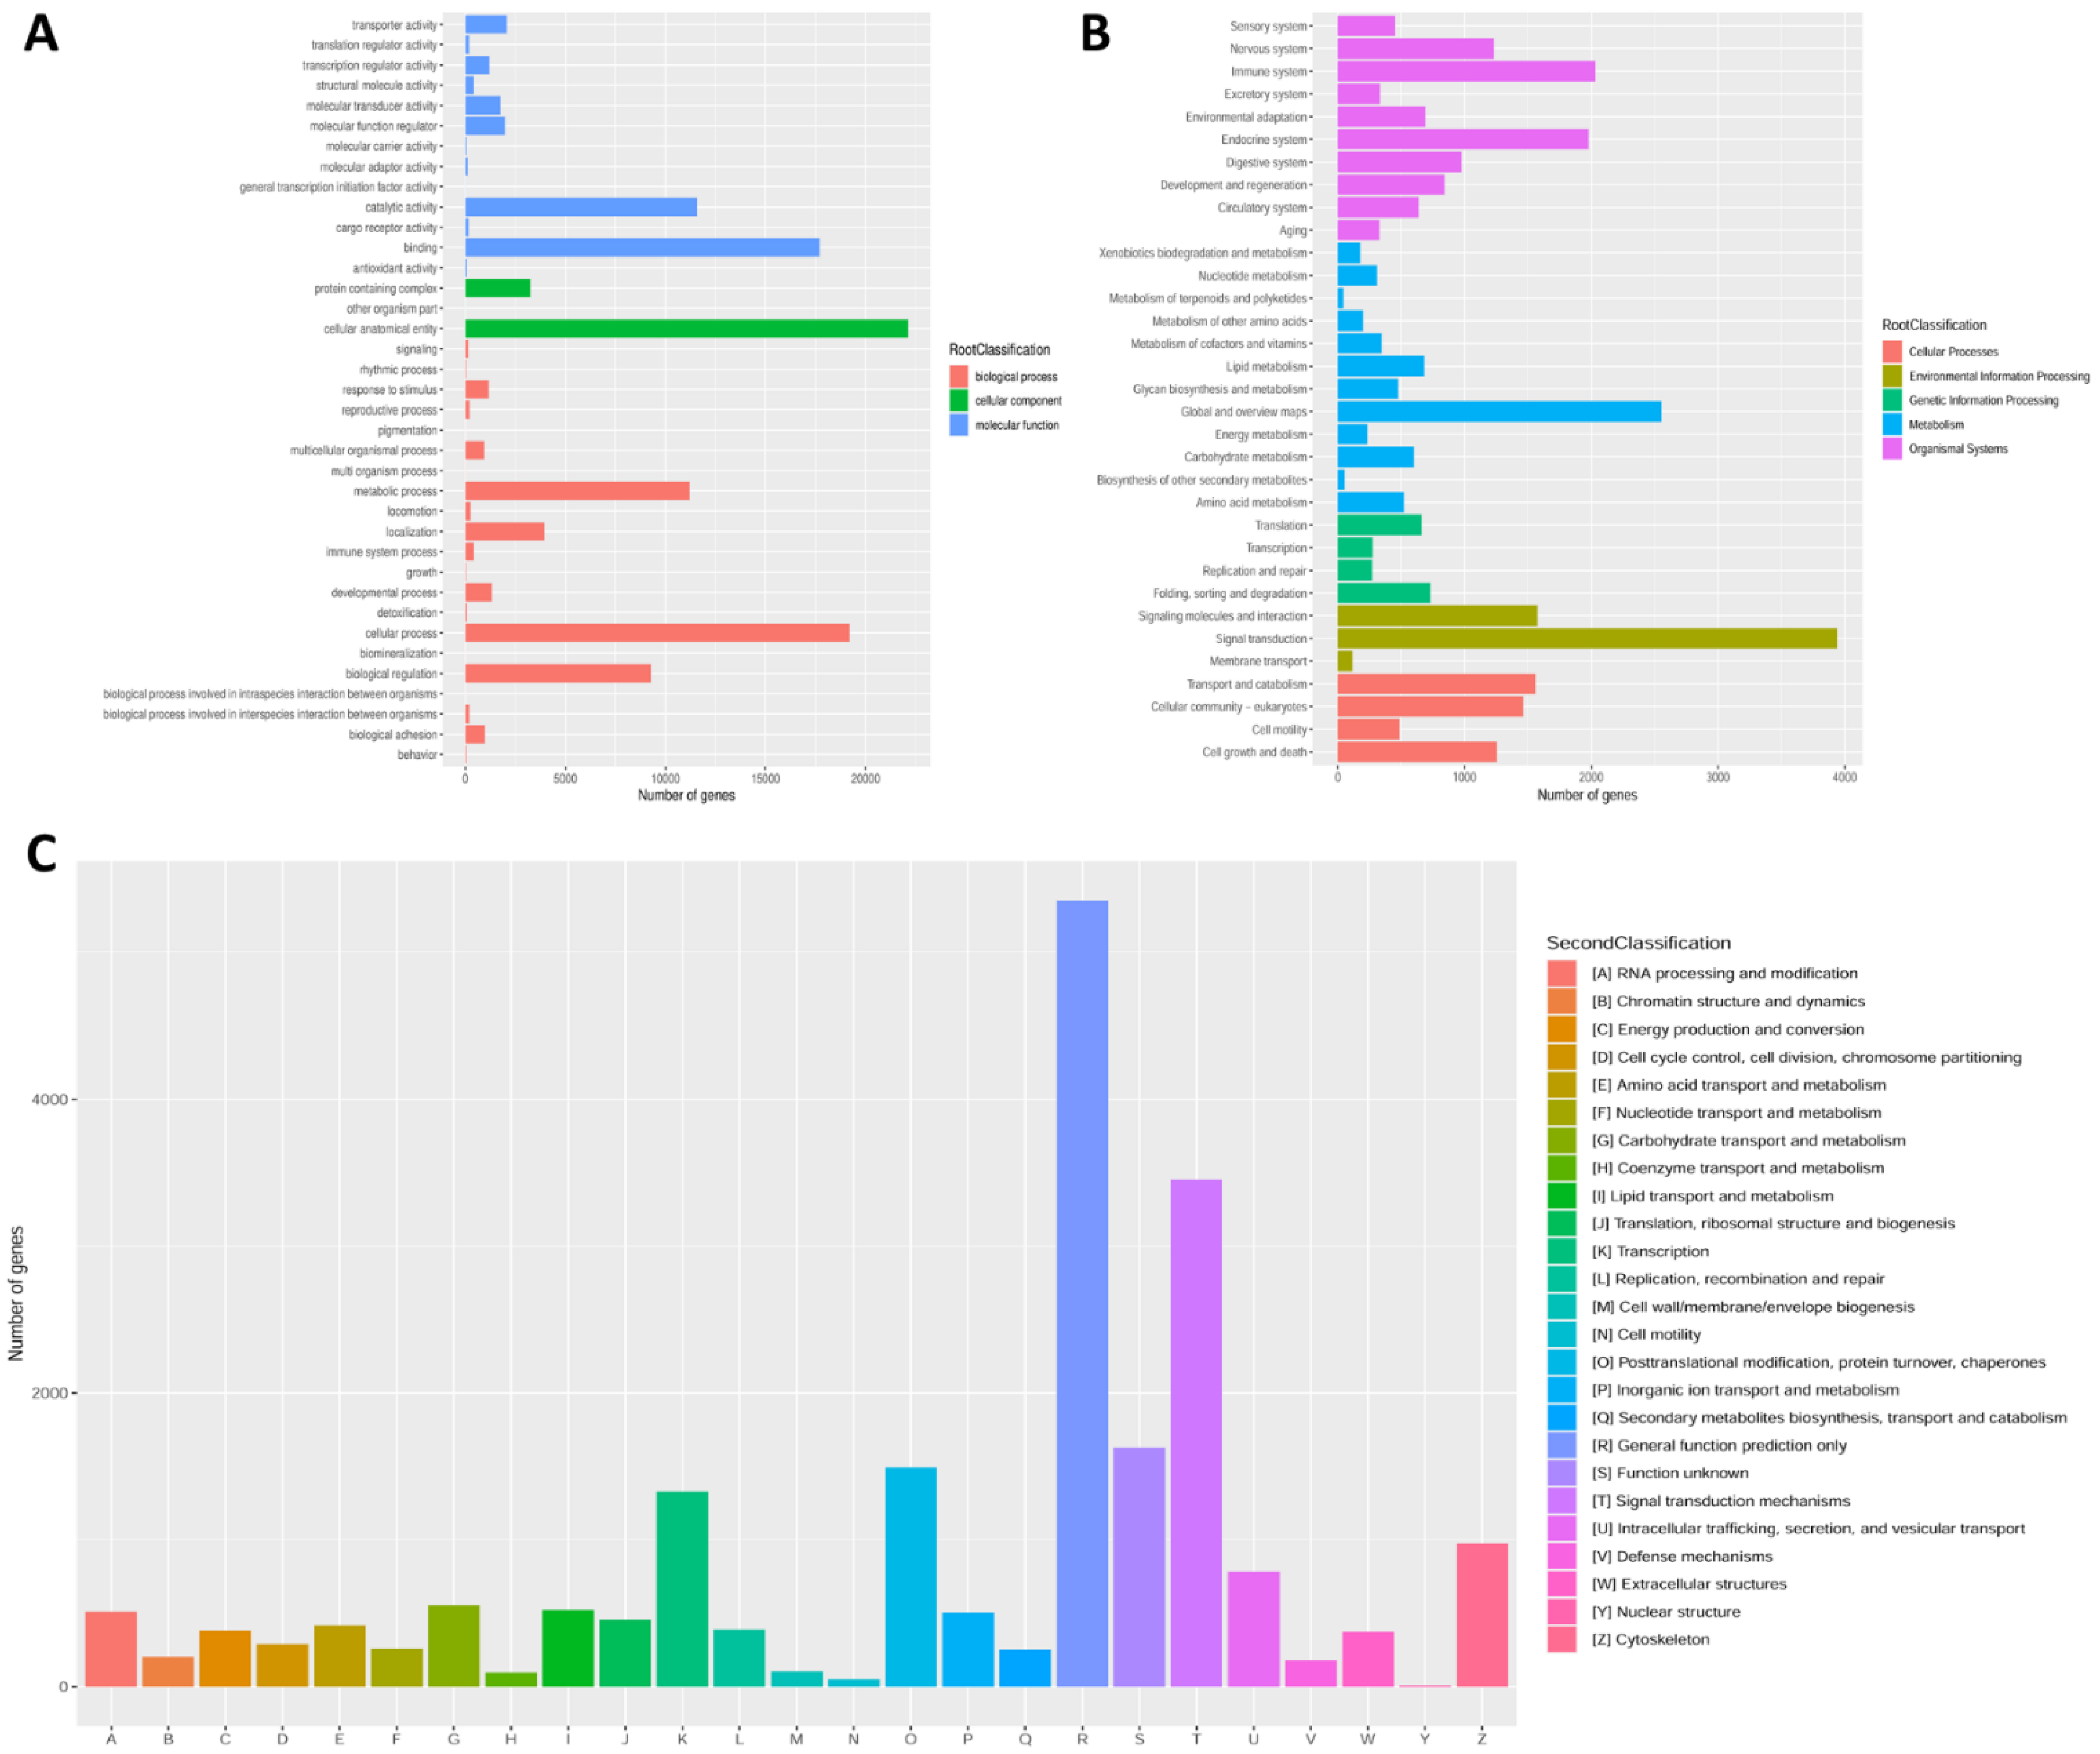
3.2. Unigene Annotation

After annotation, a total of 48,275 unigenes were successfully annotated. The highest percentage of annotated unigenes was in the Uniprot database (47,343; 98.07%) and second is the Nr database (46,151; 95.60%), while the lowest was in the GO database (23,186; 48.03%) (Figure 2A). The distribution of BLASTx top-hit species showed that Onychostoma macrolepis (12,937; 28.03%) has the biggest number of homologous genes to S. hollandi, followed by Cyprinus carpio (5924; 12.84%), Sinocyclocheilus rhinocerous (5554; 12.03%) and Sinocyclocheilus anshuiensis (4699; 10.18%) (Figure 2B).
In addition, all unigenes were further annotated in GO, KOG and KEGG databases to get knowledge of their functional classification. A total of 23,186 (48.03%) unigenes were grouped into three categories of GO. In the biological processes category, cellular (19,188) was the most representative item. In the category of cellular component, the most represented term was cellular anatomical entity (22,121). In addition, in the molecular function category, the most representative terms were binding (17,708) and catalytic activity (11,582) (Figure 3A). After KEGG annotation, a sum of 25,817 (53.48%) unigenes was divided into five different functional categories. The largest distribution was “signal transduction” (3943 unigenes), “global and overview maps” (2552 unigenes) and “immune system” (2030 unigenes) (Figure 3B). According to KOG annotation, a total of 23,186 (48.03%) unigenes were grouped into 25 families, and the richest distribution was “General function prediction only” (5349 unigenes), followed by “Signal transduction mechanisms” (3452 unigenes); the smallest distribution was “Nuclear structure”, with only 8 unigenes (Figure 3C).

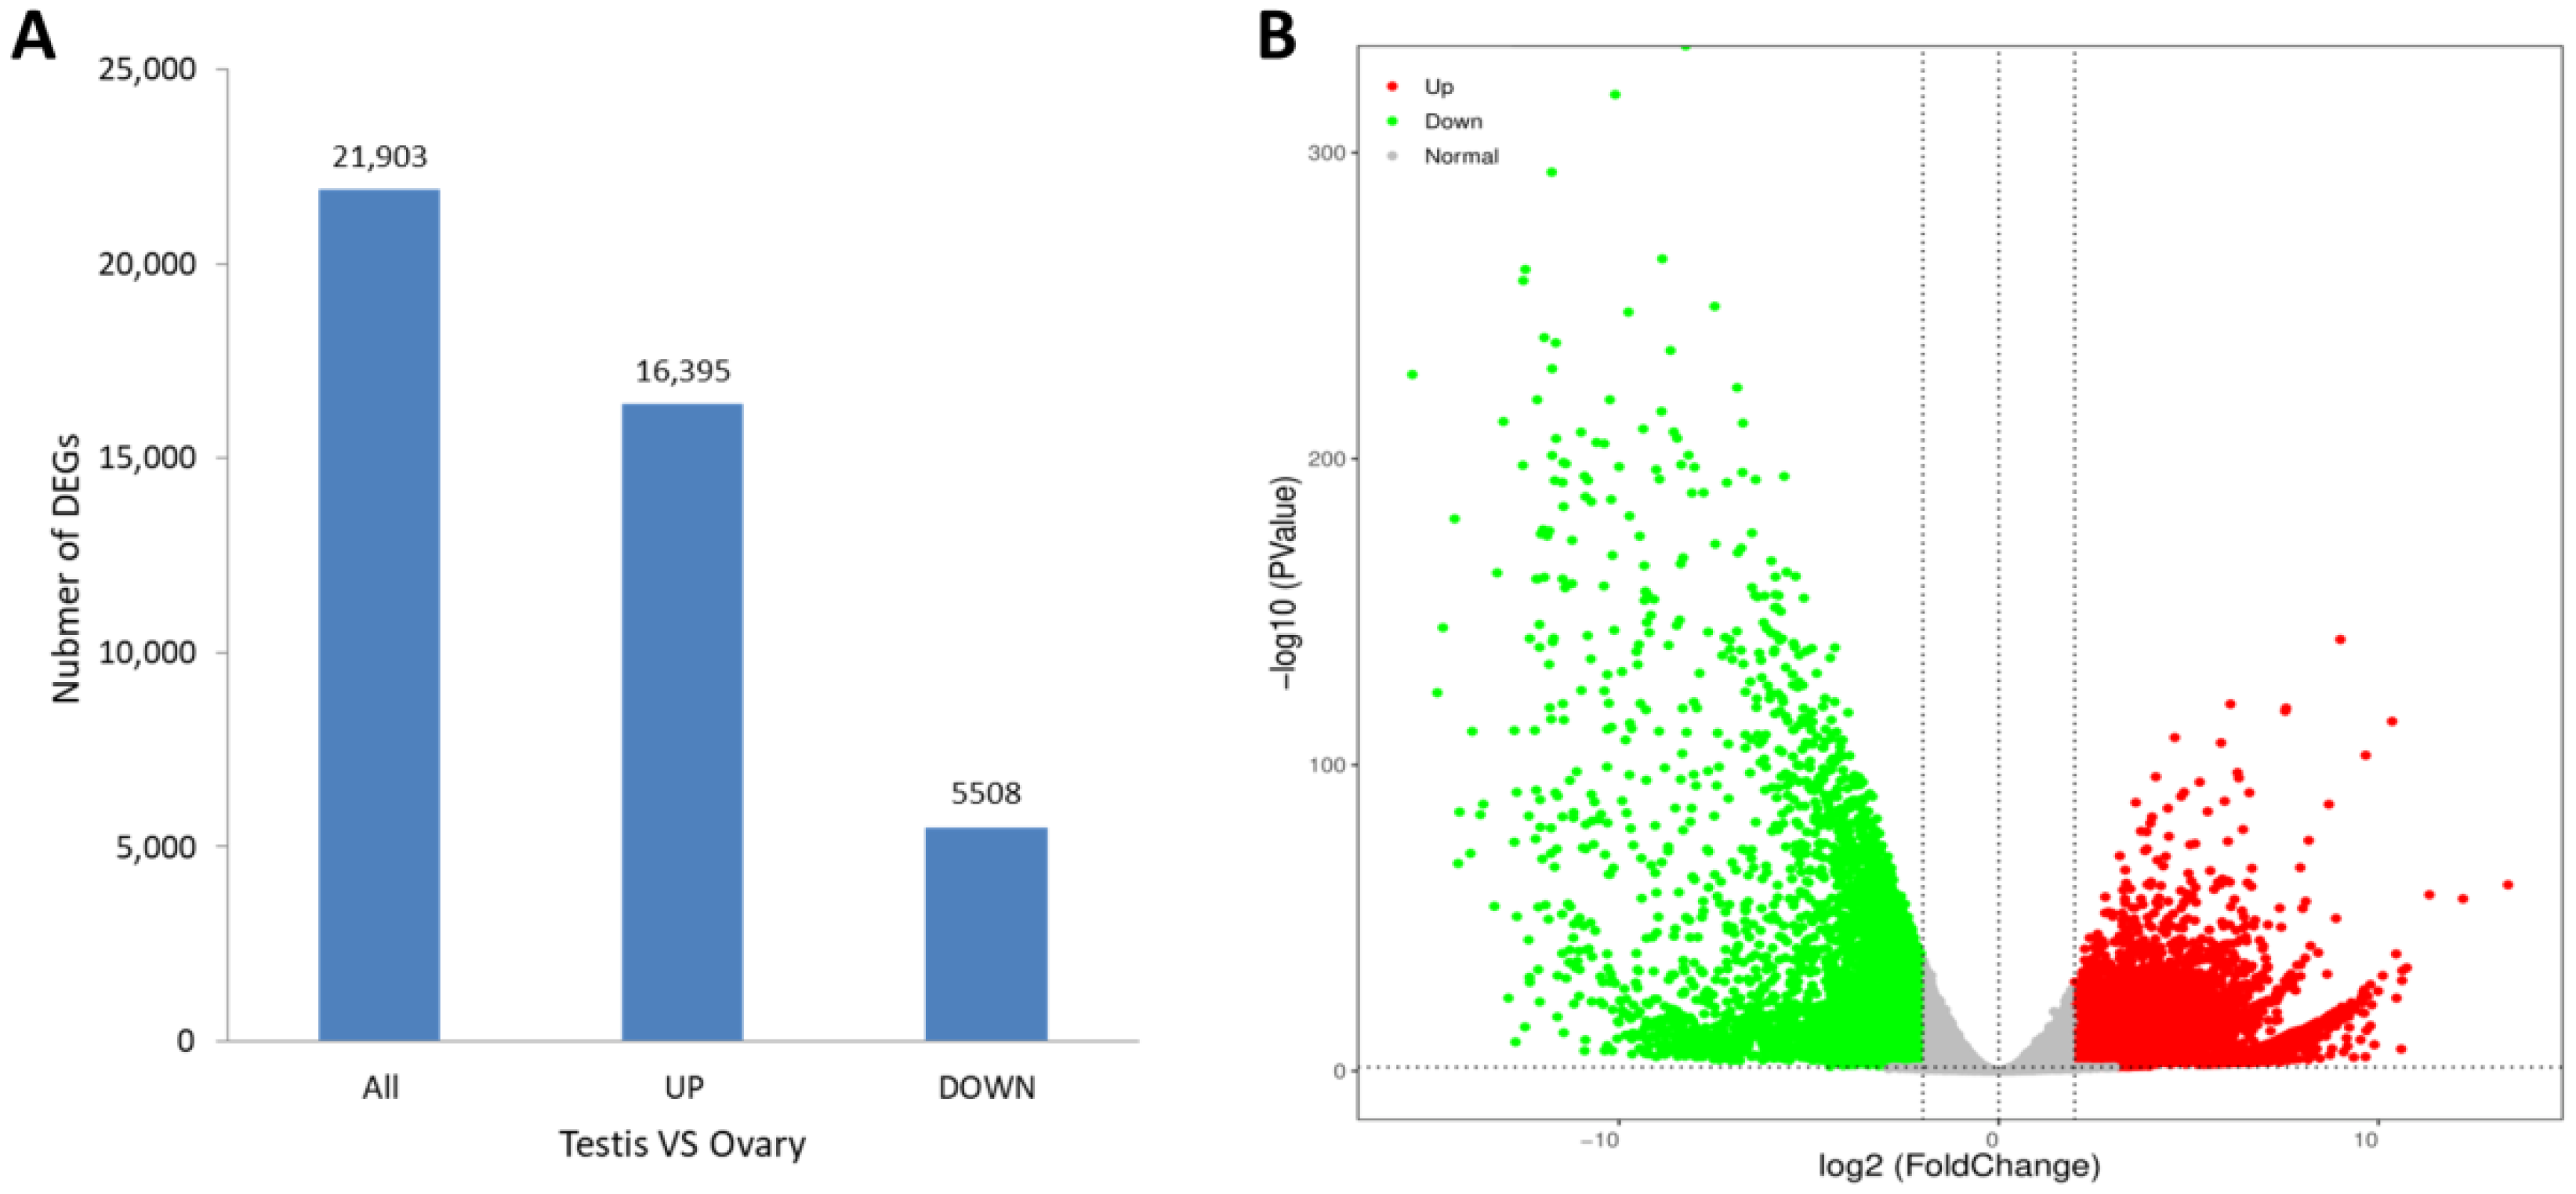
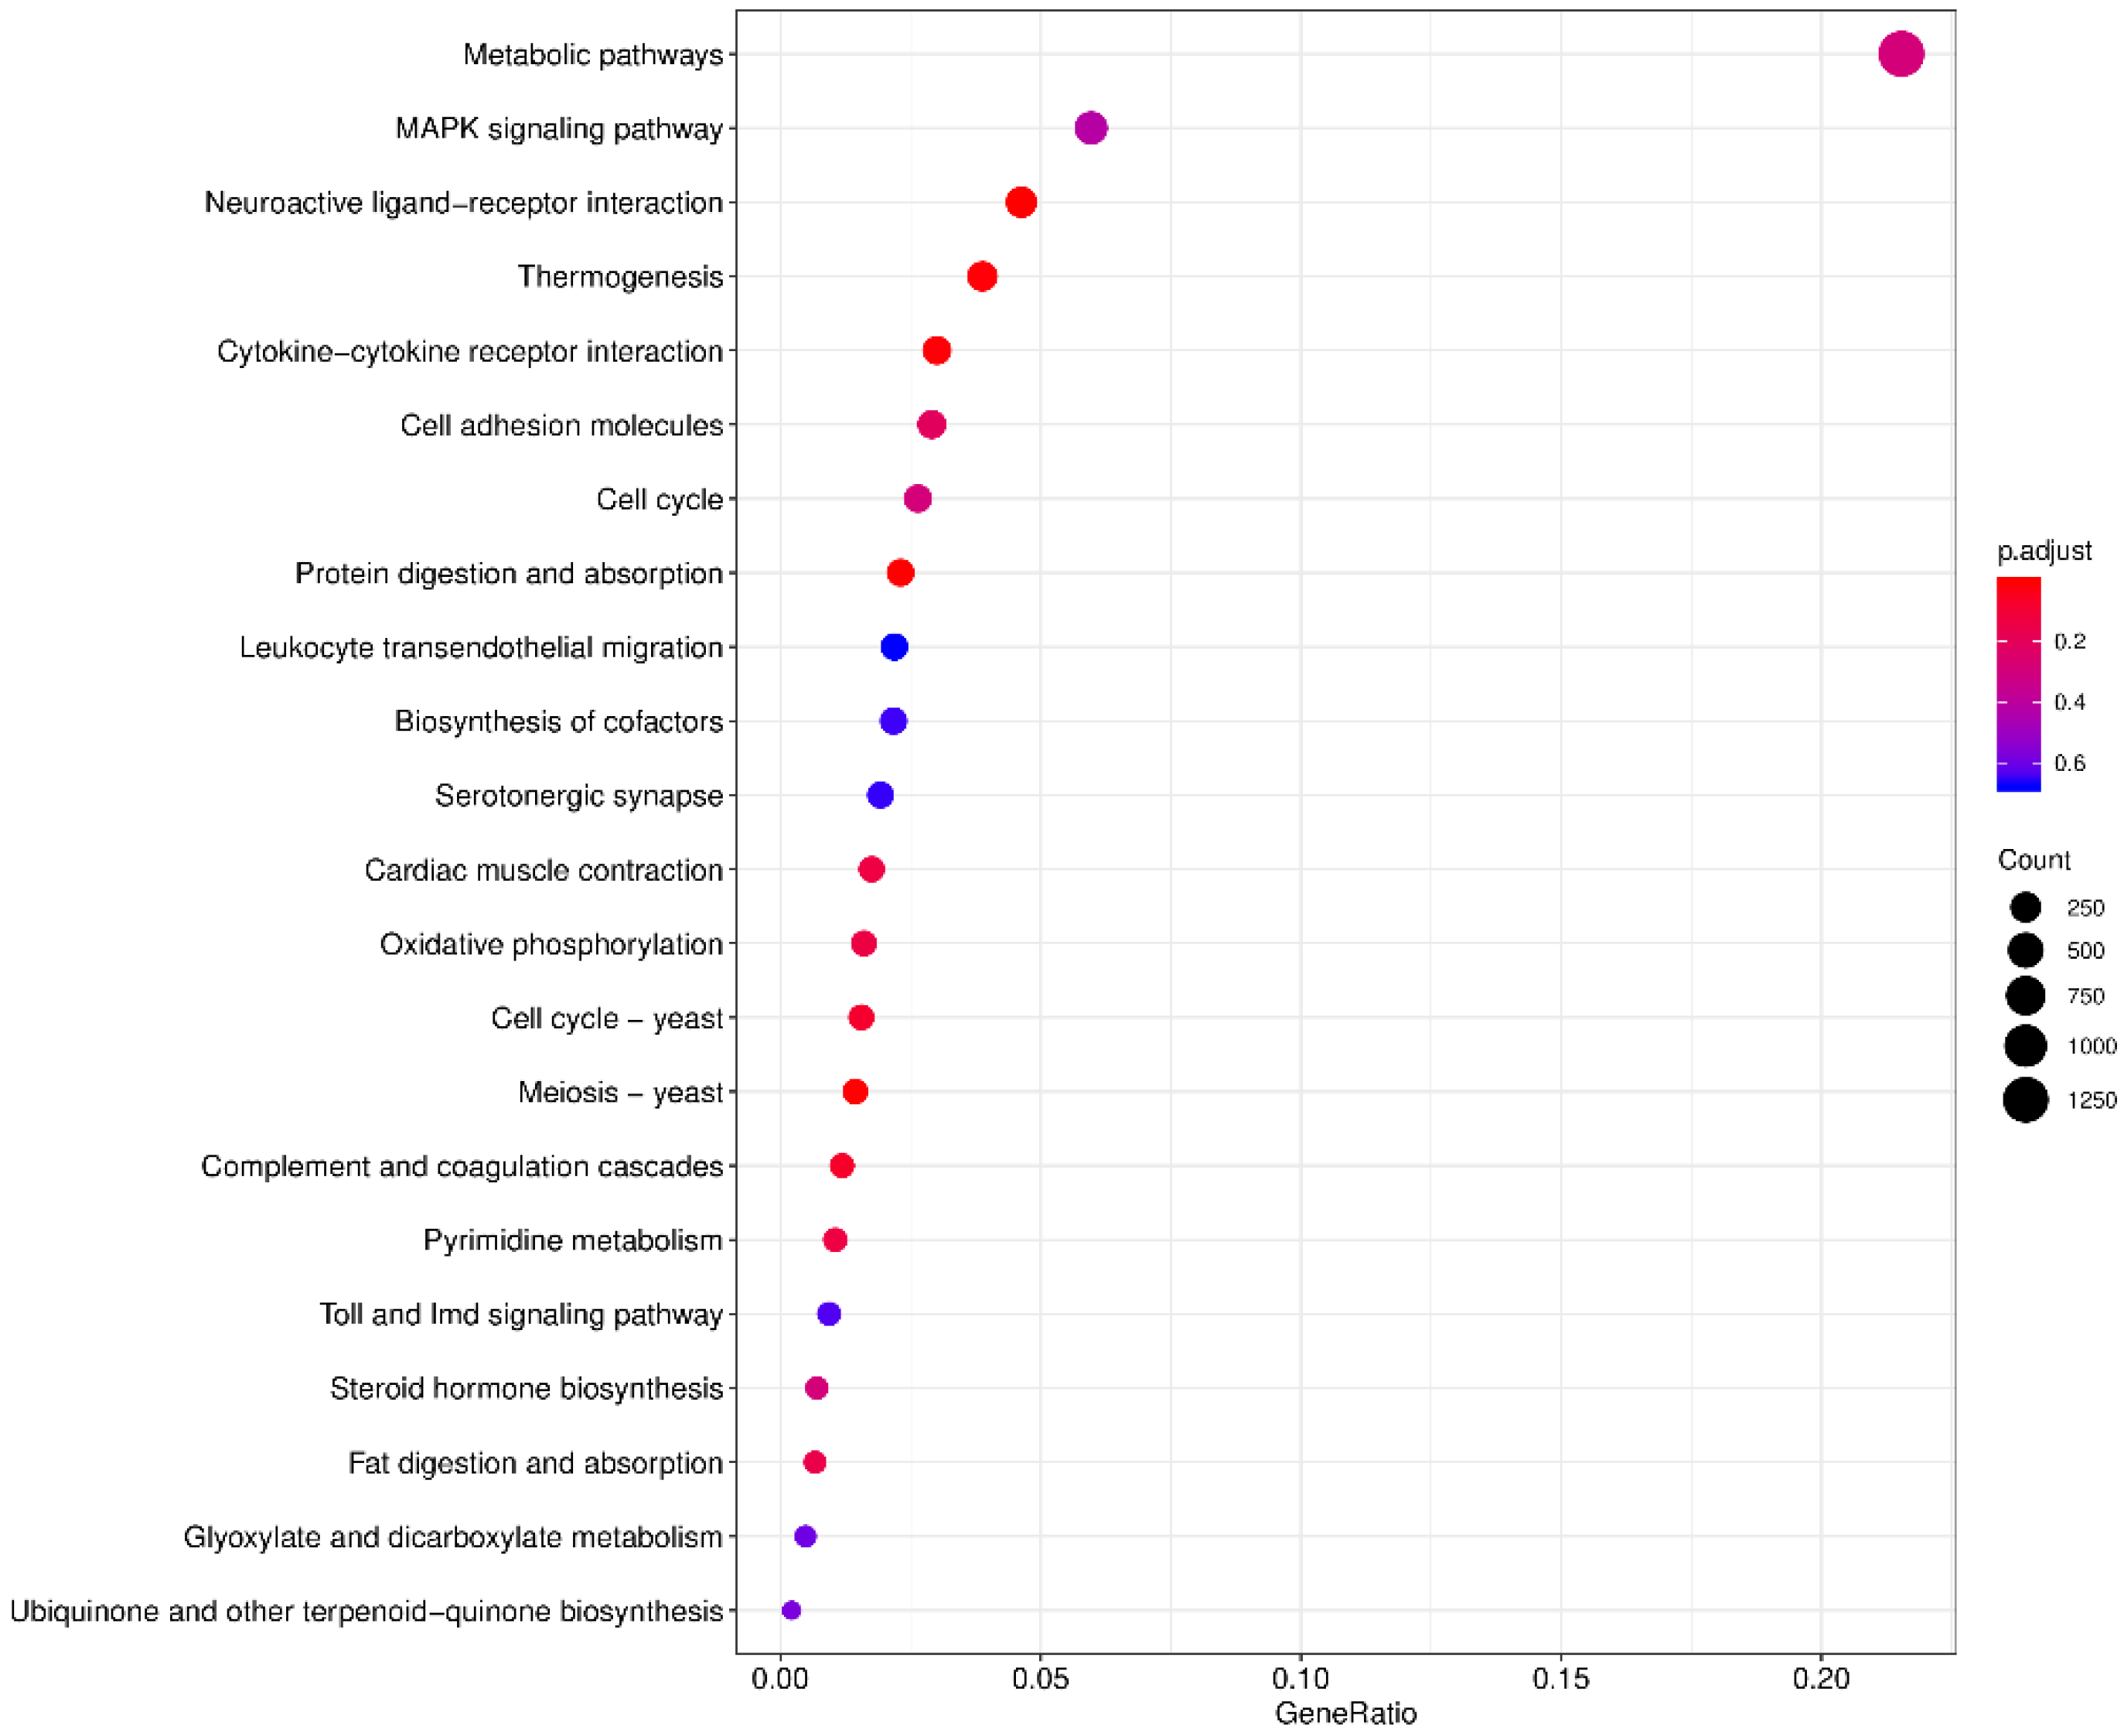
3.3. Differential Expression Analysis

The levels of gene expression were normalized using the TPM values. A total of 21,903 DEGs were identified between the ovary and testis samples, with 16,395 (74.85%) DEGs significantly high expressed in the testes and 5508 (25.15%) high expressed in the ovaries (Figure 4A). A volcano plot shows the DEG information (Figure 4B). The KEGG enrichment analysis revealed that the metabolic pathway was most representative, followed by the MAPK signaling pathway and the neuroactive ligand-receptor interaction pathway (Figure 5).
In addition, based on the GO and KEGG annotation, numerous genes related to reproduction and gonad development and differentiation were identified (Table 4). Anti-Mullerian hormone (amh), SRY-box transcription factor 9 (sox9), double sex- and mab-3-related transcription factor 2 (dmrt2) and androgen receptor (ar) were highly expressed in the testis, while cytochrome P450 (cypa19a), catenin beta-1 (ctnnb1) and bone morphogenetic protein 15 (bmp15) expressed highly in the ovary.

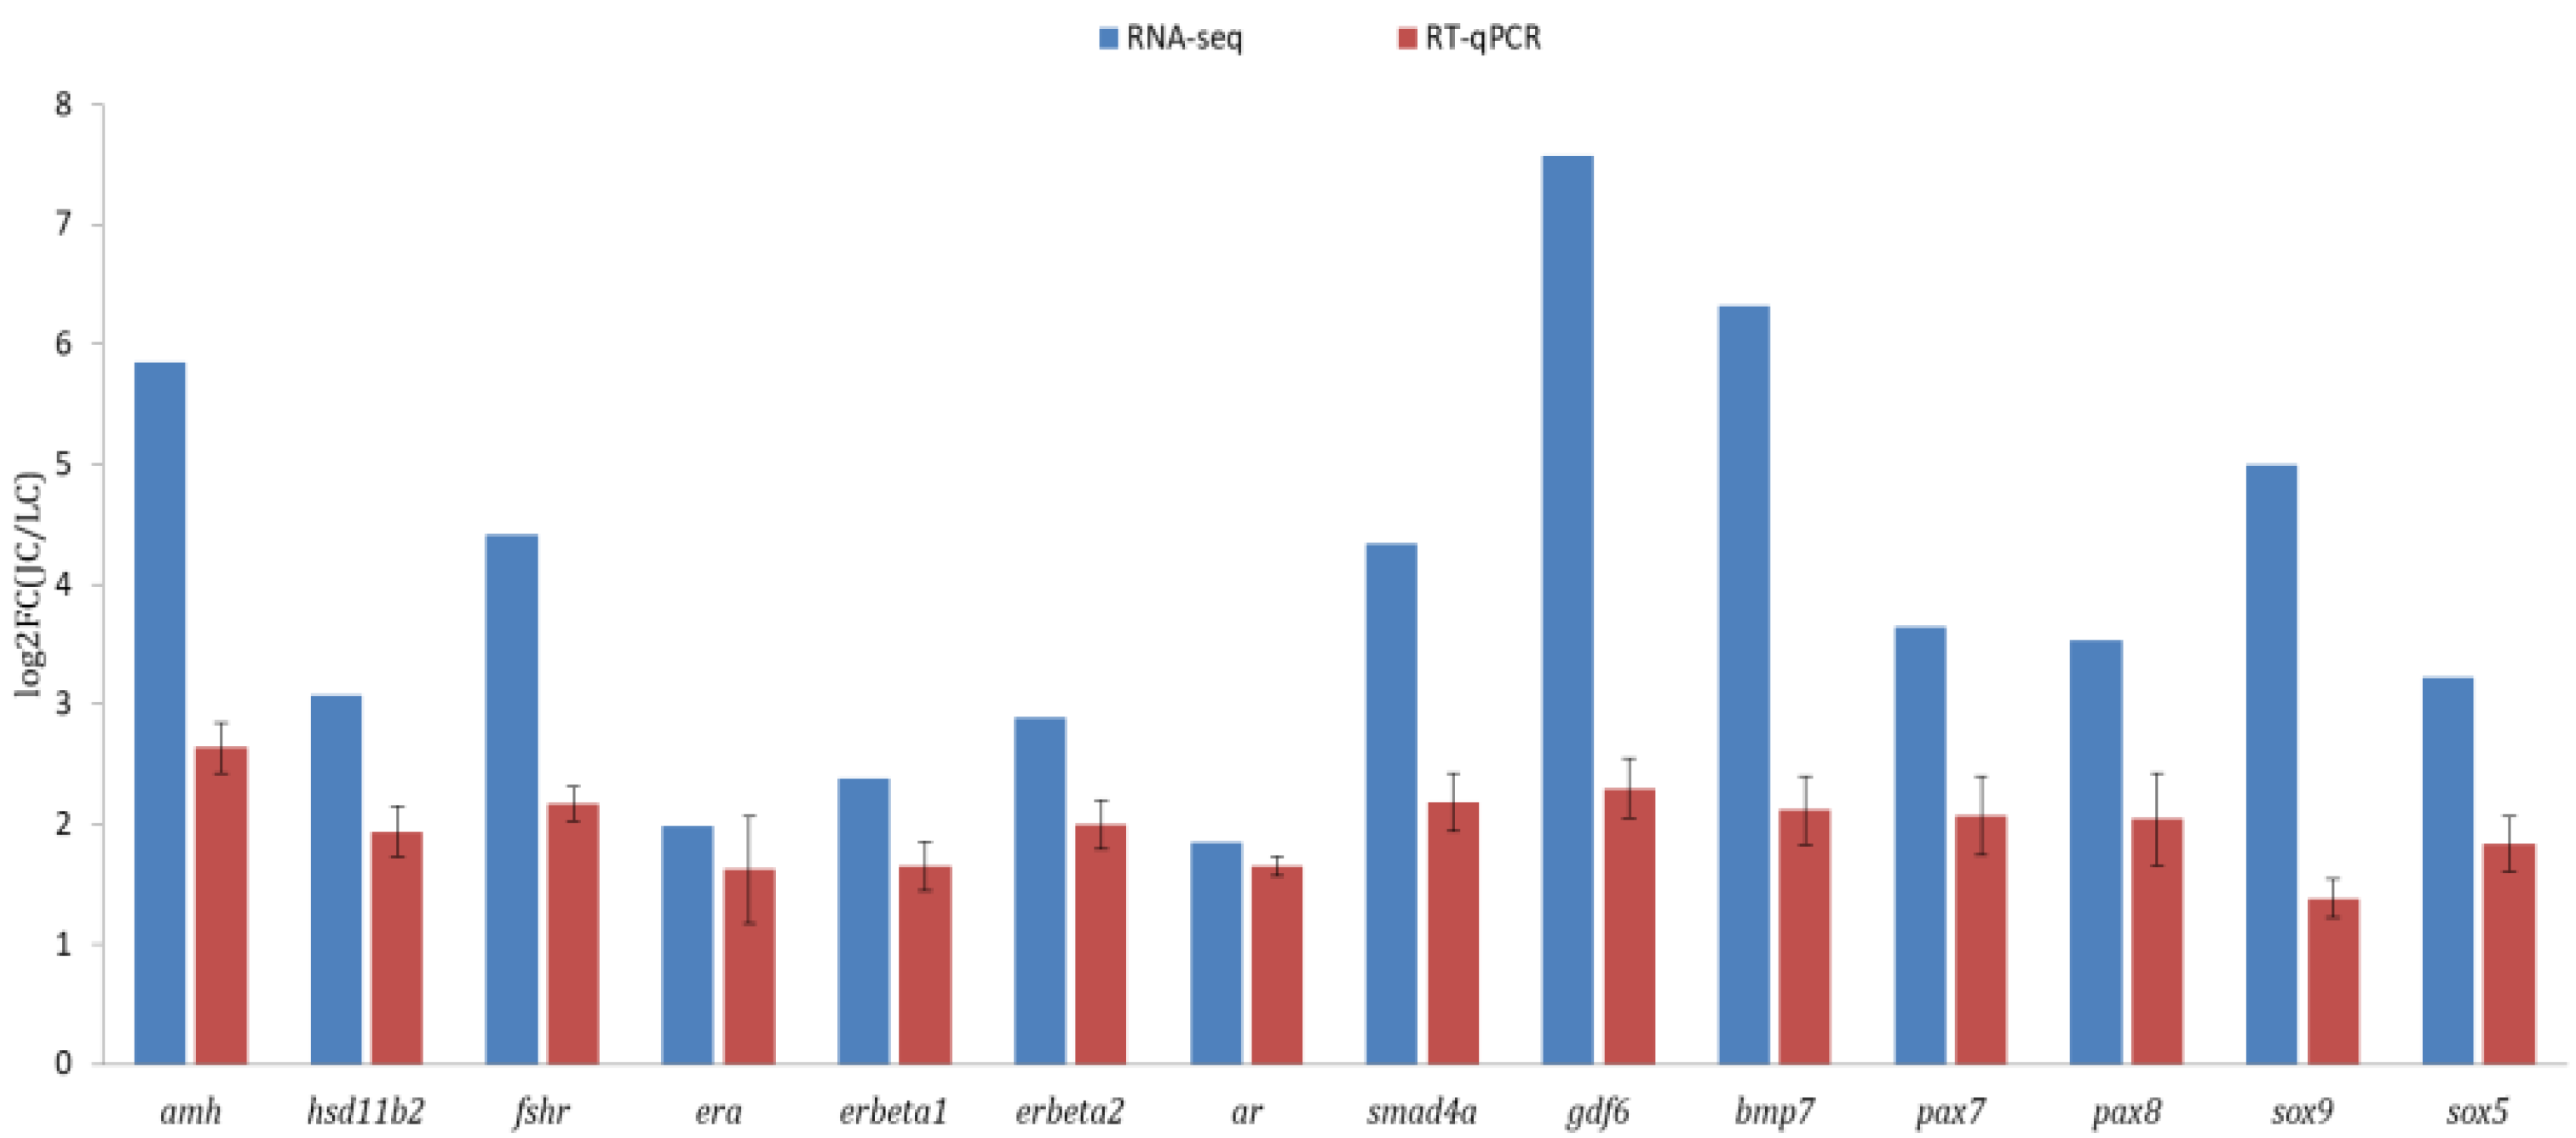
3.4. Validation of Transcriptomic Data

A total of fourteen DEGs related to sex differentiation and gonadal development were analyzed from the transcriptome data, including amh, hsd11b2, fshr, era, erb1, erb2, ar, smad4a, gdf6, bmp7, pax7, pax8, sox5 and sox9. In general, the results of qRT-PCR and RNA-seq analysis were consistent (Figure 6), and the expression of all tested genes was higher in testes than in ovaries, which indicated the gene expression profiles quantified by transcriptomic analysis were reliable and accurate.

4. Discussion

Gonad development, differentiation and maturity are extremely complicated biological process, which contains a number of functional genes. In recent years, transcriptome sequencing has been demonstrated to be a highly effective method to obtain comprehensive information of gene expression for specific tissue. S. hollandi is an important commercial aquaculture species with high nutritional value and medicinal value. Its long sexual maturity time and low egg laying amount seriously hinder the development of the breeding industry. However, up to now, the molecular mechanisms of gonadal differentiation and development have not been revealed in S. hollandi. In this study, comparative transcriptome analysis of ovary and testis was first used to identify sex-related DEGs in S. hollandi.

4.1. DEGs Involved in Steroid Synthetic Pathway

Sex steroid hormones are critically important for gonadal differentiation, development and maturation in fish species, which mainly includes androgen and estrogen. In fish, the 11-ketotestosterone (11-KT) and 17-estradiol (E2) are the major androgen and estrogen that are essential to testicular and ovarian development [22]. In fact, sex steroid hormone synthesis needs a lot of steroid-metabolizing enzymes, which are encoded by many genes such as cyp19a1a, cyp11b2, hsd11b1, cyp11a1, hsd17b and so on.
Among them, the cyp19a1a gene is the most essential regulator, which can directly catalyze the switching of androgens to estrogens in the ovary. In Oreochromis niloticus and Danio rerio, knock out of the cyp19a1a gene caused a drop in E2 levels and further induced female-to-male sex reversal [23,24]. The Hsd11b2 gene encodes an important enzyme that turns testosterone into 11-KT, which is important in testis maintenance. In Danio rerio, the reproductive capability of hsd11b2 homozygous mutation adult males is almost completely abrogated [25]. The Cyp11b1 gene is also involved in the synthesis of 11-KT, encoding the critical enzyme that turns testosterone to 11-KT [26]. In the sea bass, cyp11b1 not only was predominantly expressed in the first stages of spermatogenesis but most likely was also expressed in spermatogonia [26]. In addition, high expression of hsd11b2 and cyp11b1 genes in the testis was also found in mandarin fish [27]. In S. hollandi, the expression of cyp11b1 and hsd11b2 genes was higher in the testis, while the cyp19a1a gene expressed highly in the ovary, indicating the expression pattern was similar among different fish species [9,10,27]. Thus, these results indicated that these DEGs play important roles in gonad development and reproduction in fish.

4.2. DEGs Involved in Gonad Differentiation and Development

In recent years, more and more genes were demonstrated to participate in the sex determination and gonad differentiation of teleosts. The upstream regulatory genes are diverse, but the downstream genes are much conserved. The common regulatory gene downstream of most sex-related genes is the cyp19a1a gene, which can directly catalyze the conversion of androgens to estrogens.
Anti-Mullerian hormone (amh), a transforming growth factor from the TGF-β family, controls the degeneration of female primordial germ cell ducts in mammals and promotes male development in vertebrates. Previous studies have demonstrated amh mutation could lead to male-to-female sex reversal in zebrafish [28] and tilapia [29]. Moreover, direct evidence revealed that amh could inhibit the transcription of cyp19a1a through Amhr2/Smads signaling [30]. Bmp15 and gdf9, as oocyte-produced signals, participate in maintaining adult female sex differentiation and, in zebrafish, females deficient in bmp15 begin development normally but switch sex during the mid- to late-juvenile stage, and become fertile males [31]. In S. hollandi, the results revealed that the expression of amh was higher in the testis, indicating the Amh pathway was of great importance in testicular differentiation regulation. In addition, bmp15 and gdf9 also showed ovary-biased expression in S. hollandi, suggesting a conserved role of bmp15 and gdf9 in teleosts.
Sox family genes are widely involved in the sex determination and differentiation process of vertebrates, and are a family of transcription factors that are closely related to the mammalian sex-determining region of the Y genes, namely sry [32]. Previous study has found that sox5 could downregulate the activity of dmy (main sex determining gene) by binding to its promoter, and females with the sox5 mutation will reverse to males in medaka [33]. Sox9 is known to have an essential role in Sertoli cell differentiation; conditional sox9 knockout testes fail to maintain germ cells in mice [34]. Previous evidence has proved that sox9 is capable of interfering with WNT/β-catenin signaling and repressing the ovarian-differentiating genes including follistatin, Iroquois-related homeobox 3 and foxl2 [35]. As in the medaka and mouse, sox5 and sox9 also showed high expression in the testis of S. hollandi, suggesting an important function of these genes in vertebrates.

4.3. DEGs Involved in Gametogenesis and Gamete Maturation

In aquaculture practice, it is extremely important to obtain parental fish with well-developed gametes. Many genes are involved in the regulation of gamete development and maturation. Here, the expression of many genes involved in gametogenesis and gamete maturation was also characterized, such as spata16, zp3 and zp4. Spata16, namely spermatogenesis-associated protein 16, is essential for spermiogenesis [36] and male fertility; homozygous mutation of spata16 leads to male infertility [37]. Zp3 is a major kind of female-specific factor involved in the regulation of the reproductive process, forming an extracellular matrix surrounding oocytes which mediates sperm binding. Similar to zp3, zp4 also surround oocytes and may act as a sperm receptor. In this study, the expression of zp3 and zp4 was higher in the ovary, indicating that they might participate in ovarian folliculogenesis in S. hollandi. In addition, spata13, spag5 and strbp also showed higher expression in the ovaries, suggesting an important role in oogenesis and oocyte maturation. In all, similar expression patterns of these reproduction-related genes were also found in Diodon hystrix [9], Scatophagus argus [10], Patinopecten yessonsis [38] and so on, indicating a conserved role of these genes in teleosts.

5. Conclusions

This work is the first study on the gonad transcriptome of S. hollandi. Based on testis and ovary transcriptome data, a number of 167,152 unigenes were identified. Comparative transcriptome analysis identified a large scale of DEGs involved in gonadal development, differentiation and gametogenesis. For these DEGs related to gonad development and reproduction, similar expression profiles were found, suggesting their conserved roles in gonad development and gametogenesis. Our results will provide a valuable resource for further research on sex determination and gonad development.

Author Contributions

Conceptualization, J.G. and Q.L.; methodology, C.H.; software, C.H.; validation, W.H., S.P. and J.Z.; formal analysis, C.H.; investigation, W.H., S.P. and J.Z.; resources, H.Z. and Y.Z.; data curation, C.H.; writing—original draft preparation, C.H.; writing—review and editing, J.G. and Q.L.; visualization, C.H. and W.L.; supervision, J.G. and Q.L.; project administration, J.G. and Q.L.; funding acquisition, Q.L. All authors have read and agreed to the published version of the manuscript.

Funding

This research was funded by the Project of Science and Technology of Guangzhou city grant number 201804010486.

Institutional Review Board Statement

All procedures in this experiment were approved by the Institutional Review Committee of Bioethics and Biosafety of Guangzhou University on 5 April 2021 (No. GURBBB210405).

Informed Consent Statement

Not applicable.

Data Availability Statement

The raw data are available from the SRA (http://www.ncbi.nlm.nih.gov/sra/, accessed on 12 October 2021) data repository (accession number: PRJNA907069).

Conflicts of Interest

The authors declare no conflict of interest.

References

  1. Cai, Z.D.; Lin, G.; Ni, J.Y.; Ye, Z.; Tang, Z.B.; Zhang, S. Study on the reproductive biology of Spinibabus calddwellis. Guangxi Agric. Sci. 2007, 2, 24–28, (In Chinese with English Abstract). [Google Scholar]
  2. Yang, S.D.; Lin, T.S.; Liou, C.H.; Peng, H.K. Influence of dietary protein levels on growth performance, carcass composition and liver lipid classes of juvenile Spinibarbus hollandi (Oshima). Aquat. Res. 2003, 34, 661–666. [Google Scholar] [CrossRef]
  3. Yang, Y.; Lan, Z.; Shu, H.; Zhou, H.; Jiang, X.; Hou, L.; Gu, P. Association between expression levels and growth trait-related SNPs located in promoters of the MC4R and MSTN genes in Spinibarbus hollandi. Genes Genom. 2018, 40, 1119–1125. [Google Scholar] [CrossRef] [PubMed]
  4. Jian, X.; Peizhen, Z.; Caiyan, W.; Jianrong, C.; Liangming, Z.; Qinhong, L.; Yuxuan, W. The gonadal development and the annual change of ovary in Spinibarbus hollamdi. Chin. J. Zool. 2004, 39, 7–10. [Google Scholar]
  5. Heule, C.; Salzburger, W.; Böhne, A. Genetics of sexual development: An evolutionary playground for fish. Genetics 2014, 196, 579–591. [Google Scholar] [CrossRef] [PubMed] [Green Version]
  6. Yang, Y.; Zhou, H.; Hou, L.; Xing, K.; Shu, H. Transcriptional profiling of skeletal muscle reveals starvation response and compensatory growth in Spinibarbus hollandi. BMC Genom. 2019, 20, 938. [Google Scholar] [CrossRef] [PubMed] [Green Version]
  7. Yang, Y.; Zhou, H.; Shu, H.; Zhong, D.; Zhang, M.; Xia, J.H. Effect of fasting and subsequent refeeding on the transcriptional profiles of brain in juvenile Spinibarbus hollandi. PLoS ONE 2019, 14, e0214589. [Google Scholar] [CrossRef] [Green Version]
  8. Garber, M.; Grabherr, M.G.; Guttman, M.; Trapnell, C. Computational methods for transcriptome annotation and quantification using RNA-seq. Nat. Methods 2011, 8, 469–477. [Google Scholar] [CrossRef] [Green Version]
  9. Chen, H.; Li, Z.; Wang, Y.; Huang, H.; Yang, X.; Li, S.; Yang, W.; Li, G. Comparison of gonadal transcriptomes uncovers reproduction-related genes with sexually dimorphic expression patterns in Diodon hystrix. Animals 2021, 11, 1042. [Google Scholar] [CrossRef]
  10. Mustapha, U.F.; Peng, Y.X.; Huang, Y.Q.; Assan, D.; Zhi, F.; Shi, G.; Huang, Y.; Li, G.L.; Jiang, D.N. Comparative transcriptome analysis of the differentiating gonads in Scatophagus argus. Front. Mar. Sci. 2022, 9, 962534. [Google Scholar] [CrossRef]
  11. Du, X.; Wang, B.; Liu, X.; Liu, X.; He, Y.; Zhang, Q.; Wang, X. Comparative transcriptome analysis of ovary and testis reveals potential sex-related genes and pathways in spotted knifejaw Oplegnathus punctatus. Gene 2017, 637, 203–210. [Google Scholar] [CrossRef] [PubMed]
  12. Lu, J.; Luan, P.; Zhang, X.; Xue, S.; Peng, L.; Mahbooband, S.; Sun, X. Gonadal transcriptomic analysis of yellow catfish (Pelteobagrus fulvidraco): Identification of sex-related genes and genetic markers. Physiol. Genom. 2014, 46, 798–807. [Google Scholar] [CrossRef] [PubMed]
  13. Zhu, Q.; Han, C.; Liu, S.; Ouyang, H.; Liu, D.; Zhang, Z.; Huang, J.J.; Han, L.Q.; Li, S.S.; Li, G.F.; et al. Development and gene expression analysis of gonad during 17α-methyltestosterone-induced sex reversal in mandarin fish (Siniperca chuatsi). Aquat. Rep. 2022, 23, 101049. [Google Scholar] [CrossRef]
  14. Li, B.; Dewey, C.N. RSEM: Accurate transcript quantification from RNA-Seq data with or without a reference genome. BMC Bioinform. 2011, 12, 323. [Google Scholar] [CrossRef] [PubMed] [Green Version]
  15. Conesa, A.; Gotz, S.; Garcia-Gomez, J.M.; Terol, J.; Talon, M.; Robles, M. Blast2GO: A universal tool for annotation, visualization and analysis in functional genomics research. Bioinformatics 2005, 21, 3674–3676. [Google Scholar] [CrossRef] [PubMed] [Green Version]
  16. Kim, D.; Langmead, B.; Salzberg, S.L. HISAT: A fast spliced aligner with low memory requirements. Nat. Methods 2015, 12, 357–360. [Google Scholar] [CrossRef] [PubMed] [Green Version]
  17. Pertea, M.; Pertea, G.M.; Antonescu, C.M.; Chang, T.C.; Mendell, J.T.; Salzberg, S.L. StringTie enables improved reconstruction of a transcriptome from RNA-seq reads. Nat. Biotechnol. 2015, 33, 290–295. [Google Scholar] [CrossRef] [PubMed] [Green Version]
  18. Anders, S.; McCarthy, D.J.; Chen, Y.; Okoniewski, M.; Smyth, G.K.; Huber, W.; Robinson, M.D. Count-based differential expression analysis of RNA sequencing data using R and Bioconductor. Nat. Protoc. 2013, 8, 1765–1786. [Google Scholar] [CrossRef]
  19. Robinson, M.D.; McCarthy, D.J.; Smyth, G.K. edgeR: A Bioconductor package for differential expression analysis of digital gene expression data. Bioinformatics 2010, 26, 139–140. [Google Scholar] [CrossRef] [Green Version]
  20. Yu, G.; Wang, L.G.; Han, Y.; He, Q.Y. Cluster profiler: An R package for comparing biological themes among gene clusters. OMICS 2012, 16, 284–287. [Google Scholar] [CrossRef]
  21. Livak, K.J.; Schmittgen, T.D. Analysis of relative gene expression data using real-time quantitative PCR and the 2(-Delta Delta C(T)) Method. Methods 2001, 25, 402–408. [Google Scholar] [CrossRef] [PubMed]
  22. Ijiri, S.; Kaneko, H.; Kobayashi, T.; Wang, D.S.; Sakai, F.; Paul-Prasanth, B.; Nagahama, Y. Sexual dimorphic expression of genes in gonads during early differentiation of a teleost fish, the Nile tilapia Oreochromis niloticus. Biol. Reprod. 2008, 78, 333–341. [Google Scholar] [CrossRef] [PubMed]
  23. Zhang, X.; Li, M.; Ma, H.; Liu, X.; Shi, H.; Li, M.; Wang, D. Mutation of foxl2 or cyp19a1a results in female to male sex reversal in XX Nile tilapia. Endocrinology 2017, 158, 2634–2647. [Google Scholar] [CrossRef] [Green Version]
  24. Lau, E.S.W.; Zhang, Z.; Qin, M.; Ge, W. Knockout of zebrafish ovarian aromatase gene (cyp19a1a) by TALEN and CRISPR/Cas9 leads to all-male offspring due to failed ovarian differentiation. Sci. Rep. 2016, 6, 37357. [Google Scholar] [CrossRef] [PubMed] [Green Version]
  25. Theodoridi, A.; Dinarello, A.; Badenetti, L.; Pavlidis, M.; Dalla Valle, L.; Tsalafouta, A. Knockout of the hsd11b2 Gene Extends the Cortisol Stress Response in Both Zebrafish Larvae and Adults. Int. J. Mol. Sci. 2021, 22, 12525. [Google Scholar] [CrossRef]
  26. Viñas, J.; Piferrer, F. Stage-specific gene expression during fish spermatogenesis as determined by laser-capture microdissection and quantitative-PCR in sea bass (Dicentrarchus labrax) gonads. Biol. Reprod. 2008, 79, 738–747. [Google Scholar] [CrossRef] [PubMed] [Green Version]
  27. Zhu, Q.; Han, C.; Peng, C.; Zhou, X.; Wang, C.; Han, L.; Li, S.S.; Li, G.F.; Lin, H.R.; Zhang, Y. Identification of potential sex-related genes in Siniperca chuatsi. J. Oceanol. Limnol. 2021, 39, 1500–1512. [Google Scholar] [CrossRef]
  28. Lin, Q.; Mei, J.; Li, Z.H.; Zhang, X.; Zhou, L.; Gui, J.F. Distinct and cooperative roles of amh and dmrt1 in self-renewal and differentiation of male germ cells in zebrafish. Genetics 2017, 207, 1007–1022. [Google Scholar] [CrossRef] [Green Version]
  29. Li, M.; Sun, Y.; Zhao, J.; Shi, H.; Zeng, S.; Ye, K.; Jiang, D.; Zhou, L.; Sun, L.; Tao, W.; et al. A Tandem Duplicate of Anti-Mullerian Hormone with a Missense SNP on the Y Chromosome Is Essential for Male Sex Determination in Nile Tilapia, Oreochromis niloticus. PLoS Genet. 2015, 11, e1005678. [Google Scholar] [CrossRef] [Green Version]
  30. Liu, X.; Dai, S.; Wu, J.; Wei, X.; Zhou, X.; Chen, M.; Tan, D.; Pu, D.; Li, M.; Wang, D. Roles of Anti-Müllerian hormone (Amh) and its duplicates in sex determination and germ cell proliferation of Nile tilapia. Genetics 2021, 220, iyab237. [Google Scholar] [CrossRef]
  31. Dranow, D.B.; Hu, K.; Bird, A.M.; Lawry, S.T.; Adams, M.T.; Sanchez, A.; Amatruda, G.F.; Draper, B.W. Bmp15 is an oocyte-produced signal required for maintenance of the adult female sexual phenotype in zebrafish. PLoS Genet. 2016, 12, e1006323. [Google Scholar] [CrossRef] [PubMed] [Green Version]
  32. Wei, L.; Yang, C.; Tao, W.; Wang, D. Genome-wide identification and transcriptome-based expression profiling of the Sox gene family in the Nile Tilapia (Oreochromis niloticus). Int. J. Mol. Sci. 2016, 17, 270. [Google Scholar] [CrossRef] [PubMed]
  33. Schartl, M.; Schories, S.; Wakamatsu, Y.; Nagao, Y.; Hashimoto, H.; Bertin, C.; Mourot, B.; Schmidt, C.; Wilhelm, D.; Centanin, L.; et al. Sox5 is involved in germ-cell regulation and sex determination in medaka following co-option of nested transposable elements. BMC Biol. 2018, 16, 16. [Google Scholar] [CrossRef] [PubMed] [Green Version]
  34. Barrionuevo, F.; Georg, I.; Scherthan, H.; Lécureuil, C.; Guillou, F.; Wegner, M.; Scherer, G. Testis cord differentiation after the sex determination stage is independent of Sox9 but fails in the combined absence of Sox9 and Sox8. Dev. Biol. 2009, 327, 301–312. [Google Scholar] [CrossRef] [PubMed] [Green Version]
  35. Li, Y.; Zheng, M.; Lau, Y.F.C. The sex-determining factors SRY and SOX9 regulate similar target genes and promote testis cord formation during testicular differentiation. Cell Rep. 2014, 8, 723–733. [Google Scholar] [CrossRef] [Green Version]
  36. Fujihara, Y.; Oji, A.; Larasati, T.; Kojima-Kita, K.; Ikawa, M. Human globozoospermia-related gene Spata16 is required for sperm formation revealed by CRISPR/Cas9-mediated mouse models. Int. J. Mol. Sci. 2017, 18, 2208. [Google Scholar] [CrossRef] [PubMed] [Green Version]
  37. Dam, A.H.; Koscinski, I.; Kremer, J.A.; Moutou, C.; Jaeger, A.S.; Oudakker, A.R.; Tournaye, H.; Charlet, N.; Largier-Tourenne, C.; Bokhoven, H. Homozygous mutation in SPATA16 is associated with male infertility in human globozoospermia. Am. J. Hum. Genet. 2007, 81, 813–820. [Google Scholar] [CrossRef] [Green Version]
  38. Yang, D.; Yin, C.; Chang, Y.; Dou, Y.; Hao, Z.; Ding, J. Transcriptome analysis of male and female mature gonads of Japanese scallop Patinopecten yessonsis. Genes Genom. 2016, 38, 1041–1052. [Google Scholar] [CrossRef]
Figure 1. Length distribution of all assembled unigenes of the S. hollandi gonadal transcriptome. X-axis: size of unigene; Y-axis: number of unigenes.
Animals 13 00166 g001
Figure 2. Venn diagrams of functional annotation against five major databases and species distribution of annotated homologous genes against NR database.
Animals 13 00166 g002
Figure 3. Gene function classification based on GO (A), KEGG (B) and KOG (C) databases.
Animals 13 00166 g003
Figure 4. (A) Differentially expressed genes in males (testis) and females (ovary) of S. hollandi. (B) Volcano plot of DEGs in testis versus ovary. Red and green keys and dots represent upregulated and downregulated genes, respectively, in males, and vice versa.
Animals 13 00166 g004
Figure 5. Top 22 KEGG enrichment analysis. The horizontal axis is the ratio of the number of differential genes annotated to the KEGG pathway to the total number of differential genes. The vertical is the enriched KEGG pathways. The size of the dots represents the number of genes annotated on the KEGG pathway term. The colors key, from red to blue, represent significant enrichment.
Animals 13 00166 g005
Figure 6. Validation of gonad transcriptome data by qRT-PCR.
Animals 13 00166 g006
Table 1. Primers of qRT-PCR.
Primer IDPrimer Sequences
GDCB-amh-QP1FTCCACAGAGTCCCTGCTATCA
GDCB-amh-QP1RCAATCACCTTTTGCCCCAC
GDCB-hsd11b2-QP1FAGACAGGCTAAAGGCCGGA
GDCB-hsd11b2-QP1RTGACGAAGTGTGTTGGTAAGAAGAT
GDCB-fshr-QP1FCGCCTTCTTCAACCTCAC
GDCB-fshr-QP1RGTTACTTGGAATCCTTTCTATG
GDCB-era-QP1FGCATTTTCATTCTGCTCCAGTC
GDCB-era-QP1RCATTCCTTTGTTGCTCATGTGTCT
GDCB-erbeta1-QP1FCCGCTGGTGAAGAGGGTAGT
GDCB-erbeta1-QP1RGCAGATGTAGTCATTGTGTCCTTGTAT
GDCB-erbeta2-QP1FTGGAGAGCCGTGGGAAGGTT
GDCB-erbeta2-QP1RTGTTGCTGAGGTGTCGAATATG
GDCB-ar-QP1FCCCCCAGCAAGGGAATAATATG
GDCB-ar-QP1RTCAGCGCCCCGAAAGAAA
GDCB-foxk2-QP1FTGAAGCTGCCGAGAGTGTGC
GDCB-foxk2-QP1RGGGATGTTGATGGTTAAAGGGG
GDCB-smad4a-QP1FCCAGGGAGGAGAGAATGAGAGC
GDCB-smad4a-QP1RCGAGCGTATATGACATGAGGGAA
GDCB-gdf6-QP1FAGTGTCCAAGTCTGTTCCTGCT
GDCB-gdf6-QP1RCTCGTTATGGTGTTTGCTGC
GDCB-bmp7-QP1FCACCGCTCTAAAAACCCCA
GDCB-bmp7-QP1RATTCTCCCTCACAGTAATACGCA
GDCB-pax7-QP1FAGGCCAGAGTGCAGGTTTGG
GDCB-pax7-QP1RTGTGGTAATGTTGTTGAAGGATAGG
GDCB-pax8-QP1FAAACCAGGAGTCATCGGGGG
GDCB-pax8-QP1RCCTTTGCTGTCCAGAGGAAGG
GDCB-sox9-QP1FAGGTCAGAGCTCCGGCTTGTACT
GDCB-sox9-QP1RTGTGATTGGGTTGGGGAATGG
GDCB-sox5-QP1FACCAAAGCCCAAGGACGAGG
GDCB-sox5-QP1RGCCGGAGGTGATGGATGACA
GDCB-beta-actin-QP1FGTGTTGGCATACAGGTCCTTACG
GDCB-beta-actin-QP1RACGGACAGGTCATCACCATTG
Table 2. Summary statistics of the gonadal RNA-Seq data.
SampleReads Number Base NumberTotal BaseQ20 Q30 GC
JC-K523,015,034 3,452,255,100 6,904,510,200 98.33%95.25%46.53%
23,015,034 3,452,255,100 97.96%94.12%46.51%
JC-K824,277,601 3,641,640,150 7,283,280,300 98.29%95.16%46.56%
24,277,601 3,641,640,150 97.86%93.88%46.54%
JC-K919,990,173 2,998,525,950 5,997,051,900 98.32%95.21%46.21%
19,990,173 2,998,525,950 98.08%94.42%46.18%
LC-K123,109,316 3,466,397,400 6,932,794,800 98.11%94.96%48.05%
23,109,316 3,466,397,400 97.85%94.20%48.03%
LC-K321,181,082 3,177,162,300 6,354,324,600 98.29%95.23%48.17%
21,181,082 3,177,162,300 97.83%94.01%48.15%
LC-K920,827,911 3,124,186,650 6,248,373,300 98.42%95.45%48.03%
20,827,911 3,124,186,650 98.12%94.58%48.00%
Table 3. Summary statistics of the S. hollandi gonadal transcriptome assembly.
Number
Gene Number (#):167,152
Total length (nt):145,709,933
Average length (nt):871
Max length (nt):18,177
Min length (nt):280
N501198
Table 4. The patterns of differentially expressed genes related to reproduction, gonad development and differentiation in the gonads of S. hollandi (JC_vs_LC means testis vs ovary).
Unigene IDlog2FC (JC_vs_LC)p Value (JC_vs_LC)FDR (JC_vs_LC)Nr AnnotationGene Name
unigene0744557.5724.92 × 10−91.83 × 10−08Growth differentiation factor 6gdf6
unigene0274087.3182.71 × 10−91.04 × 10−08Neuropeptide Y receptor type 2npy2r
unigene0166447.1597.36 × 10−144.50 × 10⁻¹³Cytochrome P450 11Bcyp11b1
unigene0582836.8034.63 × 10−081.52 × 10−07Forkhead box protein K2foxk2
unigene0656026.7183.09 × 10−045.54 × 10−04Paired box protein Pax-6pax6
unigene0472536.4814.79 × 10−061.16 × 10−05Fibroblast growth factor 20fgf20
unigene0826036.3252.40 × 10−055.23 × 10−05Bone morphogenetic protein 7Bmp7
unigene1001156.1121.68 × 10−043.17 × 10−04Forkhead box G1-like proteinfoxg1
unigene0345056.0521.43 × 10−053.24 × 10−05Catenin delta-2ctnnd2
unigene0224265.9411.44 × 10−191.38 × 10⁻¹⁸Paired box protein Pax-2apax2
unigene1410215.8782.57 × 10−121.37 × 10⁻¹¹Nanos homolog 2nanos2
unigene0214325.8745.49 × 10−051.12 × 10−04Paired box protein Pax-7pax7
unigene0089105.8673.93 × 10−058.24 × 10−05Forkhead box protein L1foxl1
unigene1067295.8565.75 × 10−1081.08 × 10−105Anti-Mullerian hormoneamh
unigene0354215.7987.51 × 10−134.21 × 10⁻¹²Insulin-like growth factor-Iigf1
unigene0865945.6611.96 × 10−108.53 × 10⁻¹⁰Protein Wnt-6wnt6
unigene1303695.6172.78 × 10−034.27 × 10−03Transforming growth factor beta receptor type 3tgfbr3
unigene1231354.9907.83 × 10−331.54 × 10⁻³¹Transcription factor SOX9sox9
unigene0891704.8781.56 × 10−139.30 × 10⁻¹³Protein Wnt-5awnt5
unigene0259704.5396.90 × 10−113.16 × 10⁻¹⁰Protein Wnt-2bwnt2
unigene0096974.4871.83 × 10−108.00 × 10⁻¹⁰Gonadotropin-releasing hormone II receptorgnrhr
unigene1258334.4611.52 × 10−191.45 × 10⁻¹⁸Sperm-associated antigen 1spag1
unigene1598344.4181.43 × 10−063.77 × 10−06Follicle stimulating hormone receptorfshr
unigene0186304.3446.47 × 10−237.59 × 10⁻²²Mothers against decapentaplegic homolog 4asmad4a
unigene1433204.0165.73 × 10−061.38 × 10−05Forkhead box D2-like proteinfoxd2
unigene0369913.7661.74 × 10−043.27 × 10−04Protein Wnt-3awnt3
unigene1319833.7251.54 × 10−096.08 × 10−09Bone morphogenetic protein 6 isoform X1bmp6
unigene0720663.6921.06 × 10−042.07 × 10−04Forkhead box P1-B-like isoform X1foxp1
unigene0215953.6262.58 × 10−066.54 × 10−06Bone morphogenetic protein receptor type-2bmpr2
unigene0943513.5751.65 × 10−096.47 × 10−09Paired box protein Pax-3pax3
unigene0775003.5325.58 × 10−081.81 × 10−07Paired box protein Pax-8pax8
unigene1145633.4616.23 × 10−061.49 × 10−05Forkhead box protein O6foxo6
unigene0209543.4472.05 × 10−076.11 × 10−07Transcription factor Sox-1asox1
unigene1510193.3526.41 × 10−082.06 × 10−07Protein Wnt-11wnt11
unigene1574843.3047.84 × 10−331.54 × 10⁻³¹Fibroblast growth factor receptor 2fgfr2
unigene0605993.2202.39 × 10−182.10 × 10⁻¹⁷Transcription factor SOX-5sox5
unigene0606243.2129.24 × 10−114.17 × 10⁻¹⁰Growth-hormone-releasing hormone receptorghrhr
unigene0713073.2106.50 × 10−175.12 × 10⁻¹⁶Transforming growth factor beta-2tgfb2
unigene1193813.1811.92 × 10−108.37 × 10⁻¹⁰Insulin-like growth-factor-binding 3igfb3
unigene0027463.0746.17 × 10−206.04 × 10⁻¹⁹Corticosteroid 11-beta-dehydrogenase isozyme 2hsd11b2
unigene0738442.8904.90 × 10−132.79 × 10⁻¹²Estrogen receptor beta 2erb2
unigene0762082.7641.34 × 10−063.55 × 10−06Follitropin subunit betafshb
unigene1456232.7637.92 × 10−092.87 × 10−08Insulin-like growth-factor-binding protein 1igfbp1
unigene1448602.7592.51 × 10−077.39 × 10−07Forkhead box protein O3foxo3
unigene0520542.7306.22 × 10−112.86 × 10⁻¹⁰Fibroblast growth factor receptor 4fgfr4
unigene1269292.6046.48 × 10−061.55 × 10−05Bone morphogenetic protein 2bmp2
unigene1465292.3837.29 × 10−072.01 × 10−06Transcription factor sox7sox7
unigene1565352.3802.36 × 10−131.38 × 10⁻¹²Estrogen receptor beta 1erb1
unigene0576872.3728.63 × 10−072.35 × 10−06stAR-related lipid transfer protein 13stard13
unigene0310512.3511.86 × 10−054.13 × 10−05Forkhead box protein D1foxd1
unigene0138112.2653.43 × 10−035.18 × 10−03Androgen receptor proteinar
unigene1019542.2642.05 × 10−043.80 × 10−04Gonadotropin-releasing hormonegnrh
unigene1001042.2363.13 × 10−067.84 × 10−06double sex- and mab-3-related transcription factor 2dmrt2
unigene0084052.2071.52 × 10−032.43 × 10−03Spermatogenesis-associated protein 16sgap16
unigene1058512.1743.57 × 10−035.37 × 10−03Paired box protein Pax-4pax4
unigene0402292.1601.35 × 10−084.77 × 10−08Growth/differentiation factor 10gdf10
unigene1225112.1171.60 × 10−064.18 × 10−06Transcription factor SOX-4sox4
unigene054659−2.4163.36 × 10−131.94 × 10⁻¹²Spermatid perinuclear RNA-binding protein isoform X3strbp
unigene147986−2.4633.91 × 10−091.47 × 10−08Cytochrome P450 aromatasecyp19a1a
unigene017060−2.5631.13 × 10−312.10 × 10⁻³⁰TGF-beta receptor type-2-like isoform X1tgfbr2
unigene124450−2.9472.27 × 10−385.69 × 10−37Catenin beta-1ctnnb1
unigene062930−2.9645.89 × 10−112.72 × 10⁻¹⁰Transcription factor Sox-3sox3
unigene014765−3.0274.13 × 10−101.73 × 10−09Spermatogenesis-associated protein 13sgap13
unigene000100−3.0708.27 × 10−072.26 × 10−06Sperm-associated antigen 5spag5
unigene127688−3.1053.71 × 10−441.16 × 10−42sTART domain-containing protein 10stard10
unigene152354−3.6748.97 × 10−103.63 × 10−09Paired box protein Pax-1pax1
unigene051443−3.7172.71 × 10−182.37 × 10⁻¹⁷Double sex- and mab-3-related transcription factor A1dmrta1
unigene143561−3.9151.79 × 10−711.39 × 10−69Growth/differentiation factor 9gdf9
unigene125277−3.9255.06 × 10−132.88 × 10⁻¹²Estradiol 17-beta-dehydrogenase 2hsd17b2
unigene069571−3.9651.60 × 10−881.96 × 10−86Bone morphogenetic protein 15bmp15
unigene086306−4.6442.71 × 10−182.37 × 10⁻¹⁷Nuclear receptor subfamily 5 group A member 2nr5a2
unigene007641−5.9565.52 × 10−411.55 × 10−39Forkhead box protein P3foxp3
unigene060440−5.9933.07 × 10−501.20 × 10−48Transcription factor Sox-19bsox19b
unigene150909−6.8704.59 × 10−1703.12 × 10−167Transcription factor Sox-21-Asox31a
unigene158966−7.1398.15 × 10−472.82 × 10−45Protein Wnt-8awnt8
unigene043515−11.7223.97 × 10−1421.52 × 10−139Zona pellucida sperm-binding protein 4zp4
unigene055600−12.1535.03 × 10−2201.32 × 10−216Zona pellucida sperm-binding protein 3zp3
unigene077416−14.3283.82 × 10−1813.10 × 10−178Growth/differentiation factor 3gdf3
Disclaimer/Publisher’s Note: The statements, opinions and data contained in all publications are solely those of the individual author(s) and contributor(s) and not of MDPI and/or the editor(s). MDPI and/or the editor(s) disclaim responsibility for any injury to people or property resulting from any ideas, methods, instructions or products referred to in the content.

