Figure 1.
Representation of peripheral blood leukocyte flow cytometry data of the studied horses, after lysis of erythrocytes, in a dot plot. Cell populations were selected according to their forward scatter (FSC) versus side scatter (SSC) profiles indicating cell size versus granularity and complexity. R1 corresponds to the neutrophil gate, R2 corresponds to lymphocytes, and R3 corresponds to monocytes.
Figure 2.
(A,B): % of phagocytosis performed by neutrophils from animals of group I (A) and group II (B) samples. (C,D): phagocytosis intensity expressed as mean fluorescence intensity (geometric mean of the number of bacteria destroyed by neutrophils) from animals in group I (C) and group II (D). (E,F): mean fluorescence on a logarithmic scale of the neutrophils in the samples of animals of group I (E) and group II (F). Group I—moments −11 d, 0 d, +1 d, +2 d and +3 d. Group II—moments −8 d, 0 d, +1 d and +5 d. a,b = significant statics difference.
Figure 3.
Mean values of total apoptotic cells in moments −8 d, 0 d, +1 d, and +5 d, in the samples of the animals of group II. Statistical difference according to the Tukey–Kramer test—Beltsville, 2003.
Figure 3.
Mean values of total apoptotic cells in moments −8 d, 0 d, +1 d, and +5 d, in the samples of the animals of group II. Statistical difference according to the Tukey–Kramer test—Beltsville, 2003.
Figure 4.
Flow cytometry data, in dot plot, of the peripheral blood mononuclear leukocytes of the studied horses, after a 72-h culture. Cell populations identified according to their forward scatter (FSC) versus side scatter (SSC) profiles, cell size versus granularity and complexity. R4—lymphocyte gate.
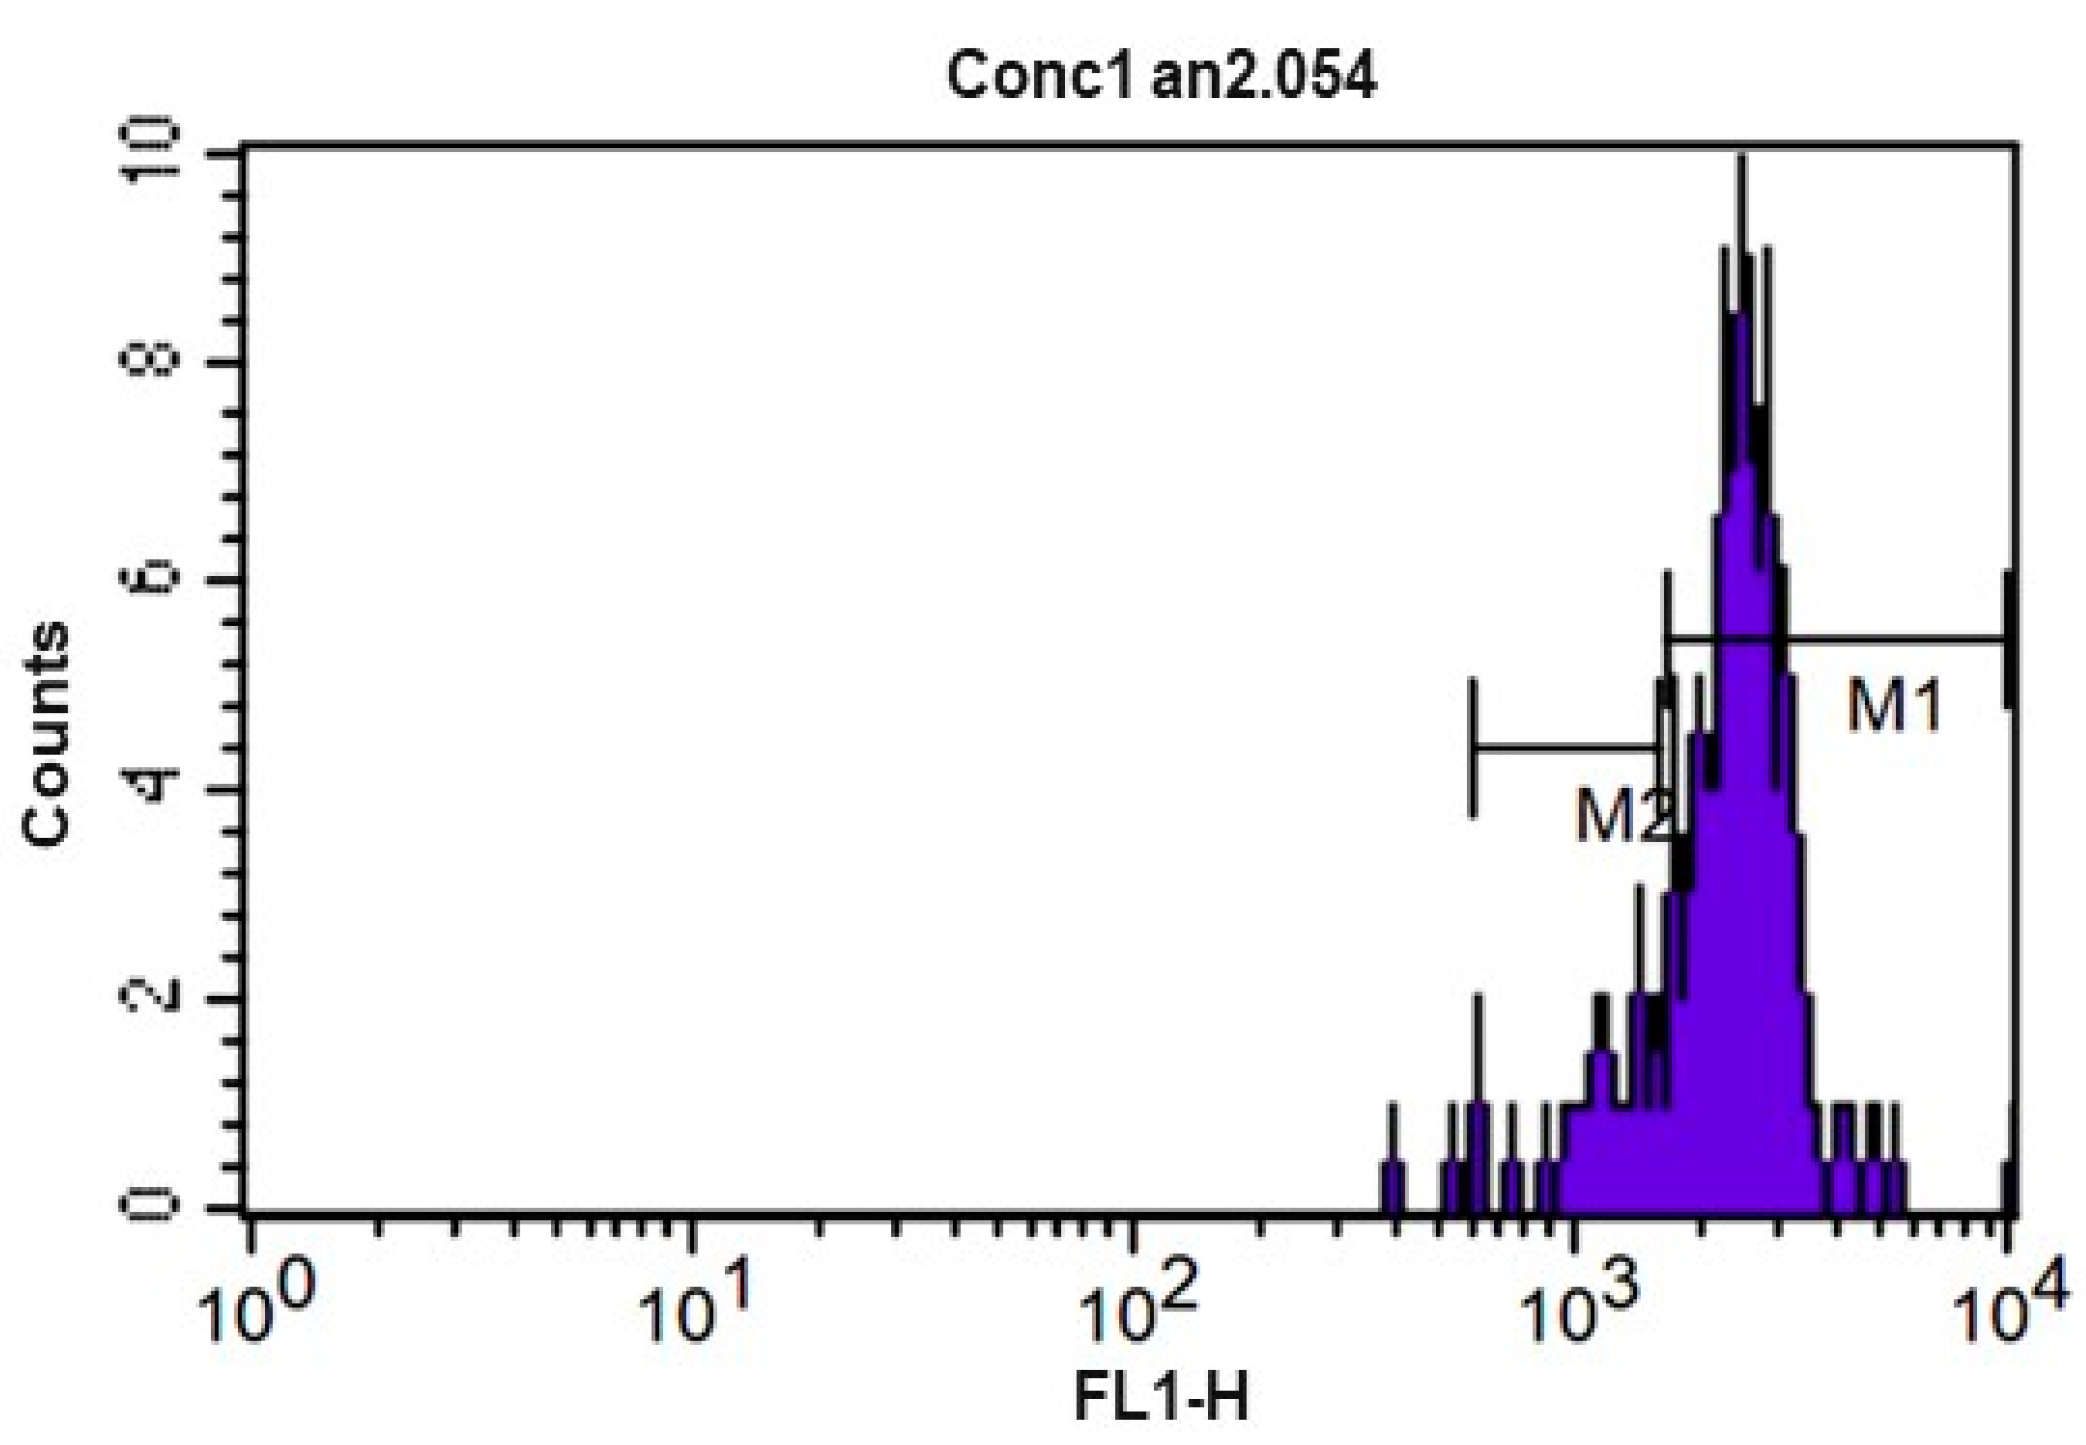
Figure 5.
CFSE fluorescence histogram (carboxyfluorescein diacetate) of equine peripheral blood lymphocytes after culture for 72 h at 5% CO2 and 37 °C without use of mitogens (control). M1 and M2 represent the markers used to enumerate the events of each division cycle that the software used for calculating the proliferation index.
Figure 6.
CFSE fluorescence histogram (carboxyfluorescein diacetate) of lymphocytes from equine peripheral blood after 72 h culture at 5% CO2 and 37 °C without concavalin A. M1 and M2 represent the markers used to list the events of each division cycle that the software used for calculating the proliferation index.
Figure 7.
Representation of the average values referring to the counting of the relative number (%) of neutrophils (No) at the different collection days defined as −8 d, 0 d, +1 d, and +5 d. Statistical difference according to the Tukey–Kramer test—Beltsville, 2003. a = significant statics difference.
Figure 8.
Representation of the average values of the relative number (%) of lymphocytes (Lo) on the different collection days defined as −8 d, 0 d, +1 d, and +5 d. Statistical difference performed according to the Tukey–Kramer test—Beltsville, 2003. b = significant statics difference.
Figure 8.
Representation of the average values of the relative number (%) of lymphocytes (Lo) on the different collection days defined as −8 d, 0 d, +1 d, and +5 d. Statistical difference performed according to the Tukey–Kramer test—Beltsville, 2003. b = significant statics difference.
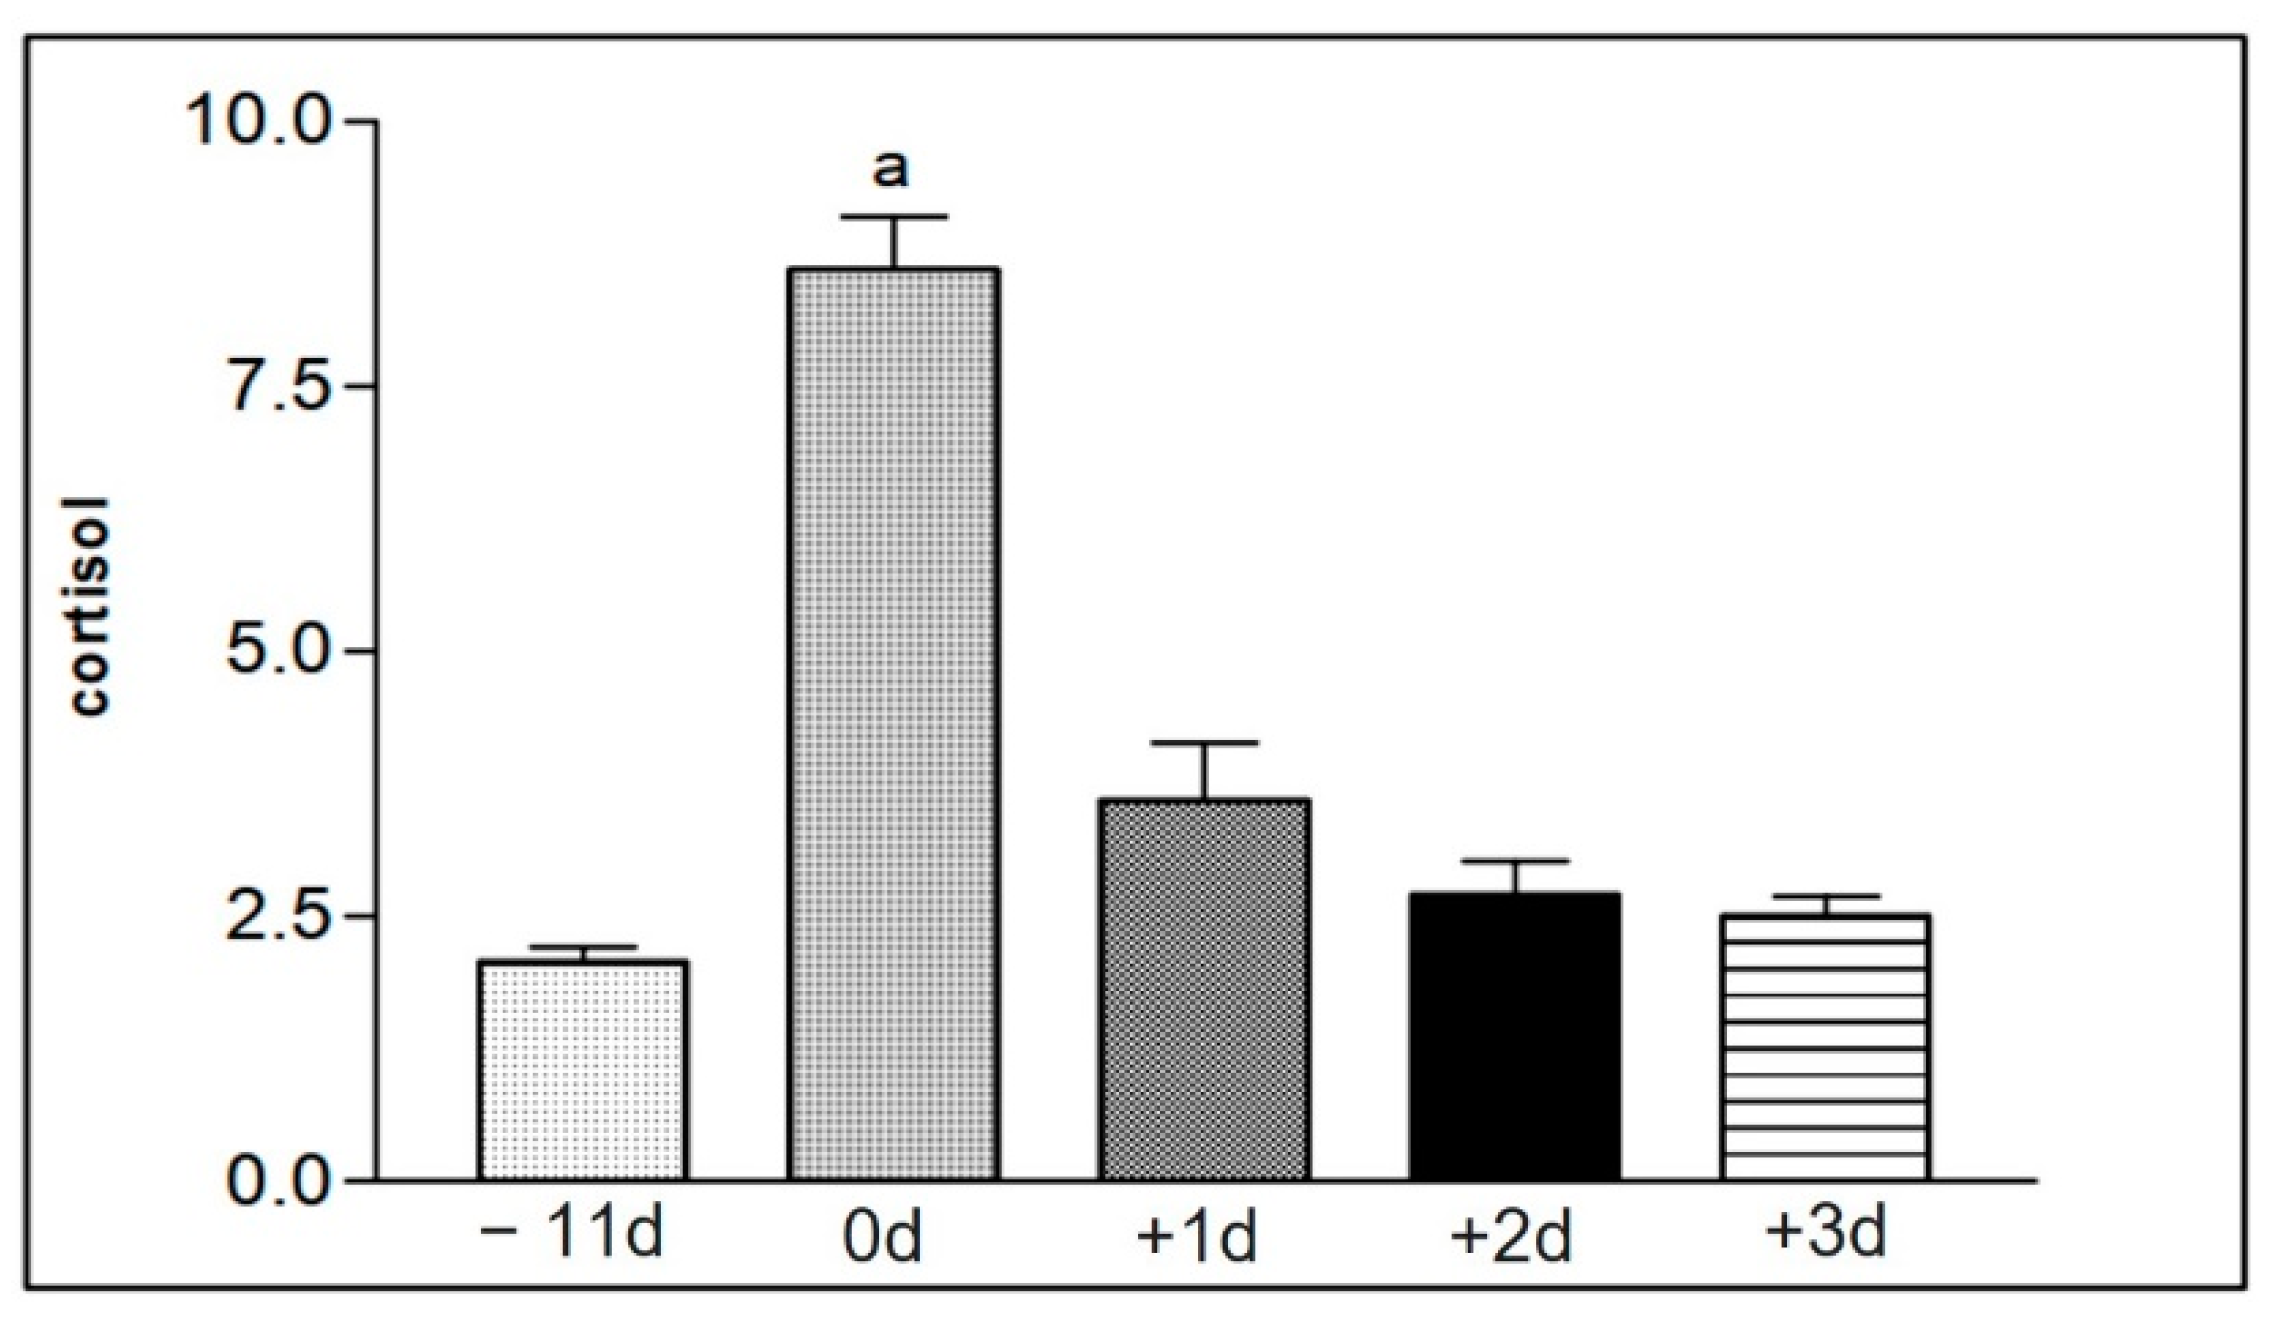
Figure 9.
Representation of the mean values of serum cortisol levels from the samples of the animals in group I (1 to 15), taken at the different collection moments at −11 d, 0 d, +1 d, +2 d, and +3 d. Statistical difference according to the Tukey–Kramer test—Beltsville, 2003. a = significant statics difference.
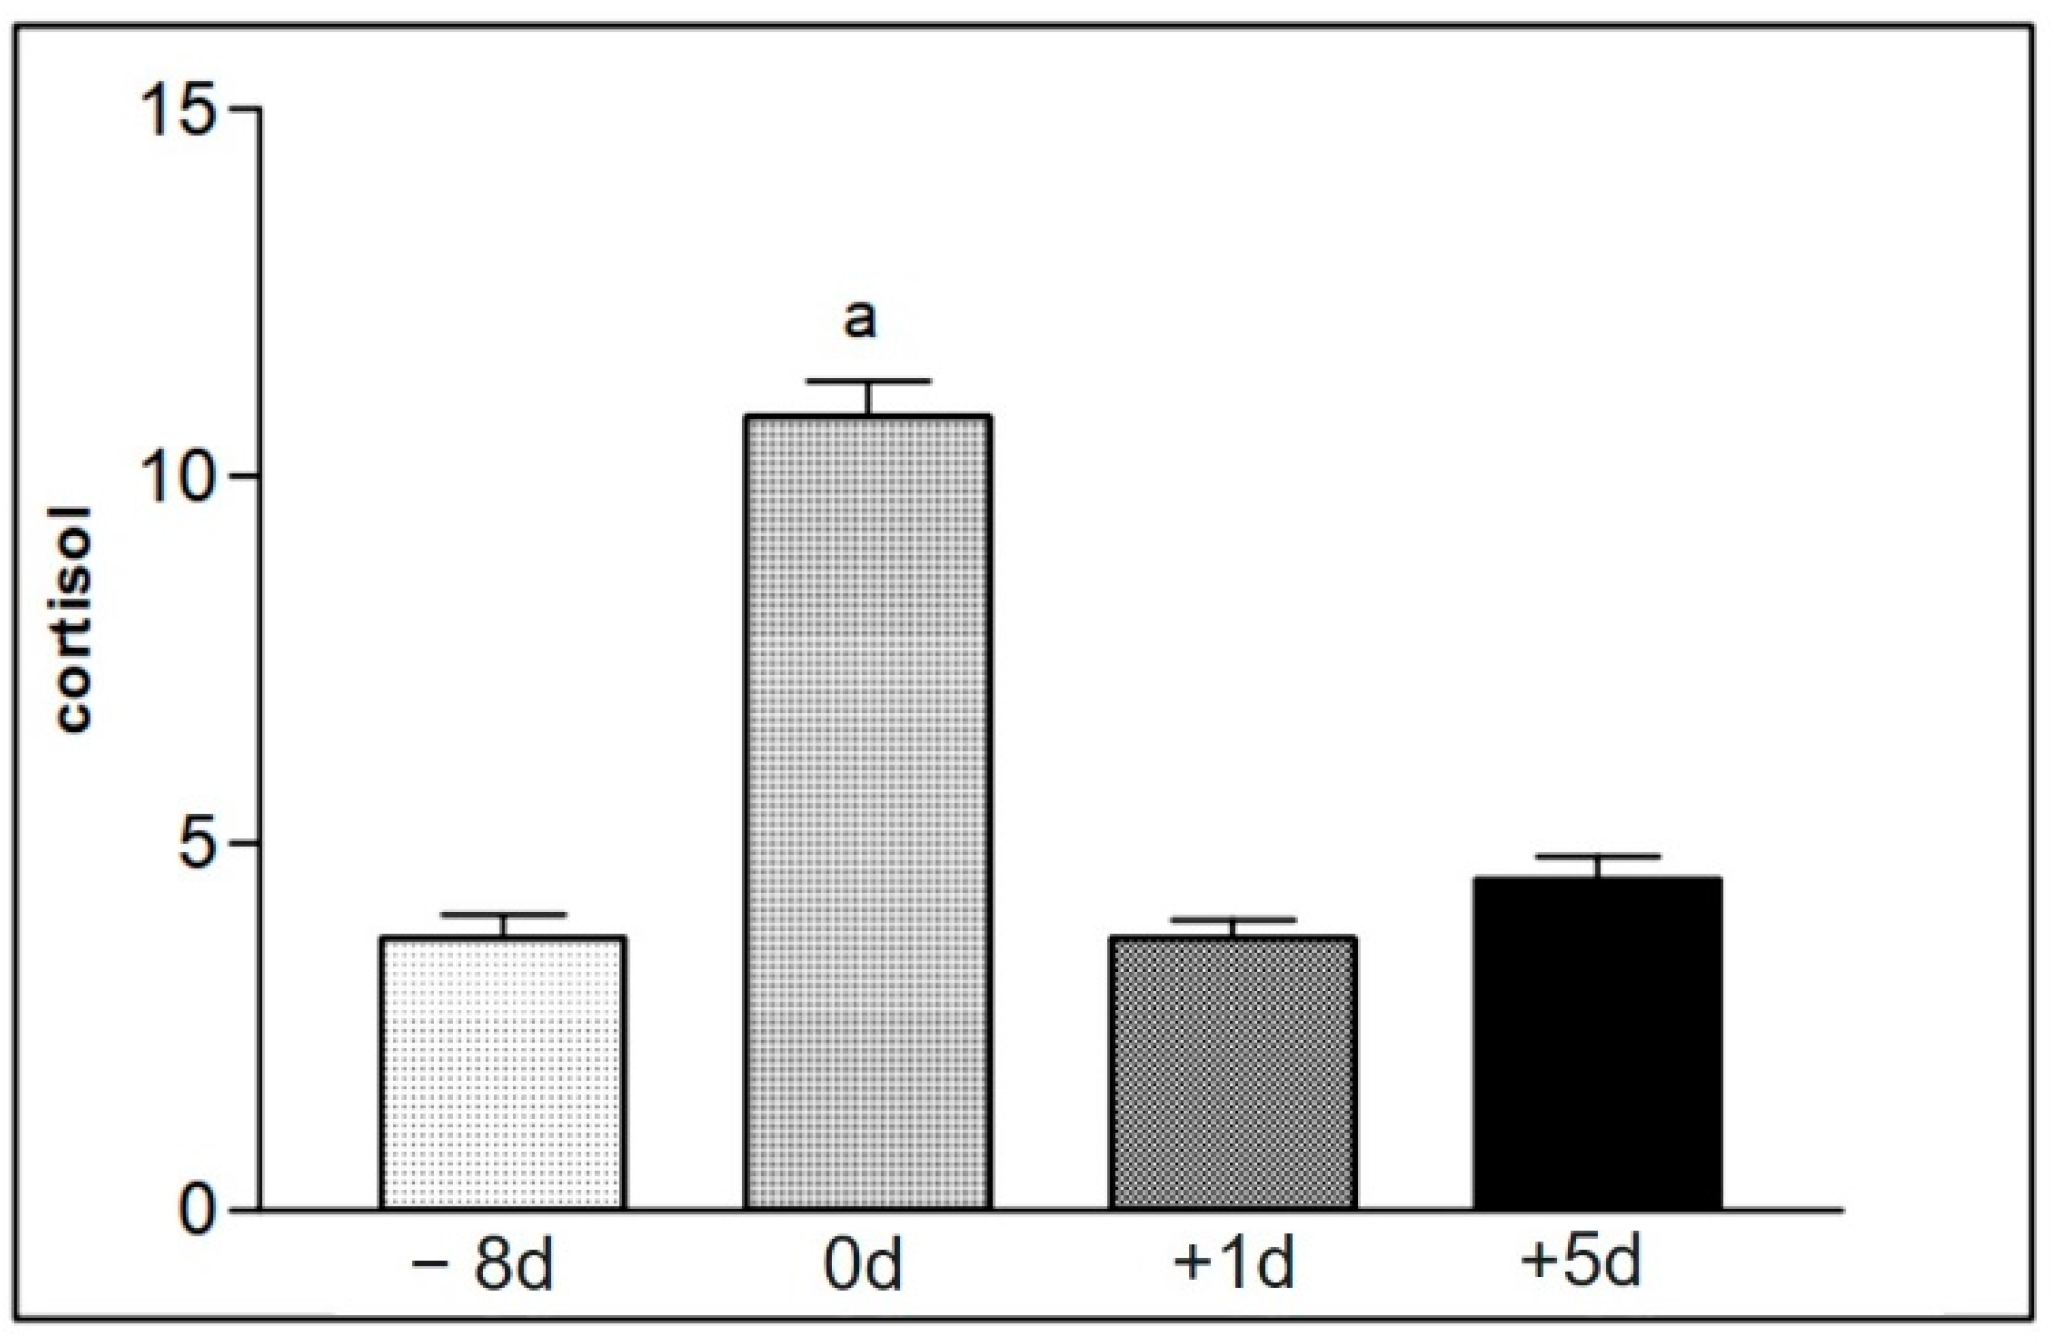
Figure 10.
Representation of the mean values of serum cortisol levels of samples from animals in group II (16 to 30), found at the different moments of collection defined as −8 d, 0 d, +1 d, and +5 d. Statistical difference according to the Tukey–Kramer test—Beltsville, 2003. a = significant statics difference.
Table 1.
Studied animals’ sex, age (in years), and distance raced in meters.
Table 1.
Studied animals’ sex, age (in years), and distance raced in meters.
| Animal | Sex | Age | Distance Raced |
|---|
| 1 | F | 2 | 1400 m |
| 2 | M | 4 | 1600 m |
| 3 | F | 3 | 1400 m |
| 4 | F | 3 | 1800 m |
| 5 | M | 4 | 1600 m |
| 6 | M | 3 | 2400 m |
| 7 | F | 3 | 1800 m |
| 8 | F | 3 | 1800 m |
| 9 | M | 4 | 1500 m |
| 10 | M | 5 | 1600 m |
| 11 | M | 2 | 1500 m |
| 12 | M | 3 | 1400 m |
| 13 | F | 5 | 2000 m |
| 14 | F | 3 | 1500 m |
| 15 | F | 3 | 1500 m |
| 16 | M | 5 | 1400 m |
| 17 | F | 3 | 1400 m |
| 18 | F | 3 | 1400 m |
| 19 | M | 3 | 1400 m |
| 20 | M | 3 | 1600 m |
| 21 | M | 3 | 1600 m |
| 22 | M | 5 | 2400 m |
| 23 | M | 4 | 2400 m |
| 24 | M | 6 | 2400 m |
| 25 | F | 3 | 2000 m |
| 26 | F | 3 | 2000 m |
| 27 | M | 4 | 2400 m |
| 28 | M | 3 | 2000 m |
| 29 | M | 3 | 2000 m |
| 30 | M | 4 | 2400 m |
Table 2.
Values representing the mean and the standard deviation of the percentage of cells that underwent phagocytosis and its intensity, with blood samples from group I (1 to 15) at times −11 d, 0 d, +1 d, +2 d, and +3 d. Statistical difference according to the Tukey–Kramer test—Beltsville, 2003.
Table 2.
Values representing the mean and the standard deviation of the percentage of cells that underwent phagocytosis and its intensity, with blood samples from group I (1 to 15) at times −11 d, 0 d, +1 d, +2 d, and +3 d. Statistical difference according to the Tukey–Kramer test—Beltsville, 2003.
| Group I | −11 d | 0 d | +1 d | +2 d | +3 d |
|---|
| % Phagocytosis | 75.8 ± 26.0 ab | 49.9 ± 27.8 b | 87.1 ± 18.9 a | 76.7 ± 24.9 ab | 67.3 ± 24.8 ab |
| Intensity | 26.9 ± 15.4 a | 16.3 ± 4.3 b | 33.2 ± 3.9 a | 23.7 ± 11.8 ab | 15.0 ± 3.3 b |
Table 3.
Values representing the average and the standard deviation of the percentage of cells that underwent phagocytosis and their intensity, analyzed with blood samples taken from animals in group II (16 to 30) at moments −8 d, 0 d, +1 d, and +5 d. Statistical difference according to the Tukey–Kramer test—Beltsville, 2003.
| Group II | −8 d | 0 d | +1 d | +5 d | Significance |
|---|
| % Phagocytosis | 97.4 ± 1.2 a | 66.4 ± 19.5 b | 86.9 ± 13.6 a | 97.8 ± 1.1 a | p < 0.0001 |
| Intensity | 57.8 ± 9.1 a | 27.0 ± 4.8 c | 42.6 ± 11.7 b | 47.9 ± 4.4 b | p < 0.0001 |
Table 4.
Values representing the average and the standard deviation of the oxidative burst performed with blood samples collected from animals in group I (1 to 15) at the moments −11 d, 0 d, +1 d, +2 d, and +3 d. Statistical difference measured according to the Tukey–Kramer test—Beltsville, 2003.
Table 4.
Values representing the average and the standard deviation of the oxidative burst performed with blood samples collected from animals in group I (1 to 15) at the moments −11 d, 0 d, +1 d, +2 d, and +3 d. Statistical difference measured according to the Tukey–Kramer test—Beltsville, 2003.
| Group I | −11 d | 0 d | +1 d | +2 d | +3 d | Significance |
|---|
| Oxidative burst | 1136.4 ± 407.2 a | 524.2 ± 248.9 b | 844.1 ± 256.6 ab | 1057.6 ± 253.1 a | 596.3 ± 231.6 b | p < 0.0001 |
Table 5.
Values representing the average and the standard deviation of oxidative burst performed with blood samples collected from animals in group II (16 to 30) at the moments −8 d, 0 d, +1 d, and +5 d. Statistical difference according to the Tukey–Kramer test—Beltsville, 2003.
Table 5.
Values representing the average and the standard deviation of oxidative burst performed with blood samples collected from animals in group II (16 to 30) at the moments −8 d, 0 d, +1 d, and +5 d. Statistical difference according to the Tukey–Kramer test—Beltsville, 2003.
| Group II | −8 d | 0 d | +1 d | +5 d | Significance |
|---|
| Oxidative burst | 356.6 ± 123.1 a | 367.4 ± 345.2 a | 302.0 ± 169.0 a | 514.2 ± 217.7 a | p > 0.4 |
Table 6.
Values representing the average and the standard deviation of the results of the apoptosis assay performed with blood samples collected from animals from group II (16 to 30), at moments −8 d, 0 d, +1 d and +5 d. Statistical difference according to the Tukey–Kramer test—Beltsville, 2003.
Table 6.
Values representing the average and the standard deviation of the results of the apoptosis assay performed with blood samples collected from animals from group II (16 to 30), at moments −8 d, 0 d, +1 d and +5 d. Statistical difference according to the Tukey–Kramer test—Beltsville, 2003.
| Group II | −8 d | 0 d | +1 d | +5 d | Significance |
|---|
| Apoptosis | 0.56 ± 0.61 a | 0.53 ± 0.55 a | 0.38 ± 0.39 a | 0.25 ± 0.23 a | p > 0.5 |
| Necrosis | 0.89 ± 0.28 a | 0.57 ± 0.58 ab | 0.31 ± 0.17 b | 0.23 ± 0.15 b | p < 0.001 |
| Viable cells | 98.6 ± 0.6 b | 98.7 ± 0.7 ab | 99.3 ± 0.5 ab | 99.4 ± 0.4 ab | p < 0.009 |
Table 7.
The values represent the average and standard deviation of lymphoproliferation results performed with blood samples collected from animals in group II (16 to 30) at −8 d, 0 d, +1 d, and +5 d. Statistical difference according to the Tukey–Kramer test—Beltsville, 2003.
Table 7.
The values represent the average and standard deviation of lymphoproliferation results performed with blood samples collected from animals in group II (16 to 30) at −8 d, 0 d, +1 d, and +5 d. Statistical difference according to the Tukey–Kramer test—Beltsville, 2003.
| Group II | −8 d | 0 d | +1 d | +5 d | Significance |
|---|
| Lymphoproliferation | 30.9 ± 4.0 a | 28.4 ± 4.5 a | 29.8 ± 3.3 a | 30.8 ± 3.6 a | p > 0.2 |
Table 8.
Values represent the average and standard deviation of the blood count results of the horses analyzed in the study: counting the total number of leukocytes (Leu); the relative number (%) of neutrophils (No), eosinophils (Eo), monocytes (Mo), and basophils (Bo); the total number of erythrocytes (He); hemoglobin concentration (Hb); globular volume (Hct); mean corpuscular volume (MCV); mean corpuscular hemoglobin (MCH); and mean corpuscular hemoglobin concentration (MCHC) at different collection times defined as −8 d, 0 d, +1 d, and +5 d. Statistical difference according to the Tukey–Kramer test—Beltsville, 2003.
Group II
Blood Count | −8 d | 0 d | +1 d | +5 d | Significance |
|---|
| Leu (10³/mL) | 7927 ± 1389 a | 9547 ± 1640 a | 8793 ± 1677 a | 8473 ± 1677 a | p > 0.09 |
| No (%) | 4.6 ± 2.3 b | 49.5 ± 2.9 a | 46.2 ± 2.4 b | 46.1 ± 3.3 b | p < 0.003 |
| Lo (%) | 51.7 ± 2.4 a | 49.7 ± 2.9 a | 51.7 ± 2.5 a | 52.0 ± 3.2 b | p > 0.09 |
| Mo (%) | 0.0 a | 0.0 a | 1.0 a | 0.0 a | p > 0.2 |
| Eo (%) | 1.33 ± 0.48 a | 1.06 ± 0.26 a | 1.33 ± 0.19 a | 1.53 ± 0.52 a | p > 0.06 |
| Bo (%) | 0.0 a | 0.0 a | 0.0 a | 0.0 a | p > 0.2 |
| He (×10³) | 10,378 ± 643.6 b | 13,021 ± 1066 a | 11,231.3 ± 993.3 b | 10,658.6 ± 886.2 b | p < 0.0001 |
| Hb (g/dL) | 14.6 ± 0.8 b | 17.5 ± 1.3 a | 15.3 ± 0.9 b | 14.8 ± 0.9 b | p < 0.0001 |
| Hct (%) | 43.5 ± 3.1 b | 57.7 ± 6.7 a | 46.7 ± 3.8 b | 44.6 ± 3.8 b | p < 0.0001 |
| MCV | 41.9 ± 0.7 b | 44.2 ± 2.3 a | 41.6 ± 0.7 b | 41.8 ± 0.6 b | p < 0.0001 |
| MCH | 13.9 ± 0.2 a | 13.5 ± 0.3 b | 12.7 ± 0.4 ab | 13.9 ± 0.3 a | p < 0.001 |
| MCHC | 33.3 ± 0.7 a | 30.5 ± 1.6 b | 32.8 ± 0.6 a | 33.3 ± 0.8 a | p < 0.0001 |
Table 9.
The values represent the average and standard deviation from serum cortisol concentrations, assessed by the blood samples collected from animals of group I (1 to 15) at the moments −11 d, 0 d, +1 d, +2 d, and +3 d. Statistical difference measured according to the Tukey–Kramer test—Beltsville, 2003.
| Group I | −11 d | 0 d | +1 d | +2 d | +3 d | Significance |
|---|
| Cortisol | 2.07 ± 0.5 b | 8.6 ± 1.9 a | 3.6 ± 1.2 b | 2.7 ± 1.1 b | 2.5 ± 0.6 b | p < 0.0001 |
Table 10.
The values represent the average and standard deviation of the concentrations of serum cortisol measured with blood samples collected from animals in group II (16 to 30) at the moments −8 d, 0 d, +1 d, and +5 d. Statistical difference according to the Tukey–Kramer test—Beltsville, 2003.
Table 10.
The values represent the average and standard deviation of the concentrations of serum cortisol measured with blood samples collected from animals in group II (16 to 30) at the moments −8 d, 0 d, +1 d, and +5 d. Statistical difference according to the Tukey–Kramer test—Beltsville, 2003.
| Group II | −8 d | 0 d | +1 d | +5 d | Significance |
|---|
| Cortisol | 3.7 ± 1.3 b | 10.8 ± 1.9 a | 3.7 ± 1.0 b | 4.5 ± 1.2 b | p > 0.0001 |


 ,
, 


