
Genome-Wide Genomic and Functional Association Study for Workability and Calving Traits in Holstein Cattle

 , , ,
, , ,
Abstract
:Simple Summary
Abstract
1. Introduction
2. Materials and Methods
3. Results
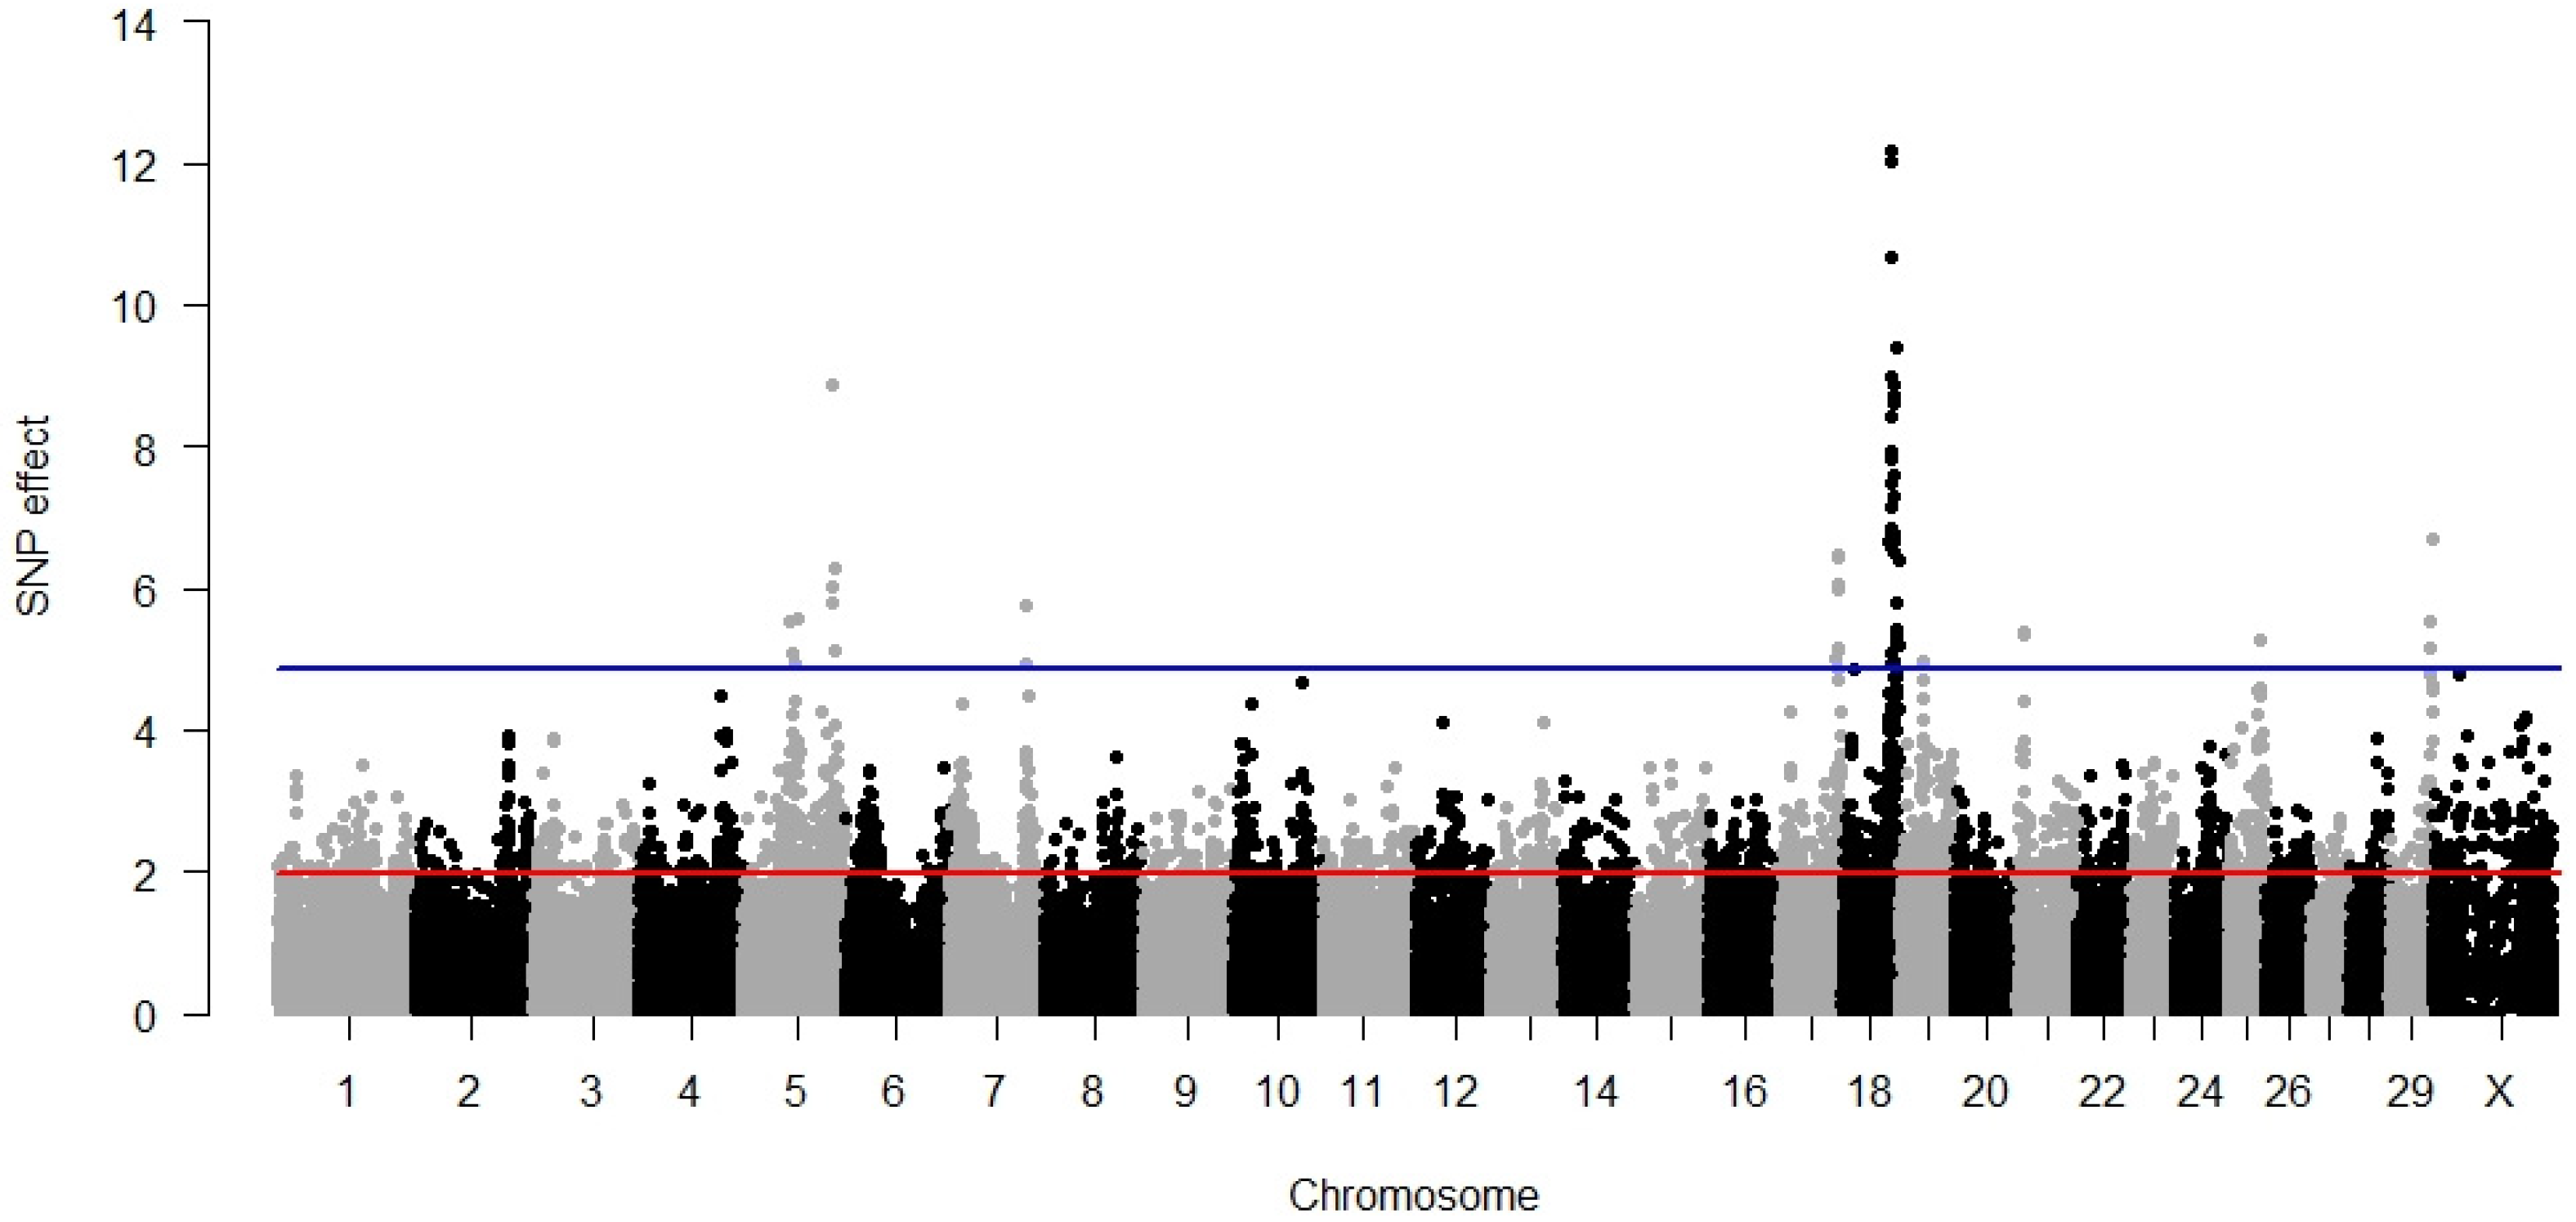
3.1. Direct Calving Ease
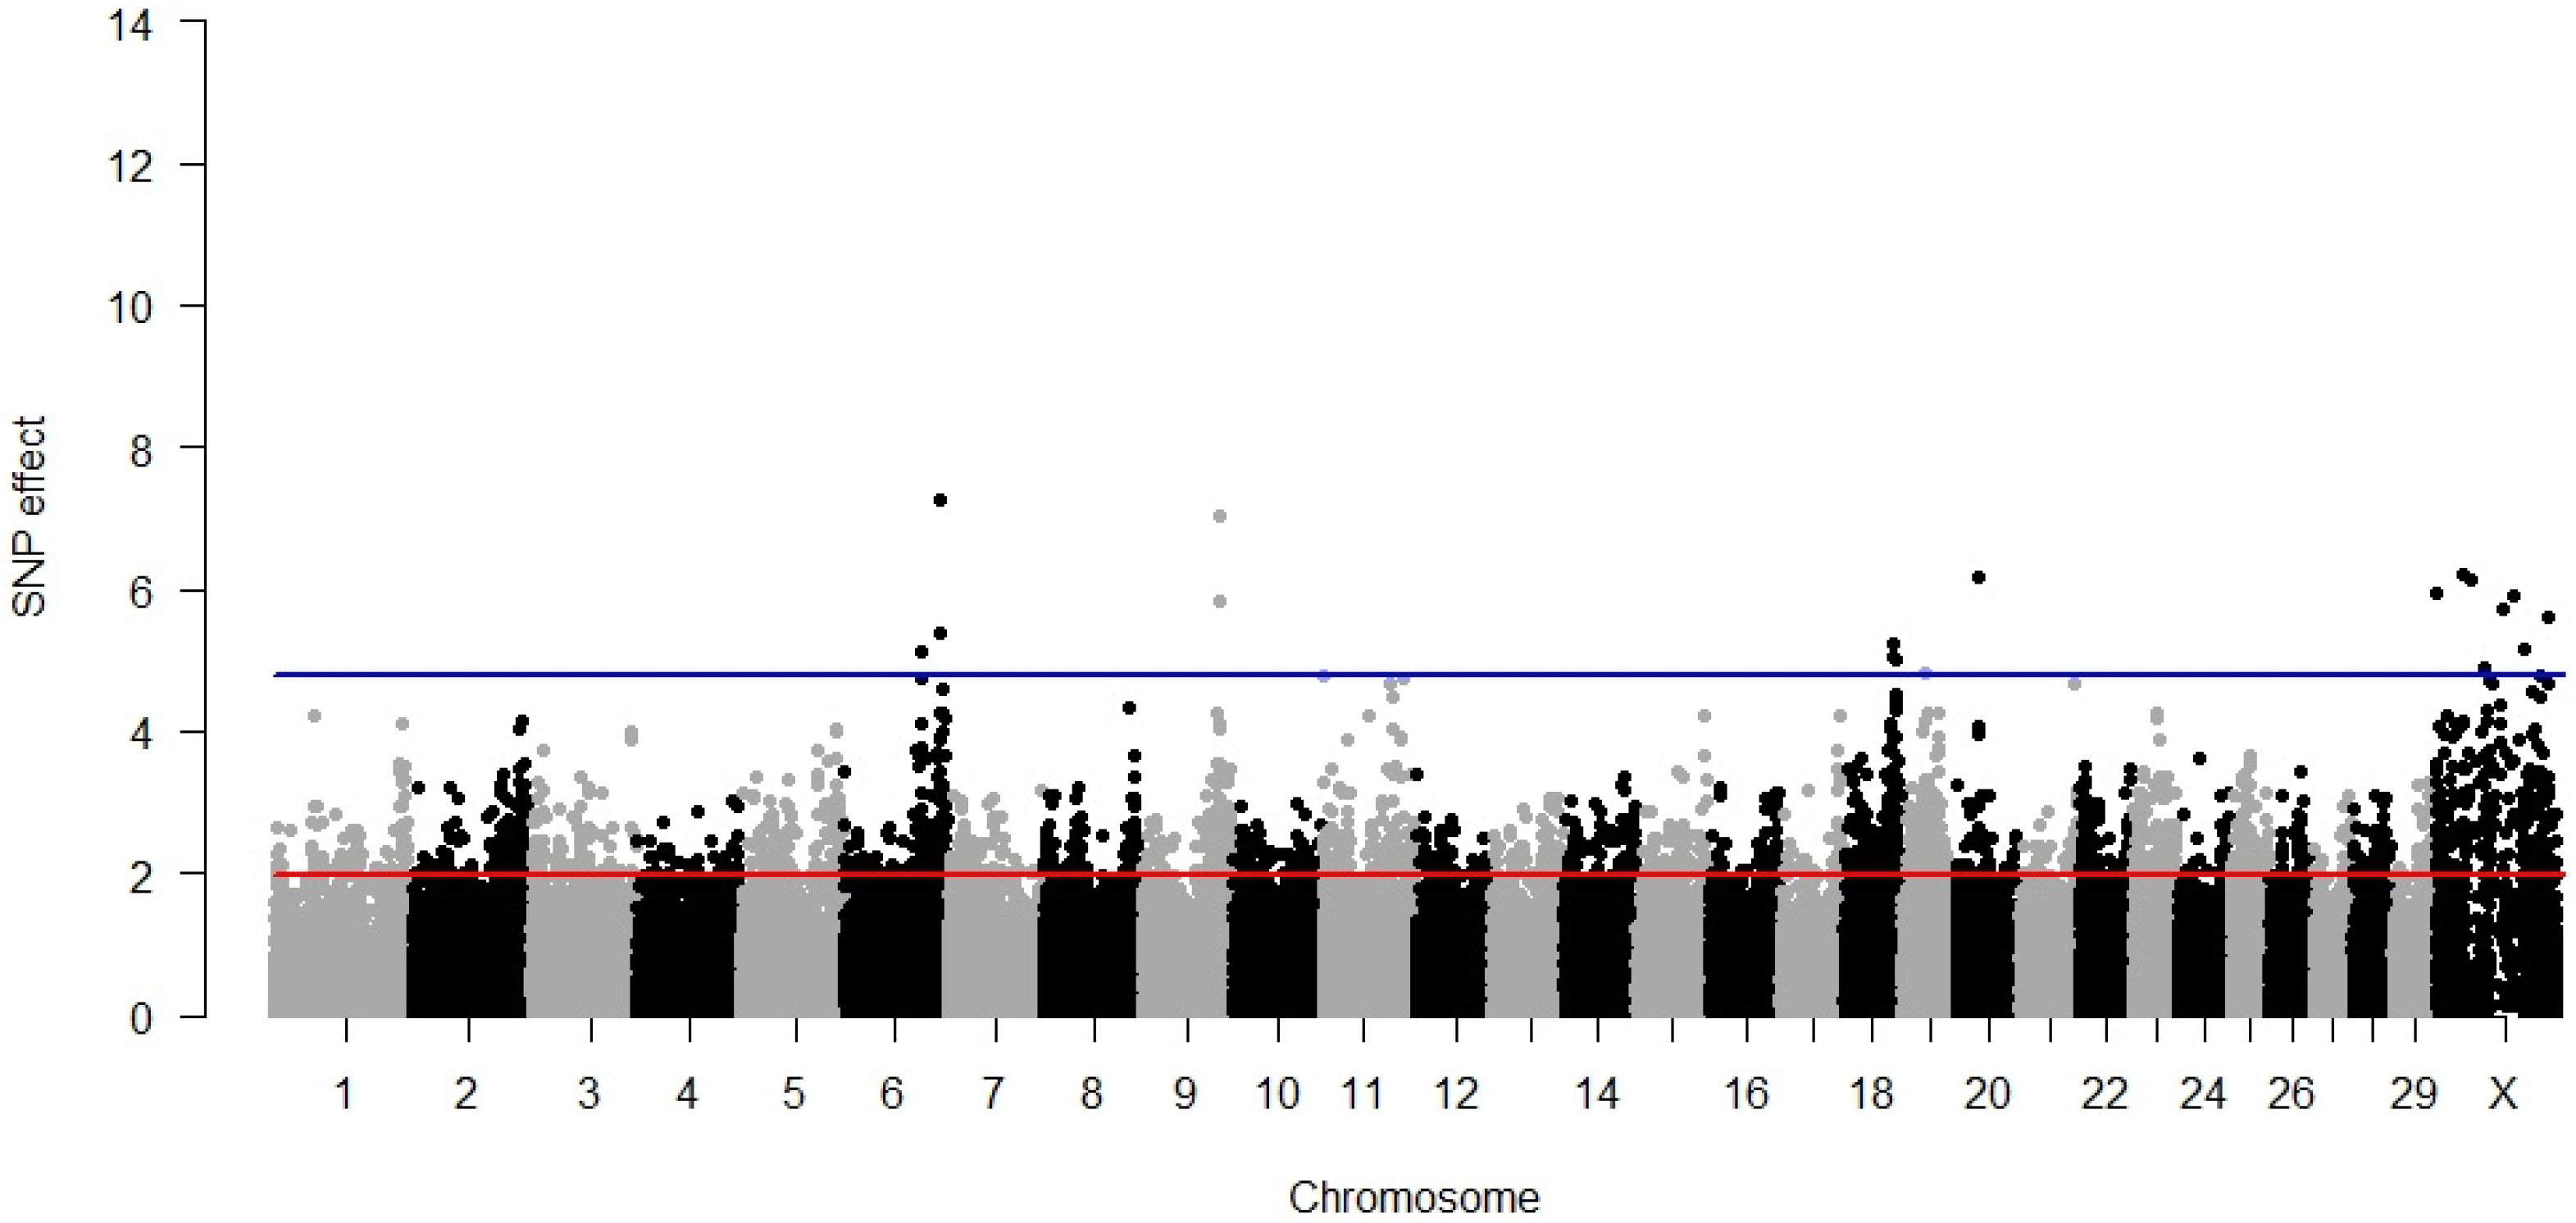
3.2. Maternal Calving Ease
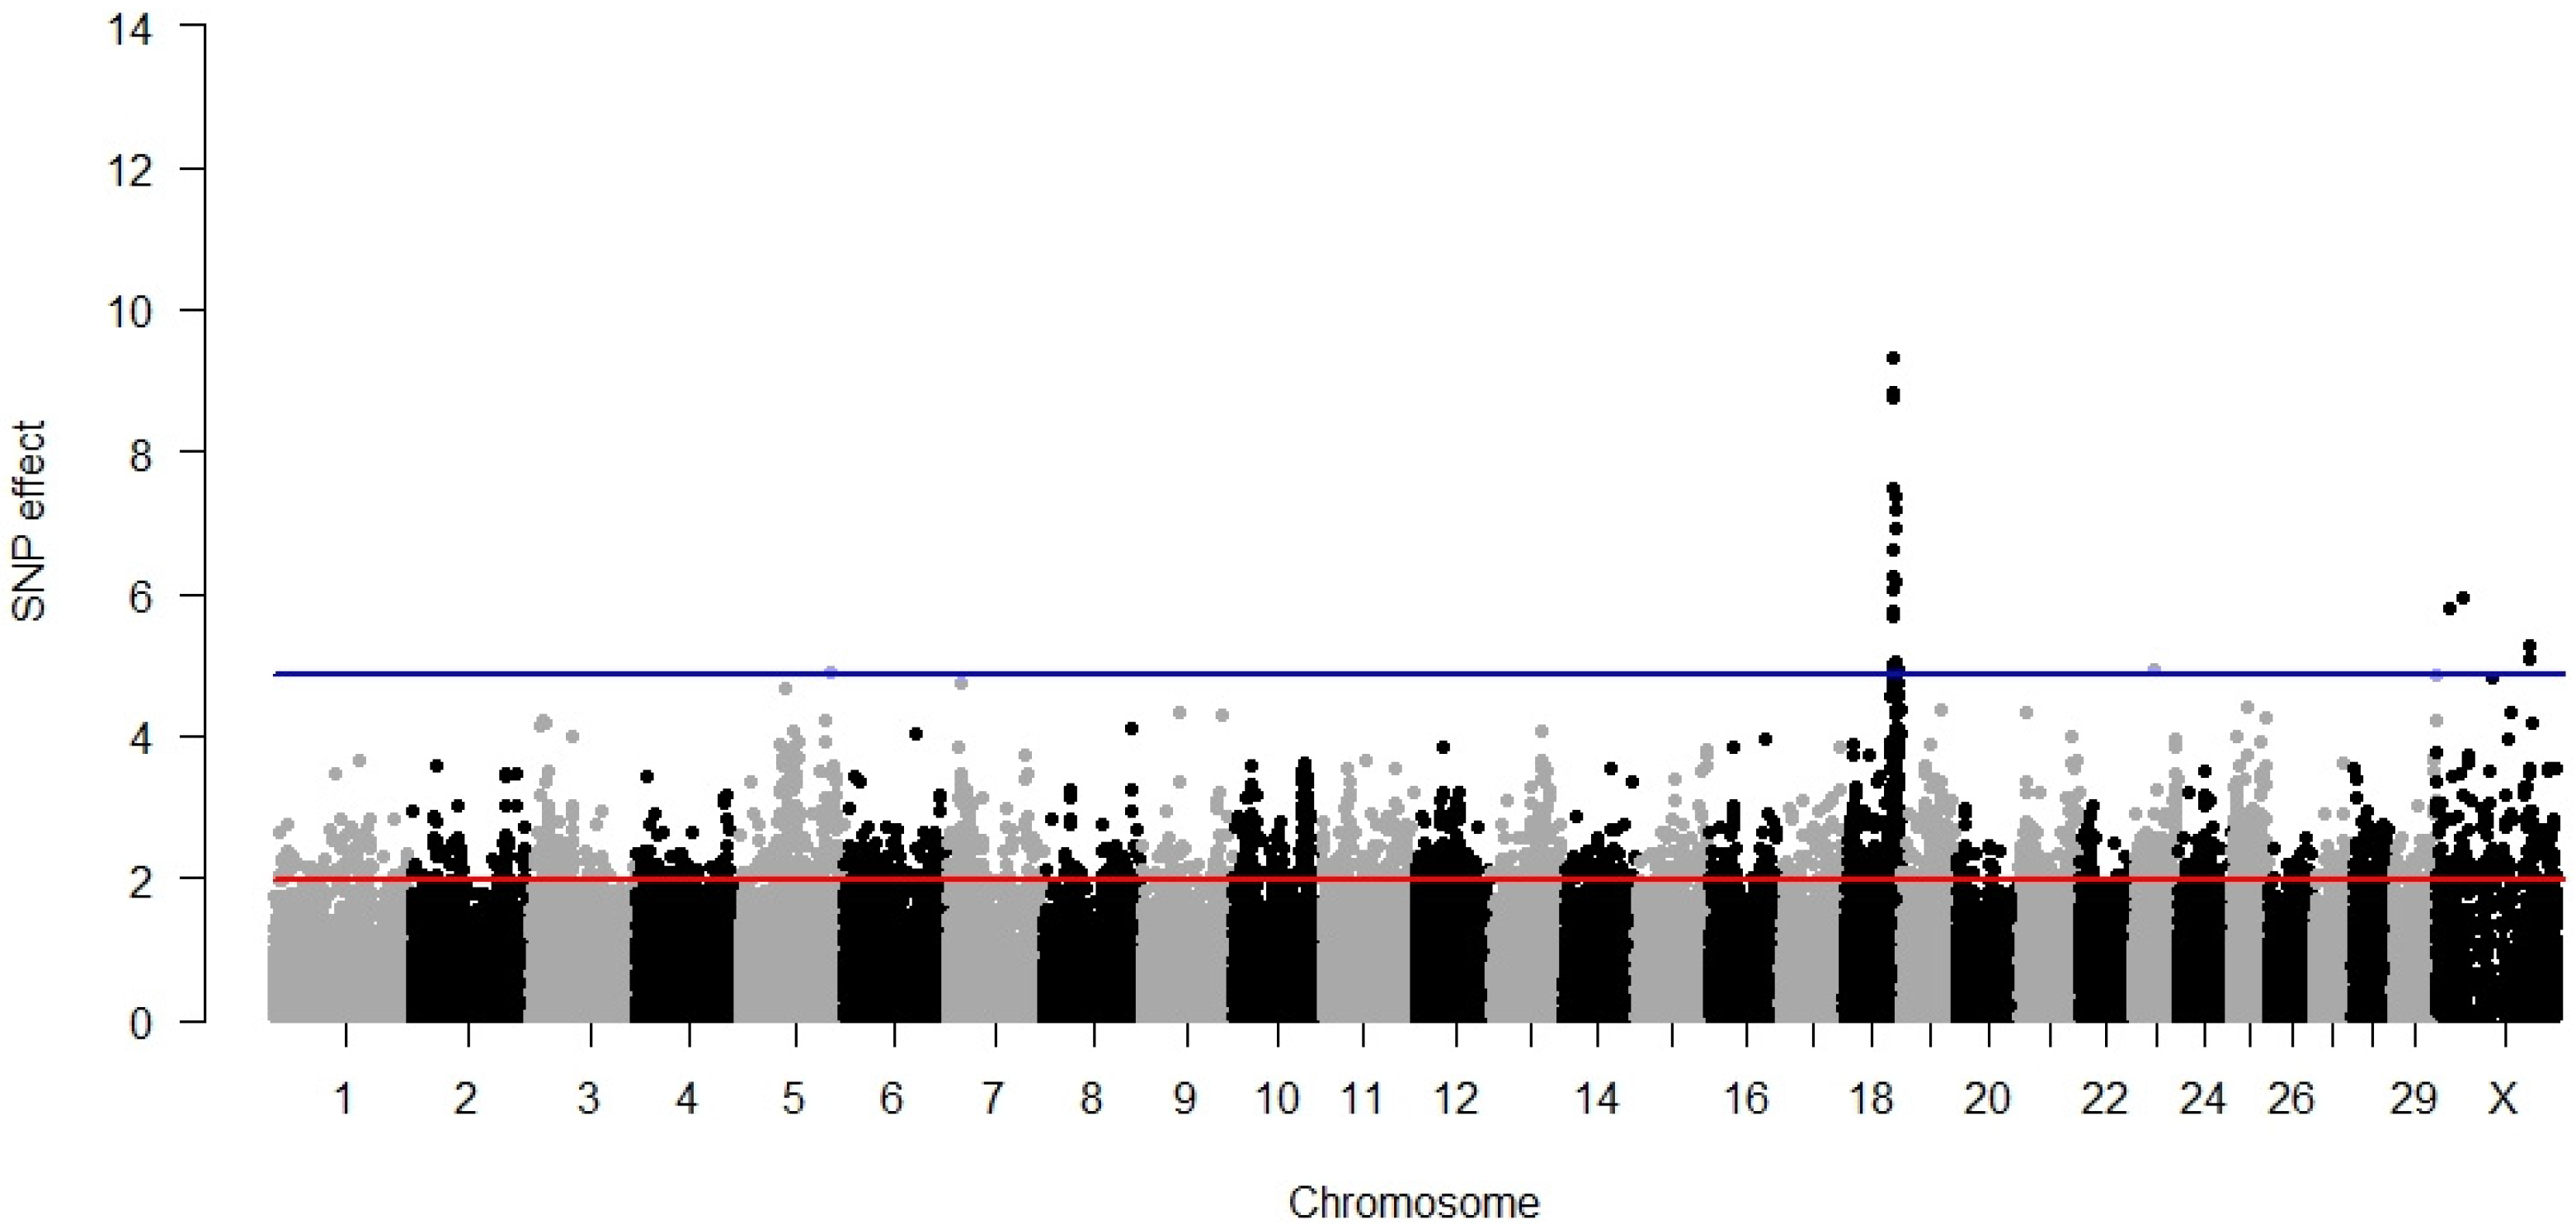
3.3. Direct Stillbirth
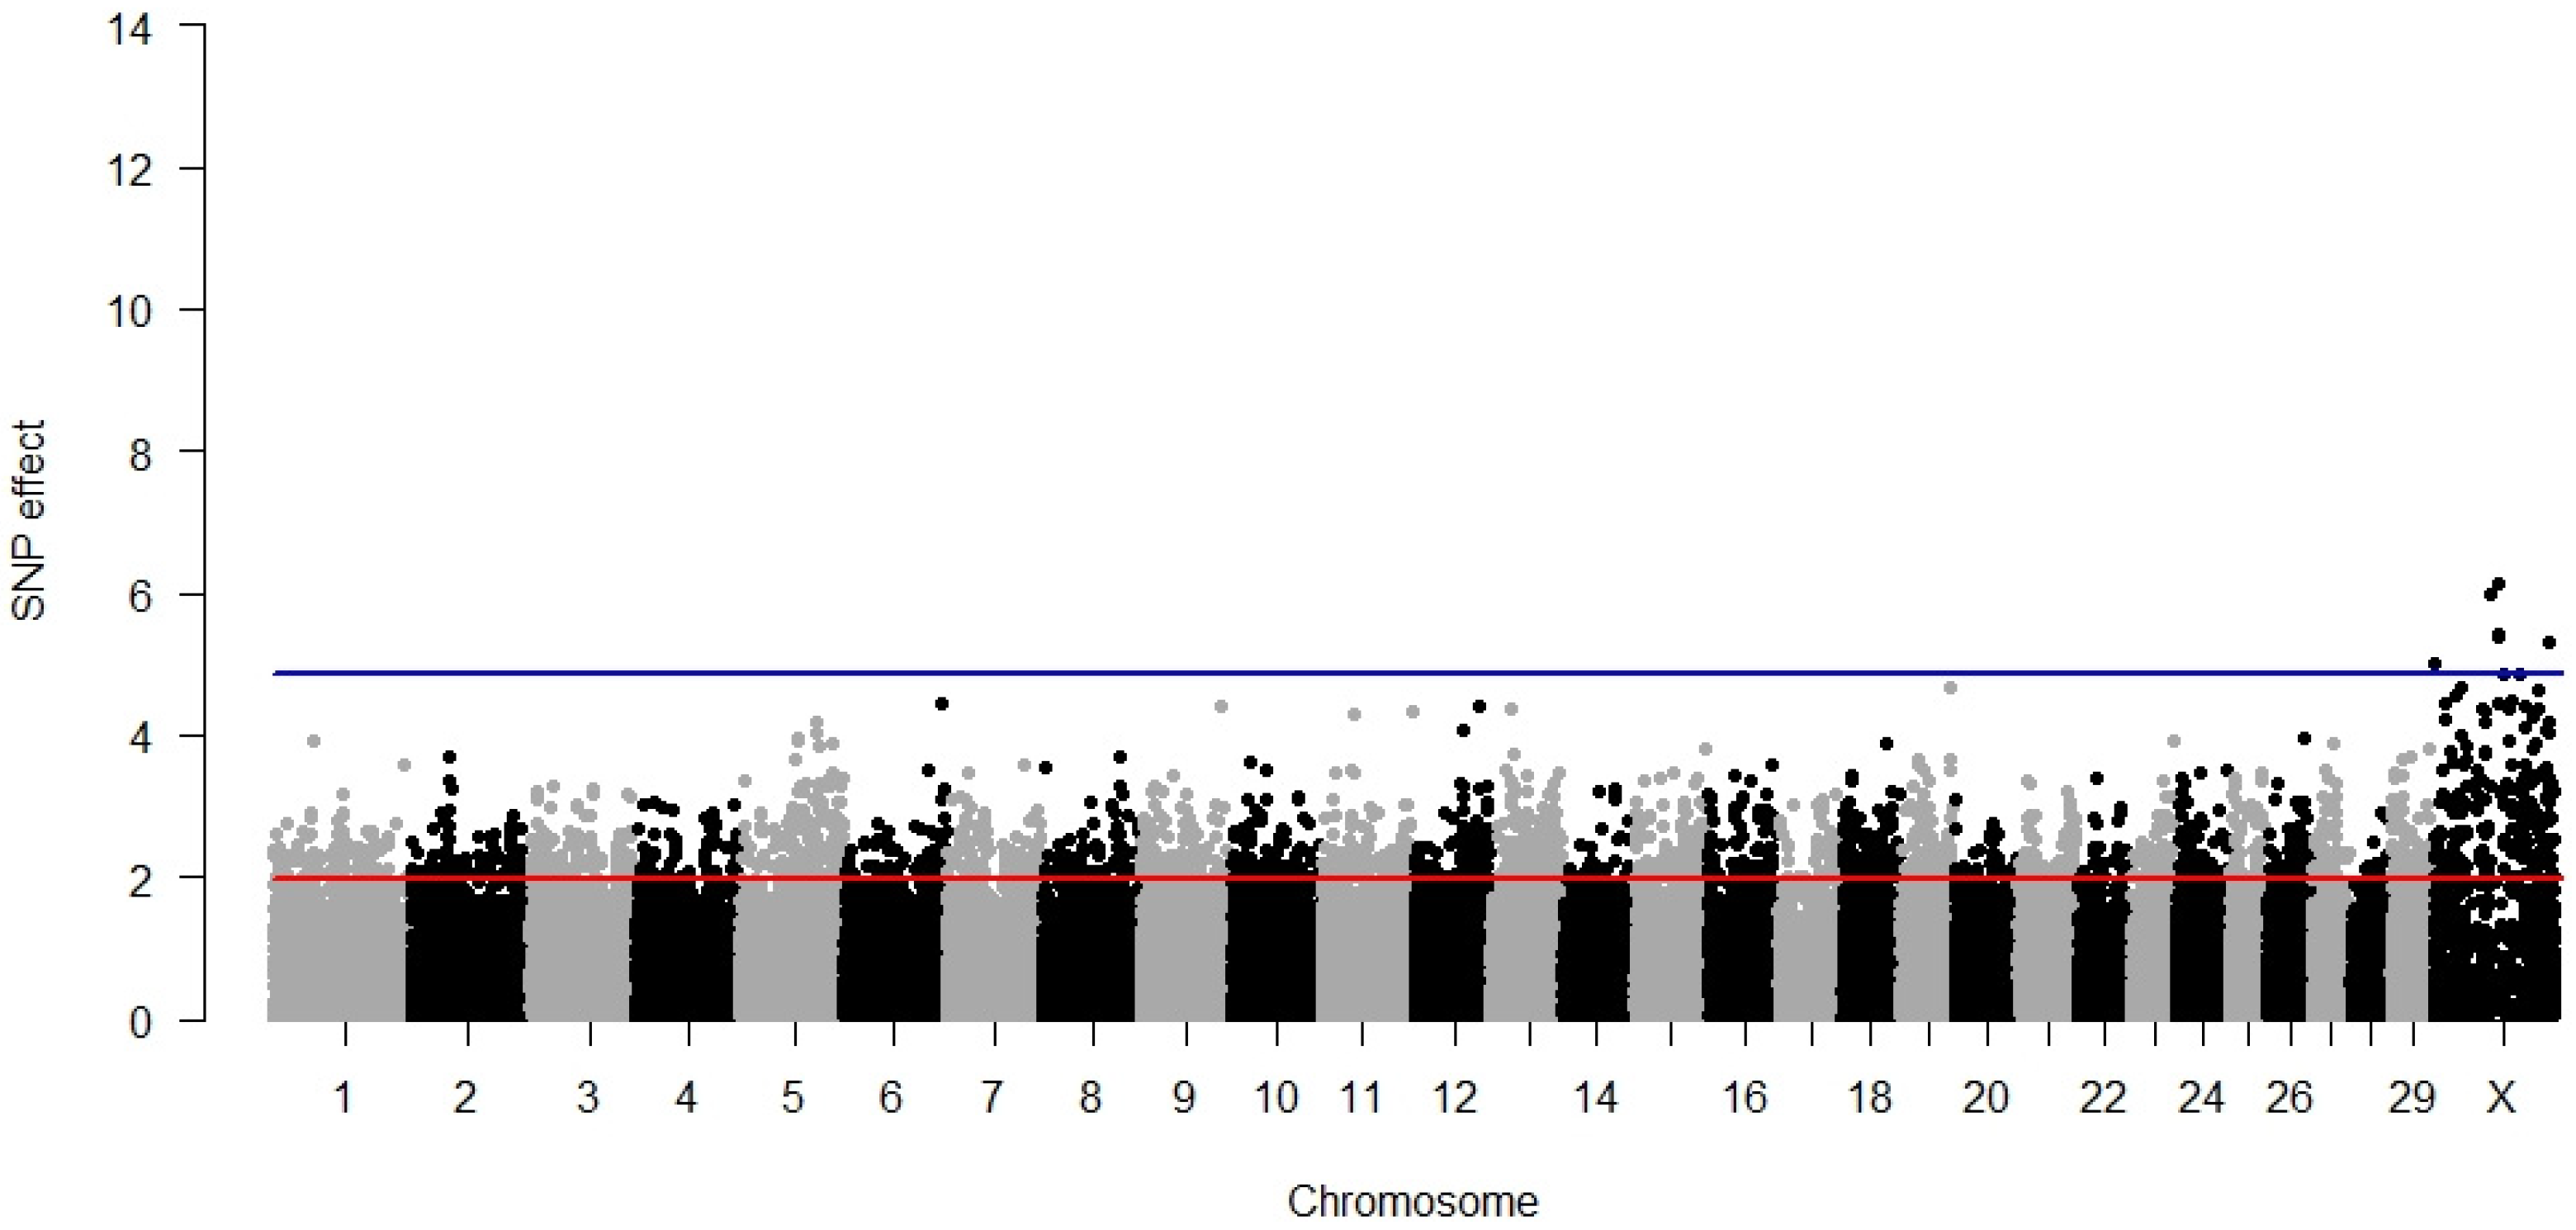
3.4. Maternal Stillbirth
3.5. Temperament
3.6. Milking Speed
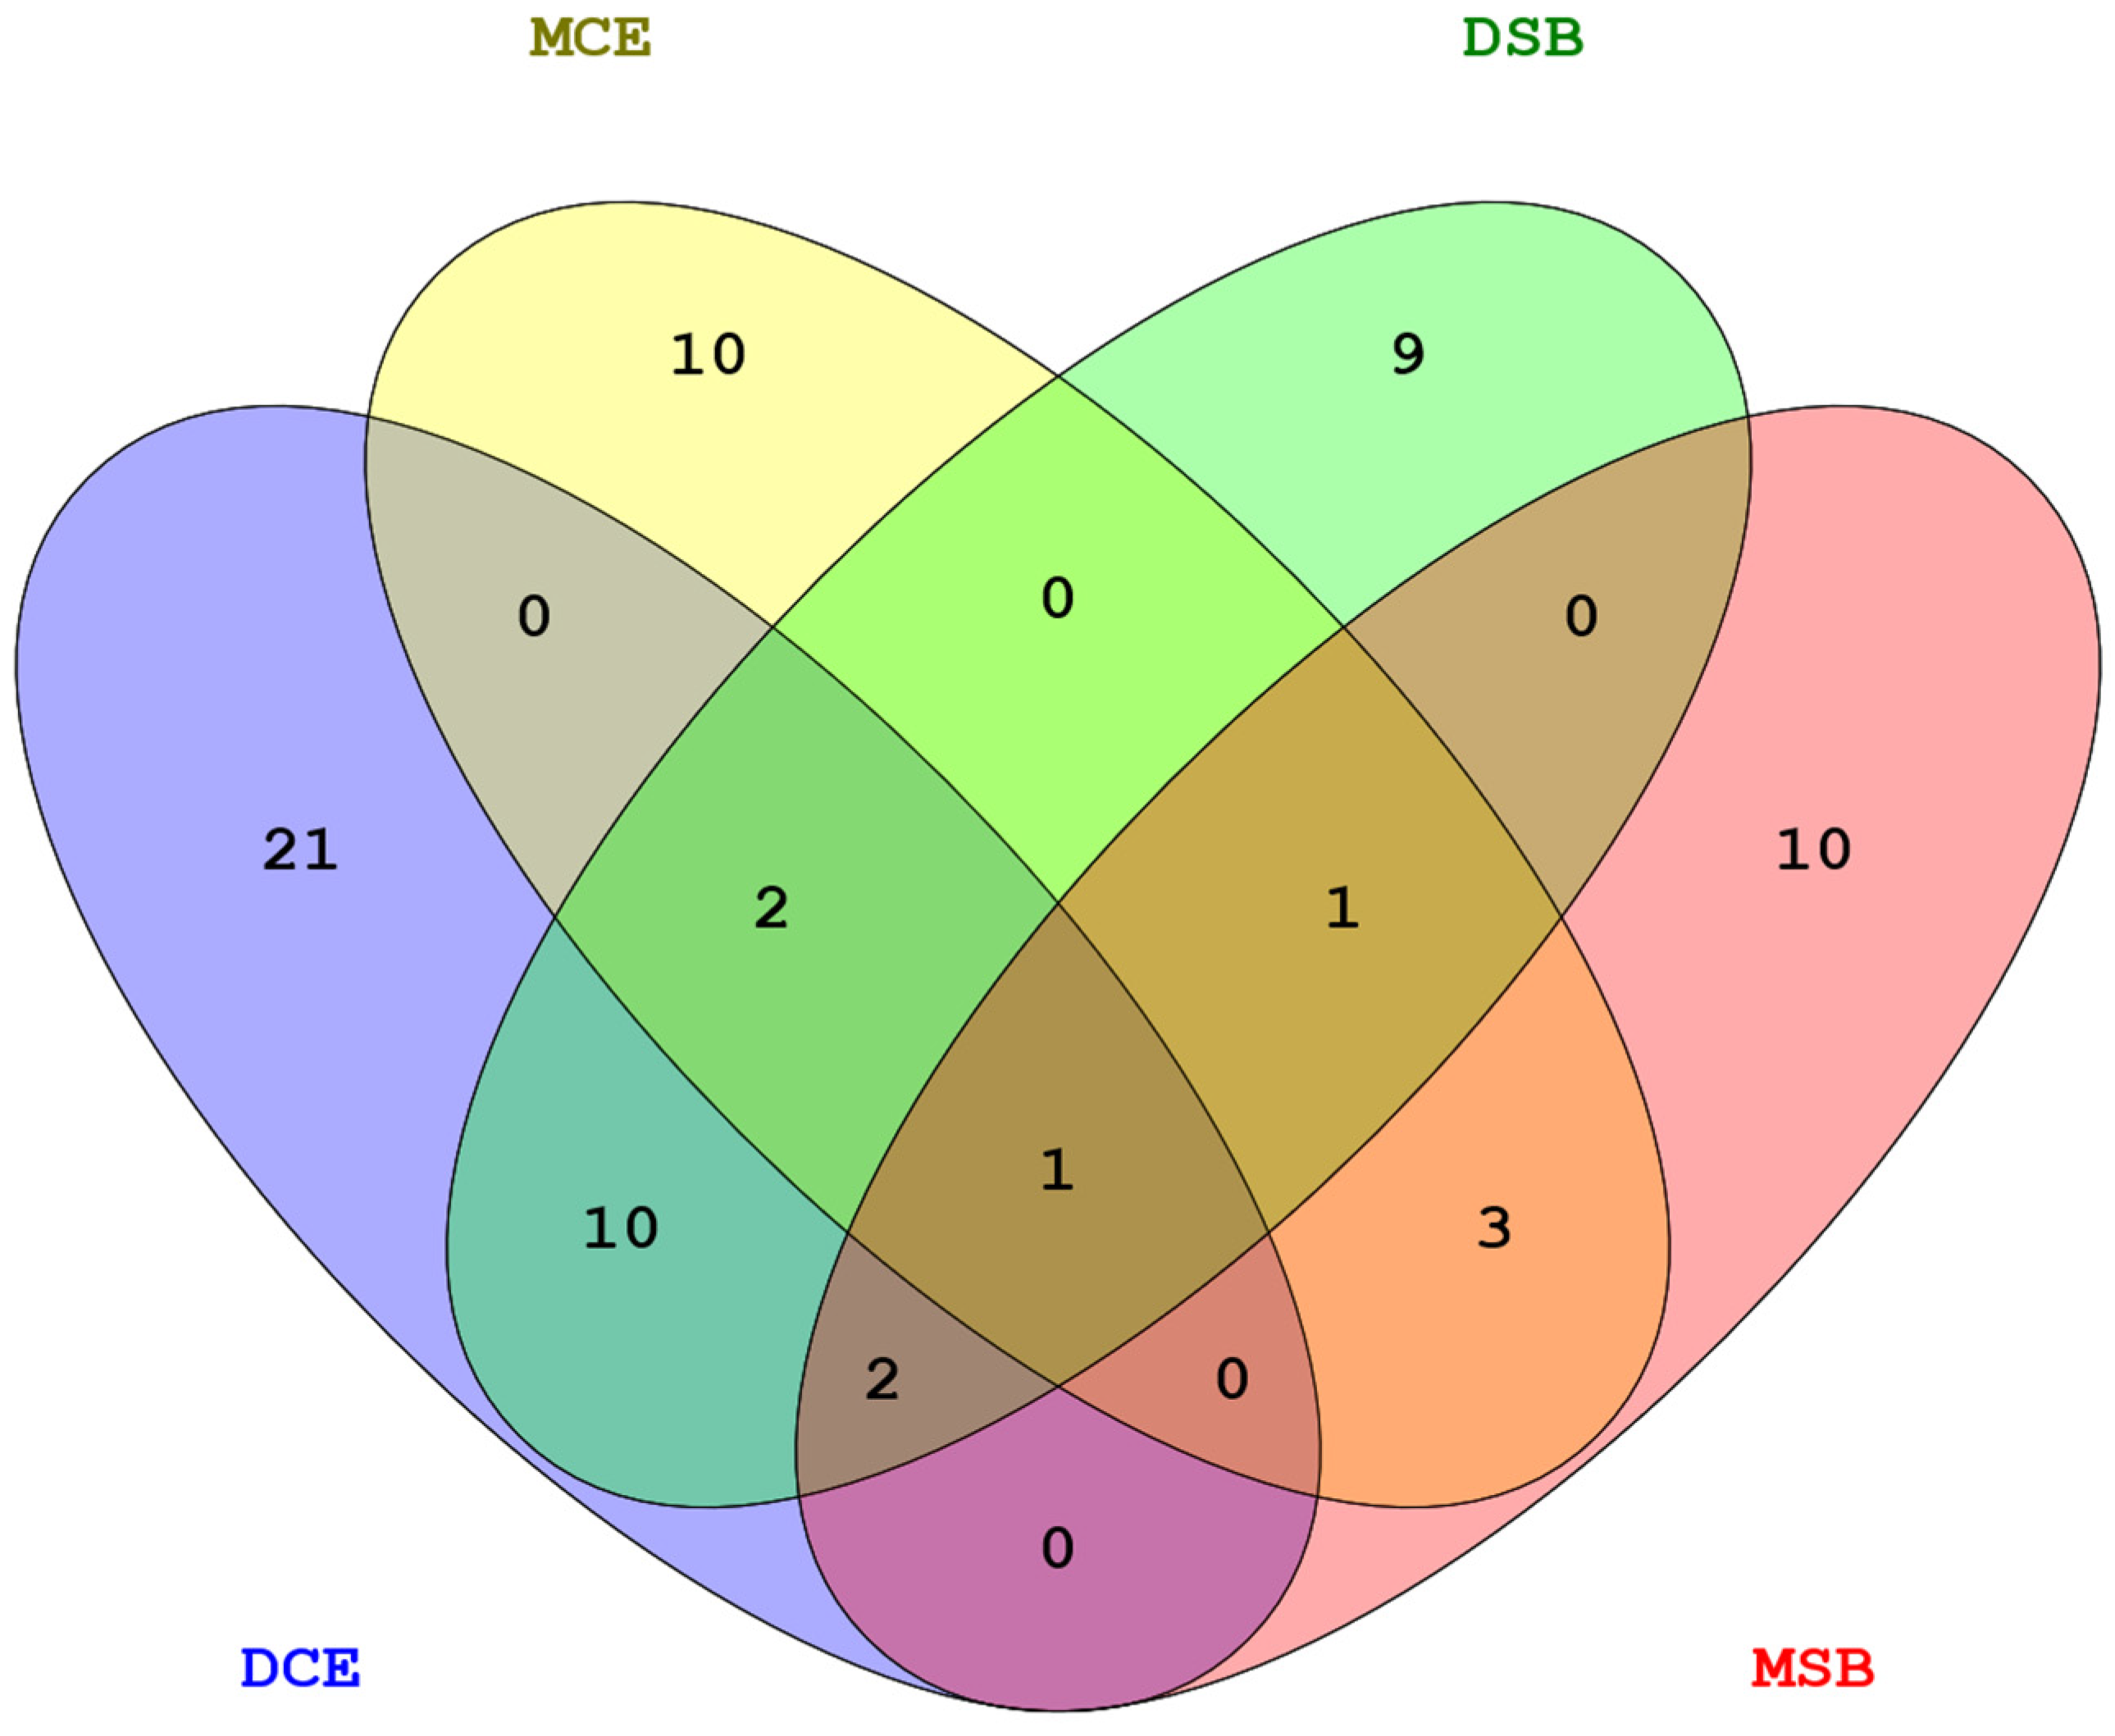
3.7. Pleiotropy
4. Discussion
5. Conclusions
Supplementary Materials
Author Contributions
Funding
Institutional Review Board Statement
Informed Consent Statement
Data Availability Statement
Acknowledgments
Conflicts of Interest
References
- Hickey, J.M.; Keane, M.G.; Kenny, D.A.; Cromie, A.R.; Amer, P.R.; Veerkamp, R.F. Heterogeneity of Genetic Parameters for Calving Difficulty in Holstein Heifers in Ireland. J. Dairy Sci. 2007, 90, 3900–3908. [Google Scholar] [CrossRef] [PubMed] [Green Version]
- Atashi, H.; Abdolmohammadi, A.R.; Asaadi, A.; Akhlaghi, A.; Dadpasand, M.; Jafari Ahangari, Y. Using an Incomplete Gamma Function to Quantify the Effect of Dystocia on the Lactation Performance of Holstein Dairy Cows in Iran. J. Dairy Sci. 2012, 95, 2718–2722. [Google Scholar] [CrossRef] [Green Version]
- Sewalem, A.; Miglior, F.; Kistemaker, G.J. Analysis of the Relationship between Workability Traits and Functional Longevity in Canadian Dairy Breeds. J. Dairy Sci. 2010, 93, 4359–4365. [Google Scholar] [CrossRef] [PubMed] [Green Version]
- Philipson, J.; Banos, G.; Arnason, T. Present and Future Uses of Selection Index Methodology in Dairy Cattle. J. Dairy Sci. 1994, 77, 3252–3261. [Google Scholar] [CrossRef] [Green Version]
- Oliveira Junior, G.A.; Schenkel, F.S.; Alcantara, L.; Houlahan, K.; Lynch, C.; Baes, C.F. Estimated Genetic Parameters for All Genetically Evaluated Traits in Canadian Holsteins. J. Dairy Sci. 2021, 104, 9002–9015. [Google Scholar] [CrossRef] [PubMed]
- Abo-Ismail, M.K.; Brito, L.F.; Miller, S.P.; Sargolzaei, M.; Grossi, D.A.; Moore, S.S.; Plastow, G.; Stothard, P.; Nayeri, S.; Schenkel, F.S. Genome-Wide Association Studies and Genomic Prediction of Breeding Values for Calving Performance and Body Conformation Traits in Holstein Cattle. Genet. Sel. Evol. 2017, 49, 82. [Google Scholar] [CrossRef] [PubMed] [Green Version]
- Guarini, A.R.; Lourenco, D.A.L.; Brito, L.F.; Sargolzaei, M.; Baes, C.F.; Miglior, F.; Misztal, I.; Schenkel, F.S. Comparison of Genomic Predictions for Lowly Heritable Traits Using Multi-Step and Single-Step Genomic Best Linear Unbiased Predictor in Holstein Cattle. J. Dairy Sci. 2018, 101, 8076–8086. [Google Scholar] [CrossRef] [PubMed]
- Eaglen, S.A.E.; Coffey, M.P.; Woolliams, J.A.; Wall, E. Evaluating Alternate Models to Estimate Genetic Parameters of Calving Traits in United Kingdom Holstein-Friesian Dairy Cattle. Genet. Sel. Evol. 2012, 44, 23. [Google Scholar] [CrossRef] [Green Version]
- Eaglen, S.A.E.; Coffey, M.P.; Woolliams, J.A.; Wall, E. Direct and Maternal Genetic Relationships between Calving Ease, Gestation Length, Milk Production, Fertility, Type, and Lifespan of Holstein-Friesian Primiparous Cows. J. Dairy Sci. 2013, 96, 4015–4025. [Google Scholar] [CrossRef] [PubMed] [Green Version]
- Carnier, P.; Albera, A.; Dal Zotto, R.; Groen, A.F.; Bona, M.; Bittante, G. Genetic Parameters for Direct and Maternal Calving Ability over Parities in Piedmontese Cattle. J. Anim. Sci. 2000, 78, 2532. [Google Scholar] [CrossRef]
- Ma, L.; Cole, J.B.; Da, Y.; VanRaden, P.M. Symposium Review: Genetics, Genome-Wide Association Study, and Genetic Improvement of Dairy Fertility Traits. J. Dairy Sci. 2019, 102, 3735–3743. [Google Scholar] [CrossRef] [Green Version]
- Szymik, B.; Topolski, P.; Jagusiak, W. Genetic Parameters of Workability Traits in the Population of Polish Holstein-Friesian Cows Based on Conventional and Genomic Data. Animals 2021, 11, 2443. [Google Scholar] [CrossRef] [PubMed]
- Sewalem, A.; Miglior, F.; Kistemaker, G.J. Short Communication: Genetic Parameters of Milking Temperament and Milking Speed in Canadian Holsteins. J. Dairy Sci. 2011, 94, 512–516. [Google Scholar] [CrossRef] [Green Version]
- Jardim, J.G.; Guldbrandtsen, B.; Lund, M.S.; Sahana, G. Association Analysis for Udder Index and Milking Speed with Imputed Whole-Genome Sequence Variants in Nordic Holstein Cattle. J. Dairy Sci. 2018, 101, 2199–2212. [Google Scholar] [CrossRef] [Green Version]
- Marete, A.; Sahana, G.; Fritz, S.; Lefebvre, R.; Barbat, A.; Lund, M.S.; Guldbrandtsen, B.; Boichard, D. Genome-Wide Association Study for Milking Speed in French Holstein Cows. J. Dairy Sci. 2018, 101, 6205–6219. [Google Scholar] [CrossRef] [Green Version]
- Chen, S.-Y.; Oliveira, H.R.; Schenkel, F.S.; Pedrosa, V.B.; Melka, M.G.; Brito, L.F. Using Imputed Whole-Genome Sequence Variants to Uncover Candidate Mutations and Genes Affecting Milking Speed and Temperament in Holstein Cattle. J. Dairy Sci. 2020, 103, 10383–10398. [Google Scholar] [CrossRef]
- Browning, B.L.; Browning, S.R. Genotype Imputation with Millions of Reference Samples. Am. J. Hum. Genet. 2016, 98, 116–126. [Google Scholar] [CrossRef] [Green Version]
- Henderson, C.R. Applications of Linear Models in Animal Breeding; University of Guelph: Guelph, ON, Canada, 1984; ISBN 9780889550308. [Google Scholar]
- Dunnett, C.W. A Multiple Comparison Procedure for Comparing Several Treatments with a Control. J. Am. Stat. Assoc. 1955, 50, 1096–1121. [Google Scholar] [CrossRef]
- Durinck, S.; Spellman, P.T.; Birney, E.; Huber, W. Mapping Identifiers for the Integration of Genomic Datasets with the R/Bioconductor Package BiomaRt. Nat. Protoc. 2009, 4, 1184–1191. [Google Scholar] [CrossRef] [Green Version]
- McLaren, W.; Gil, L.; Hunt, S.E.; Riat, H.S.; Ritchie, G.R.S.; Thormann, A.; Flicek, P.; Cunningham, F. The Ensembl Variant Effect Predictor. Genome Biol. 2016, 17, 122. [Google Scholar] [CrossRef] [Green Version]
- Huang, D.W.; Sherman, B.T.; Lempicki, R.A. Bioinformatics Enrichment Tools: Paths toward the Comprehensive Functional Analysis of Large Gene Lists. Nucleic Acids Res. 2009, 37, 1–13. [Google Scholar] [CrossRef] [PubMed] [Green Version]
- Xiang, R.; MacLeod, I.M.; Daetwyler, H.D.; de Jong, G.; O’Connor, E.; Schrooten, C.; Chamberlain, A.J.; Goddard, M.E. Genome-Wide Fine-Mapping Identifies Pleiotropic and Functional Variants That Predict Many Traits across Global Cattle Populations. Nat. Commun. 2021, 12, 860. [Google Scholar] [CrossRef]
- Khatri, P.; Sirota, M.; Butte, A.J. Ten Years of Pathway Analysis: Current Approaches and Outstanding Challenges. PLoS Comput. Biol. 2012, 8, e1002375. [Google Scholar] [CrossRef] [PubMed]
- Lee, S.; Choi, S.; Kim, Y.J.; Kim, B.-J.; T2d-Genes Consortium; Hwang, H.; Park, T. Pathway-Based Approach Using Hierarchical Components of Collapsed Rare Variants. Bioinformatics 2016, 32, i586–i594. [Google Scholar] [CrossRef] [PubMed] [Green Version]
- Müller, M.-P.; Rothammer, S.; Seichter, D.; Russ, I.; Hinrichs, D.; Tetens, J.; Thaller, G.; Medugorac, I. Genome-Wide Mapping of 10 Calving and Fertility Traits in Holstein Dairy Cattle with Special Regard to Chromosome 18. J. Dairy Sci. 2017, 100, 1987–2006. [Google Scholar] [CrossRef] [PubMed]
- Höglund, J.K.; Guldbrandtsen, B.; Lund, M.S.; Sahana, G. Analyzes of Genome-Wide Association Follow-up Study for Calving Traits in Dairy Cattle. BMC Genet. 2012, 13, 71. [Google Scholar] [CrossRef] [Green Version]
- Sahana, G.; Guldbrandtsen, B.; Lund, M.S. Genome-Wide Association Study for Calving Traits in Danish and Swedish Holstein Cattle. J. Dairy Sci. 2011, 94, 479–486. [Google Scholar] [CrossRef] [PubMed] [Green Version]
- Cole, J.B.; Wiggans, G.R.; Ma, L.; Sonstegard, T.S.; Lawlor, T.J.; Crooker, B.A.; Van Tassell, C.P.; Yang, J.; Wang, S.; Matukumalli, L.K.; et al. Genome-Wide Association Analysis of Thirty One Production, Health, Reproduction and Body Conformation Traits in Contemporary U.S. Holstein Cows. BMC Genom. 2011, 12, 408. [Google Scholar] [CrossRef] [PubMed] [Green Version]
- Heringstad, B.; Chang, Y.M.; Svendsen, M.; Gianola, D. Genetic Analysis of Calving Difficulty and Stillbirth in Norwegian Red Cows. J. Dairy Sci. 2007, 90, 3500–3507. [Google Scholar] [CrossRef] [PubMed] [Green Version]


| Trait | Number of Bulls | Heritability |
|---|---|---|
| DCE | 30,603 | 0.05 |
| MCE | 29,738 | 0.04 |
| DSB | 24,521 | 0.03 |
| MSB | 28,081 | 0.05 |
| TEM | 22,301 | 0.09 |
| MSP | 28,376 | 0.12 |
| Trait | GO Term | Effect | p-Value |
|---|---|---|---|
| DCE | GO: 0001502 | 4.8154 | 2.30 × 10⁻³ |
| GO: 0098743 | 4.8154 | 2.30 × 10⁻³ | |
| GO: 0060840 | 8.6306 | 3.05 × 10⁻¹⁸ | |
| GO: 0000146 | 8.6306 | 3.05 × 10⁻¹⁸ | |
| GO: 0051647 | 8.6306 | 3.05 × 10⁻¹⁸ | |
| GO: 0055003 | 8.6306 | 3.05 × 10⁻¹⁸ | |
| GO: 0030239 | 8.6306 | 3.05 × 10⁻¹⁸ | |
| GO: 0016459 | 8.6306 | 3.05 × 10⁻¹⁸ | |
| GO: 0030048 | 8.6306 | 3.05 × 10⁻¹⁸ | |
| GO: 0031594 | 8.6306 | 3.05 × 10⁻¹⁸ | |
| MCE | GO: 1903319 | 4.1611 | 4.92 × 10⁻² |
| GO: 0099572 | 4.5622 | 7.90 × 10⁻³ | |
| GO: 0050804 | 4.5622 | 7.90 × 10⁻³ | |
| GO: 0060076 | 4.5622 | 7.90 × 10⁻³ | |
| GO: 0014069 | 4.5622 | 7.90 × 10⁻³ | |
| DSB | GO: 0060840 | 4.6114 | 6.20 × 10⁻³ |
| GO: 0000146 | 4.6114 | 6.20 × 10⁻³ | |
| GO: 0051647 | 4.6114 | 6.20 × 10⁻³ | |
| GO: 0055003 | 4.6114 | 6.20 × 10⁻³ | |
| GO: 0030239 | 4.6114 | 6.20 × 10⁻³ | |
| GO: 0016459 | 4.6114 | 6.20 × 10⁻³ | |
| GO: 0030048 | 4.6114 | 6.20 × 10⁻³ | |
| GO: 0031594 | 4.6114 | 6.20 × 10⁻³ | |
| MSB | GO: 0005545 | 4.9310 | 1.30 × 10⁻³ |
| GO: 0019933 | 5.2822 | 2.00 × 10⁻⁴ | |
| GO: 0019935 | 5.2822 | 2.00 × 10⁻⁴ | |
| TEM | GO: 0046717 | 5.5607 | 1.34 × 10⁻⁸ |
| GO: 0015812 | 5.5607 | 1.34 × 10⁻⁸ | |
| GO: 0031901 | 5.5987 | 1.34 × 10⁻⁸ | |
| GO: 1902656 | 8.5417 | 6.61 × 10⁻¹⁸ | |
| GO: 0097553 | 8.5417 | 6.61 × 10⁻¹⁸ | |
| GO: 0044381 | 4.4921 | 1.10 × 10⁻² | |
| GO: 2001275 | 4.4921 | 1.10 × 10⁻² | |
| GO: 2001273 | 4.4921 | 1.10 × 10⁻² | |
| MSP | GO: 0022834 | 6.8714 | 3.17 × 10⁻¹² |
| GO: 0015276 | 6.8714 | 3.17 × 10⁻¹² | |
| GO: 0016788 | 4.4982 | 1.07 × 10⁻² | |
| GO: 0008081 | 4.4982 | 1.07 × 10⁻² | |
| GO: 0005509 | 4.4982 | 1.07 × 10⁻² | |
| GO: 0035329 | 4.3080 | 2.56 × 10⁻² | |
| GO: 0005545 | 4.6258 | 5.80 × 10⁻³ | |
| GO: 0005245 | 4.5538 | 8.20 × 10⁻³ | |
| GO: 0046514 | 5.0346 | 7.00 × 10⁻⁴ | |
| GO: 0046479 | 5.0346 | 7.00 × 10⁻⁴ | |
| GO: 0030149 | 5.0346 | 7.00 × 10⁻⁴ |
| Trait | KEGG | Number of Significant SNPs | Number of Associated Genes | Effect | p-Value |
|---|---|---|---|---|---|
| MSB | bta: 05235 | 62 | 29 | 3.6479 | 3.20 × 10⁻² |
| bta: 04658 | 62 | 29 | 3.6479 | 3.20 × 10⁻² | |
| TEM | bta: 00630 | 34 | 15 | 3.7176 | 2.43 × 10⁻² |
| bta: 00860 | 21 | 13 | 3.7114 | 2.49 × 10⁻² | |
| MSP | bta: 00280 | 25 | 11 | 4.0403 | 6.50 × 10⁻³ |
Publisher’s Note: MDPI stays neutral with regard to jurisdictional claims in published maps and institutional affiliations. |
© 2022 by the authors. Licensee MDPI, Basel, Switzerland. This article is an open access article distributed under the terms and conditions of the Creative Commons Attribution (CC BY) license (https://creativecommons.org/licenses/by/4.0/).
Share and Cite
Jakimowicz, M.; Szyda, J.; Zarnecki, A.; Jagusiak, W.; Morek-Kopeć, M.; Kosińska-Selbi, B.; Suchocki, T. Genome-Wide Genomic and Functional Association Study for Workability and Calving Traits in Holstein Cattle. Animals 2022, 12, 1127. https://doi.org/10.3390/ani12091127
Jakimowicz M, Szyda J, Zarnecki A, Jagusiak W, Morek-Kopeć M, Kosińska-Selbi B, Suchocki T. Genome-Wide Genomic and Functional Association Study for Workability and Calving Traits in Holstein Cattle. Animals. 2022; 12(9):1127. https://doi.org/10.3390/ani12091127
Chicago/Turabian StyleJakimowicz, Michalina, Joanna Szyda, Andrzej Zarnecki, Wojciech Jagusiak, Małgorzata Morek-Kopeć, Barbara Kosińska-Selbi, and Tomasz Suchocki. 2022. "Genome-Wide Genomic and Functional Association Study for Workability and Calving Traits in Holstein Cattle" Animals 12, no. 9: 1127. https://doi.org/10.3390/ani12091127
APA StyleJakimowicz, M., Szyda, J., Zarnecki, A., Jagusiak, W., Morek-Kopeć, M., Kosińska-Selbi, B., & Suchocki, T. (2022). Genome-Wide Genomic and Functional Association Study for Workability and Calving Traits in Holstein Cattle. Animals, 12(9), 1127. https://doi.org/10.3390/ani12091127