Article

Detection the eDNA of Batrachuperus taibaiensis from the Zhouzhi Heihe River Using a Nested PCR Method and DNA Barcoding

1
Shaanxi Key Laboratory for Animal Conservation, Shaanxi Institute of Zoology, Xi’an 710032, China
2
College of Animal Science and Technology, Northwest A&F University, Xianyang 712100, China
*
Authors to whom correspondence should be addressed.
Animals 2022, 12(9), 1105; https://doi.org/10.3390/ani12091105
Submission received: 9 February 2022 / Revised: 21 April 2022 / Accepted: 22 April 2022 / Published: 25 April 2022
(This article belongs to the Section Animal Genetics and Genomics)

Abstract

:

Simple Summary

The Taibai stream salamander (Batrachuperus taibaiensis) is a protected species endemic to the Zhouzhi Heihe River. Few traditional studies have been conducted on the distribution of B. taibaiensis, leading to irregular discoveries. Environmental DNA (eDNA) is an ideal species detection technique that can increase accuracy and decrease the cost of population surveys. Here, we have established an optimal method for obtaining the eDNA of B. taibaiensis from water samples, which provides a theoretical basis and reference for resource investigation and protection of B. taibaiensis. Moreover, this study highlights the detection of a rare species in a river for use in further research.

Abstract

The Taibai stream salamander (Batrachuperus taibaiensis) is a recently described species of the genus Batrachuperus that occurs in the Zhouzhi Heihe River and is endangered in its native range. Here, we have established a method for water environmental DNA (eDNA) analysis of Batrachuperus using a series of optimizations. We have designed a specific set of primers for the genus Batrachuperus to amplify a 160 bp fragment of Cytb. The sequences were obtained from nested PCR on eDNA extracted from water samples, after which DNA barcoding was performed according to sequence analysis to determine the presence of the target species in the water. The method was validated using water from the Zhouzhi Heihe River with known B. taibaiensis populations and found that B. taibaiensis eDNA can move at least 150 m downstream from its point of origin. This study is the first to establish an optimal method for obtaining the eDNA of Batrachuperus from water samples, which provides a theoretical basis for resource investigation and the protection of B. taibaiensis in future research. It is also an example of the eDNA extraction of other species that live in similar waters and are less genetically diverse between species.

1. Introduction

Stream salamanders of the genus Batrachuperus (family Hynobiidae, Urodela, Amphibia) mainly live in clear water streams and prey on small shrimp and aquatic insects. The breeding season of Batrachuperus is March to April, and the eggs are laid in crevices where they live [1]. Stream salamanders, used in traditional Tibetan medicine in China, are used to treat traumatic injuries and joint pain. Due to their unique medicinal value, humans have begun to overexploit them, leading to a sharp decline in their population. Therefore, these species have been listed as endangered species [1]. To date, seven species of the genus Batrachuperus have been described in China: B. cochranae, B. karlschmidti, B. londongensis, B. pinchonii, B. taibaiensis, B. tibetanus, and B. yenyuanensis [1,2].
There are three types of Batrachuperus distributed in Shaanxi Qinling: B. pinchonii, B. tibetanus, and B. taibaiensis [1]. B. taibaiensis is a new species of the genus Batrachuperus that was found in the Zhouzhi Heihe River by Song Mingtao in 2001 [3]. The Heihe River rises from Er Ye Sea and Yu Huang Chi of Taibai Mountain in Zhouzhi Country and is characterized by rich plant and animal biodiversity [4]. The altitude of the Heihe River is 1200–3650 m, which is suitable for the survival of B. taibaiensis [5,6].
To date, research on the distribution of B. taibaiensis was conducted by Liang (2010) by combining morphology and molecular biotechnology to perform a statistical analysis based on the collected samples of B. taibaiensis [7]. However, these traditional methods depend on specific expertise and are difficult to standardize, which can create unknown rates of false absences in populations. Environmental DNA (eDNA) is an ideal species detection method that can increase the accuracy and decrease the cost of surveys. eDNA is any DNA that is freely present in the environment in the form of mucus, feces, skin cells, or gametes from an organism [8,9]. The study of aquatic species using eDNA has focused on vertebrate species, such as fish and amphibians [10,11,12,13], and has many applications, such as surveys in conservation biology [11,14,15], investigation of species invasion [12,13,16,17,18,19,20], researching species diversity and distribution [21,22], and estimating biomass measurements in a specific environment [23]. In the past decade, eDNA as a useful tool has seen remarkable interest in targeted species detection and biodiversity assessments [18].
The analysis of water eDNA involves a series of steps, including water eDNA capture, preservation, extraction, amplification, and sequencing to ensure a match with the target species. There are two types of water eDNA capture methods based on water quality and test conditions: direct freezing of water samples and freezing of filter membranes after filtration [17,21,24]. As for the preservation method, Ma (2021) compared common storage methods and found that a membrane directly soaked in alcohol is the best storage method that can increase eDNA yield. For eDNA extraction, Qiagen’s DNeasy Blood and Tissue Kit or the PowerWater DNA Isolation Kit were used as common commercial DNA kits [13,14,15,16,20]. In some cases, the phenol chloroform-isoamyl alcohol (PCI) extraction method was used to extract eDNA [22]. Conventional PCR and qPCR were conducted using a specific primer to identify the target species; the former sequences the target band and compares it with the sequence in the NCBI nucleotide repository to determine whether it is the sequence of the target species [10,11,19,25]; the latter uses the amplification curve to estimate the existence of the species or estimate how many species exist through copy number [12,26]. The nested PCR method is also a good choice when the concentration of aquatic species is low [27]. In the process of species identification, when the taxonomic differences between species are small, the classification of these species is conducted by DNA barcoding and phylogenetic analysis [20,28,29,30].
Here, we combined and optimized a series of eDNA steps to detect B. taibaiensis in the Heihe River and plan to use this method for long-term monitoring of the habitat of B. taibaiensis in the Heihe River.

2. Material and Methods

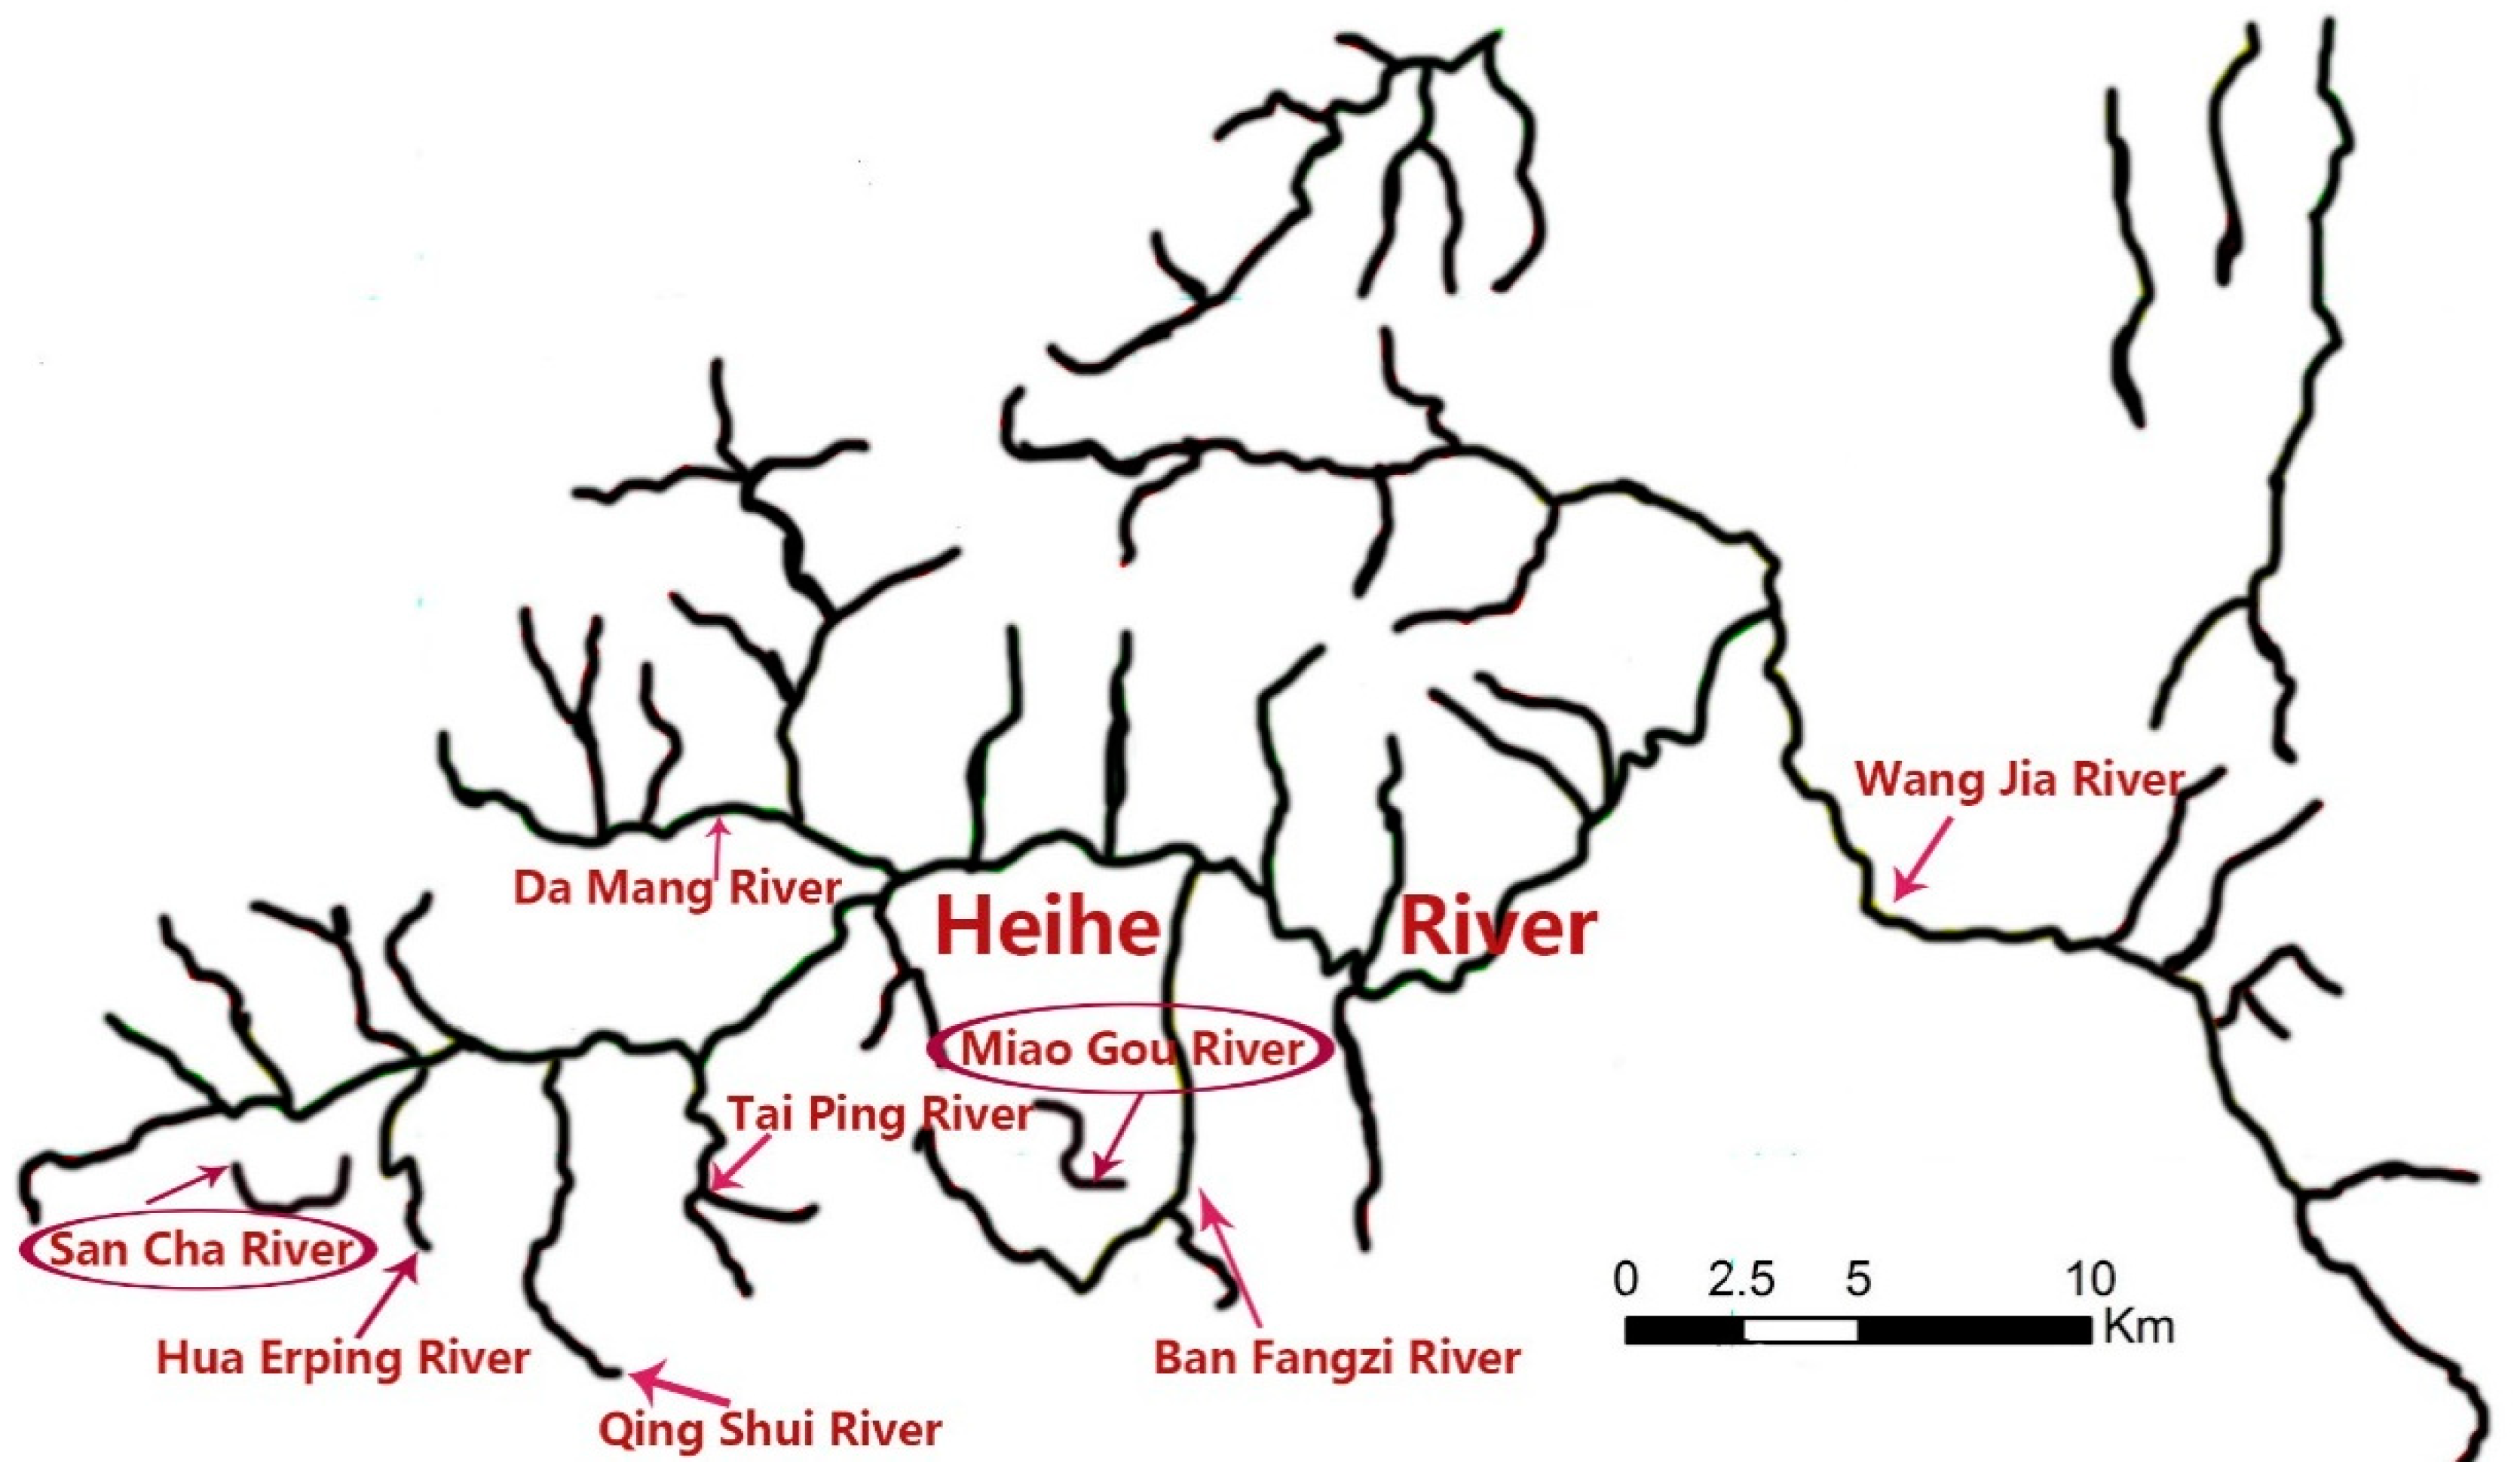
2.1. Field Sampling and Collection

The Heihe River (Zhouzhi County, Shaanxi Province) originates from the Taibai Mountain National Nature Reserve. It is 125 km long, has a drainage area of 2258 km2 [31], and has good water quality and rich fishery resources (e.g., Brachymystax lenok tsinlingensis, Andrias davidianus, Batrachuperus, etc.) [4,32]. There are many tributaries along the Heihe River, such as the Ban Fangzi, Hua Erping, San Cha, and Miao Gou Rivers. Water samples were collected from two locations (San Cha River and Miao Gou River) (Figure 1). Sites were sampled at two time points: 4 April 2021 and 1 August 2021. In April, the water samples were collected from six sites within the San Cha and Miao Gou Rivers, and in August, from five sites at each of the two locations. The coordinates of each site and the distance between sites are shown in Table 1 and Figure 2, respectively.
We filtered 2 L of surface water at each site through 0.45 µm cellulose nitrate filters (disposable filter funnel, 47 mm gridded filter, Thermo product no. 145-2405), and precautions were taken not to contaminate the water sample by wearing gloves during filtering. Two filters were used for each site, and 2 L of distilled water was filtered as a negative control for each sample. Each filter was preserved in 95% ethanol in a separate 2 mL cryopreservation tube, stored on ice in the field, returned to the laboratory, and stored at −80 °C until DNA extraction.

2.2. Batrachuperus Genus Specific Primers for Nested PCR

Candidate primer sets were designed using default parameters in the Primer 5 software. To obtain sufficient PCR products and a clear band consistent with the expected amplicon size from the field water sample, a nested PCR strategy was used. We designed a new Batrachuperus genus-specific primer pair to nest the Ma (2021) primers inside its amplification product, which amplified a fragment of 160 bp in the Cytb gene. Amplification tests were performed to validate the new Batrachuperus genus-specific primers in vitro. The primer pairs used in this study are listed in Table 2.

2.3. Environmental DNA Extraction and Detection

We extracted DNA from the tissue of Batrachuperus species and optimized the primer pair PCR annealing temperatures using the protocols described in Ma (2021) [33].
We used a DNeasy Blood and Tissue Kit (Qiagen, Dusseldorf, Germany) to extract the eDNA from the filter. First, we removed the filters from the ethanol and air-dried them for about 4–5 h. Next, we divided each filter in half with a sterile razor blade and transferred each of them to 2 mL extraction tubes, then added 500 mL ATL buffer into every tube and cut the filter membrane into tiny pieces, and then digested the content of every tube with 30 μL Pk for approximately 48 h at 56 °C.
Referring to the instructions of the kit, we made the following adjustments: 400 mL of AL and 400 mL of absolute ethyl alcohol were added to each tube. Negative filters were used as controls for eDNA extraction to confirm that contamination did not occur during the process. The DNA concentration was assessed using a Nanodrop 2000 spectrophotometer (Thermo Fisher Scientific, Waltham, MA, USA).
PCR amplification of Cytb using the P2 primer described by Ma (2021) was performed using the following protocol. The amplification reaction was performed in a total volume of 25 μL, including 12.5 μL high fidelity Mix (Solarbio, Beijing, China), 9 μL double distilled water (ddH2O), 0.5 μL of each primer with final concentration, and 2.5 μL of template DNA. PCR conditions were as follows: an initial denaturation step at 94 °C for 3 min, 50 cycles of 94 °C for 10 s, annealing at 56 °C for 10 s, and elongation at 72 °C for 10 s. The final elongation step was performed at 72 °C for 3 min. The polymerase chain reaction was used as the template for nested PCR. Amplification of a smaller fragment of the Cytb gene with the P1 primer was performed using the same PCR conditions as those mentioned above. Ten µL of the PCR products were visualized on 2% agarose gel at 120 V for 20 min with 2 µL of Nucleic Acid dye (Solarbio, Beijing, China). Amplicon size was determined using a DM2000 ladder (Solarbio, Beijing, China).

2.4. Measures for Avoiding Contamination in eDNA
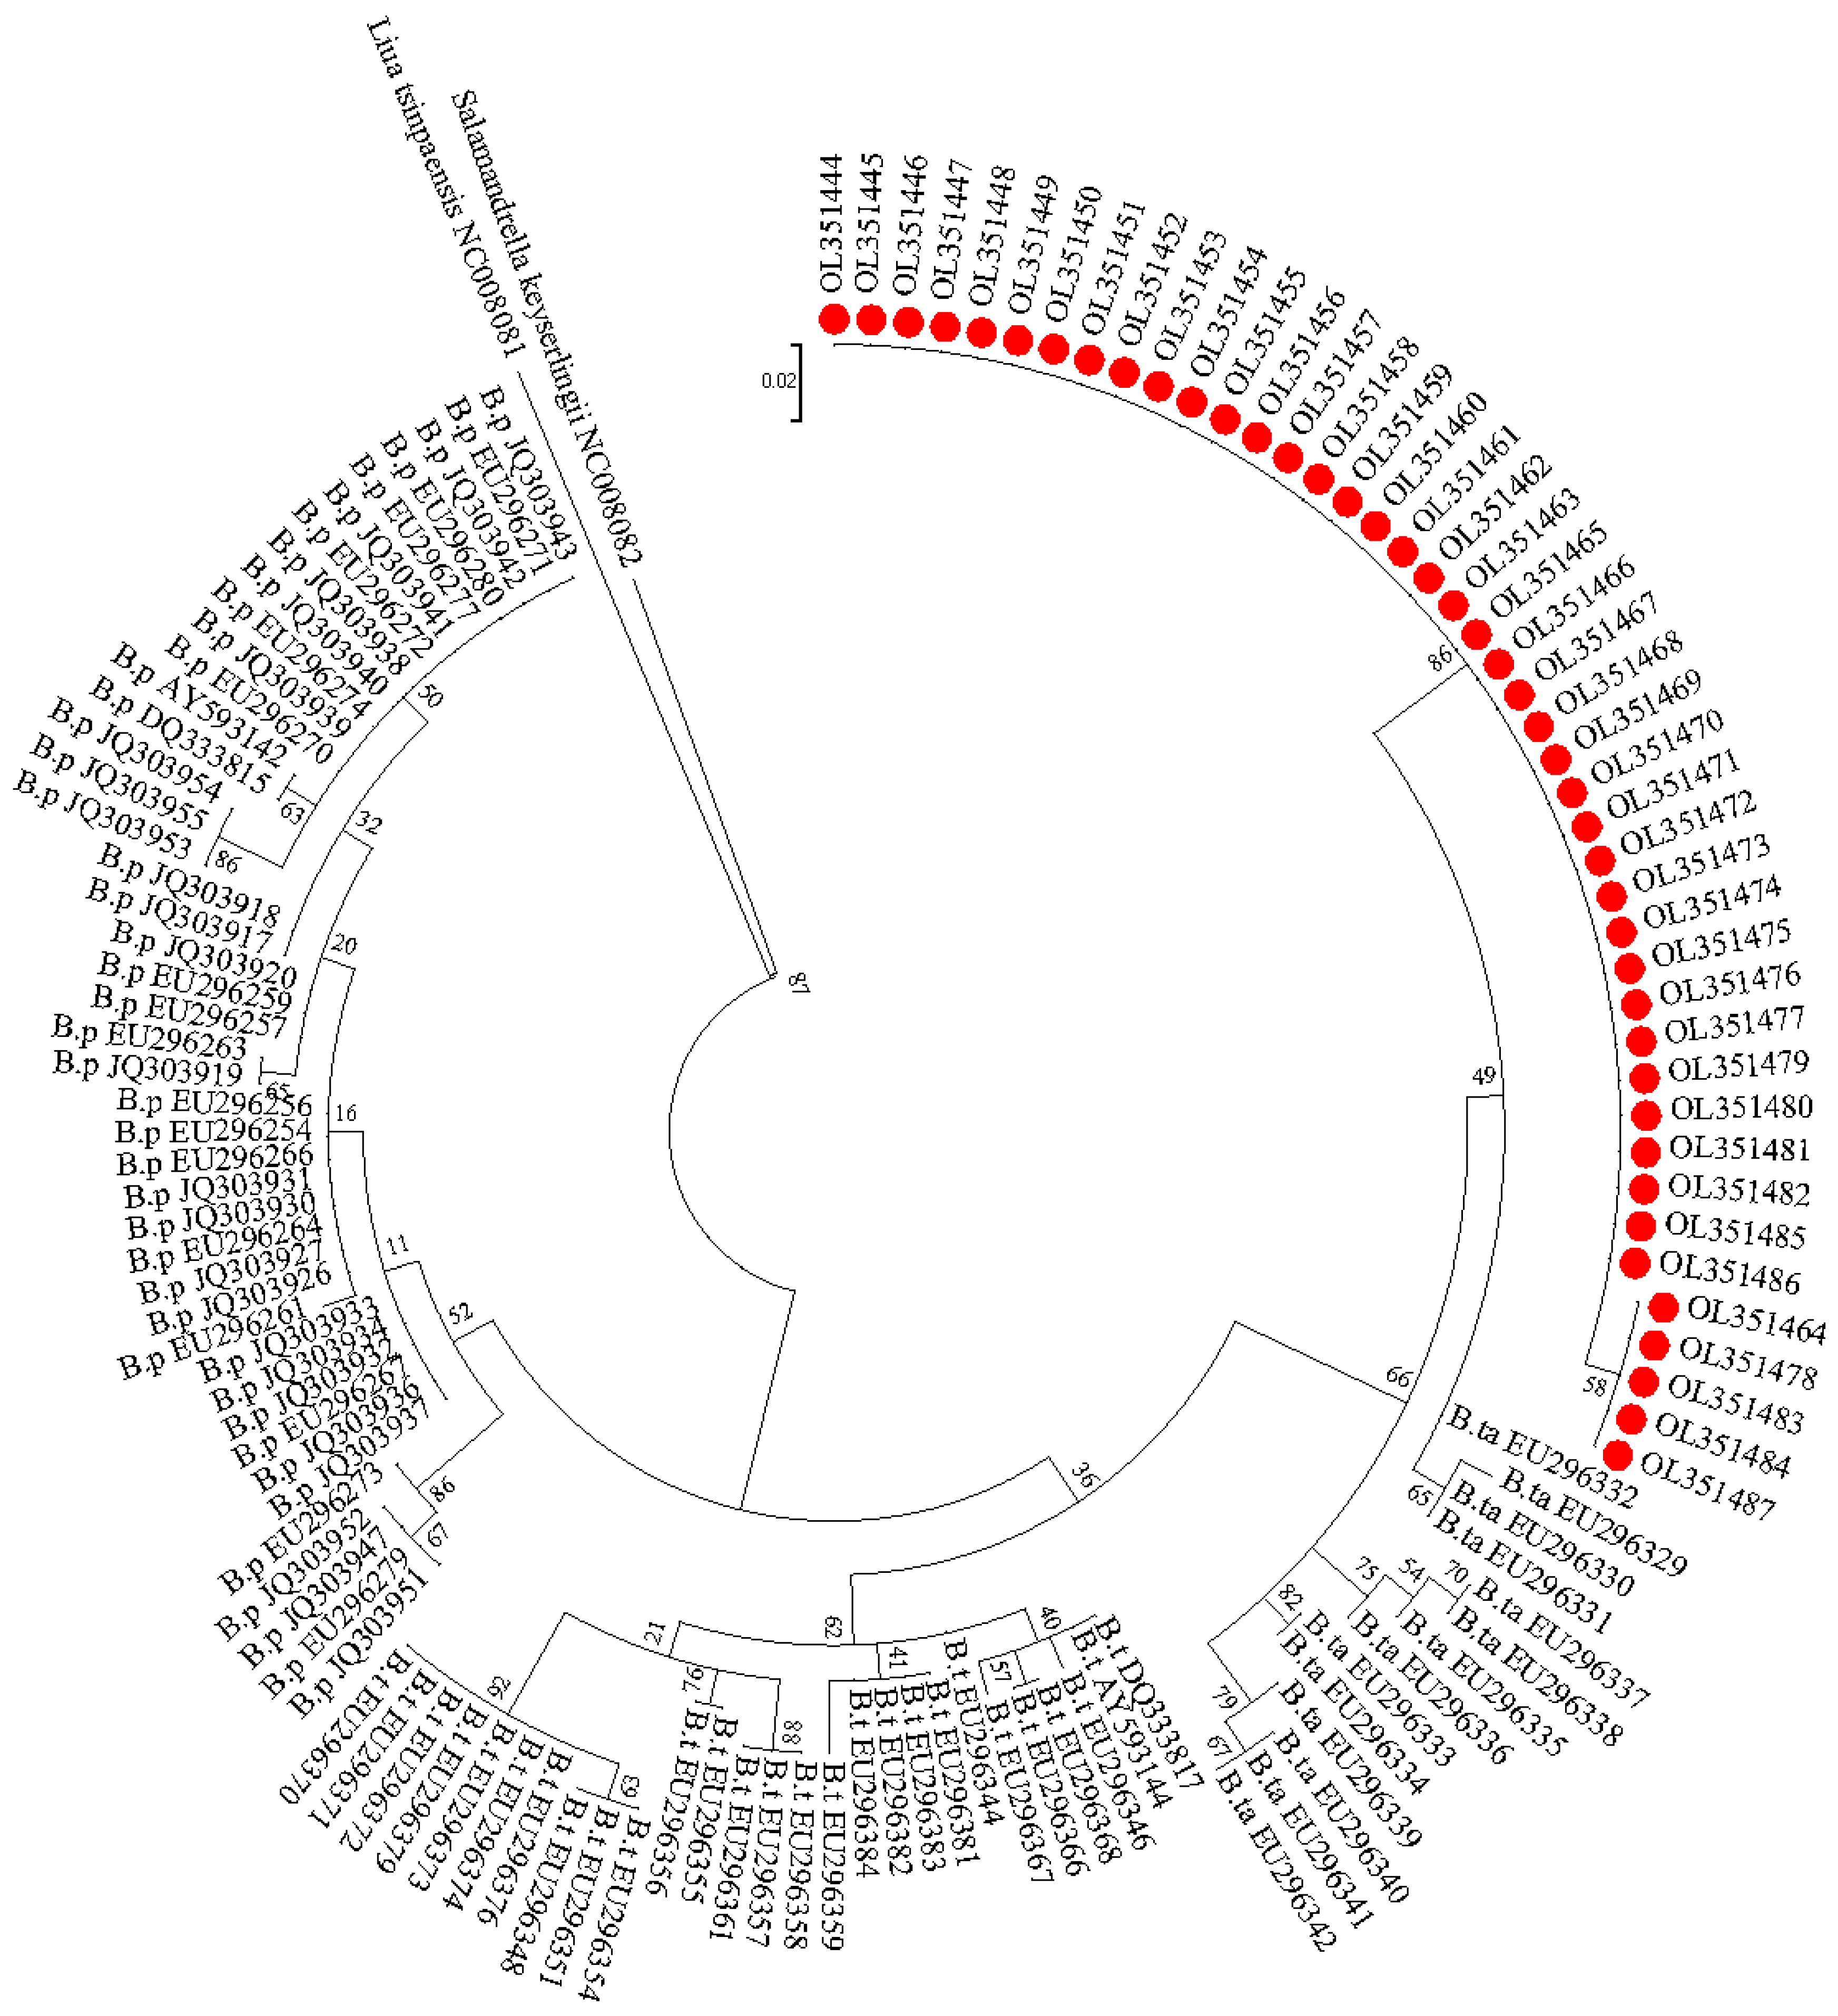
Throughout this study, we used separate rooms for DNA extraction, eDNA extraction, PCR, and post-PCR procedures. During eDNA extraction, we used different clean foam boxes as simple laminar flow hoods when drying each filter. Meanwhile, we ran all PCR and nested PCR reactions in four duplicates to discard false-positive and false-negative results due to technical failures. When the amplification results were not clear (the bands were too weak), the amplification was repeated using 3.5 µL of the PCR template instead of 2.5 µL as described above.
A minimum of two positive results from each site were considered valid to corroborate the presence of a species’ DNA in the sample, and we chose two positive PCR products for Sanger sequencing (Tsingke Biotechnology Co., Ltd., Beijing, China).

2.5. DNA Barcoding

The reference sequences for Batrachuperus were downloaded from GenBank. The sequences obtained in this study and the additional reference sequences were aligned using ClustalW in MEGA 7 [34]. The aligned sequences in our study were compared for their similarity to those in the NCBI GenBank database (http://www.ncbi.nlm.nih.gov, 15 January 2022) using the basic local analysis search tool (BLAST). The highest similarity of the queried sequence with the database sequences was determined, and the sequences that had a 98–100% similarity with the database sequences were identified as the respective species. MEGA 7 software was used to calculate the interspecific genetic distance and intraspecific genetic distance based on the Kimura-2-parameter (K-2-P) two-parameter model [29,34].
An ML tree was built using MEGA 7 software [34]. The HKY + I + G substitution model was selected using the jModel Test 2.1.4 [35,36]. The other parameters were the default values.

3. Results

3.1. Total eDNA Yield in Different Seasons

In this study, we successfully extracted eDNA from water samples from the Zhouzhi Heihe River using the DNeasy Blood and Tissue Kit (Qiagen, Dusseldorf, Germany) with optimized steps. The results showed that eDNA concentrations were higher in the August collections, especially in samples from the Miao Gou River (Table S1).

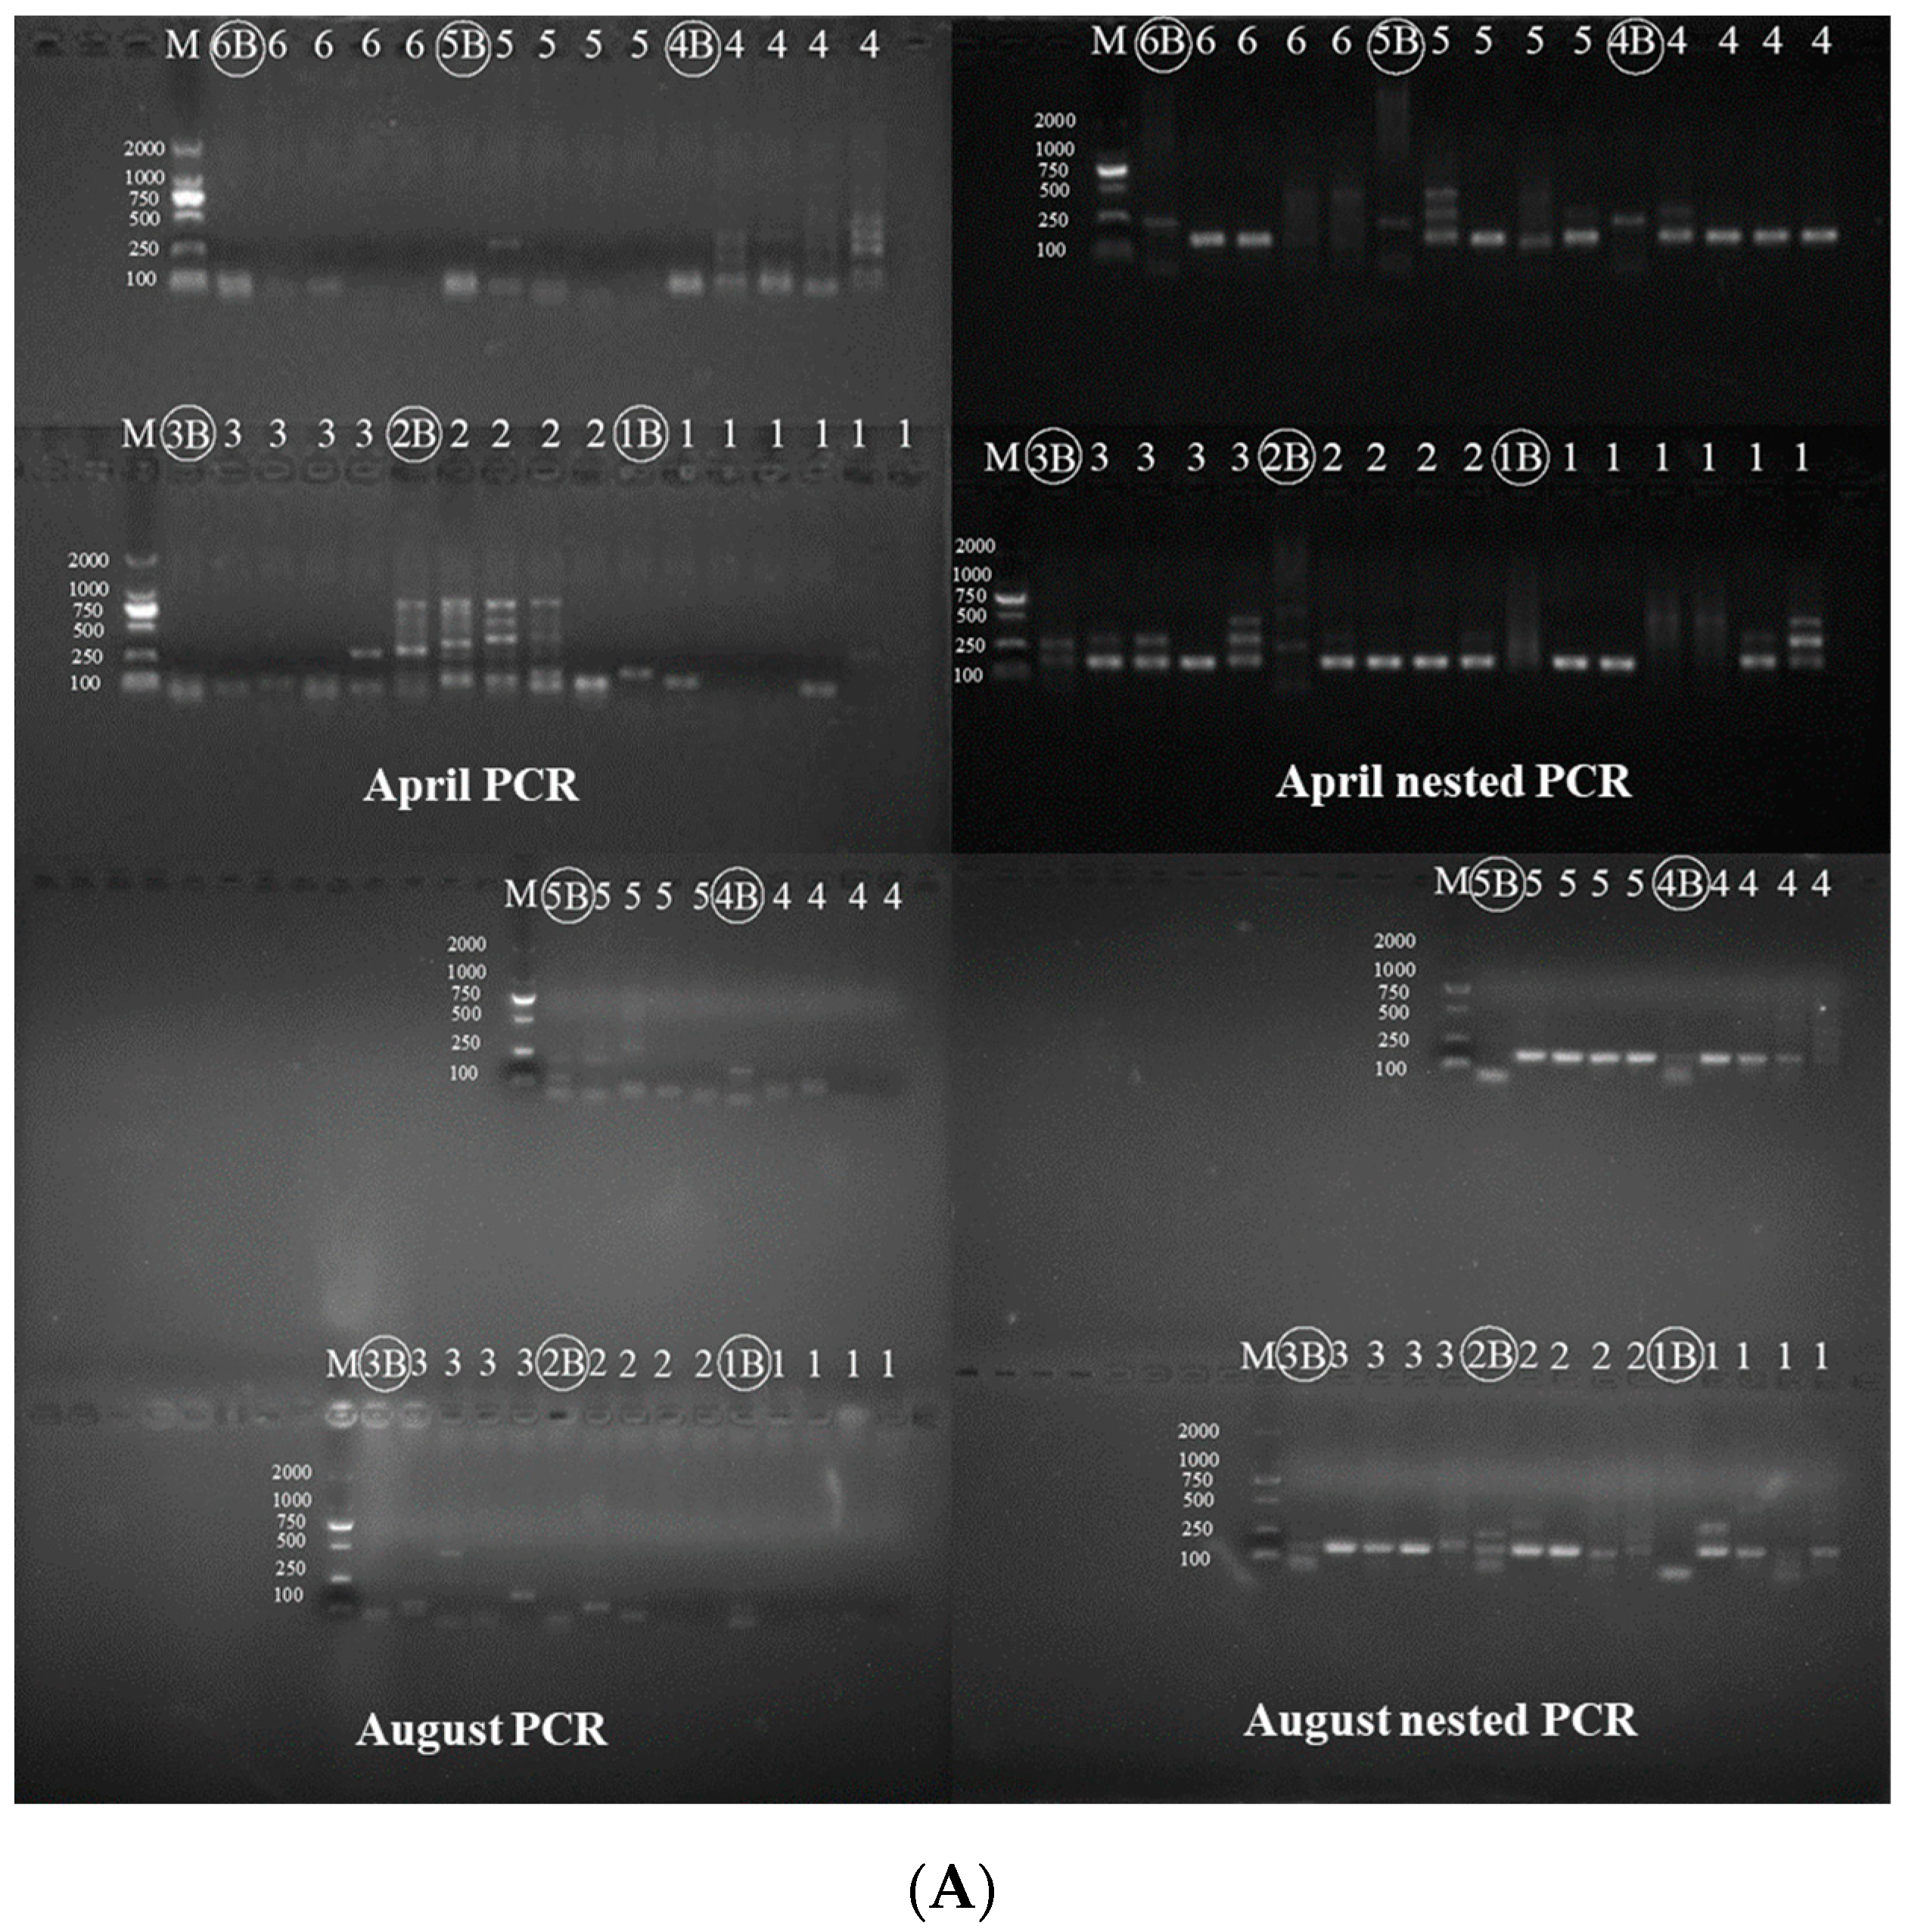
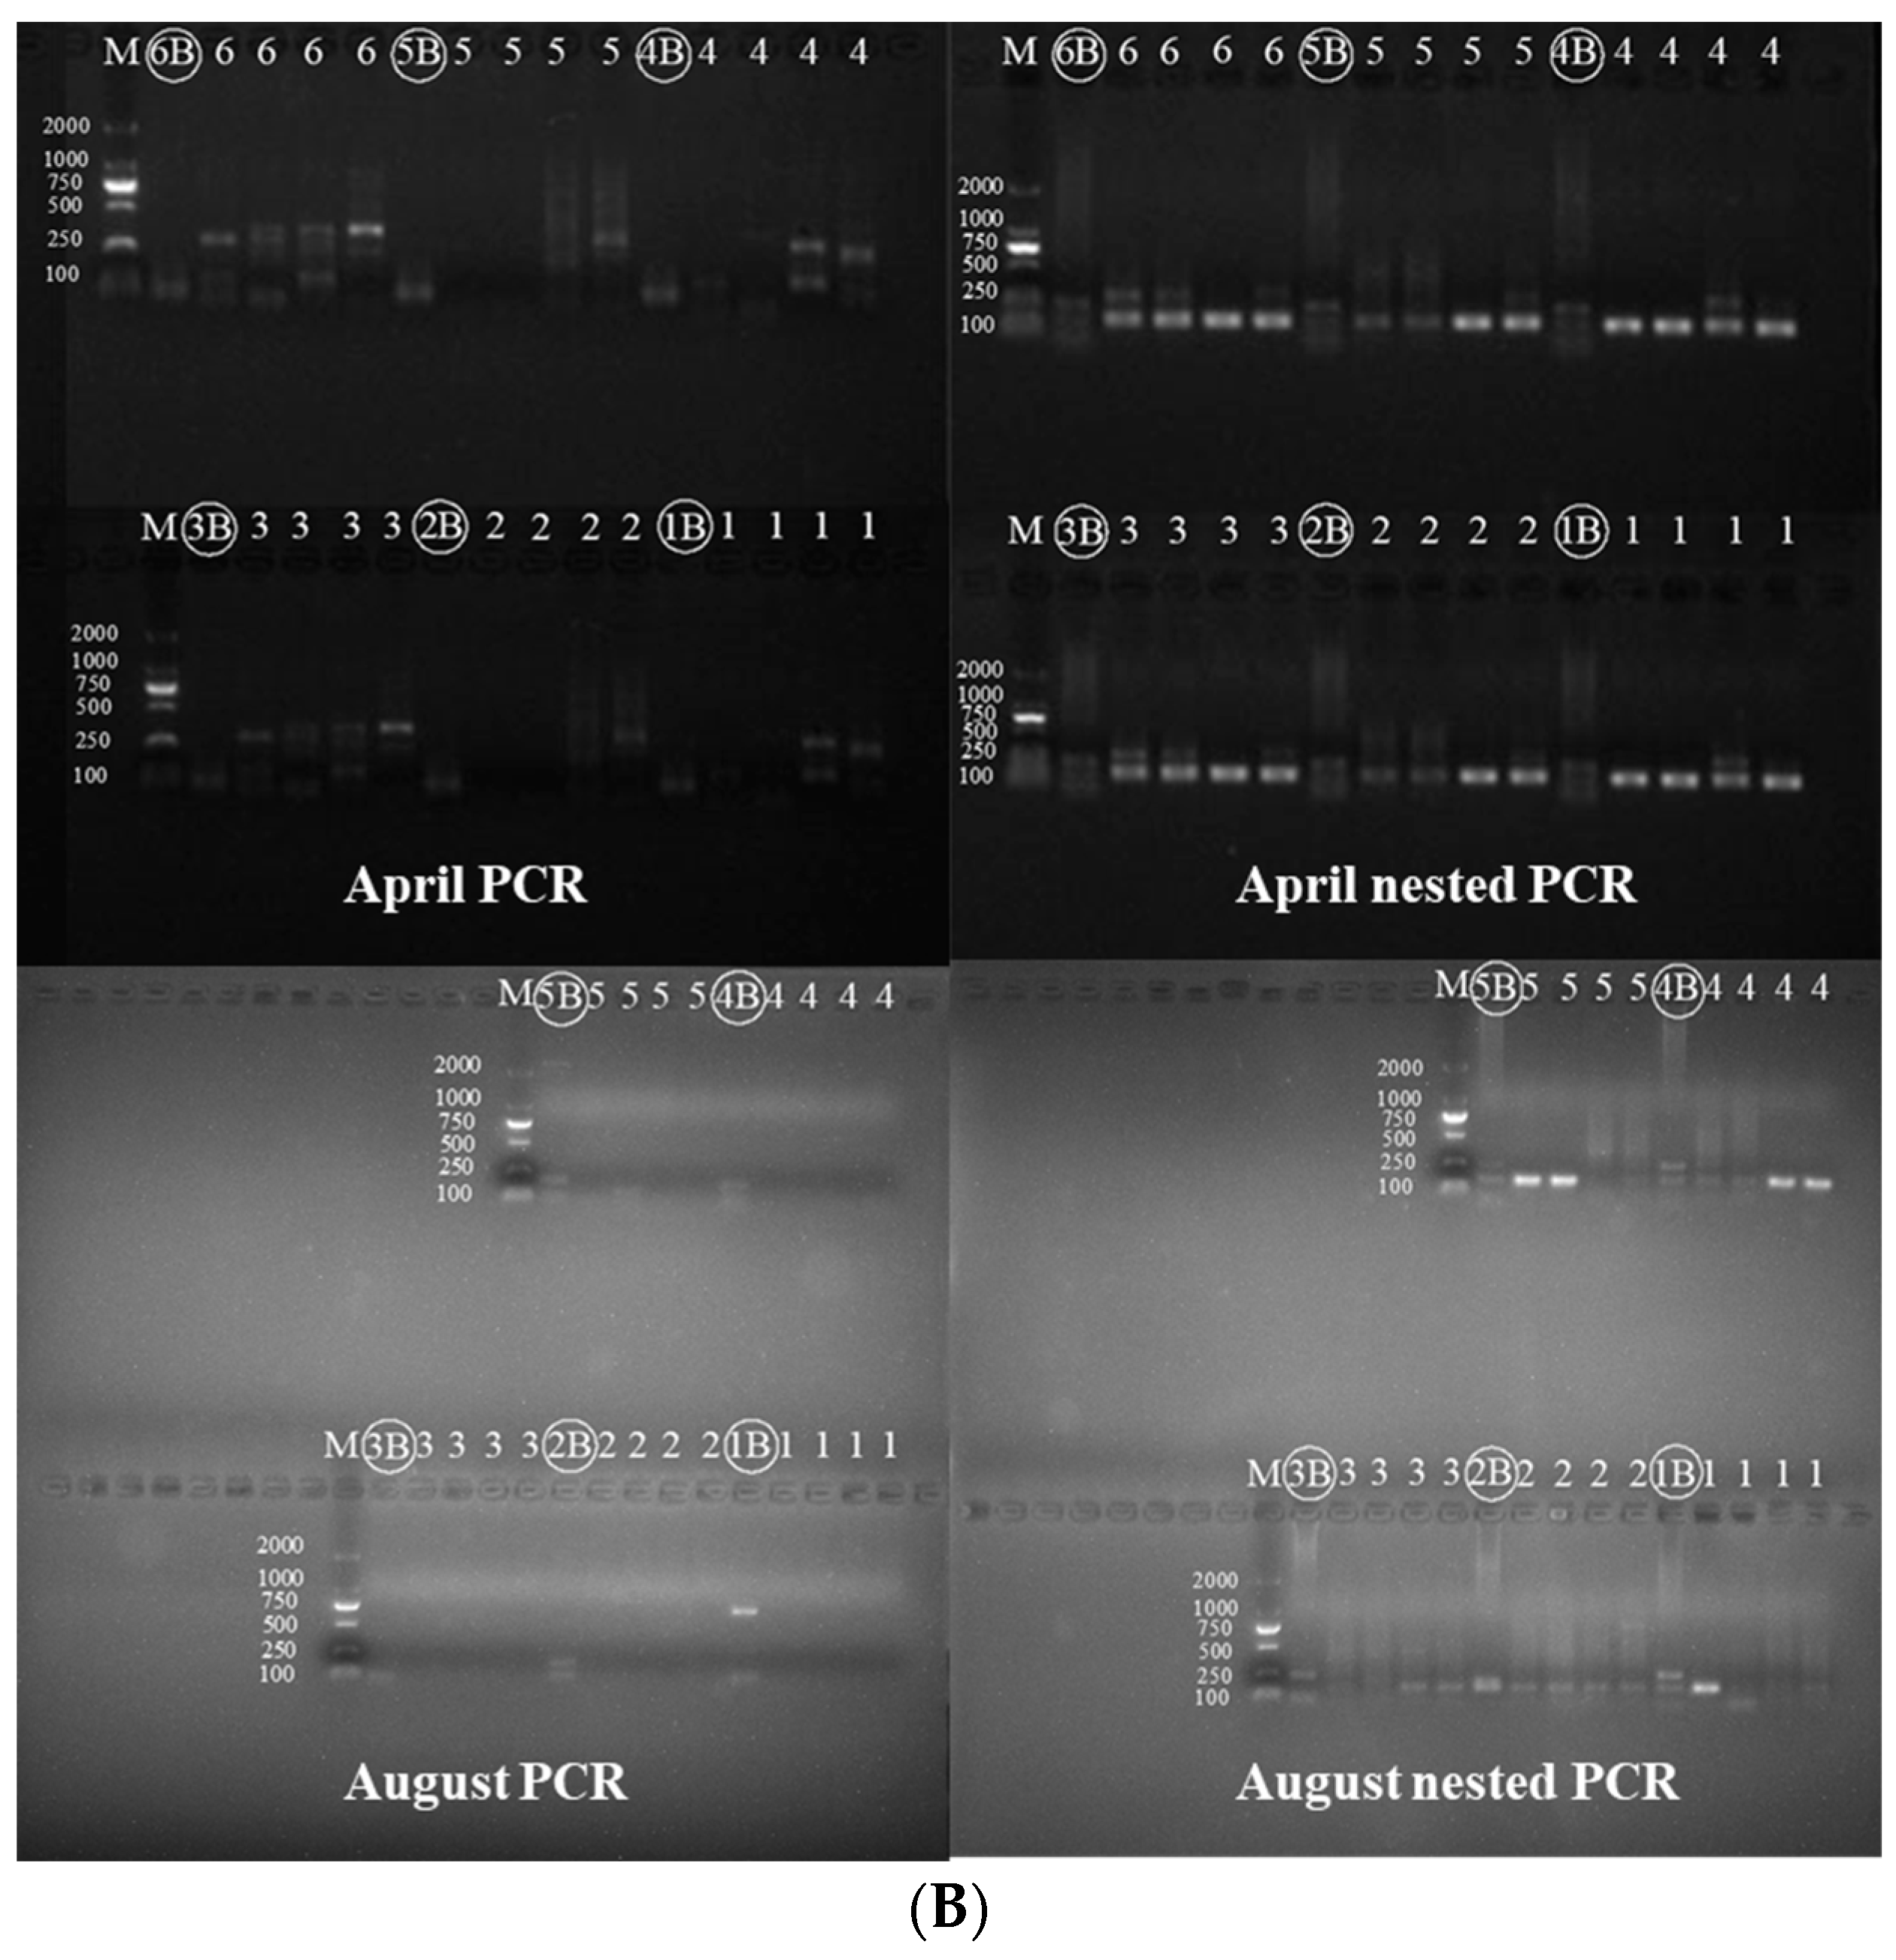
3.2. Species-Specific Nested PCR

PCR was performed using the P2 primer [33] and high-fidelity mix, and four replicates were performed for each site (except for site 4-1-1 with six replicates). This PCR product was used as the template for nested PCR, and the nested PCR provided a clear band of 160 nucleotides (except for the negative controls). The nested PCR with at least two single clear bands from each site was considered valid in both the San Cha and Miao Gou River samples (Figure 3). Single clear bands were sequenced by nested PCR at Tsingke Biotechnology Co., Ltd. (Beijing, China).
According to the PCR and nested PCR results, we found that the band intensities from the samples collected in April tended to be brighter than those from August, suggesting a higher concentration of Batrachuperus eDNA in April (Figure 3). We also found clear bands in which the water sites were at least 50 m and 150 m downstream from the source population in the river (Table 1 and Figure 3).

3.3. Detection of Batrachuperus taibaiensis DNA in Water Sample

In this study, we chose two clear single bands for every collection site on the Heihe River in April and August (44 sequences in total). Sequence alignment was conducted between the sequences in this study, and Batrachuperus Cytb sequences were downloaded from NCBI, followed by truncation of the aligned sequences. The sequences of the amplified nested PCR products were deposited in the NCBI GenBank database with accession numbers OL351444-OL351487.
The Cytb gene sequences obtained in this study were compared with those available in the GenBank (Cytb) database. Each species showed high values of intraspecific homology, and 98–100% of them were among the Batrachuperus species (Figure S1).
In the Cytb sequences, the interspecies genetic distances among all Batrachuperus species were between 0.0532 and 0.1077 (Table 3), which were greater than the minimum species identification value of 0.020 suggested by Hebert [29]. The intraspecies genetic distances were between 0.0019 and 0.0322 (Table 4). The interspecies value was larger than the intraspecies value, indicating that Cytb can be used as an effective barcode gene for the accurate identification of Batrachuperus species. Meanwhile, the interspecies genetic distance between our sequence and B. taibaiensis from NCBI was the smallest. Therefore, we can speculate that the sequences in our study belong to B. taibaiensis.
A molecular phylogenetic tree was constructed using the Maximum Likelihood Method (Figure 4). B. pinchonii, B. tibetanus, and B. taibaiensis sequences from the NCBI database were clustered separately in the evolutionary tree. Sequences in our study were clustered with B. taibaiensis, indicating that Batrachuperus inhabiting the Heihe River belongs to B. taibaiensis. The phylogenetic tree was consistent with the results of the DNA barcoding analysis.

4. Discussion

This study is the first to demonstrate that eDNA methods can provide a basis for investigating the presence of B. taibaiensis in natural river habitats. B. taibaiensis is a vitally important and rare endemic species in the Qingling Mountains, and the application of eDNA techniques requires a series of optimized steps [37]. As shown in previous studies, a high-fidelity enzyme mix can better amplify the target band of water sample eDNA [33], and nested PCR is reliable when organisms are secretive or live at low densities [27]. Therefore, a high-fidelity enzyme mix and nested PCR method were used in our study to amplify the eDNA of Batrachuperus. Since the eDNA fragment of Batrachuperus was amplified using genus-specific primers, DNA barcoding and phylogenetic analysis were performed to determine the classification of the different species [20,28,29,30]. The results showed that the sequences obtained here had the smallest genetic distance from the B. taibaiensis sequence downloaded from NCBI and were also on the same branch as B. taibaiensis in the phylogenetic tree. It is necessary to increase the number of samples in the field and replicate more molecular workflows to enhance the reliability of the eDNA analysis of rare species [14,25]. This was done in our research. Studies on the distribution of B. taibaiensis have shown that this species is mainly located in the upper reaches of the Zhouzhi Heihe River basin [5,38]. Our research also revealed that the species of Batrachuperus inhabiting the Heihe River belonged to B. taibaiensis.
Our study showed that overall, the total eDNA concentration in August was higher than that in April in the Heihe River (shown in Table S1), whereas band intensities of the eDNA concentrations of B. taibaiensis were higher in April than those in August (Figure 3). Therefore, we can infer that the total eDNA concentration is not proportional to the target eDNA concentration. This can be explained by factors that influence the eDNA concentration of the target species. More populous species had a higher rate of detection and concentration of eDNA [12]. In our study, the samples of B. taibaiensis collected in April were found at intervals of 20–30 m, whereas in August, the intervals were 50–100 m. We obtained a high concentration of B. taibaiensis eDNA in April. We also need to take into account the sampling season and physiological conditions of the animals [11,39]. Unlike rainy August, April with warm temperatures is also the breeding season for B. taibaiensis [5,40], which leads to increased mobility and metabolism of B. taibaiensis and more DNA released into the environment through skin excretions, sloughed cells, and mucus excretion.
We detected B. taibaiensis eDNA in the stream where they live; however, the extent to which the target eDNA can be transported downstream through a flowing stream is unknown. We collected eDNA samples 50 and 150 m downstream from the source population of the river. The first reason for these choices is that the electricity required for the filtering device is often unavailable in the field; therefore, the number of filtered samples is limited. Another reason could be related to the results of previous studies. As both salamanders and B. taibaiensis live in cool, shady stream conditions, their transportation distances may be similar. Pilliod (2014) collected eDNA samples from caged salamanders at 5 m and 50 m downstream of the original source [41]. Although the eDNA of salamanders was only detected at 5 m, the eDNA of B. taibaiensis was also detected at 10 m (Table 1). Therefore, we wanted to identify whether the eDNA of B. taibaiensis could be collected at 50 m, and the answer was yes. The reason for this phenomenon may be that the caged salamanders had some stress response when placed in the river, whereas B. taibaiensis remained calm in the water. In other words, if there is no frequent movement of individuals, the degradation rate of eDNA will decrease [41]. Eichmiller (2014) [12] and Jane (2015) [42] detected target fish eDNA at 100 m and 239.5 m downstream, respectively. Because fish have a higher detection rate, we chose 150 m as the longest distance from the source location of B. taibaiensis, and eDNA could also be detected at this distance. In the future, we can extend the distance to obtain more information about the transport distance of B. taibaiensis eDNA because eDNA may travel much further distances, possibly in the order of kilometers [8]. In summary, B. taibaiensis eDNA can reach at least 150 m downstream from its point of origin, and we suspect that the density of the population has a significant influence on eDNA transport distance.

5. Conclusions

We have demonstrated that B. taibaiensis eDNA from the Heihe River can be amplified using genus-specific primers by nested PCR and barcoding sequence analysis. B. taibaiensis eDNA can be obtained at least 150 m downstream from its point of origin. This approach can now be applied for the detection of other rare species in rivers.

Supplementary Materials

The following supporting information can be downloaded at: https://www.mdpi.com/article/10.3390/ani12091105/s1, Table S1: Total eDNA concentration. Figure S1: List of species identification results using the NCBI GenBank in this study.

Author Contributions

Conceptualization, H.M.; methodology, H.M.; software, H.M. and X.D.; validation, H.M. and X.D.; formal analysis, H.M. and Q.W.; investigation, H.M. and H.Z. (Han Zhang); resources, H.Z. (Hongxing Zhang); data curation, H.M.; writing—original draft preparation, H.M.; writing—review and editing, H.M., H.Z. (Hongxing Zhang), and Q.W.; visualization, H.M.; supervision, J.D., H.Z. (Hu Zhao) F.K. and W.J.; project administration, H.Z. (Hongxing Zhang); funding acquisition, H.M. All authors have read and agreed to the published version of the manuscript.

Funding

This research was funded by the Shaanxi Academy of Science of China (grant No. 2020k-19; grant No. 2017k-10), Shaanxi Science and Technology Department of China (grant No. 2022NY-045), Natural Science Foundation of Shaanxi Province of China (grand No. 2020JQ-972).

Institutional Review Board Statement

Not applicable.

Data Availability Statement

The sequences data were deposited in the NCBI GenBank database with accession numbers OL351444-OL351487.

Conflicts of Interest

The authors declare no conflict of interest.

References

  1. Huang, Q.T.; Gong, D.J.; Zhang, H.J.; Zuo, J.H.; Nan, X.M. Distribution and conservation of Batrachuperus Stream Salamanders in China. Chin. J. Wildl. 2017, 38, 682–688. (In Chinese) [Google Scholar]
  2. Fu, J.Z.; Zeng, X.M. How many species are in the genus Batrachuperus? A phylogeographical analysis of the stream salamanders (family Hynobiidae) from southwestern China. Mol. Ecol. 2008, 17, 1469–1488. [Google Scholar]
  3. Song, M.T.; Zeng, X.M.; Wu, G.F.; Liu, Z.J.; Fu, J.Z. A new species of Batrachuperus from northwestern China. Asiat. Herpetol. Res. 2001, 9, 6–8. [Google Scholar] [CrossRef]
  4. Zhao, A.N.; Xiao, B. Study on the development and protection of biodiversity in Heihe river wetland. Shaanxi For. Sci. Technol. 2007, 2, 31–34. (In Chinese) [Google Scholar]
  5. Zhang, Y.M.; Liu, X.L.; Sun, C.M. Shaanxi Aquatic Wildlife; Xi’an Map Publishing House: Xi’ an, China, 2006. (In Chinese) [Google Scholar]
  6. Liu, R.C. Surface Water and Groundwater Coupling Simulation Research in Heihe Basin of Shaanxi; Chang’an University: Xi’ an, China, 2015. (In Chinese) [Google Scholar]
  7. Liang, J.X. Based on Cytb and D-Loop Region Sequence Analysis of the Pedigree Geography of Batrachuperus Taibaienses; Shaanxi Normal University: Xi’ an, China, 2010. (In Chinese) [Google Scholar]
  8. Deiner, K.; Altermatt, F. Transport distance of invertebrate environmental DNA in a natural river. PLoS ONE 2014, 9, e88786. [Google Scholar]
  9. Gustavson, M.S.; Collins, P.C.; Finarelli, J.A.; Egan, D.; Conchuir, R.Q.; Wightman, G.D.; King, J.J.; Gauthier, D.T.; Whelan, K.; Carlsson, J.E.L.; et al. An eDNA assay for Irish Petromyzon marinus and Salmo trutta and field validation in running water. J. Fish Biol. 2015, 87, 1254–1262. [Google Scholar] [CrossRef]
  10. Ficetola, G.F.; Miaud, C.; Pompanon, F.; Taberlet, P. Species detection using environmental DNA from water samples. Biol. Lett. 2008, 4, 423–425. [Google Scholar] [CrossRef] [PubMed] [Green Version]
  11. Goldberg, C.S.; Pilliod, D.S.; Arkle, R.S.; Waits, L.P. Molecular detection of vertebrates in stream water: A demonstration using Rocky Mountain Tailed Frogs and Idaho Giant Salamanders. PLoS ONE 2011, 6, e22746. [Google Scholar] [CrossRef] [PubMed]
  12. Eichmiller, J.J.; Bajer, P.G.; Sorensen, P.W. The Relationship between the distribution of common carp and their environmental DNA in a small lake. PLoS ONE 2014, 9, e112611. [Google Scholar] [CrossRef] [Green Version]
  13. Secondi, J.; Dejean, T.; Valentini, A.; Miaud, C.; Audebaud, B. Detection of a global aquatic invasive amphibian, Xenopus laevis, using environmental DNA. Amphib-Reptil. 2016, 37, 131–136. [Google Scholar] [CrossRef] [Green Version]
  14. Dejean, T.; Valentini, A.; Duparc, A.; Pellier-Cuit, S.; Pompanon, F.; Taberlet, P.; Miaud, C. Persistence of environmental DNA in freshwater ecosystems. PLoS ONE 2011, 6, e23398. [Google Scholar] [CrossRef] [PubMed] [Green Version]
  15. Biggs, J.; Ewald, N.; Valentini, A.; Gaboriaud, C.; Dejean, T.; Griffiths, R.A.; Foster, J.; Wilkinson, J.W.; Arnell, A.; Brotherton, P.; et al. Using eDNA to develop a national citizen science-based monitoring programme for the great crested newt (Trituruscristatus). Biol. Conserv. 2015, 183, 19–28. [Google Scholar] [CrossRef]
  16. Jerde, C.L.; Mahon, A.R.; Chadderton, W.L.; Lodge, D.M. “Sight-unseen” detection of rare aquatic species using environmental DNA. Conserv. Lett. 2011, 4, 150–157. [Google Scholar] [CrossRef]
  17. Goldberg, C.S.; Sepulveda, A.; Ray, A.; Baumgardt, J.; Waits, L.P. Environmental DNA as a new method for early detection of New Zealand mudsnails (Potamopyrgus antipodarum). Freshw. Sci. 2013, 32, 792–800. [Google Scholar] [CrossRef] [Green Version]
  18. Takahara, T.; Minamoto, T.; Doi, H. Using environmental DNA to estimate the distribution of an invasive fish species in ponds. PLoS ONE 2013, 8, e56584. [Google Scholar] [CrossRef] [PubMed] [Green Version]
  19. Geerts, A.N.; Boets, P.; Heede, S.V.D.; Goethals, P.; Heyden, C.V.D. A search for standardized protocols to detect alien invasive crayfish based on environmental DNA (eDNA): A lab and field evaluation. Ecol. Indic. 2017, 84, 564–572. [Google Scholar] [CrossRef]
  20. Clusa, L.; García-Vázquez, E. A simple, rapid method for detecting seven common invasive fish species in Europe from environmental DNA. Aquat. Conserv. Mar. Freshw. Ecosyst. 2018, 28, 619–629. [Google Scholar] [CrossRef]
  21. Thomsen, P.F.; Kielgast, J.; Iversen, L.L.; Moller, P.R. Detection of a diverse marine fish fauna using environmental DNA from seawater samples. PLoS ONE 2012, 7, e41732. [Google Scholar] [CrossRef]
  22. Yamanaka, H.; Minamoto, T. The use of environmental DNA of fishes as an efficient method of determining habitat connectivity. Ecol. Indic. 2016, 62, 147–153. [Google Scholar] [CrossRef] [Green Version]
  23. Takahara, T.; Minamoto, T.; Yamanaka, H.; Doi, H.; Kawabata, Z. Estimation of fish biomass using environmental DNA. PLoS ONE 2012, 7, e35868. [Google Scholar] [CrossRef] [Green Version]
  24. Hinlo, R.; Gleeson, D.; Lintermans, M.; Furlan, E. Methods to maximise recovery of environmental DNA from water samples. PLoS ONE 2017, 12, e0179251. [Google Scholar] [CrossRef]
  25. Deiner, K.; Walser, J.C.; Mchler, E.; Altermatt, F. Choice of capture and extraction methods affect detection of freshwater biodiversity from environmental DNA. Biol. Conserv. 2015, 183, 53–63. [Google Scholar] [CrossRef]
  26. Tsuji, S.; Yamanaka, H.; Minamoto, T. Effects of water pH and proteinase K treatment on the yield of environmental DNA from water samples. Limnology 2016, 18, 1–7. [Google Scholar] [CrossRef]
  27. Clusa, L.; Ardura, A.; Fernández, S.; Roca, A.A.; García-Vázquez, E. An extremely sensitive nested PCR-RFLP mitochondrial marker for detection and identification of salmonids in eDNA from water samples. Peer J. 2017, 5, e3045. [Google Scholar] [CrossRef] [Green Version]
  28. Clusa, L.; Ardura, A.; Gower, F.; Miralles, L.; Tsartsianidou, V.; Zaiko, A.; Garcia-Vazques, E. An easy phylogenetically informative method to trace the globally invasive potamopyrgus mud snail from river’s eDNA. PLoS ONE 2016, 11, e0162899. [Google Scholar] [CrossRef] [PubMed] [Green Version]
  29. Liang, R.S.; Tang, F.S.; He, H.B.; Wang, J.; Li, J.T.; Li, Q.Q.; Chen, Y.Z.; Lin, L.; Zhang, K. DNA barcoding and molecular phylogenetic relationships of Epinephelus species from western Pacific coastal areas. Acta Hydrobiol. Sin. 2021, 45, 851–860. (In Chinese) [Google Scholar]
  30. Sun, S.E.; Zhang, X.J.; Kong, L.F.; Li, Q.J. Molecular identification of dried shellfish products sold on the market using DNA barcoding. Ocean Univ. China Ocean. Coast. Sea Res. 2021, 20, 931–938. [Google Scholar] [CrossRef]
  31. Huang, X.M.; Tong, D. Introduction of water diversion project in Xi’an Heihe river. J. Hydraul. Eng. 1992, 2, 42. (In Chinese) [Google Scholar]
  32. Zhao, H.; Wang, Q.J.; Jiang, W.; Deng, J.; Kong, F.; Zhang, H.X. Analysis of variation in water temperature of rare aquatic wildlife natrue reserve of Heihe river. Genom. Appl. Biol. 2017, 36, 1505–1510. (In Chinese) [Google Scholar]
  33. Ma, H.Y.; Zhang, H.; Deng, J.; Zhao, H.; Kong, F.; Jiang, W.; Zhang, H.X.; Wang, Q.J. Establishment of analysis method for environment DNA of Batrachuperus from water samples. J. Anhui Agric. Univ. 2021, 48, 784–789. (In Chinese) [Google Scholar]
  34. Kumar, S.; Stecher, G.; Tamura, K. MEGA7: Molecular evolutionary genetics analysis version 7.0 for bigger datasets. Mol. Biol. Evol. 2016, 33, 1870–1874. [Google Scholar] [CrossRef] [Green Version]
  35. Darriba, D.; Taboada, G.L.; Doallo, R.; Posada, D. jModel Test 2: More models, new heuristics and parallel computing. Nat. Methods 2012, 9, 772. [Google Scholar] [CrossRef] [PubMed] [Green Version]
  36. Guindon, S.; Gascuel, O. A simple, fast, and accurate algorithm to estimate large phylogenies by maximum likelihood. Syst. Biol. 2003, 52, 696–704. [Google Scholar] [CrossRef] [PubMed] [Green Version]
  37. Minamoto, T.; Naka, T.; Moji, K.; Maruyama, A. Techniques for the practical collection of environmental DNA: Filter selection, preservation, and extraction. Limnology 2016, 17, 23–32. [Google Scholar] [CrossRef]
  38. Zhao, H.; Wang, Q.J.; Jiang, W.; Deng, J.; Kong, F.; Zhang, H.X. Measurement and analysis of morphological features of the Batrachuperus taibaiensis. Genom. Appl. Biol. 2017, 36, 622–629. (In Chinese) [Google Scholar]
  39. Strickler, K.M.; Fremier, A.K.; Goldberg, C.S. Quantifying effects of UV-B, temperature, and pH on eDNA degradation in aquatic microcosms. Biol. Conserv. 2015, 183, 85–92. [Google Scholar] [CrossRef]
  40. Fei, L.; Ye, C.Y.; Jiang, J.P. Colored Atlas of Chinese Amphibians; Sichuan Publishing House of Science & Technology: Chengdu, China, 2010. (In Chinese) [Google Scholar]
  41. Pilliod, D.S.; Goldberg, C.S.; Arkle, R.S.; Waits, L.P. Factors influencing detection of eDNA from a stream-dwelling amphibian. Mol. Ecol. Resour. 2014, 14, 109–116. [Google Scholar] [CrossRef]
  42. Jane, S.F.; Wilcox, T.M.; McKelvey, K.S.; Young, M.K.; Schwartz, M.K.; Lowe, W.H.; Letcher, B.H.; Whiteley, A.R. Distance, flow and PCR inhibition: eDNA dynamics in two headwater streams. Mol. Ecol. Resour. 2015, 15, 216–227. [Google Scholar] [CrossRef]
Figure 1. Geographic area of partial Heihe River (red circles represent locations where water samples were collected in our study).
Animals 12 01105 g001
Figure 2. Schematic diagram of sampling sites within San Cha River and Miao Gou River (numbers in black represent the data of April collection, and the numbers in purple represent August collection; arrow indicates the direction of river).
Animals 12 01105 g002
Figure 3. PCR and nested PCR results of water eDNA sample for San Cha River (A) and Miao Gou River (B). (M, marker; B, blank; 1-6: last number of site name in Table 1).
Animals 12 01105 g003aAnimals 12 01105 g003b
Figure 4. Molecular phylogenetic tree by Maximum Likelihood method (The ML tree is based on the HKY + I + G model; B. p, Batrachuperus pinchonii, B. t, Batrachuperus tibetanus, B. ta, Batrachuperus taibaiensis; red circles show the sample sequences from this study; Liua tsinpaensis and Salamandrella keyserlingii as an outgroup; numbers on branch in the tree are bootstrap values with percentage.).
Animals 12 01105 g004
Table 1. The information on each site where we collected water for eDNA analysis (The site where the Batrachuperus species appeared when we collected water samples is shown with “+”, otherwise with “−”).
Collection TimeLocationSite NameCoordinatesDistance between the Most Upstream Site and the Other Site (m)Batrachuperus
Species Appeared or Not
4 AprilSan Cha river4-1-433.82884 N, 107.81094 W 0+
4-1-333.82897 N, 107.80912 W 50+
4-1-233.82917 N, 107.81048 W80+
4-1-133.82938 N, 107.81062 W90+
4-1-533.82890 N, 107.81094 W140
4-1-633.82918 N, 107.81126 W240
Miao Gou river4-2-433.82928 N, 107.95356 W 0+
4-2-333.82919 N, 107.95385 W 40+
4-2-233.82918 N, 107.95362 W65+
4-2-133.82920 N, 107.95325 W80+
4-2-533.82859 N, 107.95459 W140
4-2-633.82858 N, 107.95496 W240
1 AugustSan Cha river8-1-333.82899 N, 107.80912 W 0+
8-1-233.82837 N, 107.80970 W150+
8-1-133.82951 N, 107.81059 W250+
8-1-433.82928 N, 107.81107 W300
8-1-533.82932 N, 107.81181 W400
Miao Gou river8-2-333.82969 N, 107.95307 W 0+
8-2-233.82942 N, 107.95377 W200+
8-2-133.82925 N, 107.95342 W300+
8-2-433.82875 N, 107.95449 W360
8-2-533.82852 N, 107.95499 W460
Note: 4-1-1, 4-2-1, 8-1-1, 8-2-1 are the source population sites in our study.
Table 2. Primer pairs for partial Cytb gene amplification of samples from Batrachuperus genus.
PrimerPrimer SequenceAnnealing Temperature (°C)Size (bp)Origin
P1F:5′-GTAGATAAGGCTACTCTTACTC-3′
R:5′-ATGGGTGGAATGGAACT-3′
46160This study
P2F:5′-TTGAGGTGGGTTCTCTGTAGATAAG-3′
R:5′-GGTTGGCGGGTGTAAAA-3′
52290[33]
Table 3. The interspecies genetic distances of Batrachuperus.
B. pinchoniiB. tibetanusB. taibaiensisSpecies in Our Study
B. pinchonii/0.0677 ± 0.02040.0963 ± 0.02660.1077 ± 0.0313
B. tibetanus//0.0928 ± 0.02570.0947 ± 0.0282
B. taibaiensis///0.0532 ± 0.0195
Note: Data are presented as interspecies genetic distance ± standard deviation.
Table 4. The intraspecific genetic distances of each Batrachuperus species.
B. pinchoniiB. tibetanusB. taibaiensisSpecies in Our Study
intraspecific genetic distances0.0253 ± 0.0090.0310 ± 0.01090.0322 ± 0.01130.0019 ± 0.0018
Note: Data are presented as intraspecies genetic distance ± standard deviation.
Publisher’s Note: MDPI stays neutral with regard to jurisdictional claims in published maps and institutional affiliations.

