Automated Video-Based Analysis Framework for Behavior Monitoring of Individual Animals in Zoos Using Deep Learning—A Study on Polar Bears
Abstract
:Simple Summary
Abstract
1. Introduction
2. Dataset
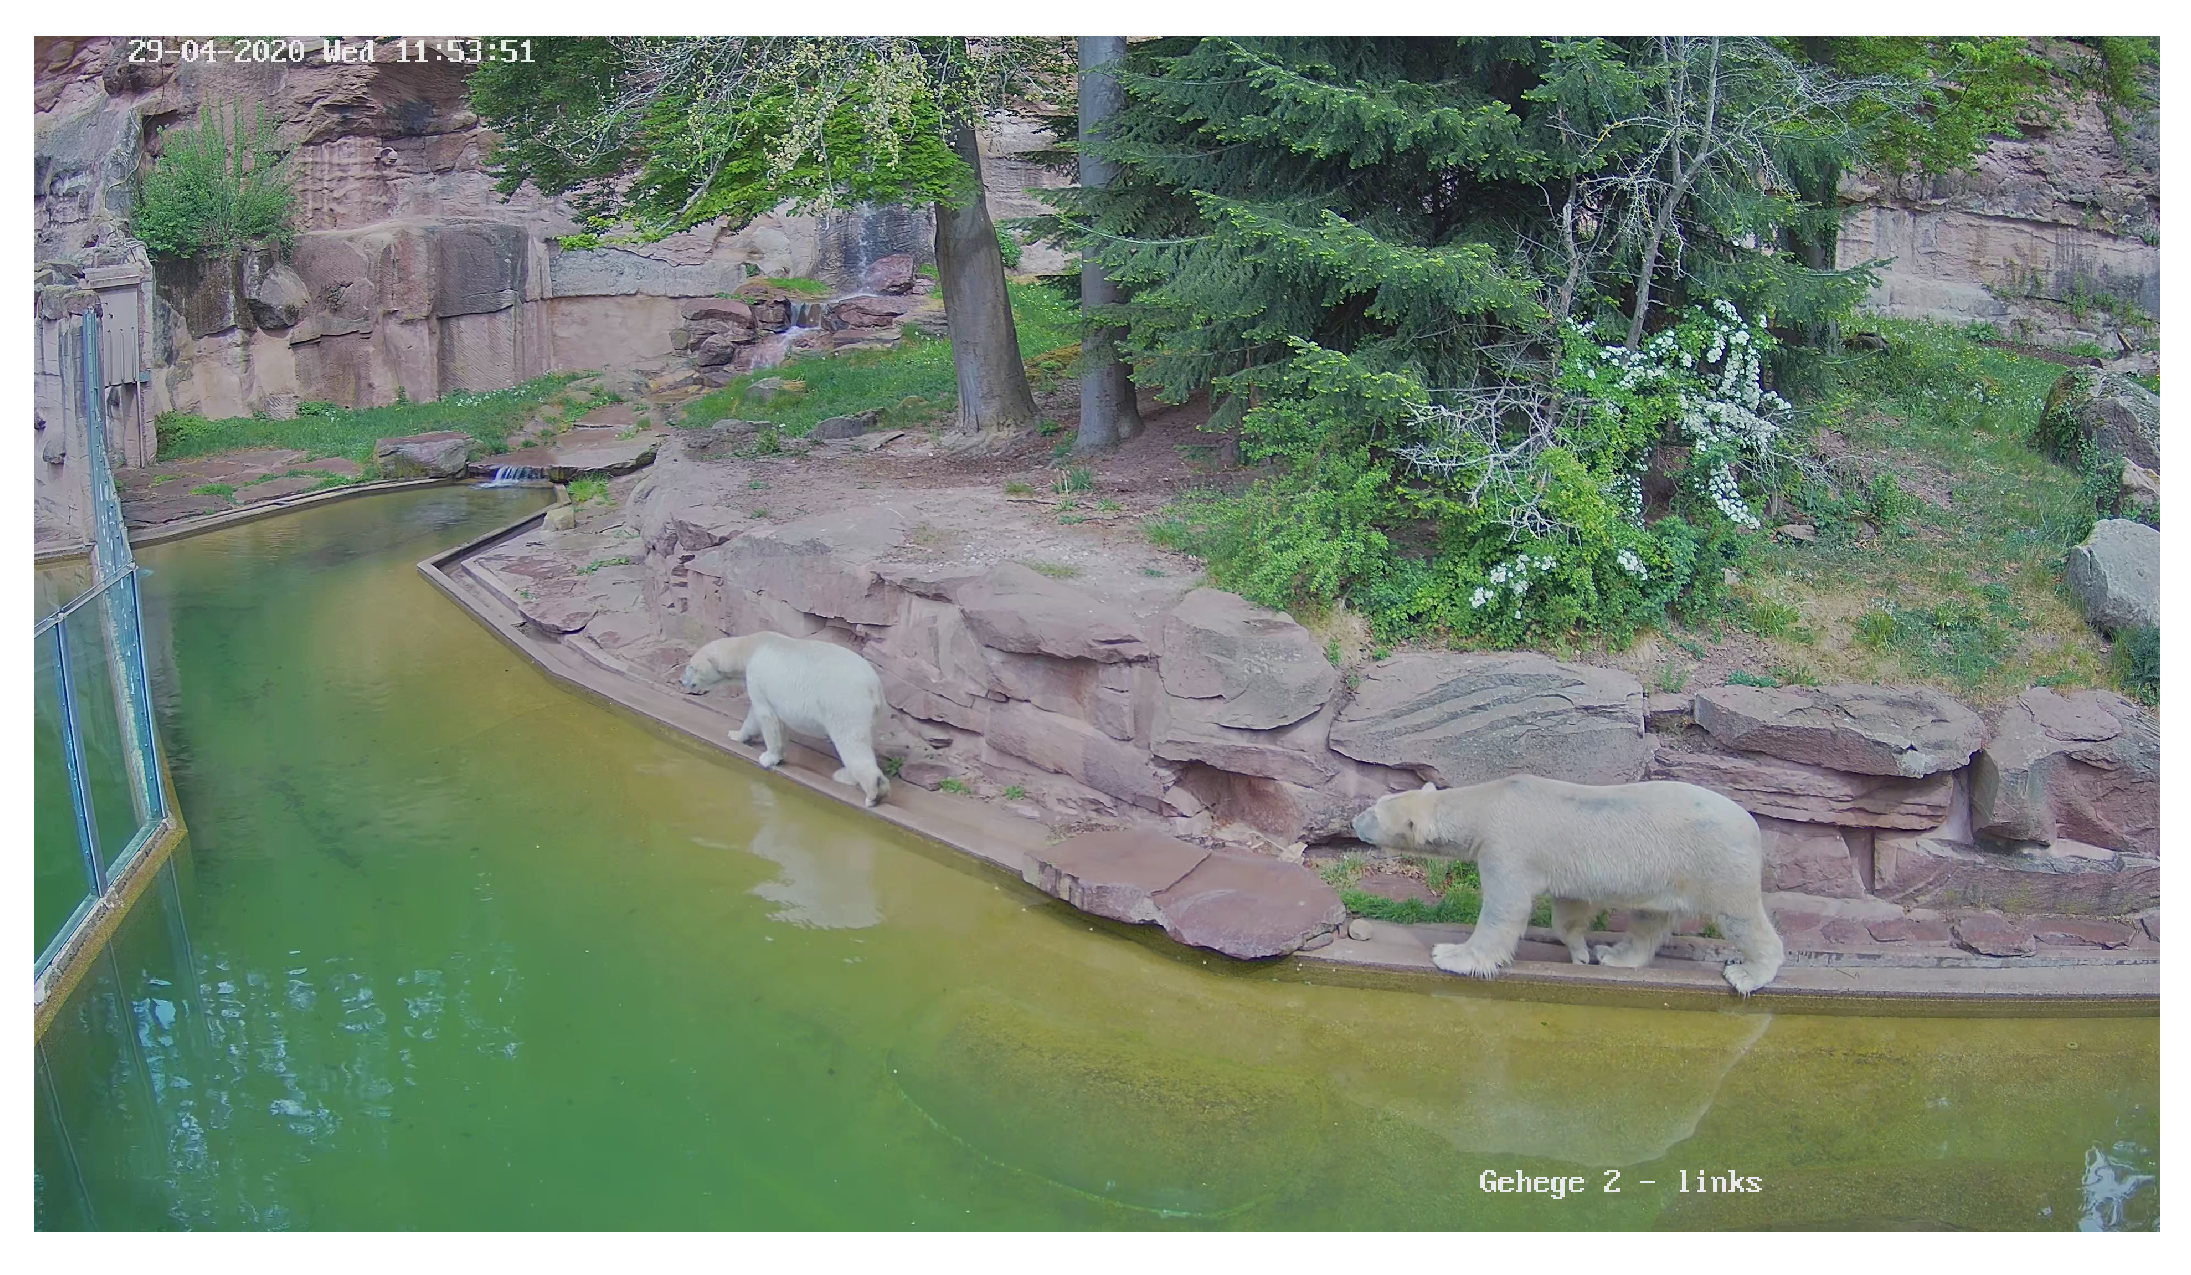
2.1. Data Collection
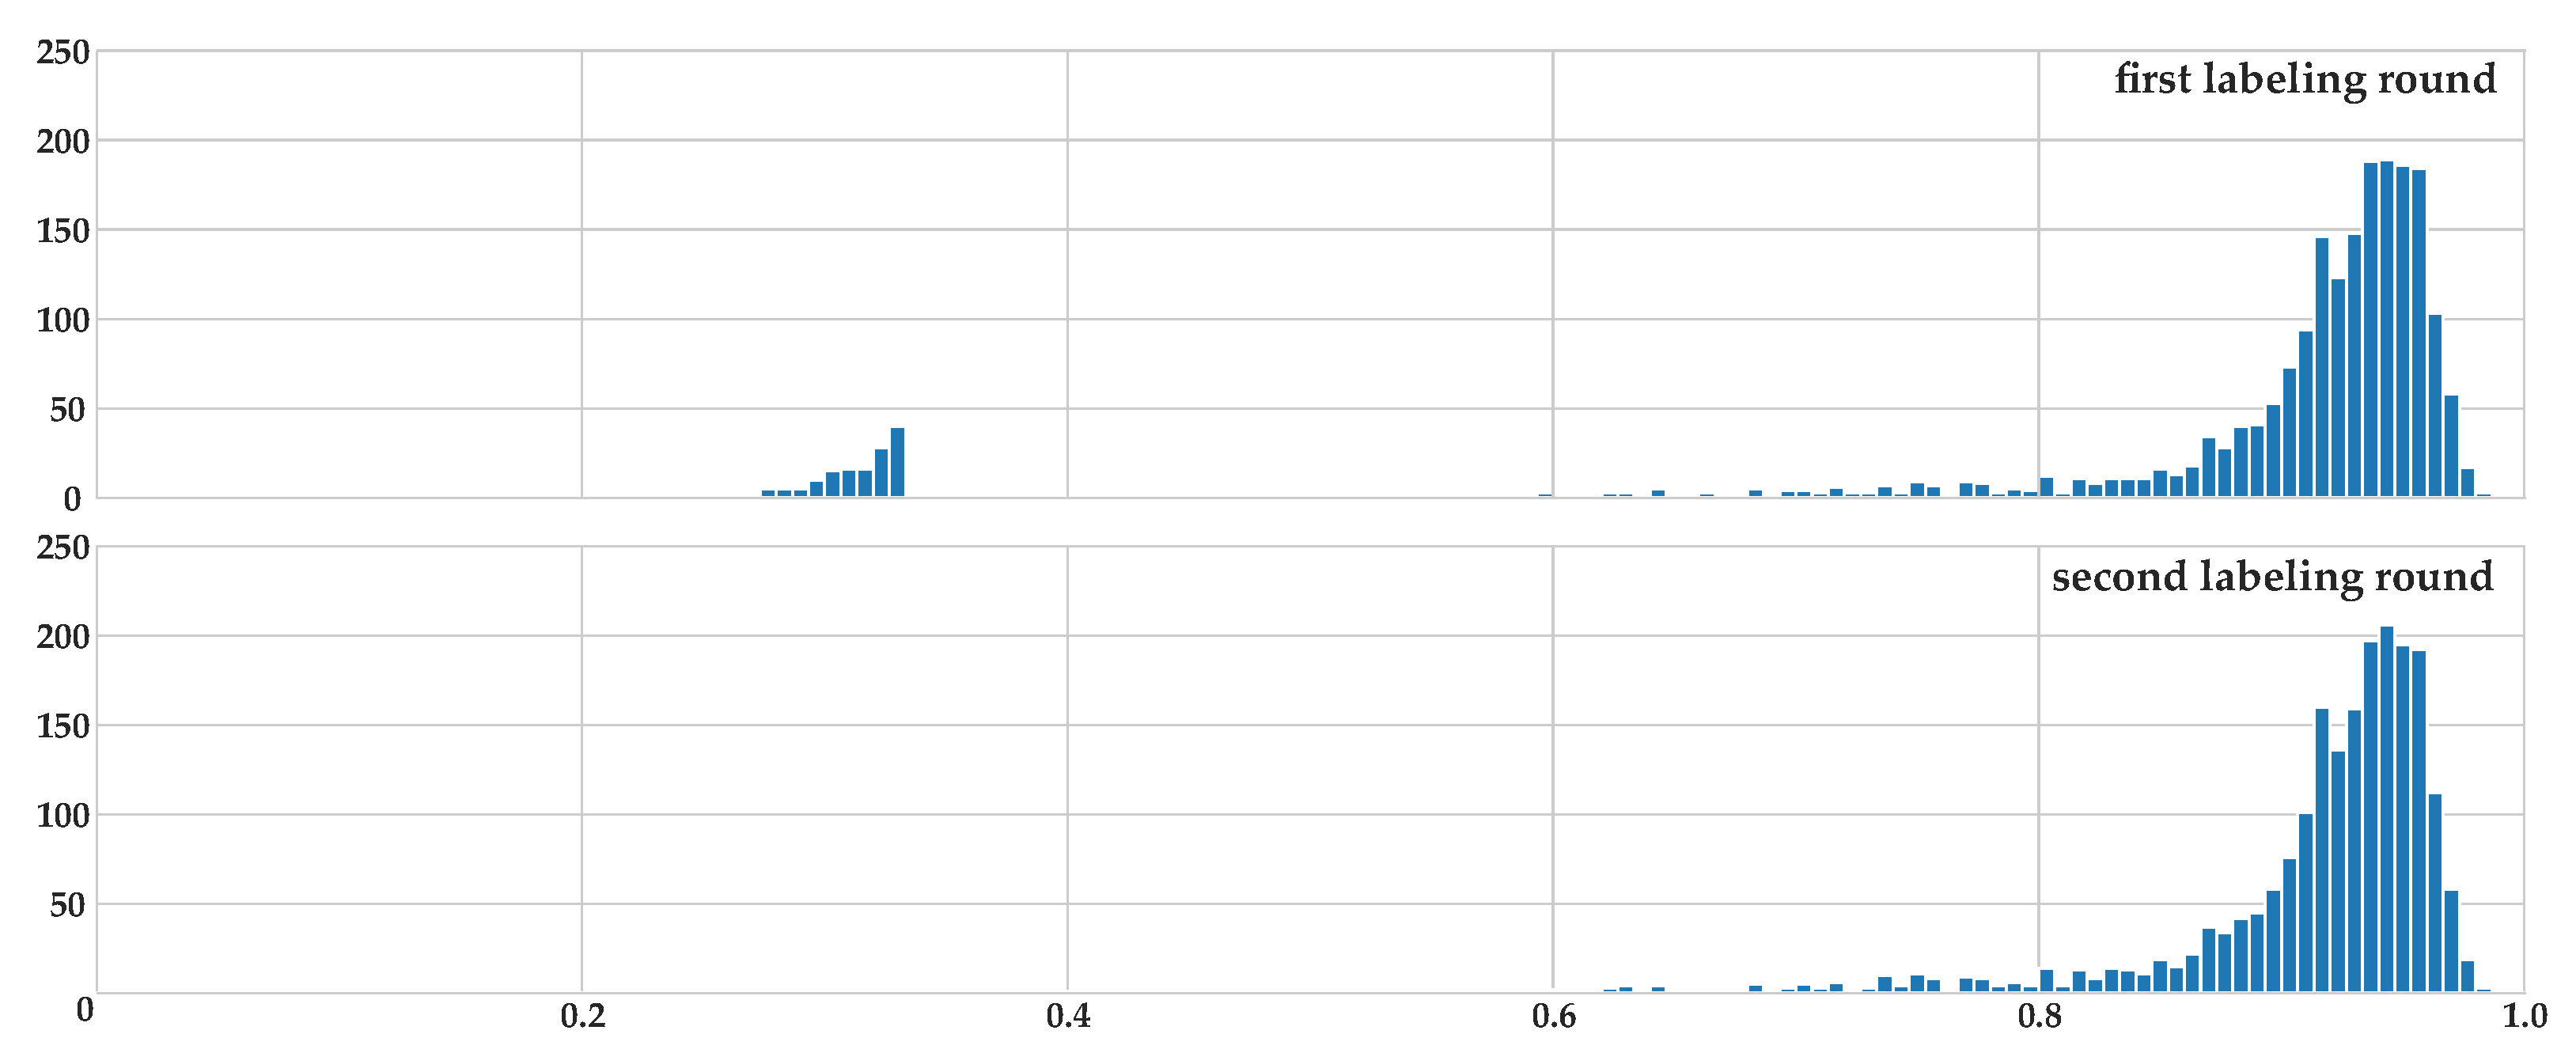
2.2. Accordance Metric for Multiple Annotators
2.3. Labeling Process
2.4. Dataset Statistics
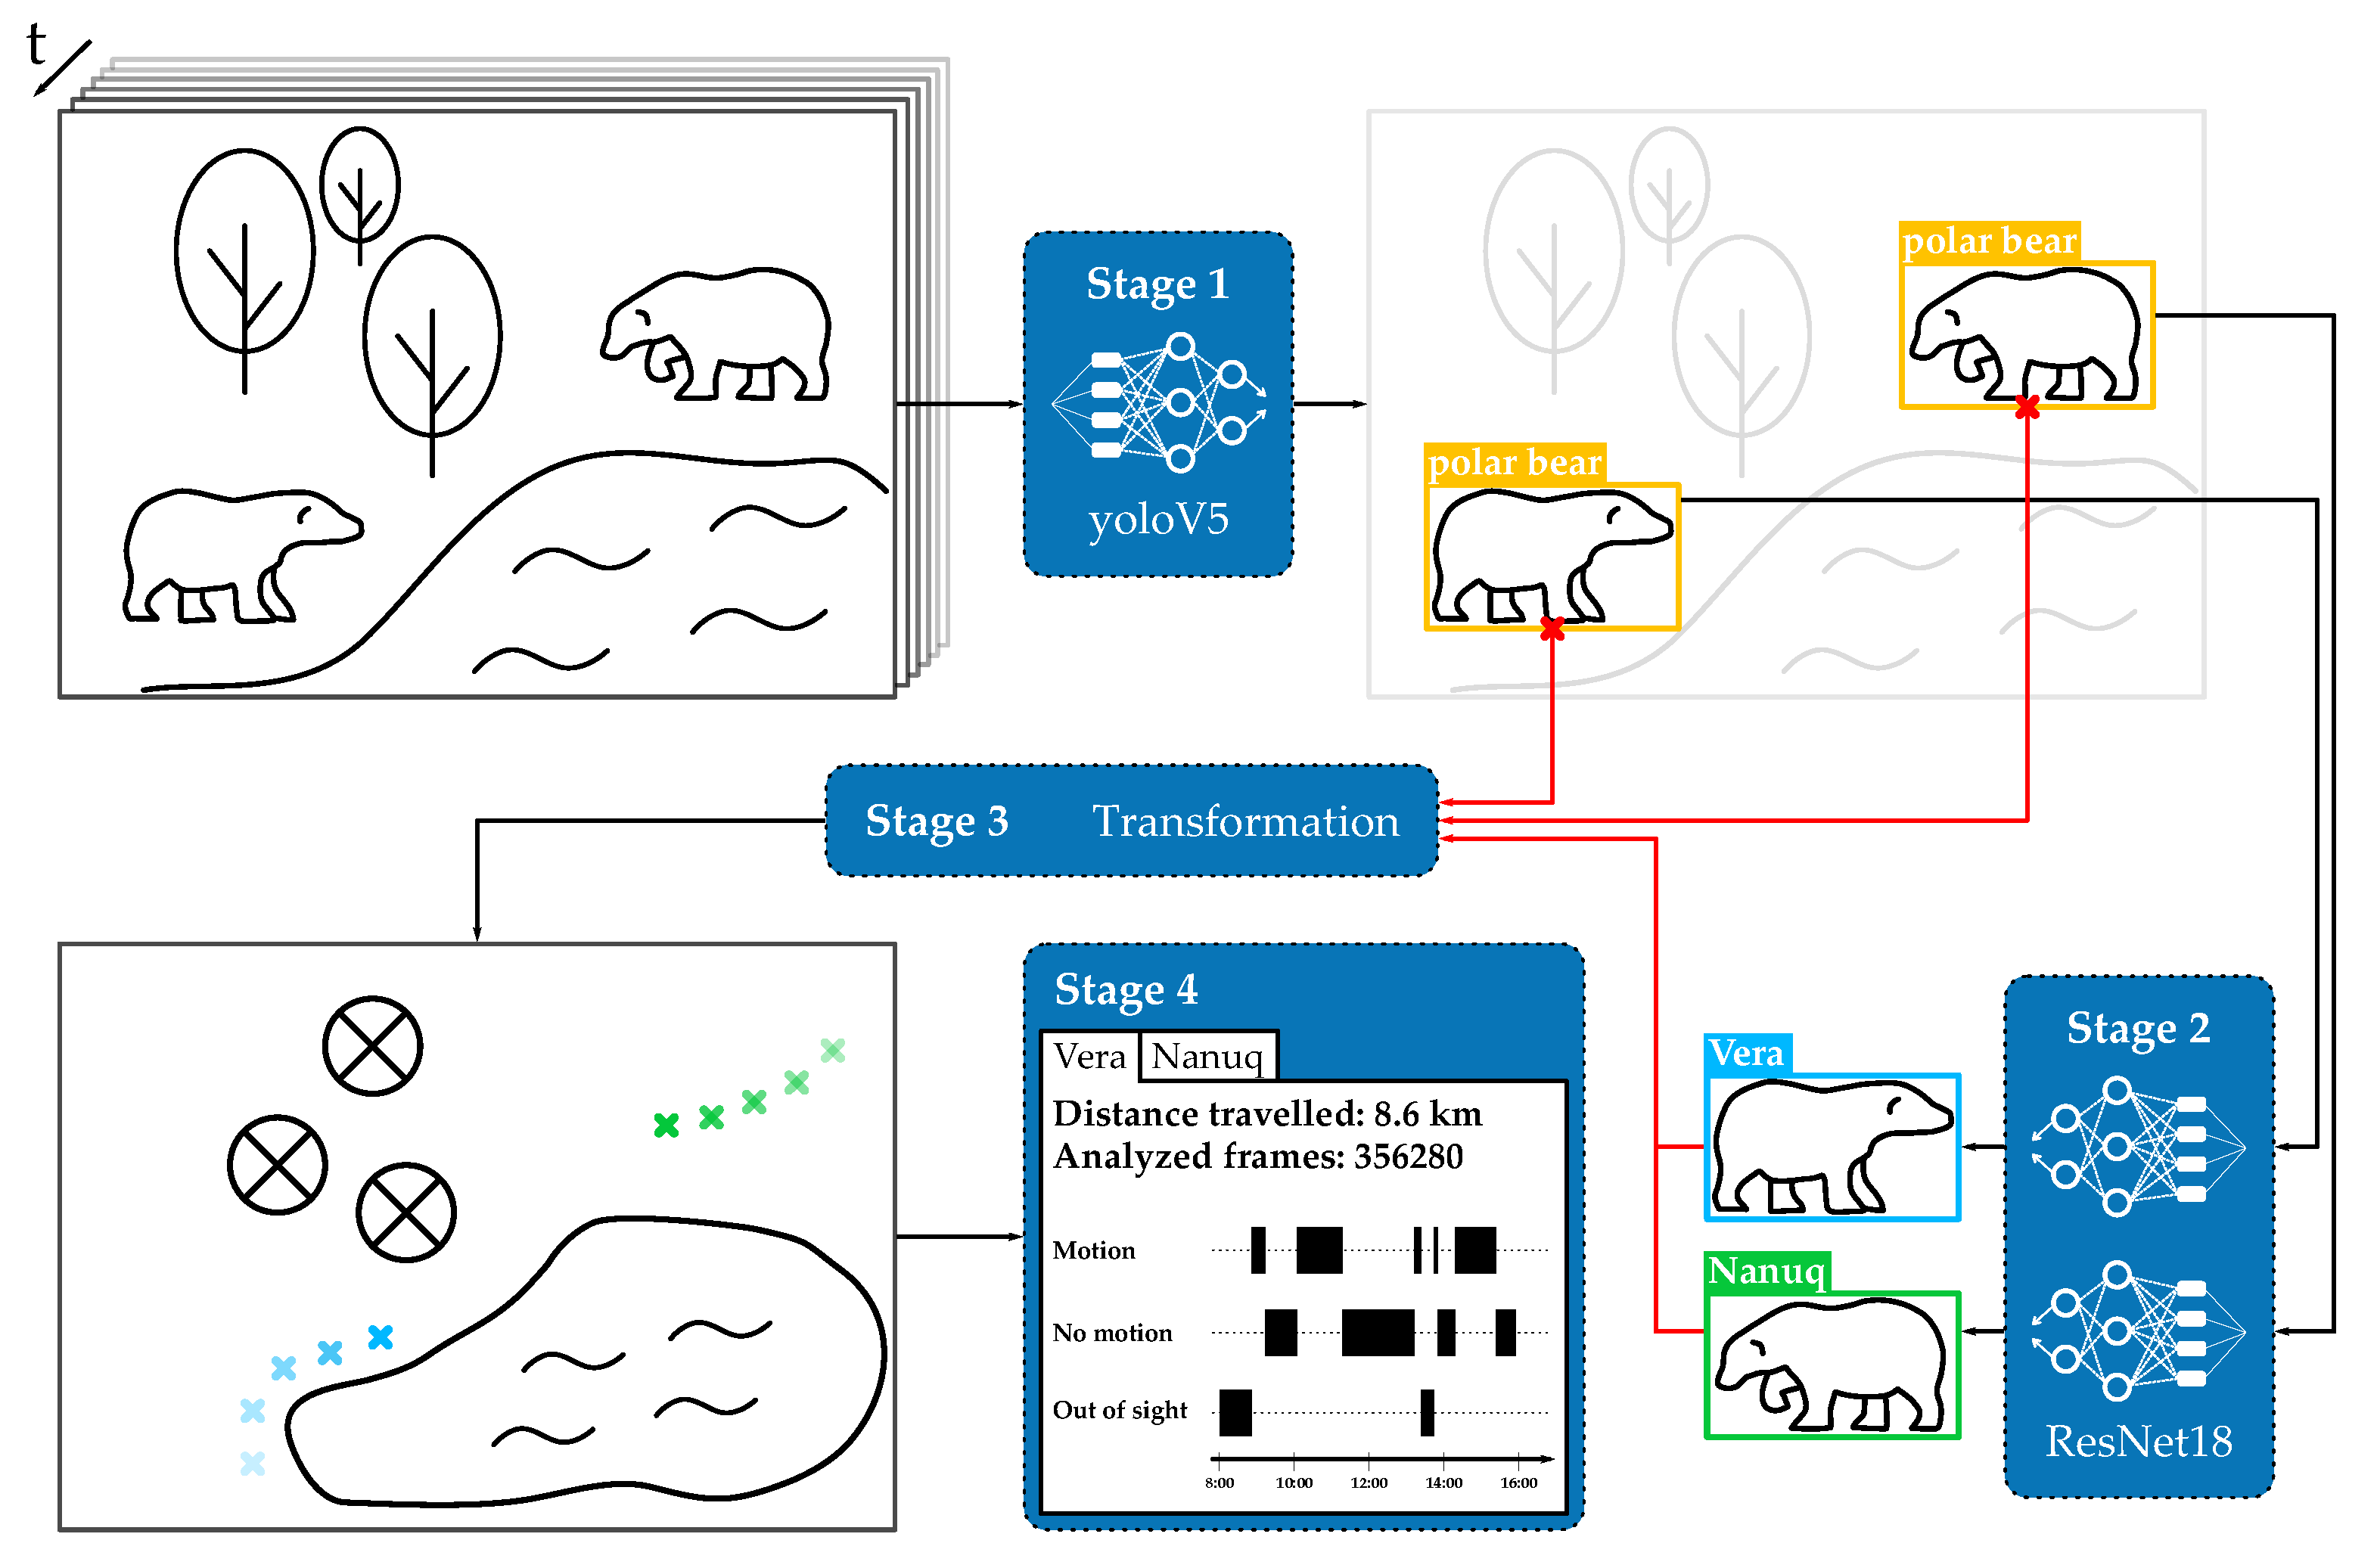
3. Framework
3.1. Stage 1: Object Detection
3.2. Stage 2: Classification
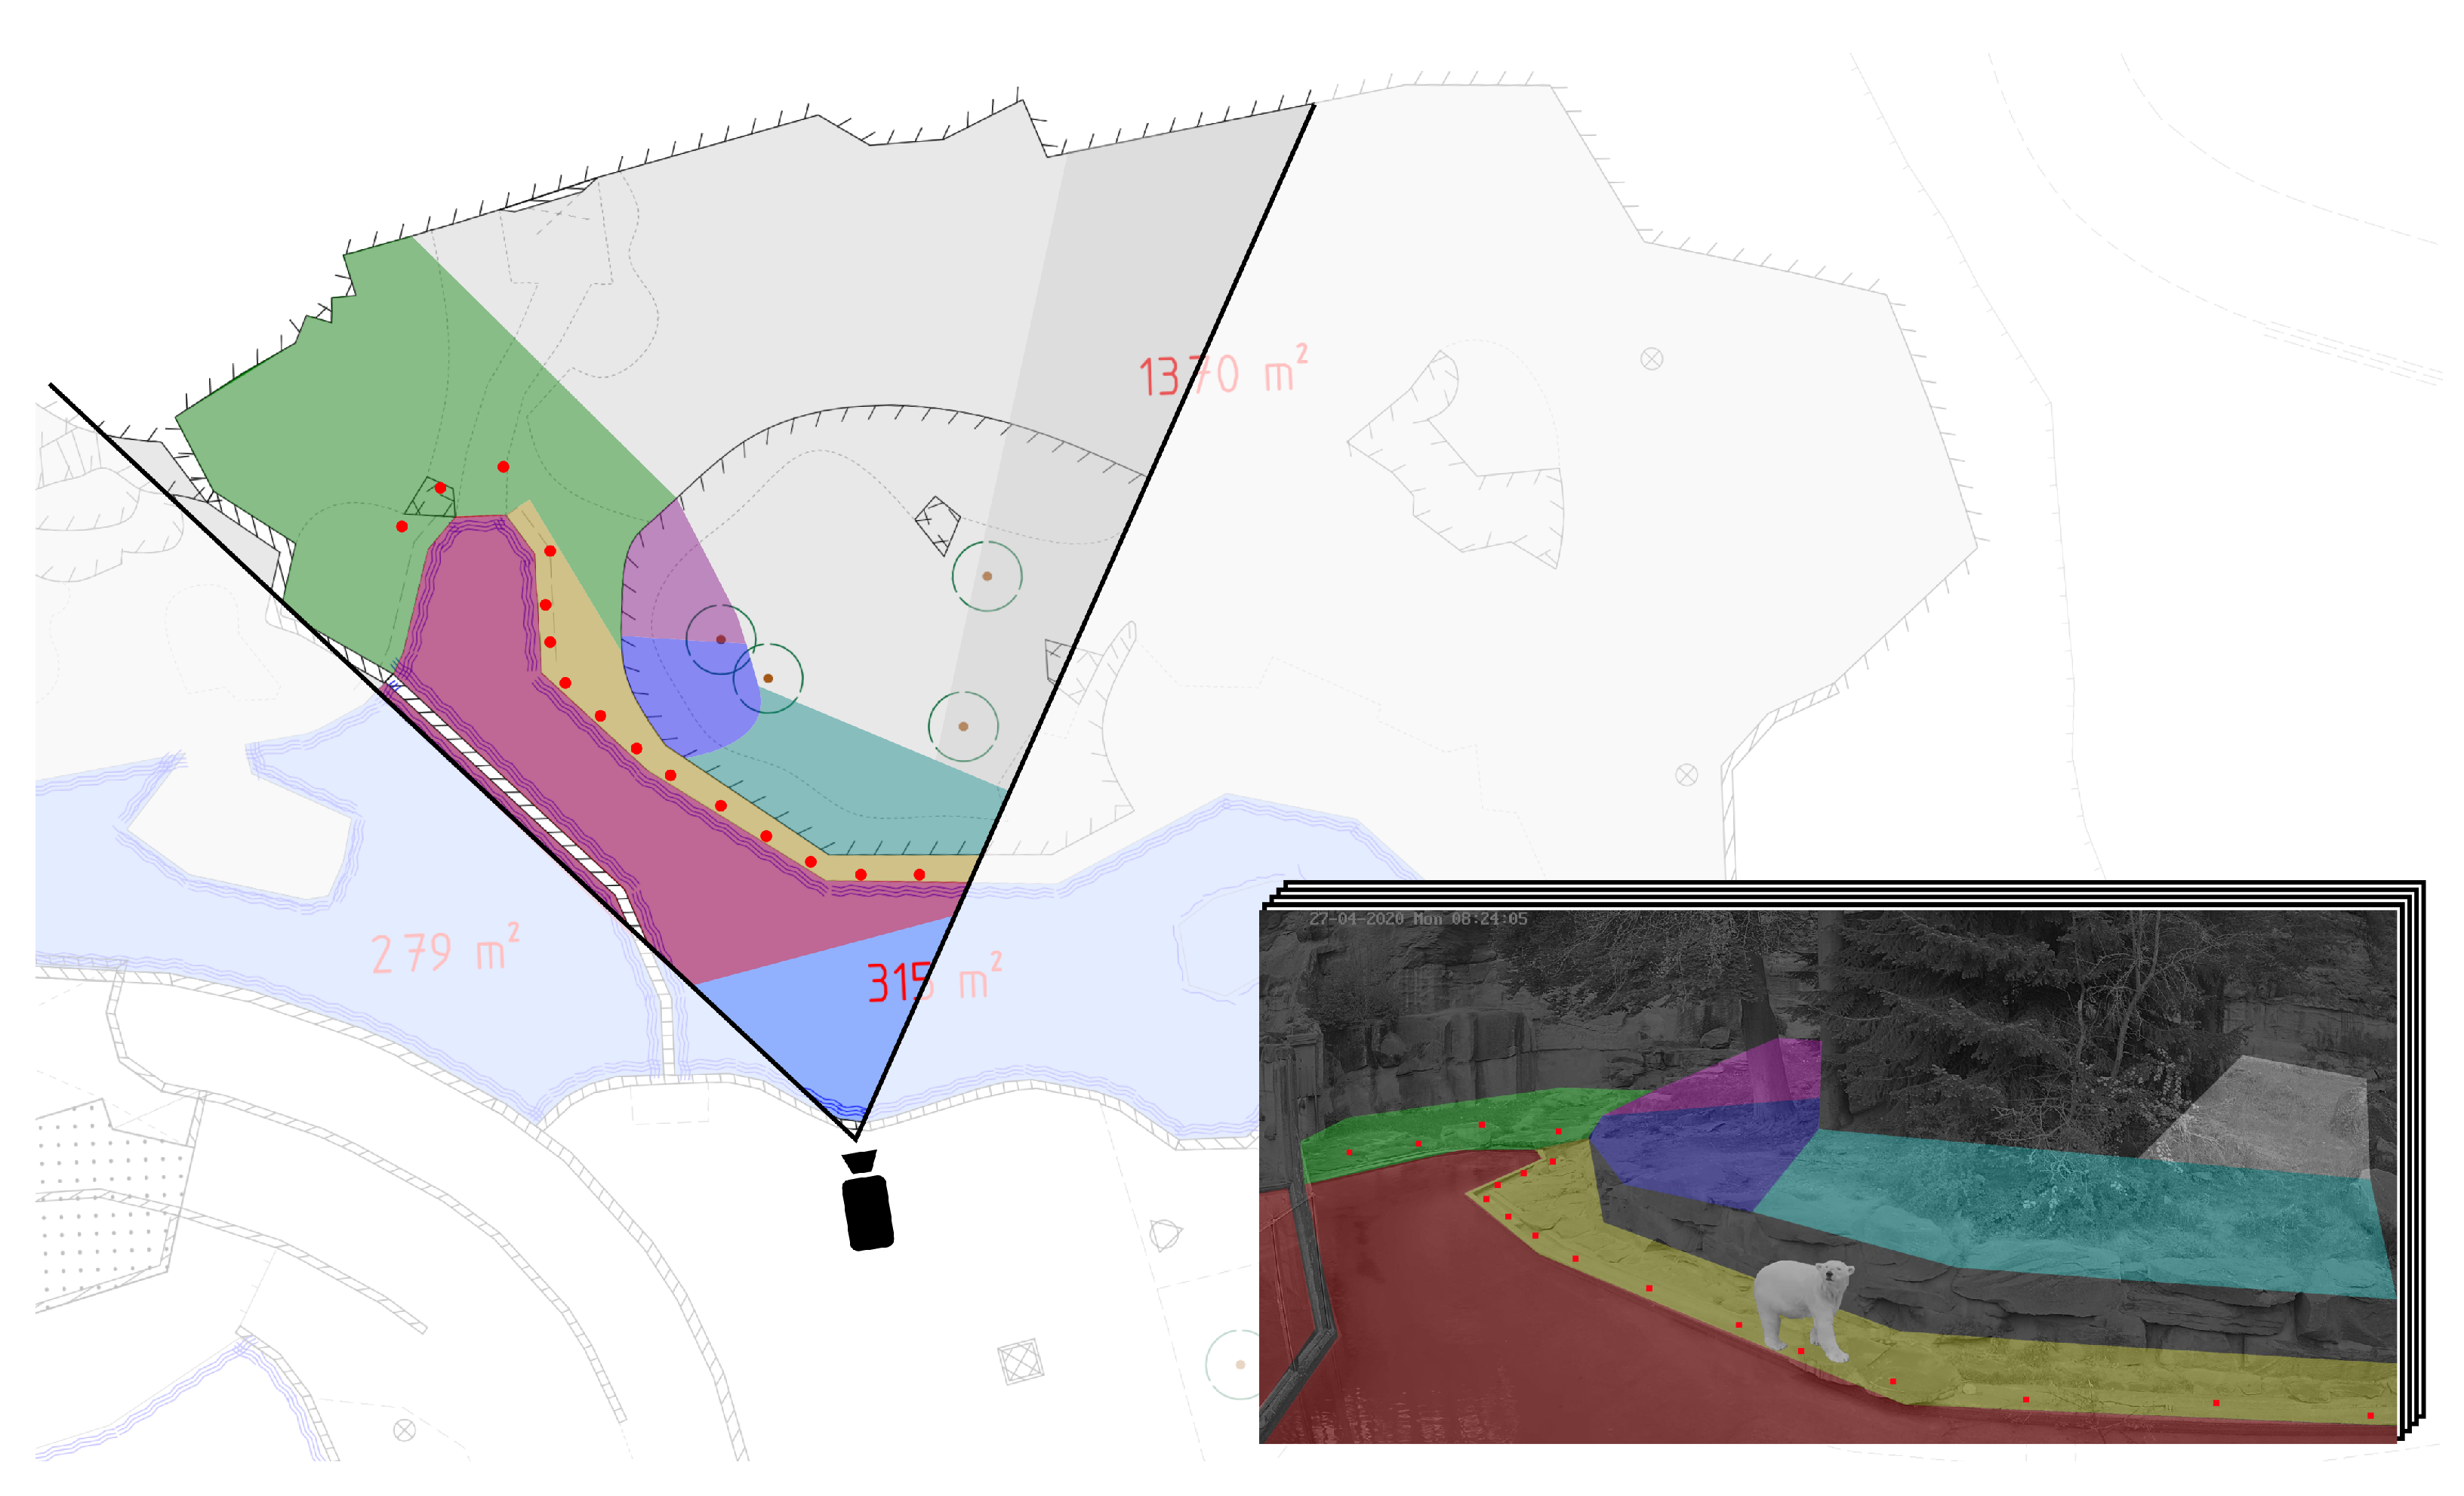
3.3. Stage 3: Coordinate Mapping
3.4. Stage 4: Analysis and Graphical User Interface
- Localization representation: the tool provides the location of the individual animals in form of heat maps or trajectories. These visualizations give insights into the frequency of a bear’s visit at a particular location, which may help identify sites of favor as well as changes in daily behavior.
- Length estimation: for the selected time frame, the tool provides the distance traveled by the individual animals. This allows for a comparison of behavioral stability and seasonality in the animals’ behavior and its reaction following management interventions, e.g., behavioral enrichment or separation of the individuals.
- Motion/Resting time: the tool aggregates motion and resting time for the individual animals. For biologists, this ratio in combination with other welfare metrics gives insight into the animals’ stress level.
4. Experiments
4.1. Object Detection and Classification
4.2. Coordinate Mapping
- The predicted bounding box of the framework differs slightly in size and position with respect to the ground truth introducing an offset in the mapped coordinates.
- Coordinate transformation via homography matrices is limited in accuracy due to the positioning of the cameras in combination with the topography of the enclosure.
5. Discussion
5.1. Object Detection and Classification
5.2. Coordinate Mapping
6. Conclusions
Author Contributions
Funding
Institutional Review Board Statement
Informed Consent Statement
Data Availability Statement
Acknowledgments
Conflicts of Interest
Abbreviations
| GUI | graphical user interface |
| IoU | Intersection over Union |
| yolo | you only look once (object detection framework) |
References
- European Union Law Council Directive 1999/22/EC of 29 March 1999 Relating to the Keeping of Wild Animals in Zoos. Available online: https://eur-lex.europa.eu/legal-content/EN/TXT/?uri=uriserv:OJ.L_.1999.094.01.0024.01.ENG (accessed on 2 January 2022).
- Association of Zoos and Aquariums Animal Welfare Committee. Available online: https://www.aza.org/animal_welfare_committee (accessed on 4 January 2022).
- Brando, S.; Buchanan-Smith, H.M. The 24/7 approach to promoting optimal welfare for captive wild animals. Behav. Process. 2018, 156, 83–95. [Google Scholar] [CrossRef]
- Maple, T.L.; Perdue, B.M. Defining Animal Welfare. In Zoo Animal Welfare; Springer: Berlin/Heidelberg, Germany, 2013; Volume 14, pp. 21–33. [Google Scholar]
- Brando, S.; Broom, D.M.; Acasuso-Rivero, C.; Clark, F. Optimal marine mammal welfare under human care: Current efforts and future directions. Behav. Process. 2018, 156, 16–36. [Google Scholar] [CrossRef]
- Clubb, R.; Vickery, S. Locomotory stereotypies in carnivores: Does pacing stem from hunting, ranging or frustrated escape? In Stereotypic Animal Behaviour. Fundamentals and Applications for Welfare, 2nd ed.; CAB International: Wallingford, UK, 2006; pp. 58–85. [Google Scholar]
- Hill, S.P.; Broom, D.M. Measuring Zoo Animal Welfare: Theory and Practice. Zoo Biol. 2009, 28, 531–544. [Google Scholar] [CrossRef]
- Whitham, J.C.; Wielebnowski, N. New directions for zoo animal welfare science. Appl. Anim. Behav. Sci. 2013, 147, 247–260. [Google Scholar] [CrossRef]
- Watters, J.V.; Krebs, B.L.; Pacheco, E. Measuring Welfare through Behavioral Observation and Adjusting It with Dynamic Environments. In Scientific Foundations of Zoos and Aquariums: Their Role in Conservation and Research; Cambridge University Press: Cambridge, UK, 2019; pp. 212–240. [Google Scholar]
- Brady, A.; McMahon, B.J.; Naulty, F. Estimates of locomotion in Asian elephants Elephas maximus using video monitoring at Dublin Zoo, Ireland. J. Zoo Aquar. Res. 2021, 9, 124–133. [Google Scholar]
- Watters, J.; Margulis, S.; Atsalis, S. Behavioral Monitoring in Zoos and Aquariums: A Tool for Guiding Husbandry and Directing Research. Zoo Biol. 2009, 28, 35–48. [Google Scholar] [CrossRef]
- Zamansky, A.; Sinitca, A.; van der Linden, D.; Kaplun, D. Automatic Animal Behavior Analysis: Opportunities for Combining Knowledge Representation with Machine Learning. Procedia Comput. Sci. 2021, 186, 661–668. [Google Scholar] [CrossRef]
- Hiby, L.; Lovell, P.; Patil, N.; Kumar, N.S.; Gopalaswamy, A.M.; Karanth, K.U. A tiger cannot change its stripes: Using a three-dimensional model to match images of living tigers and tiger skins. Biol. Lett. 2009, 5, 383–386. [Google Scholar] [CrossRef]
- Burghardt, T.; Campbell, N. Individual Animal Identification using Visual Biometrics on Deformable Coat-Patterns. In Proceedings of the International Conference on Computer Vision Systems ICVS, Bielefeld, Germany, 21–24 March 2007. [Google Scholar]
- Schneider, S.; Taylor, G.W.; Linquist, S.S.; Kremer, S.C. Past, Present, and Future Approaches Using Computer Vision for Animal Re-Identification from Camera Trap Data. Methods Ecol. Evol. 2019, 10, 461–470. [Google Scholar] [CrossRef] [Green Version]
- Kaplun, D.; Sinitca, A.; Zamansky, A.; Bleuer-Elsner, S.; Plazner, M.; Fux, A.; van der Linden, D. Animal health informatics: Towards a generic framework for automatic behavior analysis. In Proceedings of the 12th International Conference on Health Informatics, Prague, Czech Republic, 22–24 February 2019. [Google Scholar]
- Pérez-Escudero, A.; Vicente-Page, J.; Hinz, R.; Arganda, S.; de Polavieja, G.G. idTracker: Tracking individuals in a group by automatic identification of unmarked animals. Nat. Methods 2014, 11, 743–748. [Google Scholar] [CrossRef]
- Fukunaga, T.; Kubota, S.; Oda, S.; Iwasaki, W. GroupTracker: Video tracking system for multiple animals under severe occlusion. Comput. Biol. Chem. 2015, 57, 39–45. [Google Scholar] [CrossRef] [PubMed] [Green Version]
- Neethirajan, S. ChickTrack – A quantitative tracking tool for measuring chicken activity. Measurement 2022, 191, 110819. [Google Scholar] [CrossRef]
- Nakamura, T.; Matsumoto, J.; Nishimaru, H.; Bretas, R.V.; Takamura, Y.; Hori, E.; Ono, T.; Nishijo, H. A Markerless 3D Computerized Motion Capture System Incorporating a Skeleton Model for Monkeys. PLoS ONE 2016, 11, e0166154. [Google Scholar] [CrossRef] [PubMed] [Green Version]
- Swarup, P.; Chen, P.; Hou, R.; Que, P.; Liu, P.; Kong, A.W.K. Giant panda behaviour recognition using images. Glob. Ecol. Conserv. 2021, 26, 2351–9894. [Google Scholar] [CrossRef]
- Mathis, A.; Mamidanna, P.; Cury, K.M.; Abe, T.; Murthy, V.N.; Mathis, M.W.; Bethge, M. DeepLabCut: Markerless pose estimation of user-defined body parts with deep learning. Nat. Neurosci. 2018, 21, 1281–1289. [Google Scholar] [CrossRef]
- Nilsson, M.; Herlin, A.H.; Ardö, H.; Guzhva, O.; Åström, K.; Bergsten, C. Development of automatic surveillance of animal behaviour and welfare using image analysis and machine learned segmentation technique. Animal 2015, 9, 1859–1865. [Google Scholar] [CrossRef] [Green Version]
- Kashiha, M.; Bahr, C.; Ott, S.; Moons, C.; Niewold, T.; Tuyttens, F.; Berckmans, D. Automatic monitoring of pig locomotion using image analysis. Livest. Sci. 2014, 159, 141–148. [Google Scholar] [CrossRef]
- Diana, A.; Salas, M.; Pereboom, Z.; Mendl, M.; Norton, T. A Systematic Review of the Use of Technology to Monitor Welfare in Zoo Animals: Is there Space for Improvement? Animals 2021, 11, 3048. [Google Scholar] [CrossRef]
- Clubb, R.; Mason, G. Natural behavioural biology as a risk factor in carnivore welfare: How analyzing species differences could help zoos improve enclosures. J. Appl. Anim. Behav. Sci. 2007, 10, 303–328. [Google Scholar] [CrossRef] [Green Version]
- Skovlund, C.R.; Kirchner, M.; Wossner Moos, L.; Alsted, N.; Manteca, X.; Tallo-Parra, O.; Stelvig, M.; Forkman, B. A critical review of animal-based welfare indicators for polar bears (Ursus maritimus) in zoos: Identification and evidence of validity: Welfare indicators for polar bears in zoos. Anim. Welf. 2021, 30, 1–18. [Google Scholar] [CrossRef]
- Jaccard, P. Lois de distribution florale dans la zone alpine. Bull. Soc. Vaudoise Sci. Nat. 1902, 38, 69–130. [Google Scholar]
- Cheng, B.; Girshick, R.; Dollar, P.; Berg, A.C.; Kirillov, A. Boundary IoU: Improving Object-Centric Image Segmentation Evaluation. In Proceedings of the IEEE/CVF Conference on Computer Vision and Pattern Recognition (CVPR), Nashville, TN, USA, 19–25 June 2021; pp. 15334–15342. [Google Scholar]
- Zhou, D.; Fang, J.; Song, X.; Guan, C.; Yin, J.; Dai, Y.; Yang, R. IoU Loss for 2D/3D Object Detection. In Proceedings of the International Conference on 3D Vision (3DV), Québec City, QC, Canada, 9–16 September 2019; pp. 85–94. [Google Scholar]
- Marzahl, C.; Aubreville, M.; Bertram, C.A.; Maier, J.; Bergler, C.; Kröger, C.; Voigt, J.; Klopfleisch, R.; Maier, A. EXACT: A collaboration toolset for algorithm-aided annotation of images with annotation version control. Sci. Rep. 2021, 11, 4343. [Google Scholar] [CrossRef] [PubMed]
- Zhao, Z.; Zheng, P.; Xu, S.; Wu, X. Object Detection With Deep Learning: A Review. Trans. Neural Networks Learn. Syst. 2019, 30, 3212–3232. [Google Scholar] [CrossRef] [PubMed] [Green Version]
- Redmon, J.; Divvala, S.; Girshick, R.; Farhadi, A. You Only Look Once: Unified, Real-Time Object Detection. In Proceedings of the IEEE Conference on Computer Vision and Pattern Recognition, Las Vegas, NV, USA, 26 June–1 July 2016. [Google Scholar]
- YOLOv5. Available online: https://github.com/ultralytics/yolov5 (accessed on 24 January 2022).
- He, K.; Zhang, X.; Ren, S.; Sun, J. Deep Residual Learning for Image Recognition. In Proceedings of the IEEE Conference on Computer Vision and Pattern Recognition (CVPR), Las Vegas, NV, USA, 27–30 June 2016; pp. 770–778. [Google Scholar]
- Sandler, M.; Howard, A.; Zhu, M.; Zhmoginov, A.; Chen, L. MobileNetV2: Inverted Residuals and Linear Bottlenecks. In Proceedings of the IEEE Conference on Computer Vision and Pattern Recognition (CVPR), Salt Lake City, UT, USA, 18–22 June 2018. [Google Scholar]
- Xie, S.; Girshick, R.; Dollár, P.; Tu, Z.; He, K. Aggregated Residual Transformations for Deep Neural Networks. In Proceedings of the IEEE Conference on Computer Vision and Pattern Recognition (CVPR), Honolulu, HI, USA, 21–26 July 2017. [Google Scholar]
- Huang, G.; Liu, Z.; van der Maaten, L.; Weinberger, K.Q. Densely Connected Convolutional Networks. In Proceedings of the IEEE Conference on Computer Vision and Pattern Recognition (CVPR), Honolulu, HI, USA, 21–26 July 2017. [Google Scholar]
- DeMaster, D.P.; Stirling, I. Ursus maritimus. Mamm. Species 1981, 145, 1–7. [Google Scholar] [CrossRef] [Green Version]
- Hein, A.; Baumgartner, K.; von Fersen, L.; Bechshoft, T.; Woelfing, B.; Kirschbaum, C.; Mastromonaco, G.; Greenwood, A.; Siebert, U. Analysis of hair steroid hormones in polar bears (Ursus maritimus) via liquid chromatography–tandem mass spectrometry: Comparison with two immunoassays and application for longitudinal monitoring in zoos. Gen. Comp. Endocrinol. 2021, 310, 113837. [Google Scholar] [CrossRef] [PubMed]


| Framework | (a) | (b) | (c) | Output |
|---|---|---|---|---|
| Unspecific | ID | Zoo | ||
| ChickTrack [19] | ✓ | ✗ | ✓ | locomotion |
| Nakamura et al. [20] | ✗ | ✗ | ✗ | pose estimation |
| Swarup et al. [21] | ✗ | ✗ | ✓ | activity recognition |
| DeepLabCut [22] | ✓ | ✗ | ✗ | pose estimation |
| Nilsson et al. [23] | ✓ | ✗ | ✗ | count |
| Kashiha et al. [24] | ✓ | ✗ | ✗ | locomotion |
| Blyzer [16] | ✓ | ✗ | ✗ | trajectory |
| idTracker [17] | ✓ | ✓ | ✗ | trajectory |
| GroupTracker [18] | ✓ | ✓ | ✗ | trajectory |
| Our Framework | ✓ | ✓ | ✓ | trajectory |
| Day | Total | |||||
|---|---|---|---|---|---|---|
| 1 | 2 | 3 | 4 | 5 | ||
| Images | 900 | 850 | 950 | 700 | 1050 | 4450 |
| Non-empty images | 477 | 419 | 406 | 383 | 414 | 2099 |
| Metric | Fold | |||||
|---|---|---|---|---|---|---|
| 1 | 2 | 3 | 4 | 5 | Overall | |
| F1 @0.25 IoU | 0.961 | 0.943 | 0.948 | 0.950 | 0.906 | 0.942 ± 0.022 |
| F1 @0.50 IoU | 0.961 | 0.940 | 0.944 | 0.947 | 0.897 | 0.938 ± 0.024 |
| F1 @0.75 IoU | 0.942 | 0.900 | 0.908 | 0.906 | 0.839 | 0.899 ± 0.035 |
| F1 @0.95 IoU | 0.194 | 0.225 | 0.232 | 0.338 | 0.146 | 0.227 ± 0.075 |
| Mean IoU | 0.824 | 0.786 | 0.794 | 0.807 | 0.709 | 0.784 ± 0.044 |
| Architecture | F1 Score | IT [ms] | |||||
|---|---|---|---|---|---|---|---|
| 1 | 2 | 3 | 4 | 5 | Overall | ||
| ResNet18 [35] | 0.971 | 0.961 | 0.882 | 0.892 | 0.865 | 0.914 ± 0.059 | 3.7 |
| ResNet50 [35] | 0.956 | 0.944 | 0.890 | 0.846 | 0.796 | 0.886 ± 0.076 | 8.4 |
| ResNet101 [35] | 0.908 | 0.902 | 0.812 | 0.838 | 0.698 | 0.832 ± 0.093 | 15.5 |
| MobileNetV2 [36] | 0.972 | 0.963 | 0.894 | 0.850 | 0.888 | 0.914 ± 0.052 | 7.4 |
| ResNeXt50 [37] | 0.968 | 0.921 | 0.857 | 0.841 | 0.831 | 0.884 ± 0.079 | 12.3 |
| DenseNet121 [38] | 0.949 | 0.936 | 0.868 | 0.923 | 0.863 | 0.908 ± 0.053 | 20.0 |
| Experiment | IoU Threshold | Precision | Recall | F1 Score | ||
|---|---|---|---|---|---|---|
| Vera | Nanuq | w. a. | ||||
| 3 | 0.50 | 0.920 | 0.832 | 0.900 | 0.842 | 0.864 |
| 0.75 | 0.920 | 0.786 | 0.882 | 0.808 | 0.844 | |
| 4 | 0.50 | 0.908 | 0.780 | 0.874 | 0.800 | 0.836 |
| 0.75 | 0.910 | 0.728 | 0.856 | 0.748 | 0.804 | |
Publisher’s Note: MDPI stays neutral with regard to jurisdictional claims in published maps and institutional affiliations. |
© 2022 by the authors. Licensee MDPI, Basel, Switzerland. This article is an open access article distributed under the terms and conditions of the Creative Commons Attribution (CC BY) license (https://creativecommons.org/licenses/by/4.0/).
Share and Cite
Zuerl, M.; Stoll, P.; Brehm, I.; Raab, R.; Zanca, D.; Kabri, S.; Happold, J.; Nille, H.; Prechtel, K.; Wuensch, S.; et al. Automated Video-Based Analysis Framework for Behavior Monitoring of Individual Animals in Zoos Using Deep Learning—A Study on Polar Bears. Animals 2022, 12, 692. https://doi.org/10.3390/ani12060692
Zuerl M, Stoll P, Brehm I, Raab R, Zanca D, Kabri S, Happold J, Nille H, Prechtel K, Wuensch S, et al. Automated Video-Based Analysis Framework for Behavior Monitoring of Individual Animals in Zoos Using Deep Learning—A Study on Polar Bears. Animals. 2022; 12(6):692. https://doi.org/10.3390/ani12060692
Chicago/Turabian StyleZuerl, Matthias, Philip Stoll, Ingrid Brehm, René Raab, Dario Zanca, Samira Kabri, Johanna Happold, Heiko Nille, Katharina Prechtel, Sophie Wuensch, and et al. 2022. "Automated Video-Based Analysis Framework for Behavior Monitoring of Individual Animals in Zoos Using Deep Learning—A Study on Polar Bears" Animals 12, no. 6: 692. https://doi.org/10.3390/ani12060692
APA StyleZuerl, M., Stoll, P., Brehm, I., Raab, R., Zanca, D., Kabri, S., Happold, J., Nille, H., Prechtel, K., Wuensch, S., Krause, M., Seegerer, S., von Fersen, L., & Eskofier, B. (2022). Automated Video-Based Analysis Framework for Behavior Monitoring of Individual Animals in Zoos Using Deep Learning—A Study on Polar Bears. Animals, 12(6), 692. https://doi.org/10.3390/ani12060692


