
Reliability of a White Striping Scoring System and Description of White Striping Prevalence in Purebred Turkey Lines

 , , , , and
Abstract
:Simple Summary
Abstract
1. Introduction
2. Materials and Methods
2.1. Animals
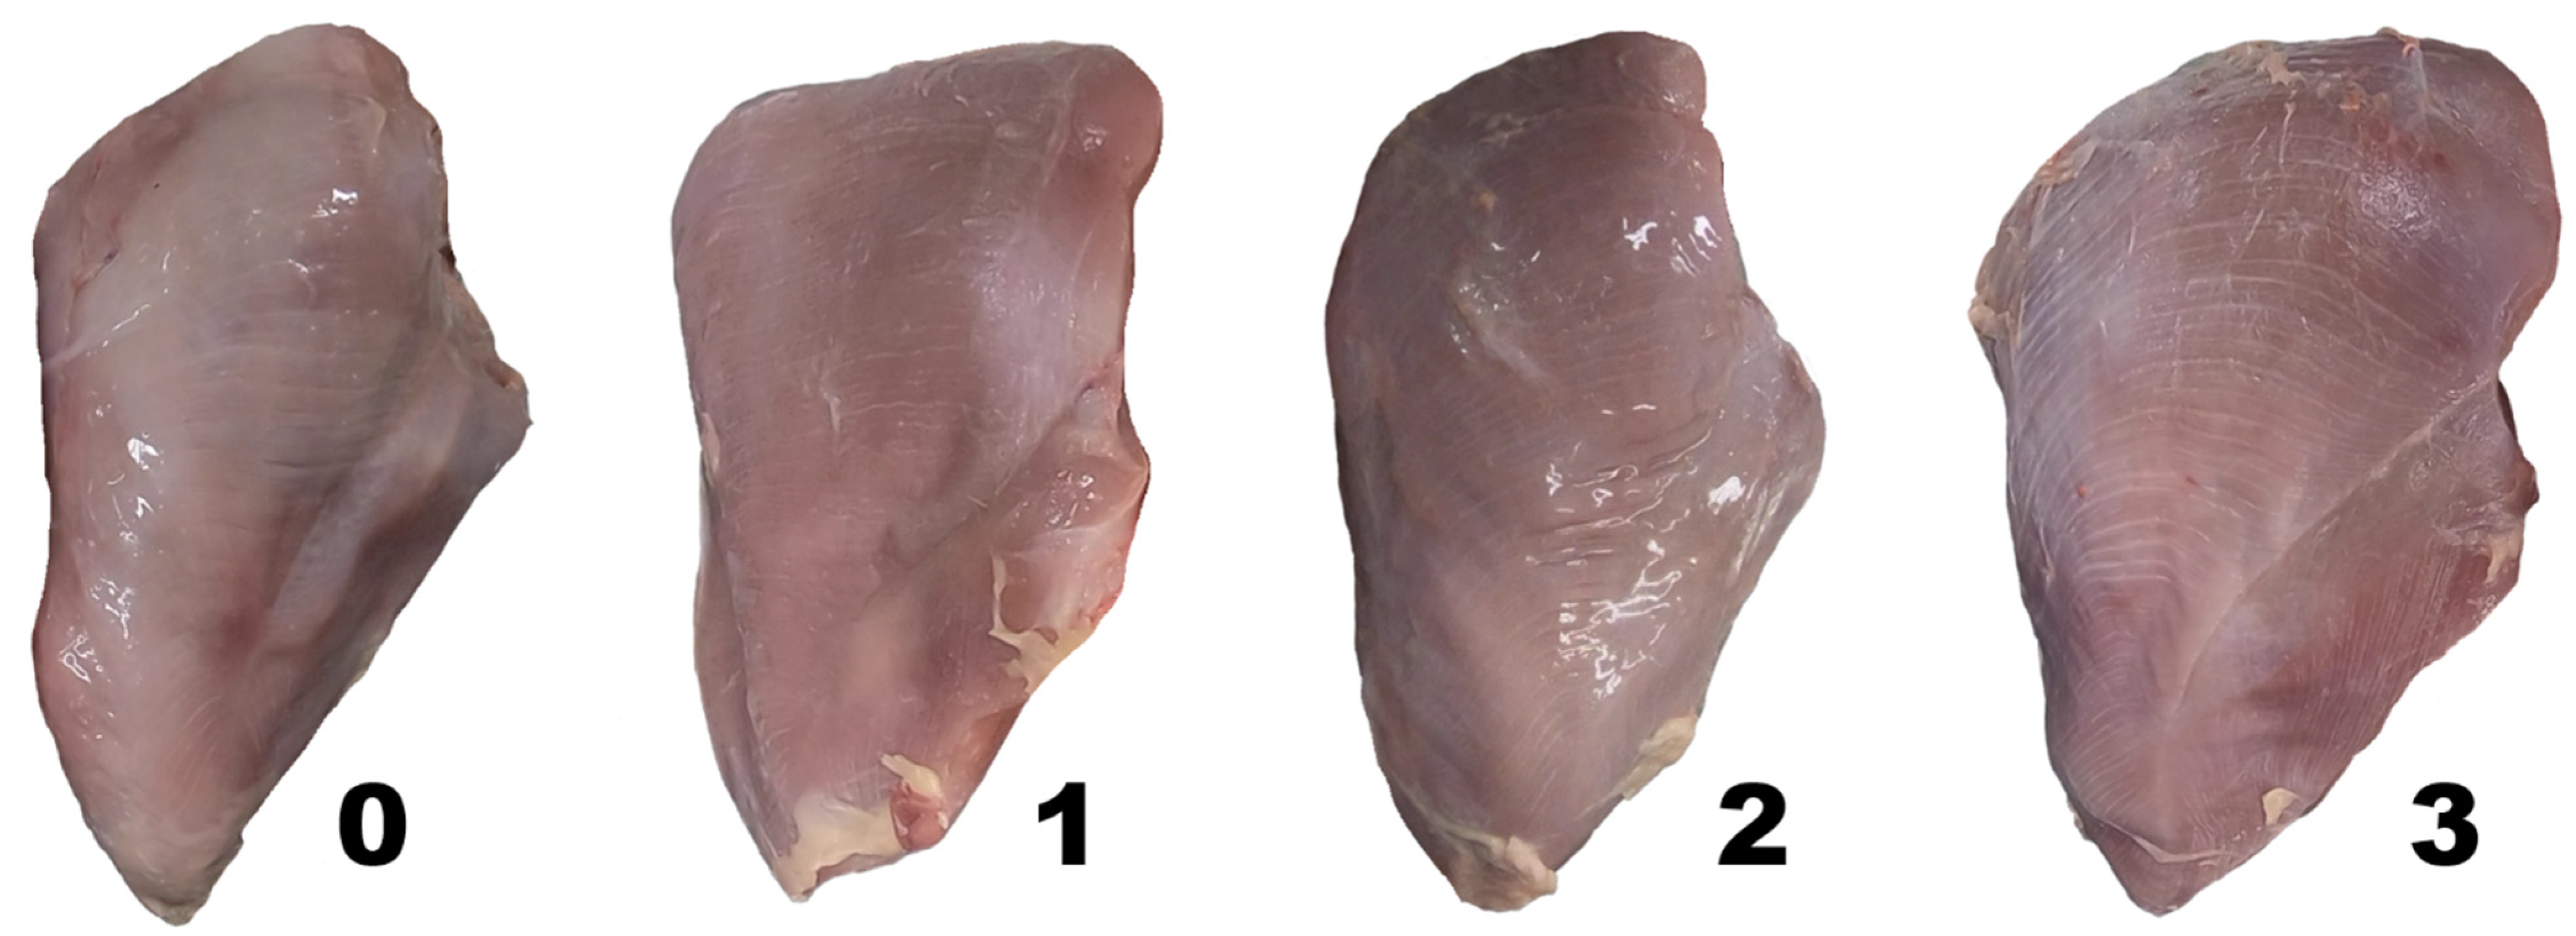
2.2. Scoring System
2.3. Scoring Evaluation
2.4. Reliability Analysis
2.5. White Striping Prevalence and Association with Production Traits
3. Results
3.1. Intra-Observer Reliability
3.2. Inter-Observer Reliability
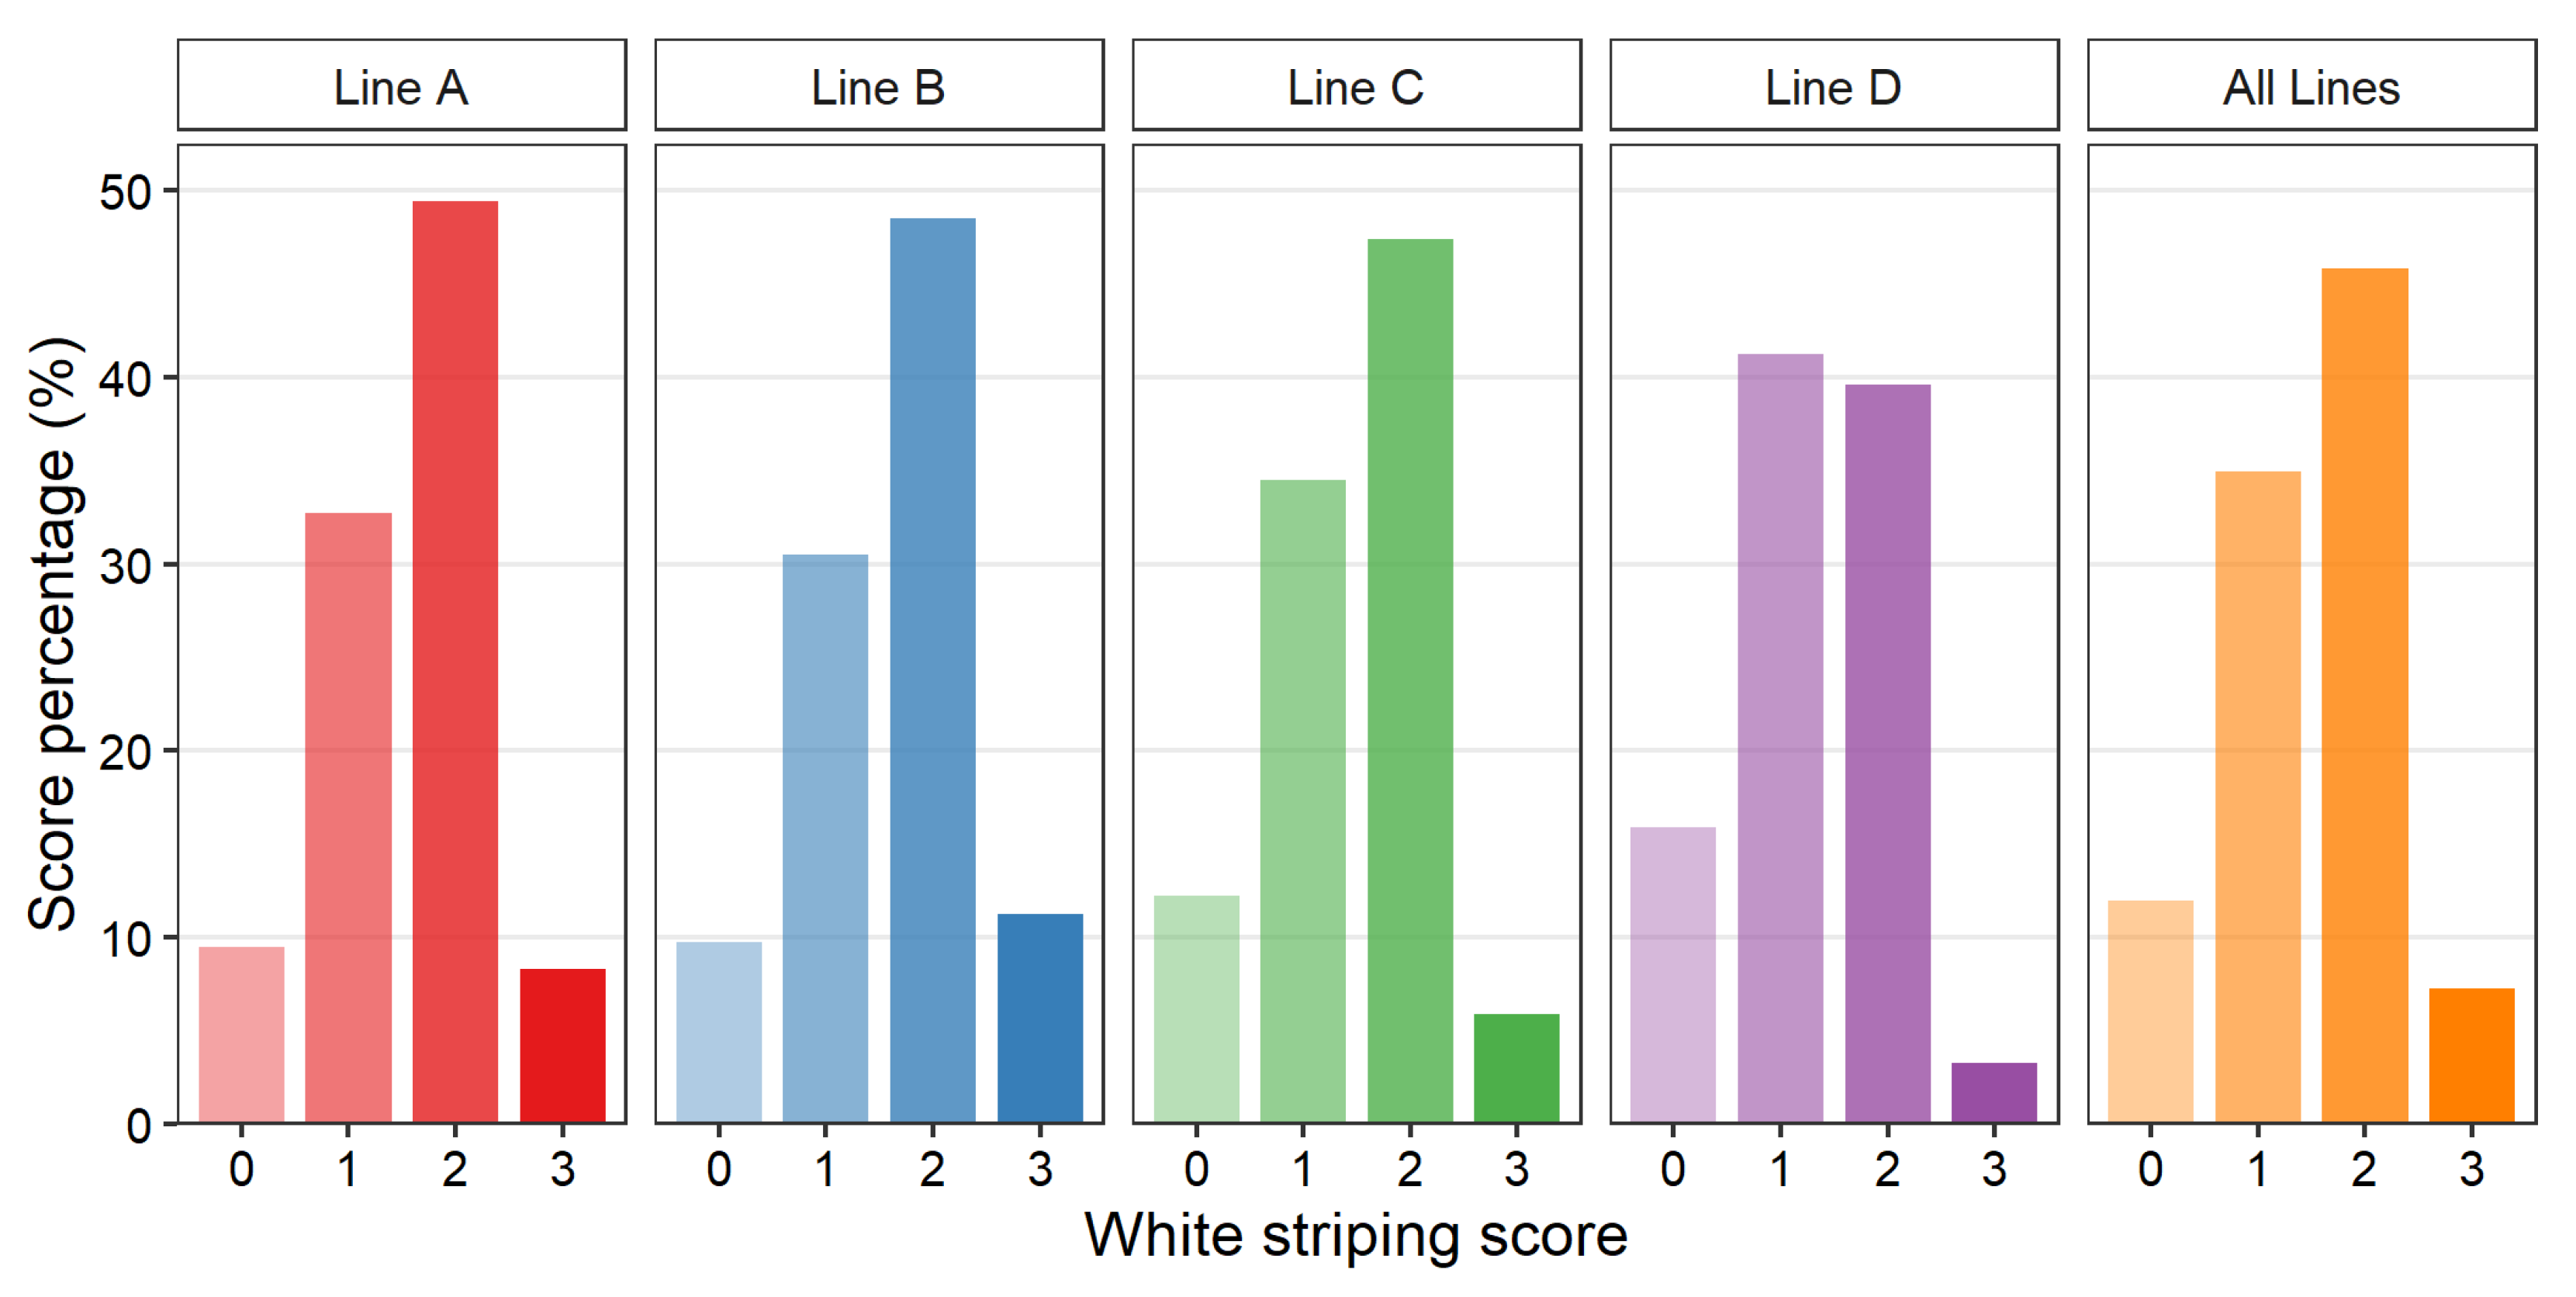
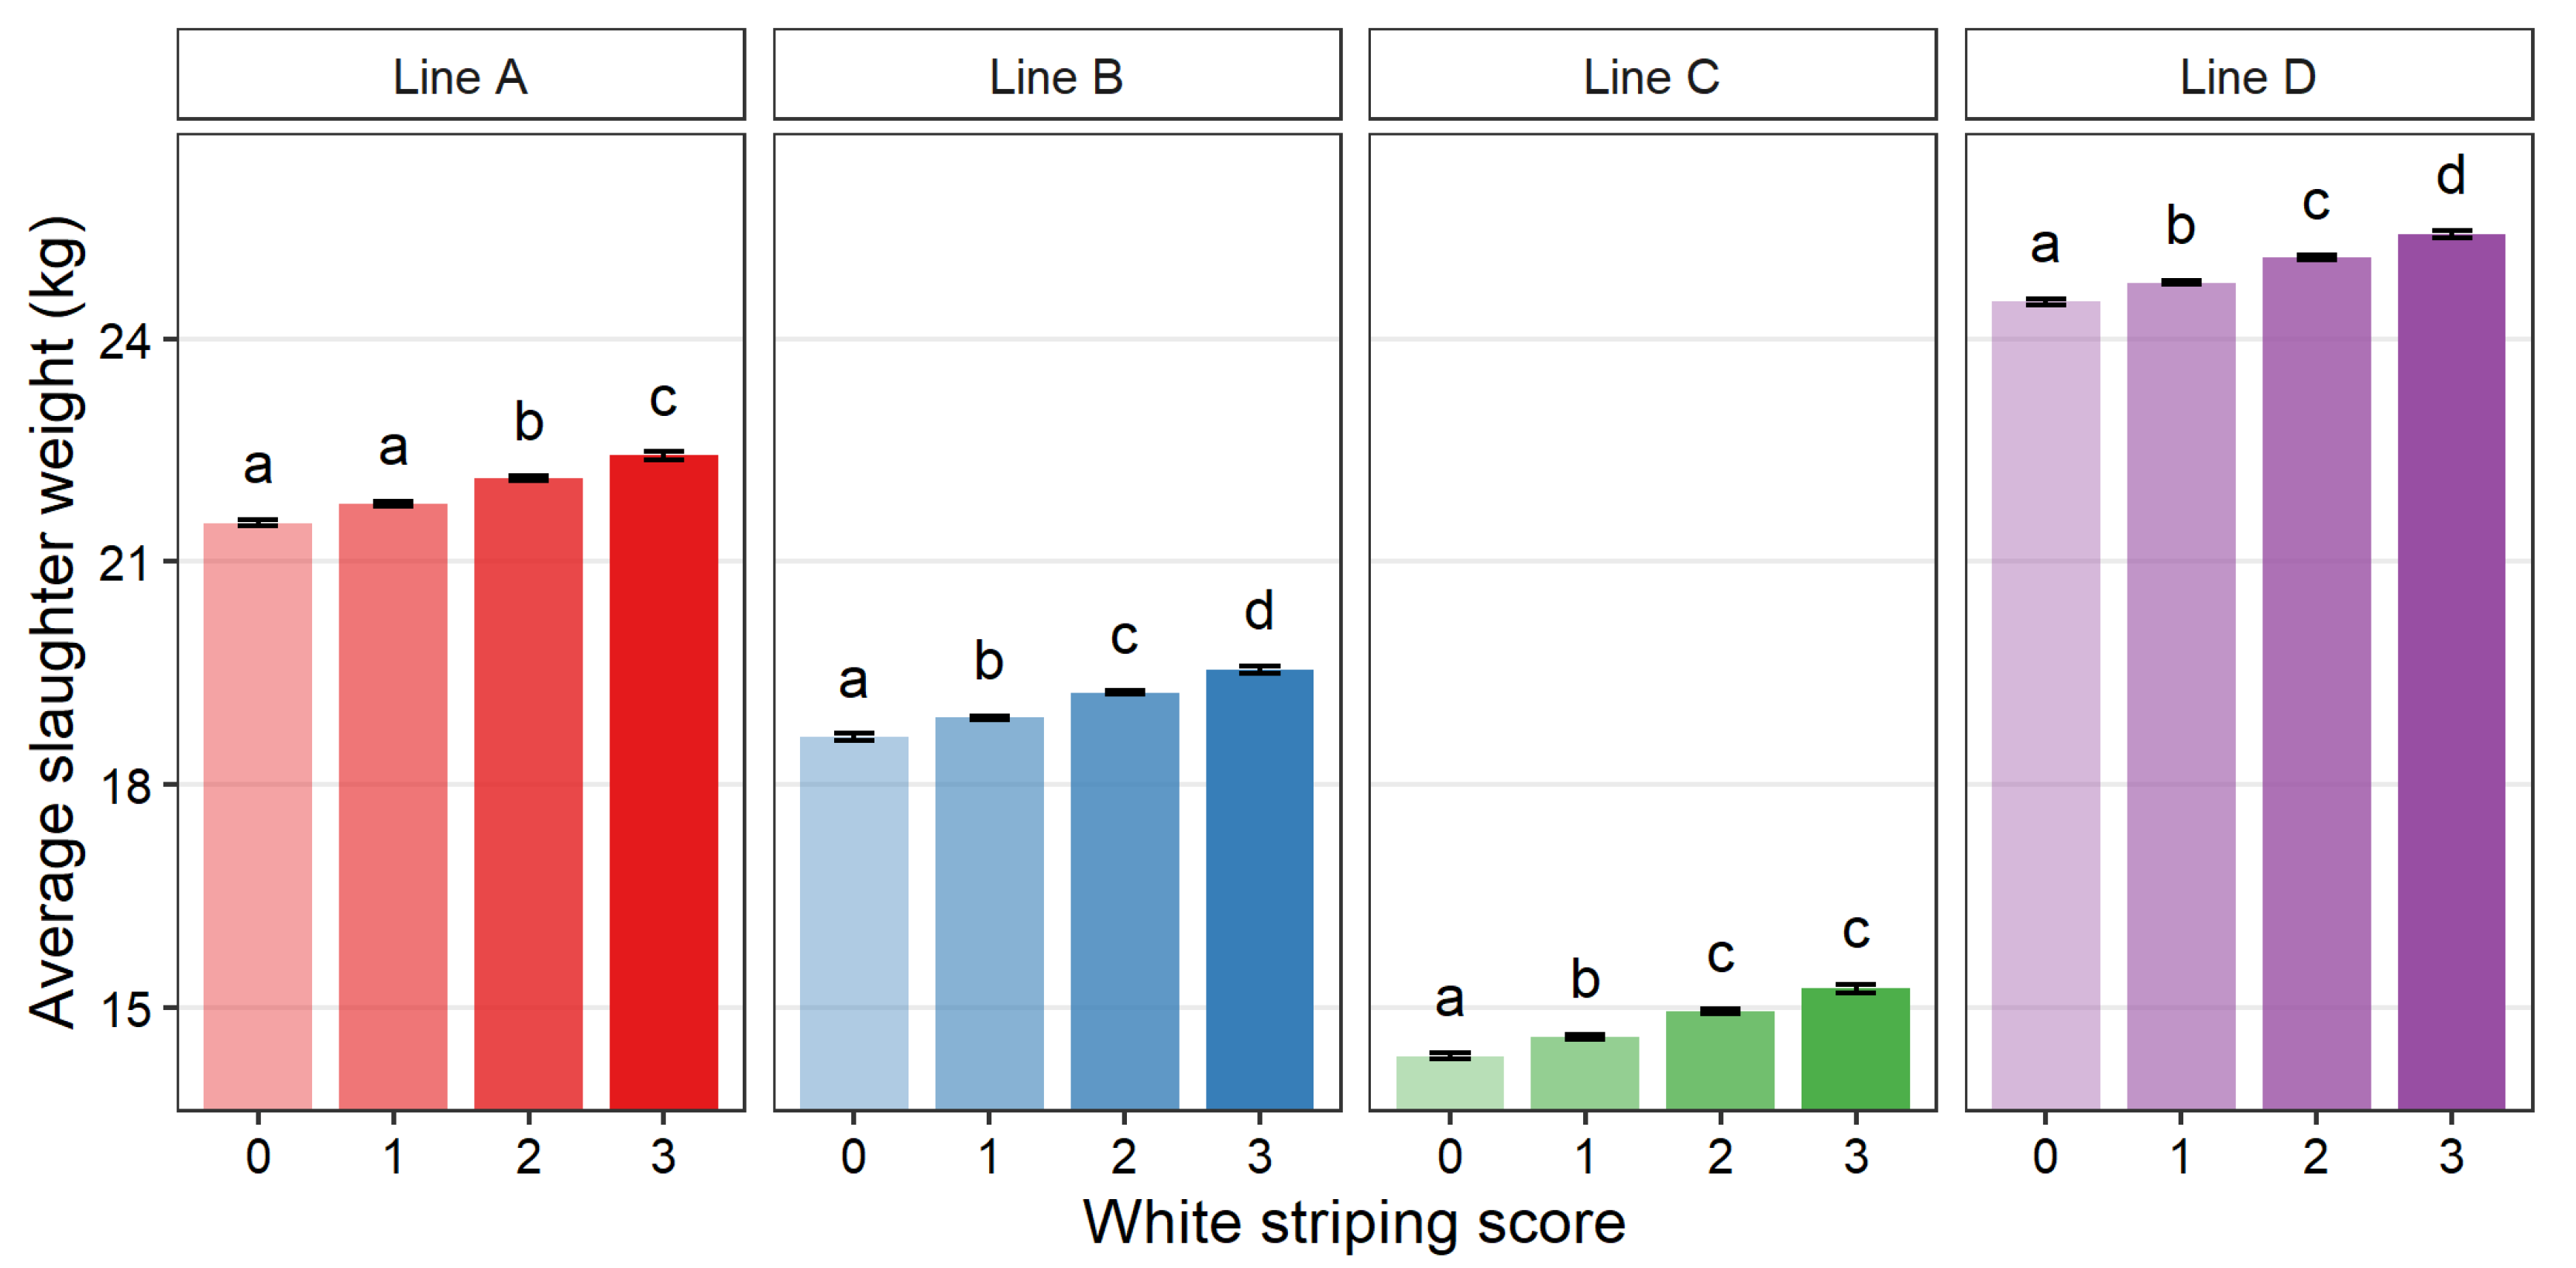
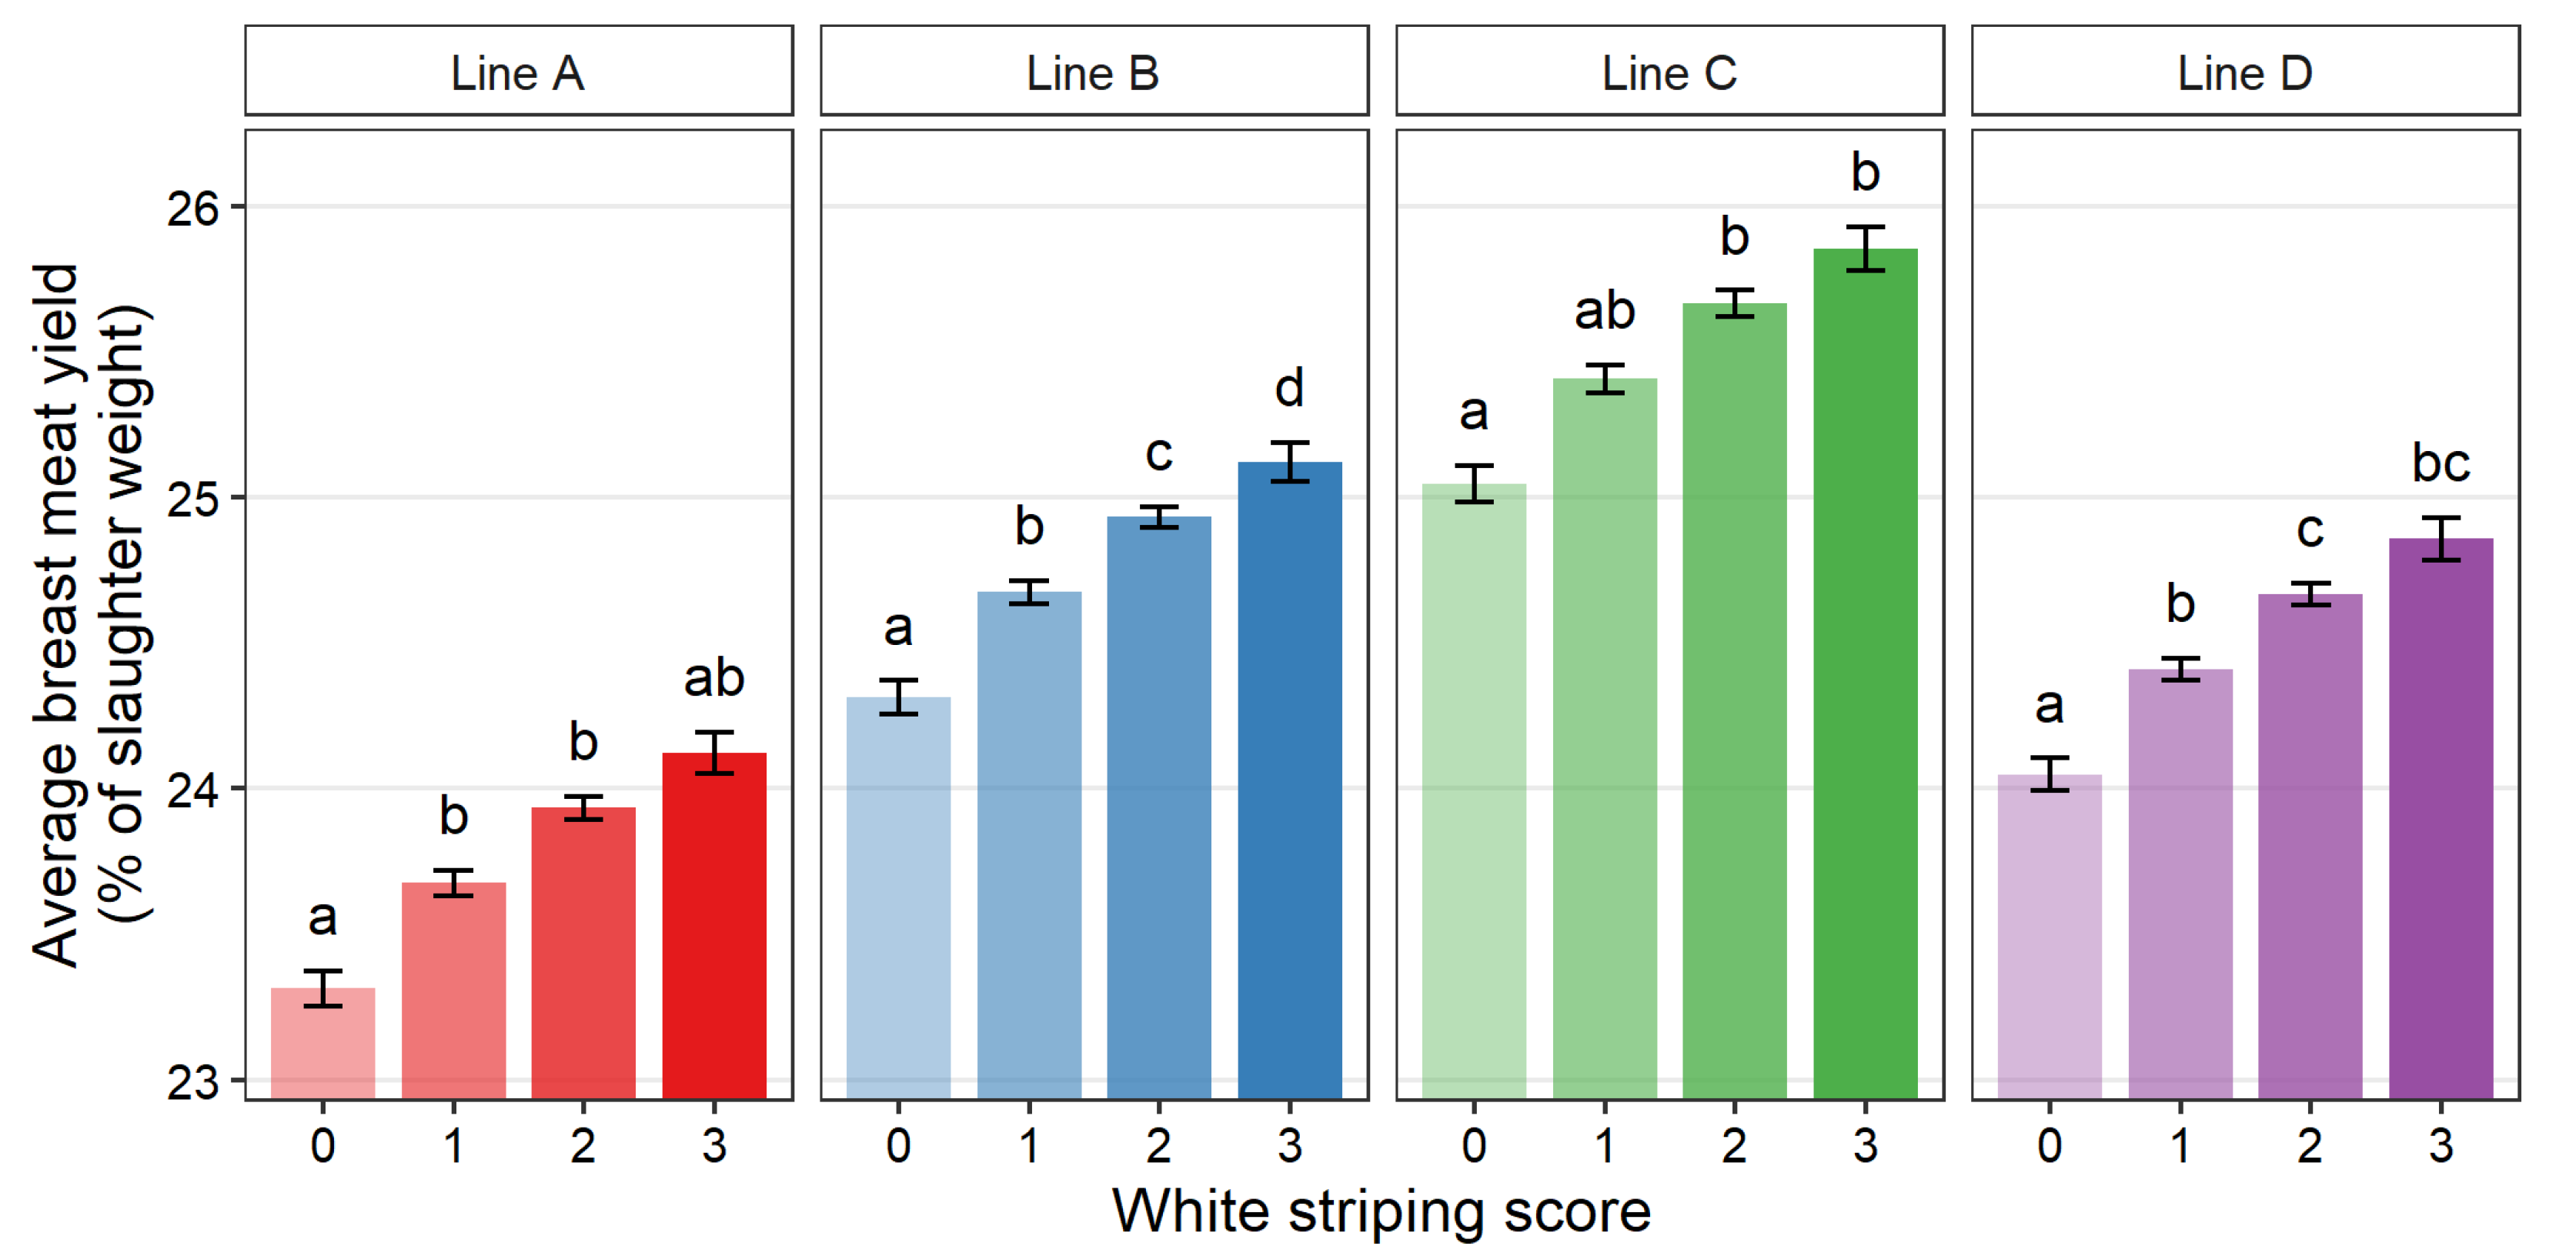
3.3. Prevalence of White Striping
4. Discussion
5. Conclusions
Author Contributions
Funding
Institutional Review Board Statement
Informed Consent Statement
Data Availability Statement
Acknowledgments
Conflicts of Interest
References
- FAOSTAT. Crops and Livestock Products. Available online: https://www.fao.org/faostat/en/#data/QCL/visualize (accessed on 17 November 2021).
- Min, B.; Ahn, D.U. Sensory properties of packaged fresh and processed poultry meat. In Advances in Meat, Poultry and Seafood Packaging; Woodhead Publishing: Sawston, UK, 2012; pp. 112–153. ISBN 9781845697518. [Google Scholar]
- Font-i-Furnols, M.; Guerrero, L. Consumer preference, behavior and perception about meat and meat products: An overview. Meat Sci. 2014, 98, 361–371. [Google Scholar] [CrossRef]
- Barbut, S. Meat industry 4.0: A distant future? Anim. Front. 2020, 10, 38–47. [Google Scholar] [CrossRef]
- Havenstein, G.B.; Ferket, P.R.; Grimes, J.L.; Qureshi, M.A.; Nestor, K.E. Comparison of the performance of 1966- versus 2003-type Turkeys when fed representative 1966 and 2003 Turkey diets: Growth rate, livability, and feed conversion. Poult. Sci. 2007, 86, 232–240. [Google Scholar] [CrossRef] [PubMed]
- Velleman, S.G.; Nestor, K.E. Effect of selection for growth rate on myosin heavy chain temporal and spatial localization during Turkey breast muscle development. Poult. Sci. 2003, 82, 1373–1377. [Google Scholar] [CrossRef]
- Hocking, P.M. Unexpected consequences of genetic selection in broilers and turkeys: Problems and solutions. Br. Poult. Sci. 2014, 55, 1–12. [Google Scholar] [CrossRef] [PubMed]
- Barbut, S. Recent myopathies in broiler’s breast meat fillets. Worlds Poult. Sci. J. 2019, 75, 559–582. [Google Scholar] [CrossRef]
- Kuttappan, V.A.; Hargis, B.M.; Owens, C.M. White striping and woody breast myopathies in the modern poultry industry: A review. Poult. Sci. 2016, 95, 2724–2733. [Google Scholar] [CrossRef]
- Russo, E.; Drigo, M.; Longoni, C.; Pezzotti, R.; Fasoli, P.; Recordati, C. Evaluation of White Striping prevalence and predisposing factors in broilers at slaughter. Poult. Sci. 2015, 94, 1843–1848. [Google Scholar] [CrossRef]
- Livingston, M.L.; Landon, C.; Barnes, H.J.; Brake, J. White striping and wooden breast myopathies of broiler breast muscle is affected by time-limited feeding, genetic background, and egg storage. Poult. Sci. 2019, 98, 217–226. [Google Scholar] [CrossRef]
- Baldi, G.; Soglia, F.; Mazzoni, M.; Sirri, F.; Canonico, L.; Babini, E.; Laghi, L.; Cavani, C.; Petracci, M. Implications of white striping and spaghetti meat abnormalities on meat quality and histological features in broilers. Animal 2018, 12, 164–173. [Google Scholar] [CrossRef] [Green Version]
- Soglia, F.; Baldi, G.; Laghi, L.; Mudalal, S.; Cavani, C.; Petracci, M. Effect of white striping on Turkey breast meat quality. Animal 2018, 12, 2198–2204. [Google Scholar] [CrossRef]
- Kuttappan, V.A.; Lee, Y.S.; Erf, G.F.; Meullenet, J.F.C.; Mckee, S.R.; Owens, C.M. Consumer acceptance of visual appearance of broiler breast meat with varying degrees of white striping. Poult. Sci. 2012, 91, 1240–1247. [Google Scholar] [CrossRef]
- de Carvalho, L.M.; Ventanas, S.; Olegario, L.S.; Madruga, M.S.; Estévez, M. Consumers awareness of white-striping as a chicken breast myopathy affects their purchasing decision and emotional responses. LWT 2020, 131, 109809. [Google Scholar] [CrossRef]
- Griffin, J.R.; Moraes, L.; Wick, M.; Lilburn, M.S. Onset of white striping and progression into wooden breast as defined by myopathic changes underlying Pectoralis major growth. Estimation of growth parameters as predictors for stage of myopathy progression. Avian Pathol. 2018, 47, 2–13. [Google Scholar] [CrossRef] [PubMed]
- Kuttappan, V.A.; Shivaprasad, H.L.; Shaw, D.P.; Valentine, B.A.; Hargis, B.M.; Clark, F.D.; McKee, S.R.; Owens, C.M. Pathological changes associated with white striping in broiler breast muscles. Poult. Sci. 2013, 92, 331–338. [Google Scholar] [CrossRef]
- Petracci, M.; Mudalal, S.; Babini, E.; Cavani, C. Effect of White Striping on Chemical Composition and Nutritional Value of Chicken Breast Meat. Ital. J. Anim. Sci. 2014, 13, 179–183. [Google Scholar] [CrossRef]
- Petracci, M.; Mudalal, S.; Bonfiglio, A.; Cavani, C. Occurrence of white striping under commercial conditions and its impact on breast meat quality in broiler chickens. Poult. Sci. 2013, 92, 1670–1675. [Google Scholar] [CrossRef]
- Mudalal, S.; Lorenzi, M.; Soglia, F.; Cavani, C.; Petracci, M. Implications of white striping and wooden breast abnormalities on quality traits of raw and marinated chicken meat. Animal 2015, 9, 728–734. [Google Scholar] [CrossRef] [Green Version]
- Sanchez Brambila, G.; Bowker, B.C.; Zhuang, H. Comparison of sensory texture attributes of broiler breast fillets with different degrees of white striping. Poult. Sci. 2016, 95, 2472–2476. [Google Scholar] [CrossRef] [PubMed]
- Lorenzi, M.; Mudalal, S.; Cavani, C.; Petracci, M. Incidence of white striping under commercial conditions in medium and heavy broiler chickens in Italy. J. Appl. Poult. Res. 2014, 23, 754–758. [Google Scholar] [CrossRef]
- Cruz, R.F.A.; Vieira, S.L.; Kindlein, L.; Kipper, M.; Cemin, H.S.; Rauber, S.M. Occurrence of white striping and wooden breast in broilers fed grower and finisher diets with increasing Lysine levels. Poult. Sci. 2017, 96, 501–510. [Google Scholar] [CrossRef]
- Golzar Adabi, S.; Demirok Soncu, E. White striping prevalence and its effect on meat quality of broiler breast fillets under commercial conditions. J. Anim. Physiol. Anim. Nutr. 2019, 103, 1060–1069. [Google Scholar] [CrossRef]
- Mudalal, S. Incidence of white striping and its effect on the quality traits of raw and processed Turkey breast meat. Food Sci. Anim. Resour. 2019, 39, 410–417. [Google Scholar] [CrossRef]
- Bailey, R.A.; Watson, K.A.; Bilgili, S.F.; Avendano, S. The genetic basis of pectoralis major myopathies in modern broiler chicken lines. Poult. Sci. 2015, 94, 2870–2879. [Google Scholar] [CrossRef] [PubMed]
- Lake, J.A.; Dekkers, J.C.M.; Abasht, B. Genetic basis and identification of candidate genes for wooden breast and white striping in commercial broiler chickens. Sci. Rep. 2021, 11, 6785. [Google Scholar] [CrossRef] [PubMed]
- Pampouille, E.; Berri, C.; Boitard, S.; Hennequet-Antier, C.; Beauclercq, S.A.; Godet, E.; Praud, C.; Jégo, Y.; Le Bihan-Duval, E. Mapping QTL for white striping in relation to breast muscle yield and meat quality traits in broiler chickens. BMC Genom. 2018, 19, 202. [Google Scholar] [CrossRef]
- Alnahhas, N.; Berri, C.; Chabault, M.; Chartrin, P.; Boulay, M.; Bourin, M.C.; Bihan-Duval, E. Le Genetic parameters of white striping in relation to body weight, carcass composition, and meat quality traits in two broiler lines divergently selected for the ultimate pH of the pectoralis major muscle. BMC Genet. 2016, 17, 61. [Google Scholar] [CrossRef] [PubMed] [Green Version]
- Mudalal, S.; Zaid, A.; Abu-Khalaf, N.; Petracci, M. Predicting the quality traits of white striped turkey breast by visible/near infra-red spectroscopy and multivariate data analysis. Ital. J. Anim. Sci. 2020, 19, 676–686. [Google Scholar] [CrossRef]
- Carvalho, L.T.; Owens, C.M.; Giampietro-Ganeco, A.; Malagoli de Mello, J.L.; Ferrari, F.B.; de Carvalho, F.A.L.; Alves de Souza, R.; Amoroso, L.; Alves de Souza, P.; Borba, H.; et al. Quality of turkeys breast meat affected by white striping myopathy. Poult. Sci. 2021, 100, 101022. [Google Scholar] [CrossRef]
- Zampiga, M.; Tavaniello, S.; Soglia, F.; Petracci, M.; Mazzoni, M.; Maiorano, G.; Meluzzi, A.; Clavenzani, P.; Sirri, F. Comparison of 2 commercial Turkey hybrids: Productivity, occurrence of breast myopathies, and meat quality properties. Poult. Sci. 2019, 98, 2305–2315. [Google Scholar] [CrossRef]
- Santos, M.N.; Rothschild, D.; Widowski, T.M.; Barbut, S.; Kiarie, E.G.; Mandell, I.; Guerin, M.T.; Edwards, A.M.; Torrey, S. In pursuit of a better broiler: Carcass traits and muscle myopathies in conventional and slower-growing strains of broiler chickens. Poult. Sci. 2021, 100, 101309. [Google Scholar] [CrossRef]
- Malchiodi, F.; Wood, B.; Barbut, S.; Harlander, A.; Baes, C. 306 Application of genomic selection for enhancing health, welfare, efficiency and production traits in turkeys. J. Anim. Sci. 2018, 96, 116. [Google Scholar] [CrossRef]
- Prisco, F.; De Biase, D.; Piegari, G.; D’Aquino, I.; Lama, A.; Comella, F.; Mercogliano, R.; Dipineto, L.; Papparella, S.; Paciello, O. Pathologic characterization of white striping myopathy in broiler chickens. Poult. Sci. 2021, 100, 101150. [Google Scholar] [CrossRef] [PubMed]
- World Organization for Animal Health. Introduction to the recommendations for animal welfare. In Terrestrial Animal Health Code; World Organization for Animal Health: Paris, France, 2008; pp. 235–236. [Google Scholar]
- Boerboom, G.; Van Kempen, T.; Navarro-Villa, A.; Pérez-Bonilla, A. Unraveling the cause of white striping in broilers using metabolomics. Poult. Sci. 2018, 97, 3977–3986. [Google Scholar] [CrossRef] [PubMed]
- Kapell, D.N.R.G.; Hill, W.G.; Neeteson, A.-M.; McAdam, J.; Koerhuis, A.N.M.; Avendaño, S. Genetic parameters of foot-pad dermatitis and body weight in purebred broiler lines in 2 contrasting environments. Poult. Sci. 2012, 91, 565–574. [Google Scholar] [CrossRef] [PubMed]
- Hybrid Turkeys. Technical Guide for Hybrid Turkeys Commercial Products; Hybrid Turkeys: Boxmeer, The Netherlands, 2020; pp. 1–75. [Google Scholar]
- SAS Institute Inc. SAS® 9.4 Statements: Reference 2016; SAS Institute Inc.: Cary, NC, USA, 2016. [Google Scholar]
- Watson, P.F.; Petrie, A. Method agreement analysis: A review of correct methodology. Theriogenology 2010, 73, 1167–1179. [Google Scholar] [CrossRef] [Green Version]
- Landis, J.R.; Koch, G.G. The Measurement of Observer Agreement for Categorical Data. Biometrics 1977, 33, 159–174. [Google Scholar] [CrossRef] [Green Version]
- Handel, I.G. Statistics for Veterinary and Animal Science, 3rd ed.; British Veterinary Association: London, UK, 2013. [Google Scholar] [CrossRef]
- R Core Team. R: A Language and Environment for Statistical Computing; R Foundation for Statistical Computing: Vienna, Austria, 2020. [Google Scholar]
- Wickman, H. ggplot2: Elegant Graphics for Data Analysis; Springer: Berlin/Heidelberg, Germany, 2016. [Google Scholar]
- D’Eath, R.B. Repeated locomotion scoring of a sow herd to measure lameness: Consistency over time, the effect of sow characteristics and inter-observer reliability. Anim. Welf. 2012, 21, 219–231. [Google Scholar] [CrossRef]
- Garner, J.P.; Falcone, C.; Wakenell, P.; Martin, M.; Mench, J.A. Reliability and validity of a modified gait scoring system and its use in assessing tibial dyschondroplasia in broilers. Br. Poult. Sci. 2002, 43, 355–363. [Google Scholar] [CrossRef]
- Schlageter-Tello, A.; Bokkers, E.A.M.; Groot Koerkamp, P.W.G.; Van Hertem, T.; Viazzi, S.; Romanini, C.E.B.; Halachmi, I.; Bahr, C.; Berckmans, D.; Lokhorst, K. Effect of merging levels of locomotion scores for dairy cows on intra- and interrater reliability and agreement. J. Dairy Sci. 2014, 97, 5533–5542. [Google Scholar] [CrossRef]
- Decina, C.; Berke, O.; van Staaveren, N.; Baes, C.F.; Harlander-Matauscheck, A. Development of a scoring system to assess feather damage in canadian laying hen flocks. Animals 2019, 9, 436. [Google Scholar] [CrossRef] [PubMed] [Green Version]
- Palczynski, L.J.; Buller, H.; Lambton, S.L.; Weeks, C.A. Farmer attitudes to injurious pecking in laying hens and to potential control strategies. Anim. Welf. 2016, 25, 29–38. [Google Scholar] [CrossRef] [Green Version]
- Radaelli, G.; Piccirillo, A.; Birolo, M.; Bertotto, D.; Gratta, F.; Ballarin, C.; Vascellari, M.; Xiccato, G.; Trocino, A. Effect of age on the occurrence of muscle fiber degeneration associated with myopathies in broiler chickens submitted to feed restriction. Poult. Sci. 2017, 96, 309–319. [Google Scholar] [CrossRef] [PubMed]


| Observer 1 | Observer 2 | Observer 3 | Observer 4 | Observer 5 | Observer 6 | Average | |
|---|---|---|---|---|---|---|---|
| Session 1 (round 1 and 2) 1 | |||||||
| Exact agreement (%) | 38 | 74 | 68 | 78 | 62 | 74 | 66 |
| Spearman correlation | 0.48 ** | 0.68 *** | 0.69 *** | 0.79 *** | 0.63 *** | 0.81 *** | 0.68 |
| Kappa | 0.12 (–0.05–0.29) | 0.51 (0.28–0.73) | 0.43 (0.21–0.65) | 0.64 (0.45–0.82) | 0.41 (0.21–0.61) | 0.62 (0.44–0.80) | 0.45 |
| Linear weighted kappa | 0.20 (0.06–0.34) | 0.58 (0.37–0.78) | 0.54 (0.35–0.73) | 0.70 (0.54–0.86) | 0.51 (0.33–0.69) | 0.72 (0.58–0.86) | 0.54 |
| Quadratic weighted kappa | 0.31 (0.17–0.46) | 0.68 (0.50–0.86) | 0.68 (0.53–0.83) | 0.78 (0.66–0.91) | 0.62 (0.45–0.80) | 0.82 (0.72–0.92) | 0.65 |
| Session 2 (round 3 and 4) 1 | |||||||
| Exact agreement (%) | 80 | 86 | 88 | 74 | 68 | 72 | 78 |
| Spearman correlation | 0.73 *** | 0.87 *** | 0.86 *** | 0.67 *** | 0.70 *** | 0.74 *** | 0.76 |
| Kappa | 0.62 (0.41–0.83) | 0.77 (0.61–0.93) | 0.80 (0.64–0.95) | 0.53 (0.31–0.75) | 0.47 (0.27–0.68) | 0.56 (0.36–0.76) | 0.63 |
| Linear weighted kappa | 0.66 (0.46–0.85) | 0.82 (0.68–0.95) | 0.83 (0.70–0.96) | 0.59 (0.39–0.79) | 0.57 (0.40–0.75) | 0.65 (0.49–0.82) | 0.69 |
| Quadratic weighted kappa | 0.71 (0.50–0.91) | 0.87 (0.77–0.97) | 0.88 (0.78–0.98) | 0.67 (0.49–0.84) | 0.70 (0.56–0.83) | 0.76 (0.63–0.89) | 0.76 |
| Session 3 (round 5 and 6) 2 | |||||||
| Exact agreement (%) | 80 | 86 | 88 | 76 | 80 | 76 | 81 |
| Spearman correlation | 0.65 *** | 0.88 *** | 0.86 *** | 0.65 *** | 0.81 *** | 0.71 *** | 0.76 |
| Kappa | 0.59 (0.37–0.81) | 0.80 (0.66–0.94) | 0.80 (0.65–0.95) | 0.52 (0.29–0.76) | 0.69 (0.51–0.86) | 0.58 (0.38–0.78) | 0.66 |
| Linear weighted kappa | 0.62 (0.41–0.83) | 0.84 (0.72–0.96) | 0.83 (0.69–0.96) | 0.57 (0.36–0.79) | 0.75 (0.61–0.90) | 0.63 (0.46–0.81) | 0.71 |
| Quadratic weighted kappa | 0.67 (0.47–0.88) | 0.88 (0.77–0.99) | 0.87 (0.76–0.97) | 0.64 (0.45–0.83) | 0.83 (0.72–0.94) | 0.71 (0.55–0.86) | 0.77 |
| Session 1 1 | Session 2 1 | Session 3 2 | ||||
|---|---|---|---|---|---|---|
| Round 1 | Round 2 | Round 3 | Round 4 | Round 5 | Round 6 | |
| Percentage agreement (%) 3 | ||||||
| All 6 observers agree | 0 | 6 | 32 | 22 | 12 | 10 |
| 5 observers agree | 24 | 24 | 28 | 36 | 32 | 28 |
| 4 observers agree | 24 | 46 | 36 | 26 | 26 | 40 |
| 3 observers agree | 48 | 24 | 4 | 16 | 26 | 22 |
| 2 observers agree | 4 | 0 | 0 | 0 | 4 | 0 |
| Exact agreement | ||||||
| Kappa | 0.17 (0.10−0.25) | 0.27 (0.20–0.34) | 0.33 (0.26–0.39) | 0.29 (0.22–0.36) | 0.21 (0.15–0.28) | 0.24 (0.16–0.31) |
| Kendall’s W | 0.61 *** | 0.68 *** | 0.74 *** | 0.70 *** | 0.61 *** | 0.66 *** |
| Linear weighting | ||||||
| Linear weighted kappa | 0.32 (0.20–0.44) | 0.45 (0.36–0.54) | 0.52 (0.45–0.59) | 0.48 (0.39–0.56) | 0.38 (0.28–0.47) | 0.41 (0.31–0.51) |
| Gwet’s AC2 | ||||||
| Overall | 0.54 (0.28–0.81) | 0.65 (0.56–0.74) | 0.79 (0.69–0.89) | 0.76 (0.66–0.87) | 0.67 (0.58–0.77) | 0.68 (0.58–0.79) |
| Score 0 | 0.88 (0.80–0.96) | 0.86 (0.77–0.94) | 0.93 (0.88–0.99) | 0.96 (0.91–1.00) | 0.88 (0.78–0.97) | 0.89 (0.80–0.97) |
| Score 1 | 0.47 (0.28–0.66) | 0.51 (0.32–0.70) | 0.72 (0.59–0.84) | 0.70 (0.51–0.89) | 0.57 (0.41–0.72) | 0.60 (0.43–0.78) |
| Score 2 | 0.49 (0.26–0.72) | 0.58 (0.45–0.72) | 0.68 (0.53–0.84) | 0.61 (0.46–0.77) | 0.58 (0.44–0.73) | 0.56 (0.38–0.73) |
| Score 3 | 0.81 (0.58–1.00) | 0.92 (0.86–0.98) | 0.93 (0.87–0.99) | 0.89 (0.81–0.96) | 0.91 (0.84–0.98) | 0.89 (0.81–0.97) |
| Quadratic weighting | ||||||
| Quadratic weighted kappa | 0.32 (0.20–0.44) | 0.45 (0.36–0.54) | 0.52 (0.45−0.59) | 0.48 (0.39–0.56) | 0.38 (0.28–0.47) | 0.41 (0.31–0.51) |
| Gwet’s AC2 | ||||||
| Overall | 0.74 (0.53–0.95) | 0.83 (0.77–0.88) | 0.91 (0.85–0.96) | 0.89 (0.83–0.95) | 0.83 (0.76–0.90) | 0.85 (0.78–0.92) |
| Score 0 | 0.88 (0.80–0.96) | 0.86 (0.77–0.95) | 0.93 (0.88–0.99) | 0.96 (0.91–1.00) | 0.88 (0.78–0.97) | 0.89 (0.80–0.97) |
| Score 1 | 0.47 (0.28–0.66) | 0.51 (0.32–0.70) | 0.72 (0.59–0.84) | 0.70 (0.51–0.89) | 0.57 (0.42–0.72) | 0.60 (0.43–0.78) |
| Score 2 | 0.49 (0.26–0.72) | 0.58 (0.45–0.72) | 0.68 (0.53–0.84) | 0.61 (0.46–0.77) | 0.58 (0.44–0.73) | 0.56 (0.38–0.73) |
| Score 3 | 0.81 (0.58–1.00) | 0.92 (0.86–0.98) | 0.93 (0.87–0.99) | 0.89 (0.81–0.96) | 0.91 (0.84–0.98) | 0.89 (0.81–0.97) |
| Genetic Line | White Striping Score (0–3) | Slaughter Weight (kg) | Breast Weight (kg) | BMY (% BW) | ||||||||
|---|---|---|---|---|---|---|---|---|---|---|---|---|
| N | Mean | SD | N | Mean | SD | N | Mean | SD | N | Mean | SD | |
| A | 2839 | 2.57 | 0.776 | 2834 | 21.98 | 1.548 | 2830 | 5.23 | 0.583 | 2827 | 23.81 | 1.966 |
| B | 3728 | 2.61 | 0.81 | 3715 | 19.11 | 1.286 | 3677 | 4.74 | 0.499 | 3666 | 24.81 | 1.789 |
| C | 2034 | 2.47 | 0.782 | 2032 | 14.77 | 1.005 | 2031 | 3.77 | 0.394 | 2028 | 25.51 | 1.704 |
| D | 3720 | 2.30 | 0.771 | 3701 | 24.87 | 1.801 | 3652 | 6.10 | 0.757 | 3647 | 24.47 | 2.108 |
Publisher’s Note: MDPI stays neutral with regard to jurisdictional claims in published maps and institutional affiliations. |
© 2022 by the authors. Licensee MDPI, Basel, Switzerland. This article is an open access article distributed under the terms and conditions of the Creative Commons Attribution (CC BY) license (https://creativecommons.org/licenses/by/4.0/).
Share and Cite
Vanderhout, R.J.; Leishman, E.M.; Hiscock, H.; Abdalla, E.A.; Makanjuola, B.O.; Mohr, J.; Harlander-Matauschek, A.; Barbut, S.; Wood, B.J.; Baes, C.F.; et al. Reliability of a White Striping Scoring System and Description of White Striping Prevalence in Purebred Turkey Lines. Animals 2022, 12, 254. https://doi.org/10.3390/ani12030254
Vanderhout RJ, Leishman EM, Hiscock H, Abdalla EA, Makanjuola BO, Mohr J, Harlander-Matauschek A, Barbut S, Wood BJ, Baes CF, et al. Reliability of a White Striping Scoring System and Description of White Striping Prevalence in Purebred Turkey Lines. Animals. 2022; 12(3):254. https://doi.org/10.3390/ani12030254
Chicago/Turabian StyleVanderhout, Ryley J., Emily M. Leishman, Heather Hiscock, Emhimad A. Abdalla, Bayode O. Makanjuola, Jeff Mohr, Alexandra Harlander-Matauschek, Shai Barbut, Benjamin J. Wood, Christine F. Baes, and et al. 2022. "Reliability of a White Striping Scoring System and Description of White Striping Prevalence in Purebred Turkey Lines" Animals 12, no. 3: 254. https://doi.org/10.3390/ani12030254
APA StyleVanderhout, R. J., Leishman, E. M., Hiscock, H., Abdalla, E. A., Makanjuola, B. O., Mohr, J., Harlander-Matauschek, A., Barbut, S., Wood, B. J., Baes, C. F., & van Staaveren, N. (2022). Reliability of a White Striping Scoring System and Description of White Striping Prevalence in Purebred Turkey Lines. Animals, 12(3), 254. https://doi.org/10.3390/ani12030254