
Computer Vision for Detection of Body Posture and Behavior of Red Foxes

 , , , , , , and
Abstract
:Simple Summary
Abstract
1. Introduction
2. Materials and Methods
2.1. Experimental Setup
2.2. Ethical Approval
2.3. Image and Video Data
2.4. Environment Configuration
2.5. Automatic Evaluation: Red Fox Detection and Posture Classification
2.6. Evaluation of Model Performance
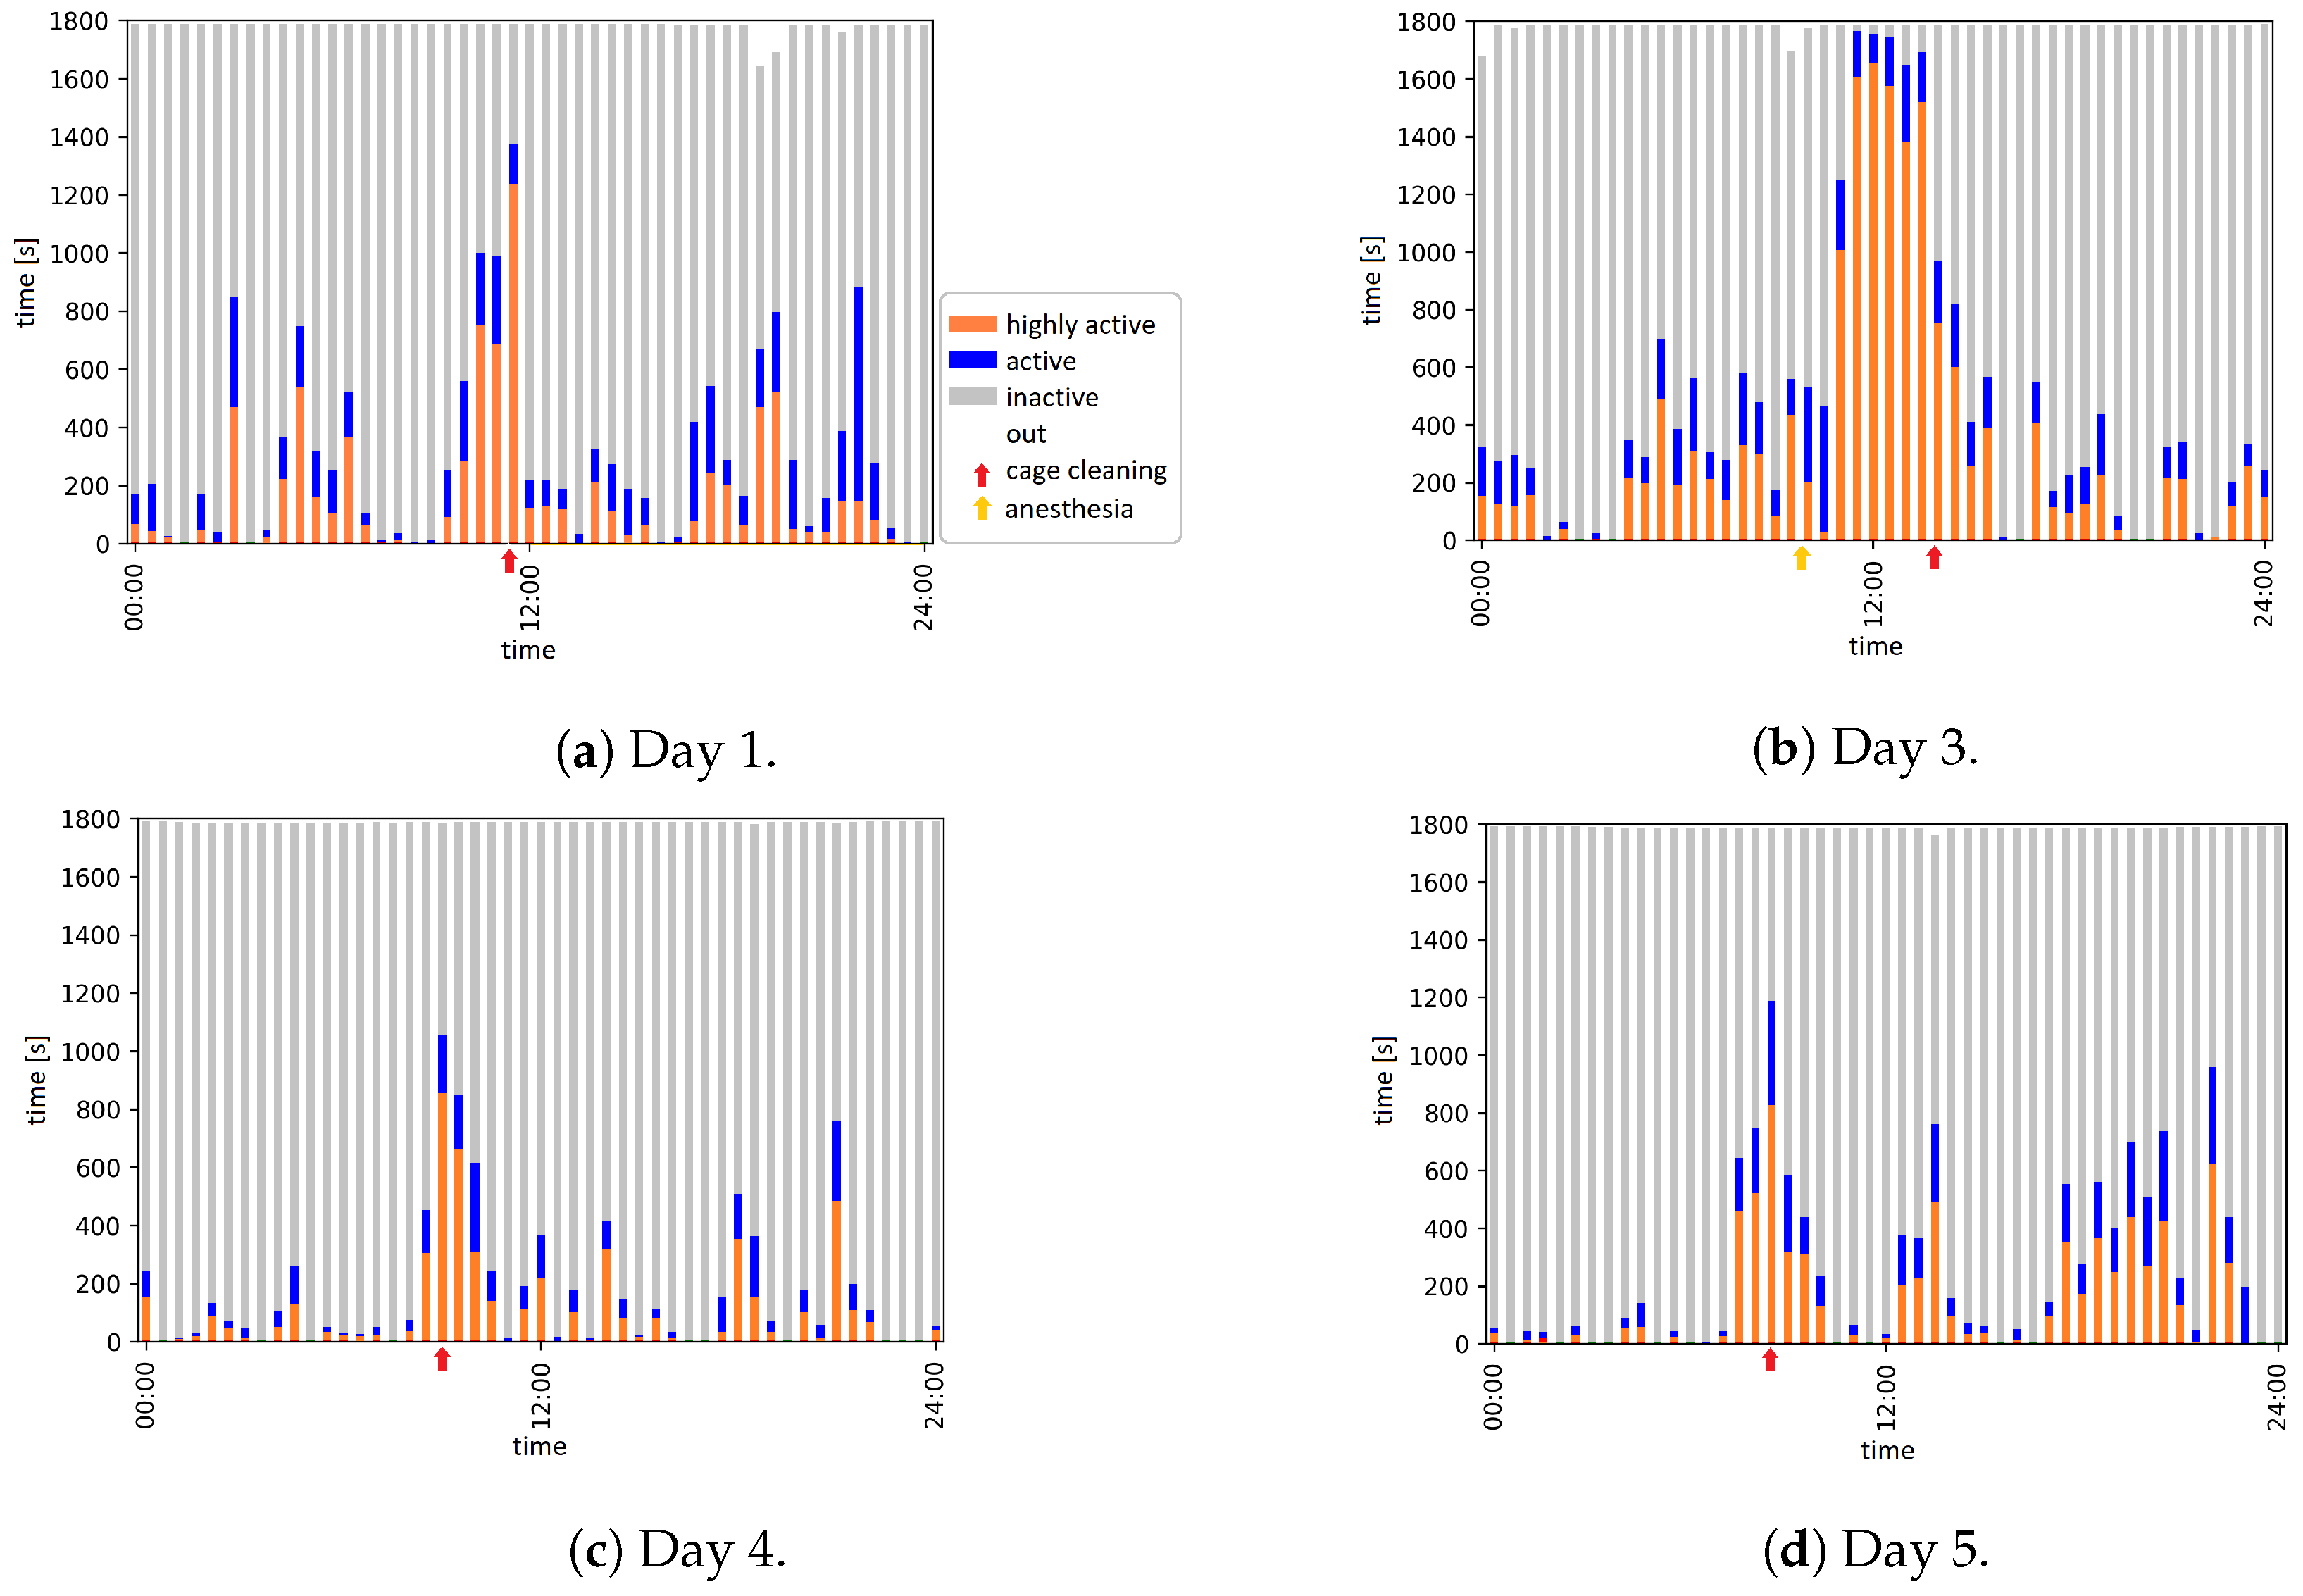
2.7. Automatic Evaluation: Activity Analysis
- (i)
- Highly active: considerable movement of the bounding box (), i.e., the localization of the red fox changes, e.g., walking or running;
- (ii)
- Active: slight movement of the , i.e., the localization of the red fox does not change, but there is some movement inside the , e.g., rotation or minimal movements, such as scratching or stretching;
- (iii)
- Inactive: no movement of the , i.e., the red fox does not move, e.g., lying, sitting, or standing still.
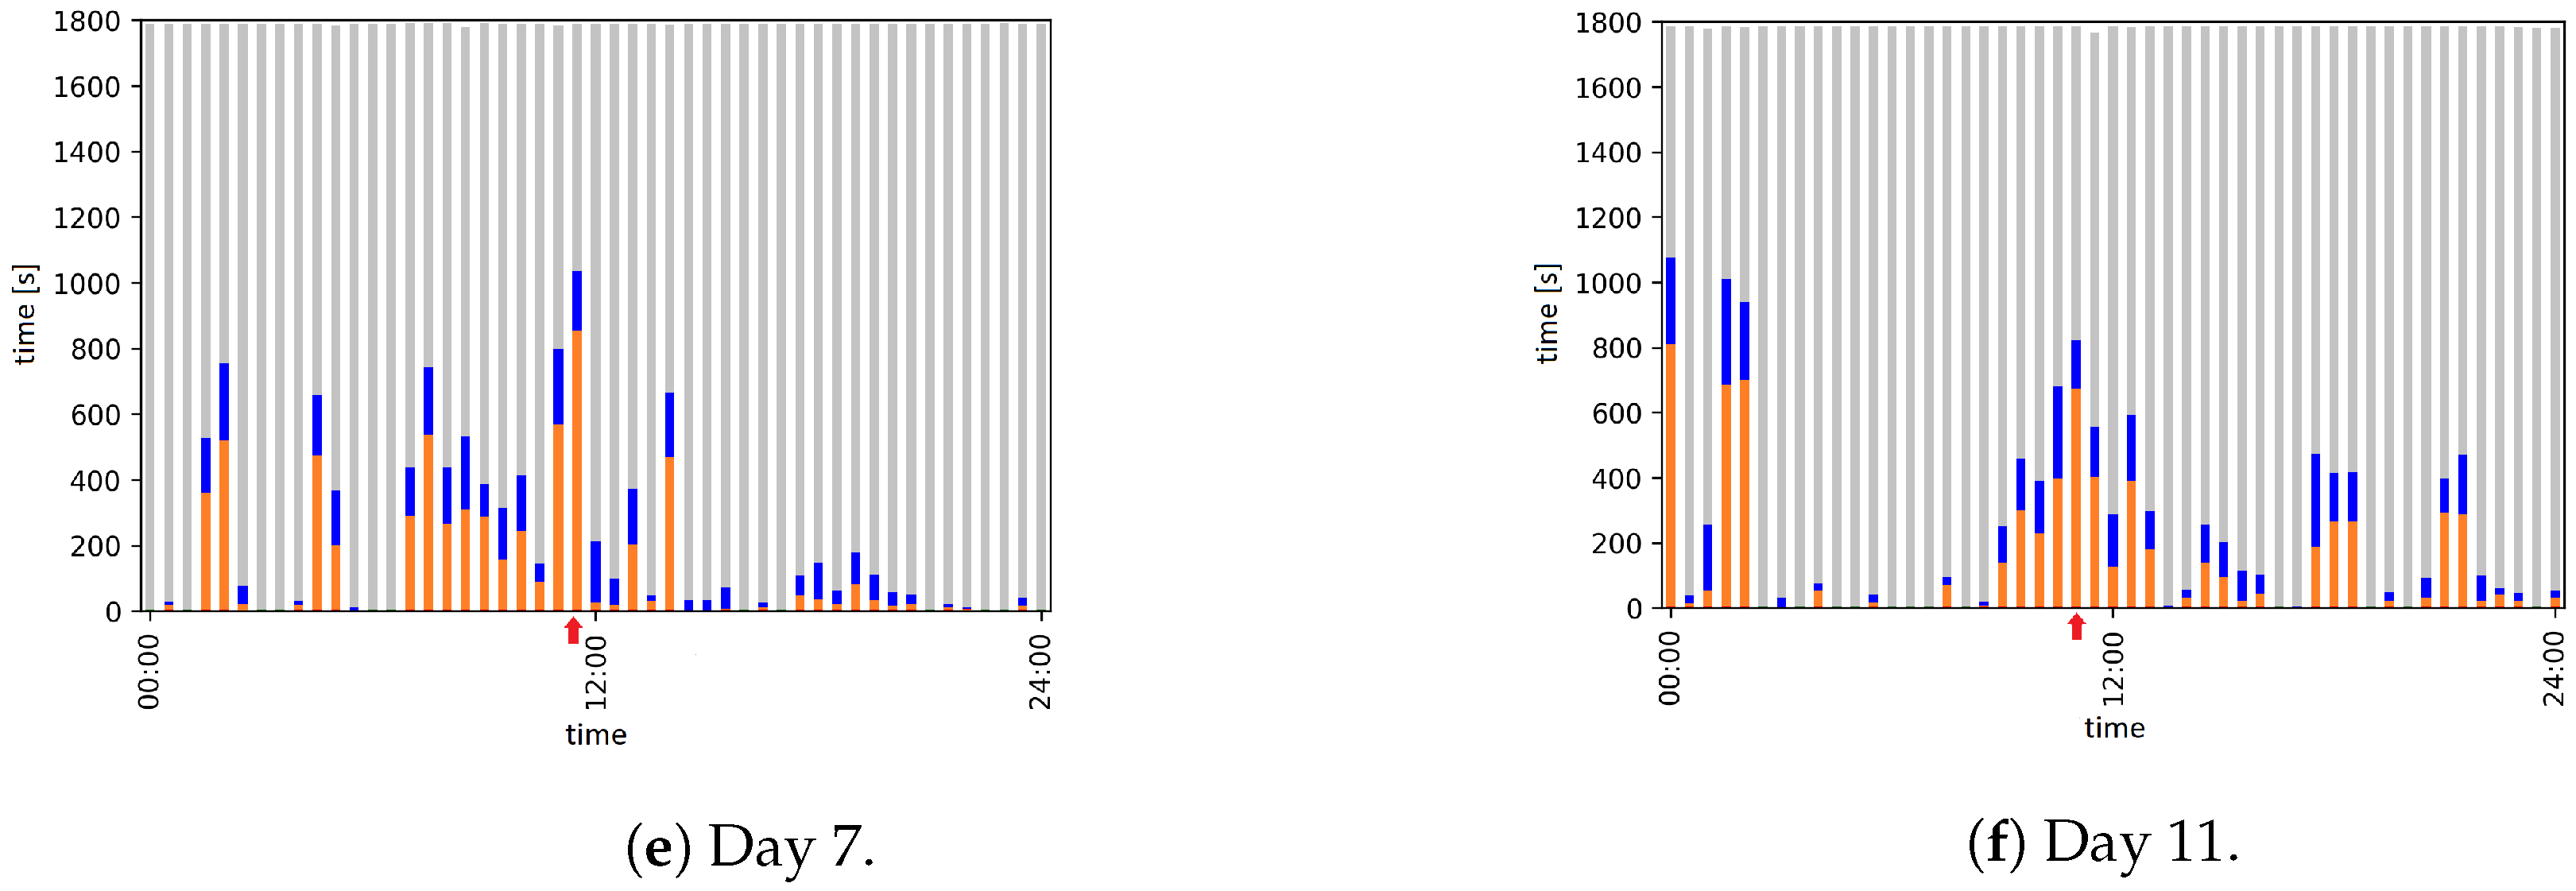
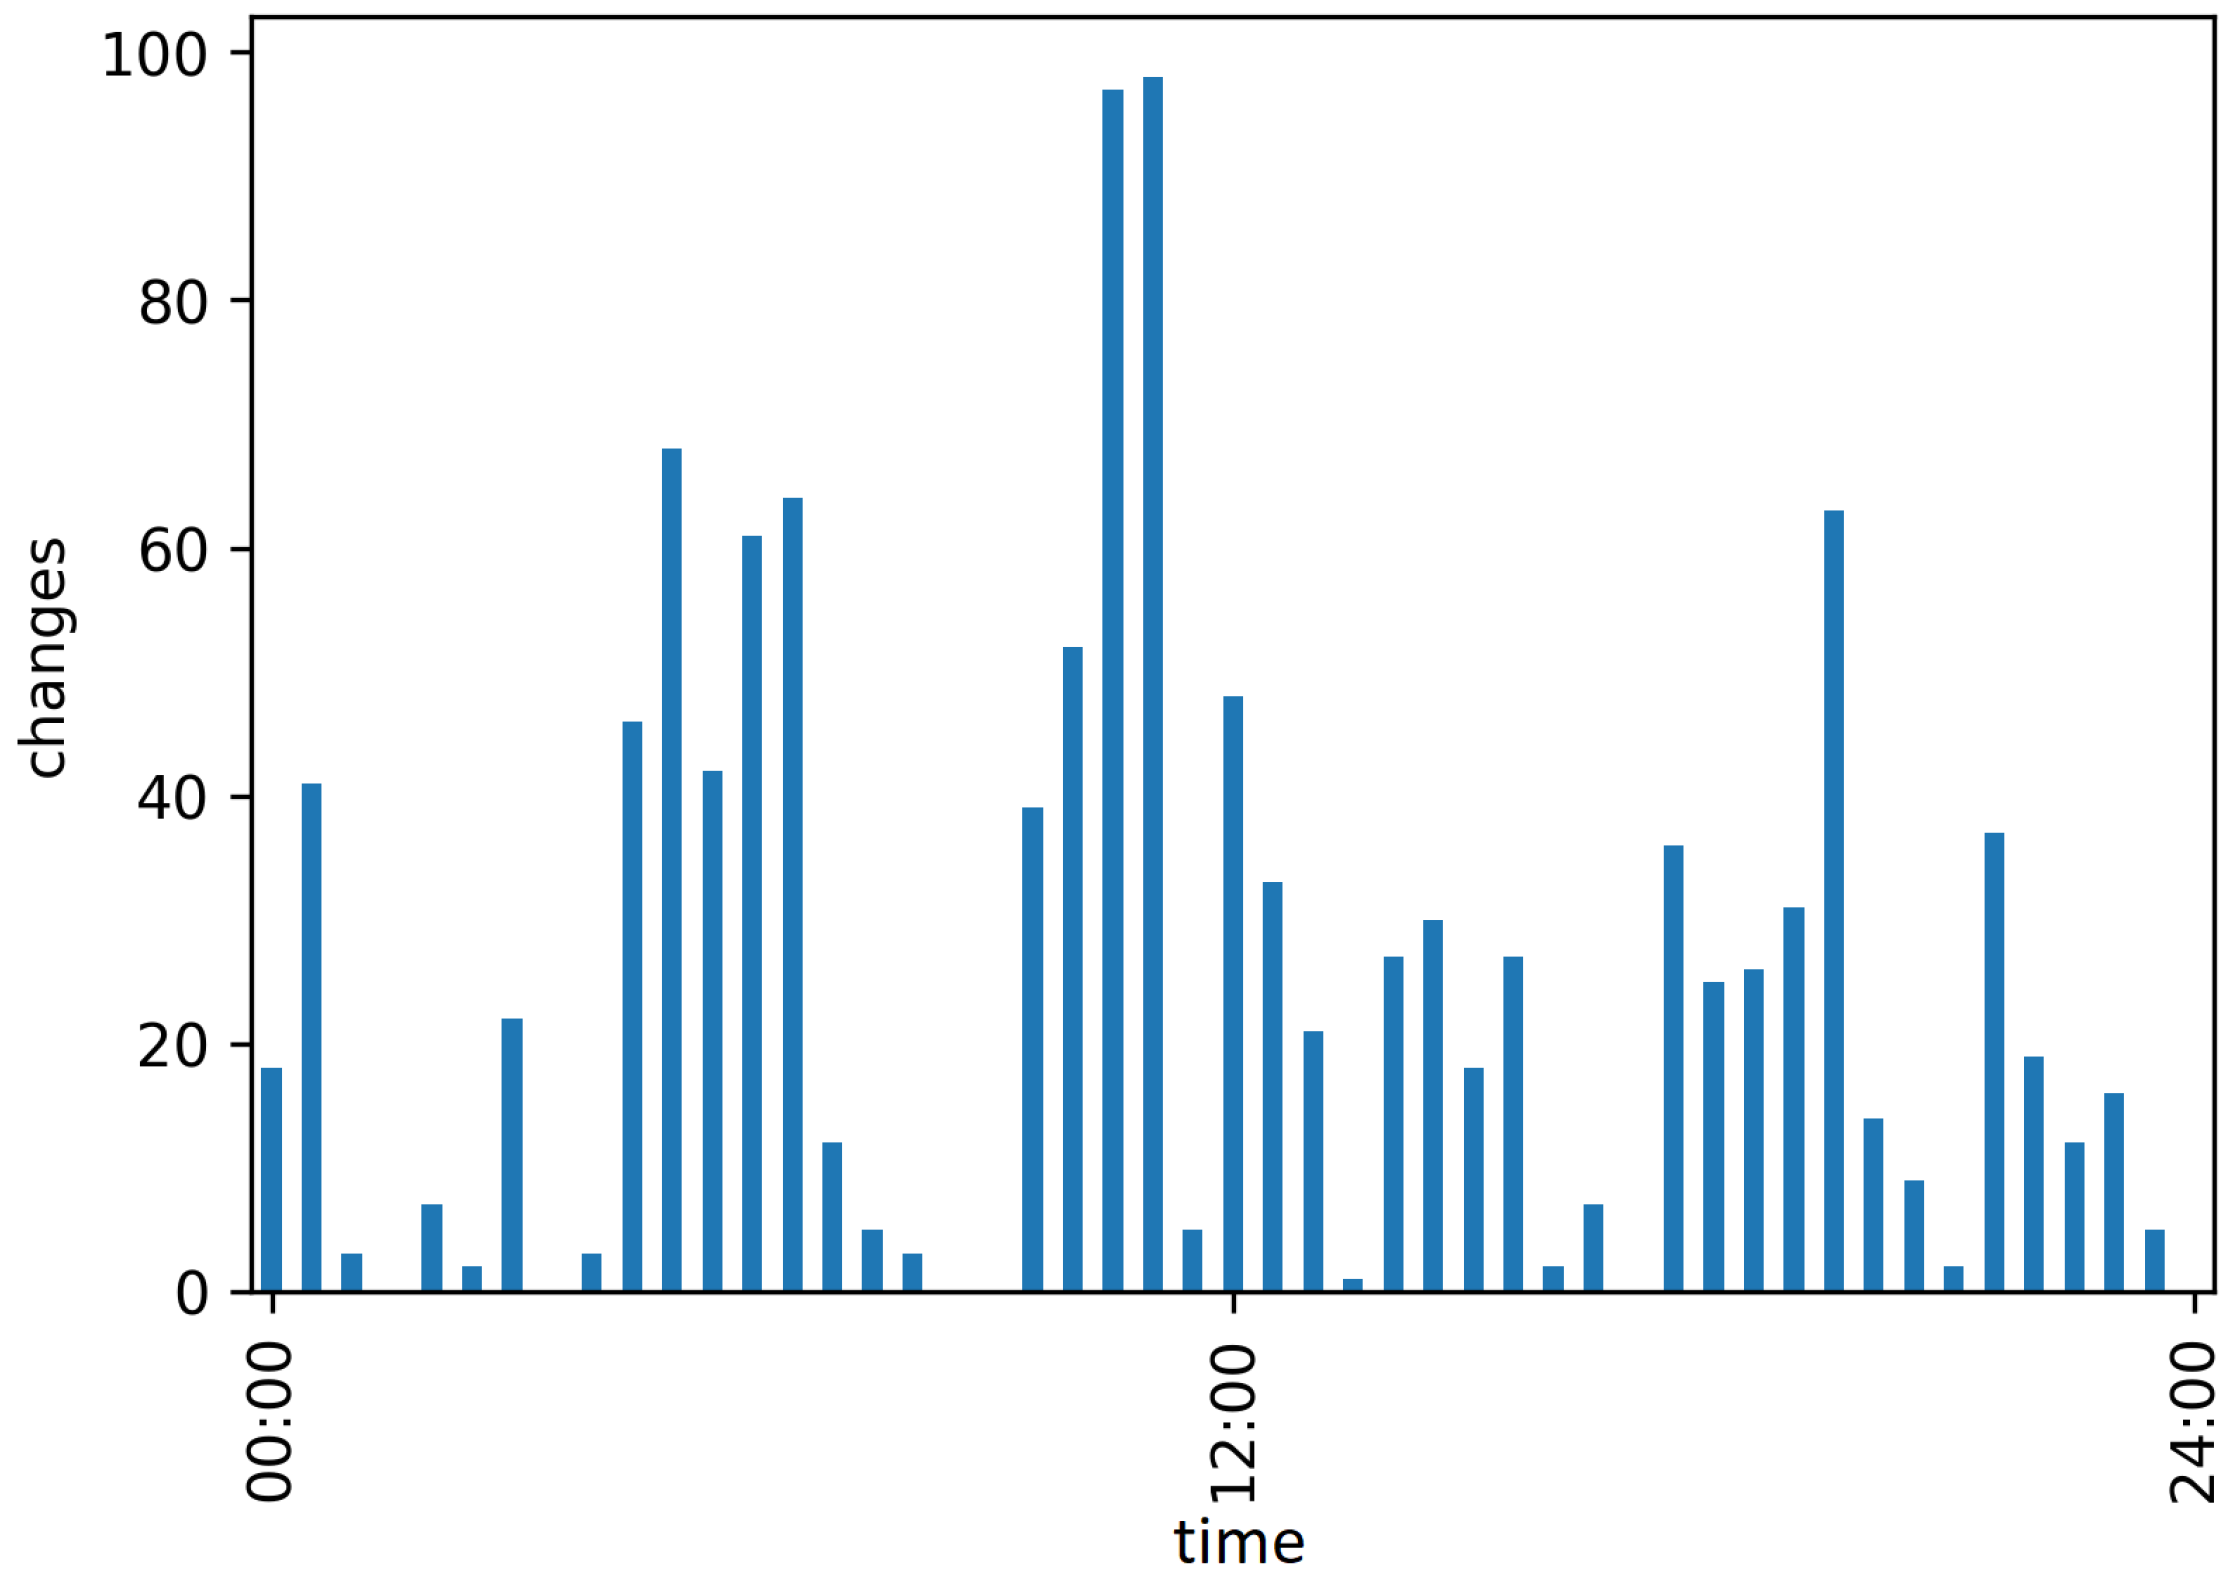
2.8. Automatic Evaluation: Behavior Analysis
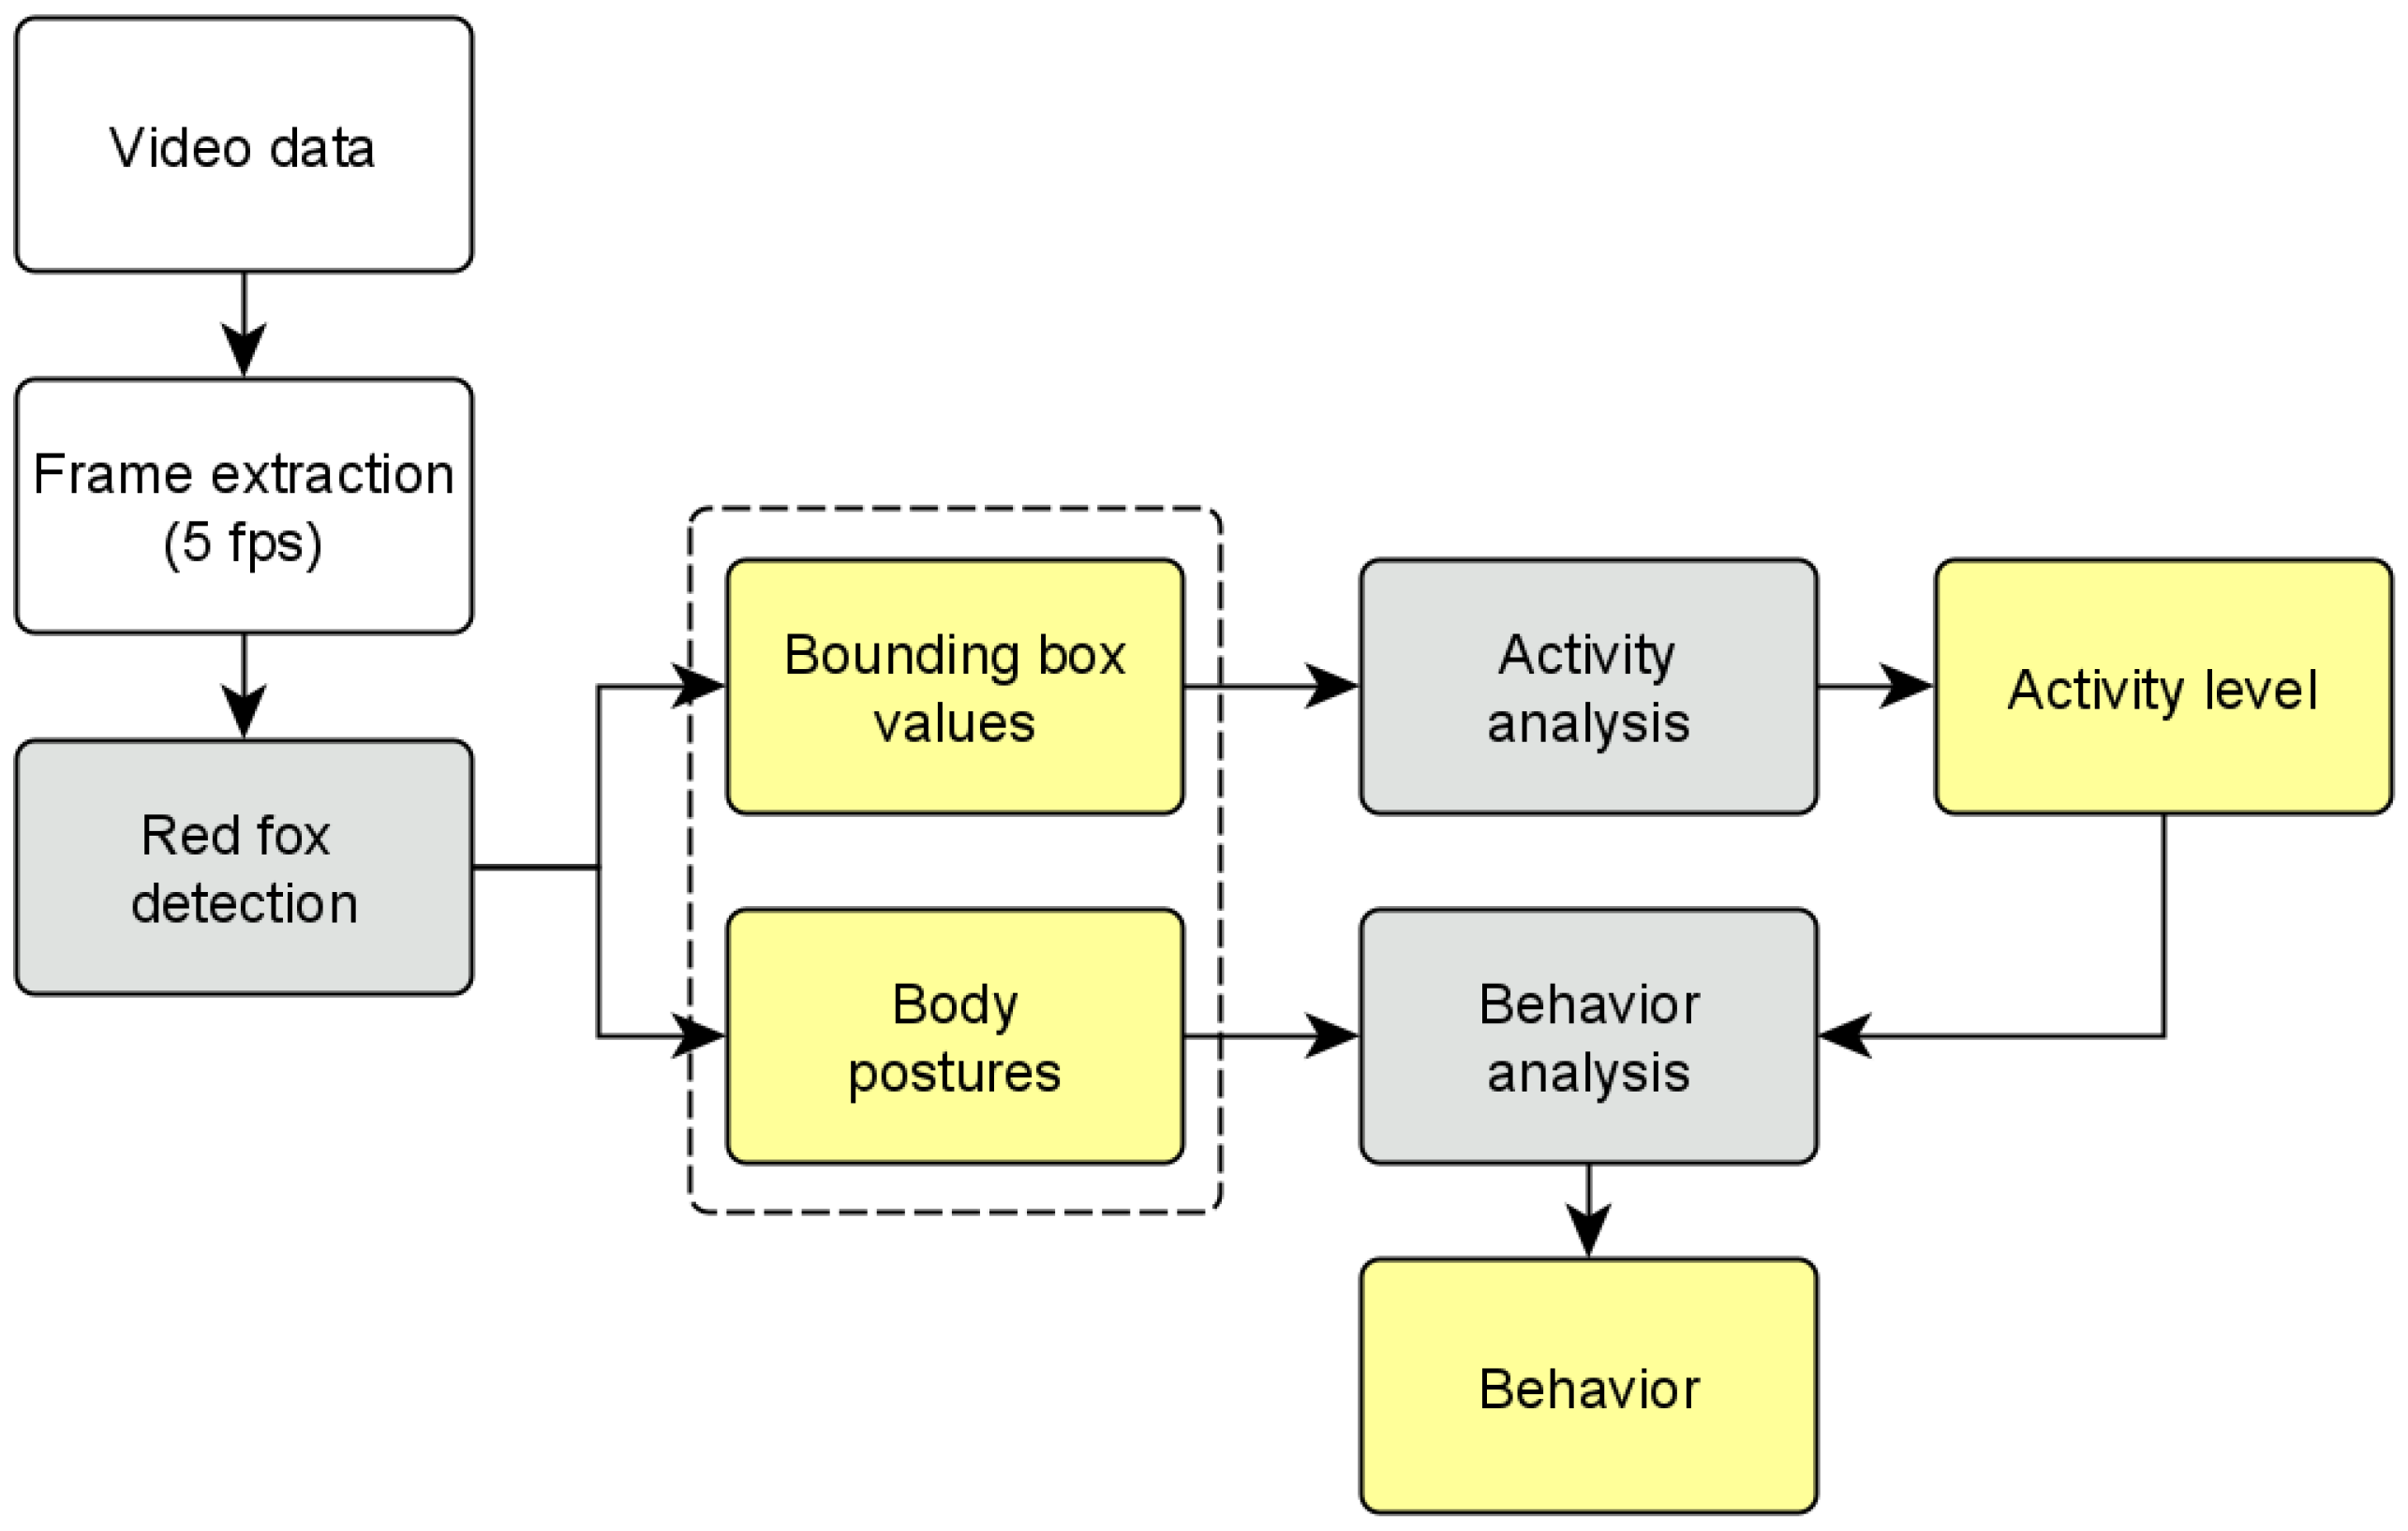
2.9. Workflow for Automated Video Evaluation
- Frame extraction (5 frames per second);
- Red fox posture detection on each frame;
- Activity analysis using the values for the activity level determination;
- Behavior analysis using the posture and activity level for the behavior classification.
3. Results
3.1. Model Training and Evaluation
3.1.1. Activity Detection
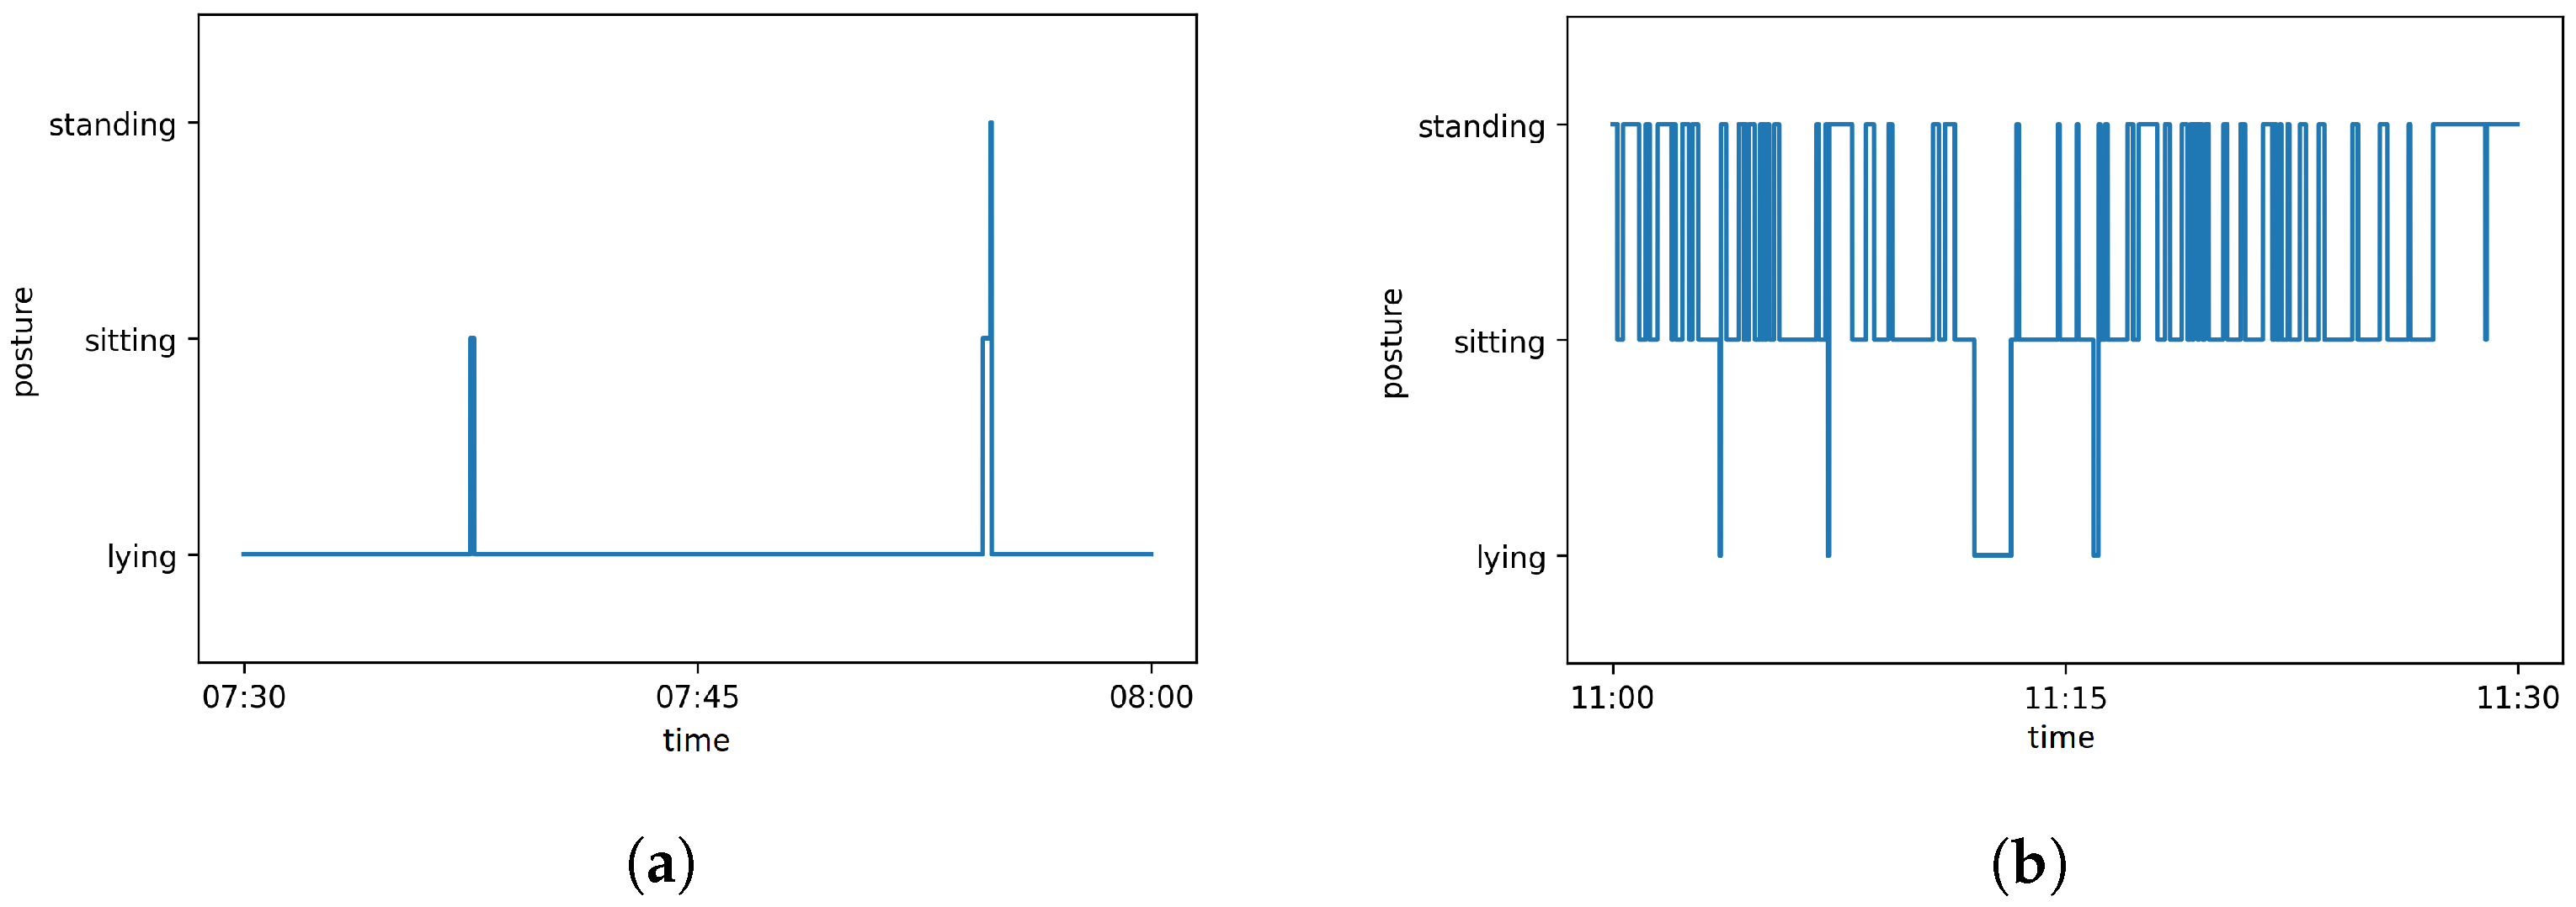
3.1.2. Posture Detection
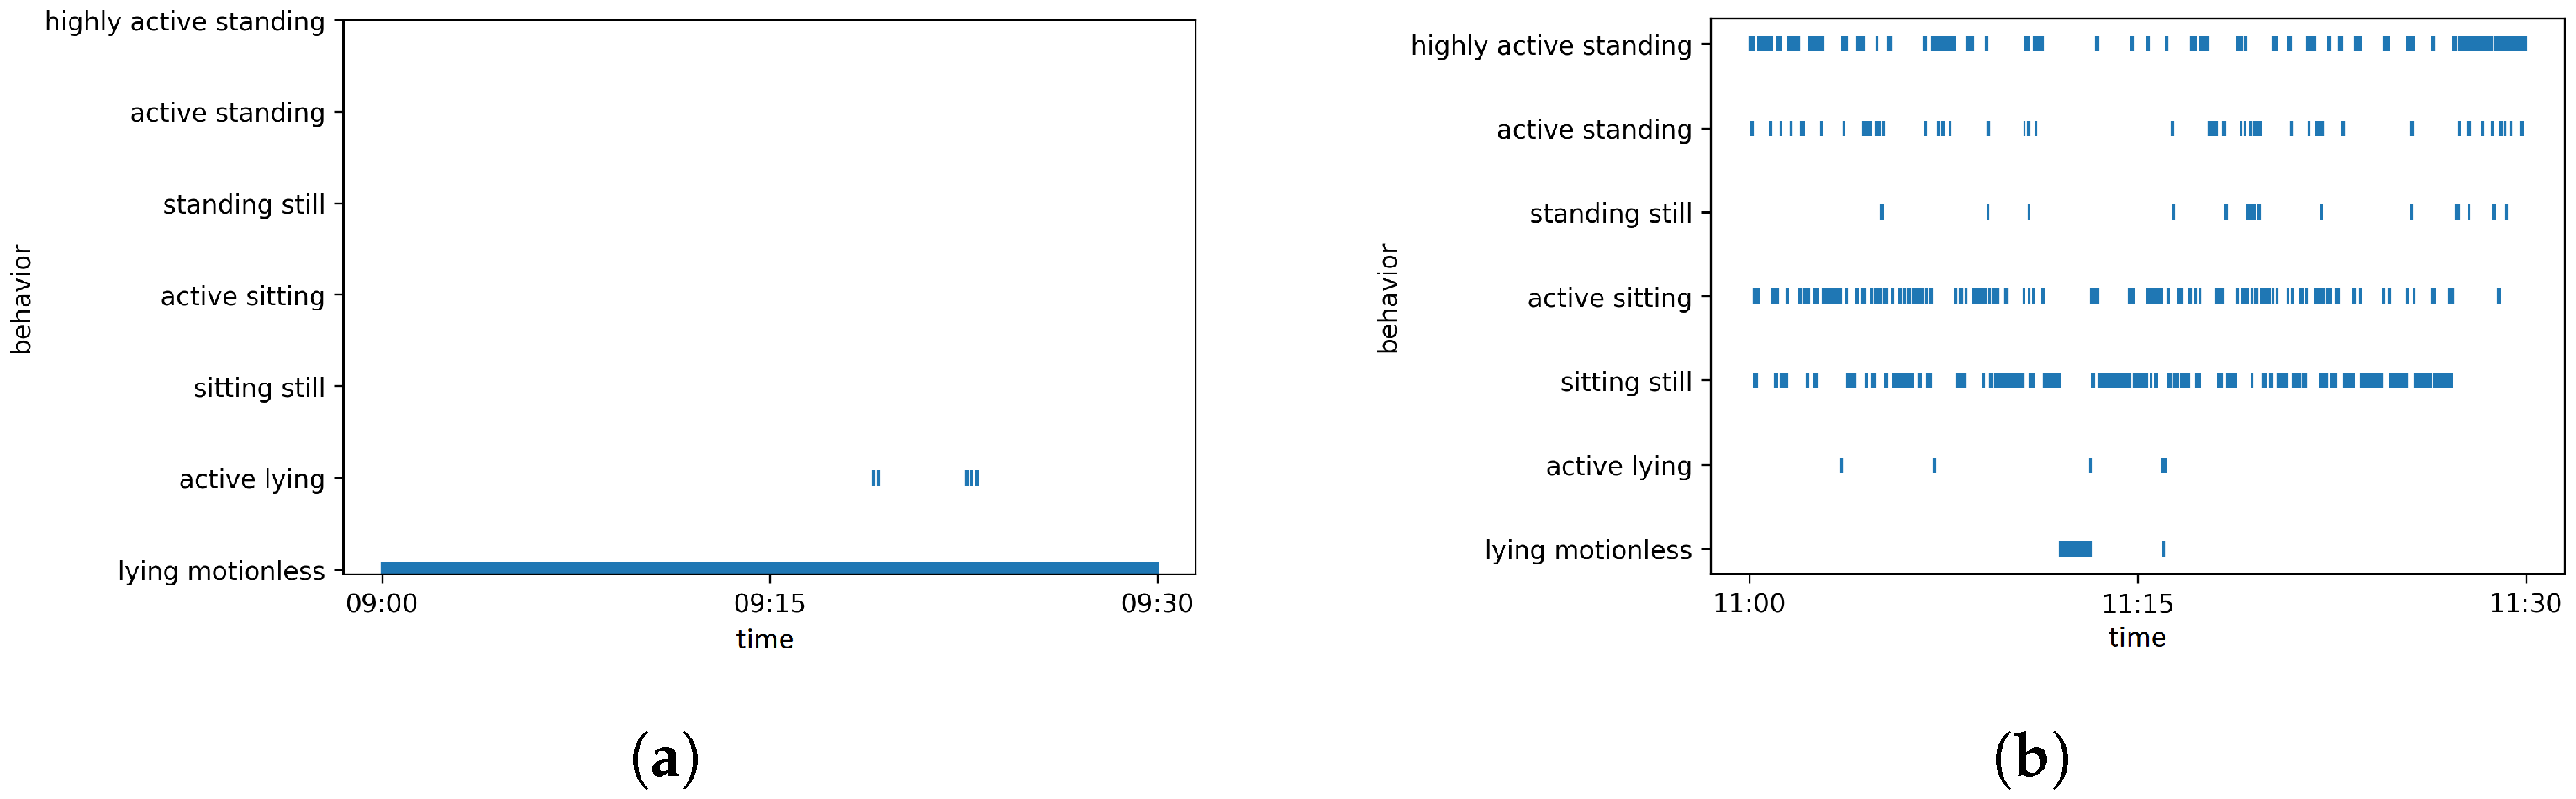
3.1.3. Behavior Detection
4. Discussion
5. Conclusions
Author Contributions
Funding
Institutional Review Board Statement
Informed Consent Statement
Data Availability Statement
Acknowledgments
Conflicts of Interest
Abbreviations
| average precision | |
| bounding box | |
| CNN | convolutional neural networks |
| FLI | Friedrich-Loeffler-Institut |
| false positive | |
| false negative | |
| intersection over union | |
| mean average precision | |
| true positive | |
| YOLO | you only look once |
Appendix A
- Download and extract YOLOv4 from GitHub [49].
- Copy the content of cfg/yolov4-custom.cfg to the new created file yolo-obj.cfg and change the following lines:
- line 3: batch=64
- line 4: subdivisions=1
- line 8: width=416
- line 9: height=416
- line 20: max_batches=6000 ()
- line 22: steps=4800,5400 (80 and 90% of maxbatches)
- lines 603, 689, 776: filters=24 ()
- lines 610, 696, 783: classes=3
- Create a file obj.names with the name of each object in separate lines:sitliestand
- Label each image of the image set, such that for each image there exists a .txt file with the following values for every labeled object:<object-class> <BB x_center> <BB y_center> <BB width> <BB hight>with <object-class> an integer between 0 and number of classes, and <BB x_center>, <BB y_center>, <BB width> and <BB hight> are float values between , relative to the image height and width. Thus, the directory with the images contains a .txt file for each image with the same name.Create the files train.txt and test.txt. Split the image set into a training and test set and save the file names of the images, with respect to the full path relative to the directory darknet, in the respective file (one file name per line).
- Create a file obj.data containing the number of classes and paths to train.txt, obj.names, and the backup folder:classes = 3train = data/train.txtnames = data/obj.namesbackup = backup/
- For starting the training, run the code:./darknet detector train obj.data yolo-obj.cfg yolov4.conv.137The training can take several hours. During training the trained weights are saved in the backup/ directory, yolo-obj_xxxx.weights every 1000 iterations and yolo-obj_last.weights every 100 iterations. After training the final weight, yolo-obj_final.weights is also stored there.
- Evaluate the results for trained weights:./darknet detector map obj.data yolo-obj.cfgbackup/yolo-obj_final.weights
- Using the trained detector:./darknet detector test obj.data yolo-obj.cfgbackup/yolo-obj_final.weights
References
- Farm Animal Welfare Council (FAWC). Second Report on Priorities for Research and Development in Farm Animal Welfare; DEFRA: London, UK, 1993.
- Mellor, D.J. Updating animal welfare thinking: Moving beyond the “Five Freedoms” towards “a Life Worth Living”. Animals 2016, 6, 21. [Google Scholar] [CrossRef] [PubMed]
- Webster, J. Animal welfare: Freedoms, dominions and “a life worth living”. Animals 2016, 6, 35. [Google Scholar] [CrossRef] [PubMed] [Green Version]
- Mason, G.J.; Mendl, M. Why Is There No Simple Way of Measuring Animal Welfare? Anim. Welf. 1993, 2, 301–319. [Google Scholar]
- Sénèque, E.; Lesimple, C.; Morisset, S.; Hausberger, M. Could posture reflect welfare state? A study using geometric morphometrics in riding school horses. PLoS ONE 2019, 14, e0211852. [Google Scholar] [CrossRef]
- Owczarczak-Garstecka, S.C.; Burman, O.H.P. Can Sleep and Resting Behaviours Be Used as Indicators of Welfare in Shelter Dogs (Canis lupus familiaris)? PLoS ONE 2016, 11, e0163620. [Google Scholar]
- Buller, H.; Blokhuis, H.; Lokhorst, K.; Silberberg, M.; Veissier, I. Animal Welfare Management in a Digital World. Animals 2020, 10, 1779. [Google Scholar] [CrossRef]
- Müller, R.; Schrader, L. A new method to measure behavioural activity levels in dairy cows. Appl. Anim. Behav. Sci. 2003, 83, 247–258. [Google Scholar] [CrossRef]
- White, B.J.; Coetzee, J.F.; Renter, D.G.; Babcock, A.H.; Thomson, D.U.; Andresen, D. Evaluation of two-dimensional accelerometers to monitor behavior of beef calves after castration. Am. J. Vet. Res. 2008, 69, 1005–1012. [Google Scholar] [CrossRef]
- Dutta, R.; Smith, D.; Rawnsley, R.; Bishop-Hurley, G.; Hills, J.; Timms, G.; Henry, D. Dynamic cattle behavioural classification using supervised ensemble classifiers. Comput. Electron. Agric. 2015, 111, 18–28. [Google Scholar] [CrossRef]
- Dawkins, M.S. Behaviour as a tool in the assessment of animal welfare. Zoology 2003, 106, 383–387. [Google Scholar] [CrossRef]
- Matthews, S.G.; Miller, A.L.; Clapp, J.; Plötz, T.; Kyriazakis, I. Early detection of health and welfare compromises through automated detection of behavioural changes in pigs. Vet. J. 2016, 217, 43–51. [Google Scholar] [CrossRef] [PubMed] [Green Version]
- Fureix, C.; Hausberger, M.; Seneque, E.; Morisset, S.; Baylac, M.; Cornette, R.; Biquand, V.; Deleporte, P. Geometric morphometrics as a tool for improving the comparative study of behavioural postures. Naturwissenschaften 2011, 98, 583–592. [Google Scholar] [CrossRef] [PubMed] [Green Version]
- Hosey, G. Hediger revisited: How do zoo animals see us? J. Appl. Anim. Welf. Sci. JAAWS 2013, 16, 338–359. [Google Scholar] [CrossRef]
- Hemsworth, P.H.; Barnett, J.L.; Coleman, G.J. The Human-Animal Relationship in Agriculture and its Consequences for the Animal. Anim. Welf. 1993, 2, 33–51. [Google Scholar]
- Sorge, R.E.; Martin, L.J.; Isbester, K.A.; Sotocinal, S.G.; Rosen, S.; Tuttle, A.H.; Wieskopf, J.S.; Acland, E.L.; Dokova, A.; Kadoura, B.; et al. Olfactory exposure to males, including men, causes stress and related analgesia in rodents. Nat. Methods 2014, 11, 629–632. [Google Scholar] [CrossRef] [PubMed]
- Frost, A.R.; Parsons, D.J.; Stacey, K.F.; Robertson, A.P.; Welch, S.K.; Filmer, D.; Fothergill, A. Progress towards the development of an integrated management system for broiler chicken production. Comput. Electron. Agric. 2003, 39, 227–240. [Google Scholar] [CrossRef]
- Mendl, M.; Burman, O.H.; Parker, R.M.; Paul, E.S. Cognitive bias as an indicator of animal emotion and welfare: Emerging evidence and underlying mechanisms. Appl. Anim. Behav. Sci. 2009, 118, 161–181. [Google Scholar] [CrossRef]
- Oh, J.; Fitch, W.T. CATOS (Computer Aided Training/Observing System): Automating animal observation and training. Behav. Res. Methods 2017, 49, 13–23. [Google Scholar] [CrossRef]
- Robert, B.; White, B.J.; Renter, D.G.; Larson, R.L. Evaluation of three-dimensional accelerometers to monitor and classify behavior patterns in cattle. Comput. Electron. Agric. 2009, 67, 80–84. [Google Scholar] [CrossRef]
- Kaler, J.; Mitsch, J.; Vázquez-Diosdado, J.A.; Bollard, N.; Dottorini, T.; Ellis, K.A. Automated detection of lameness in sheep using machine learning approaches: Novel insights into behavioural differences among lame and non-lame sheep. R. Soc. Open Sci. 2020, 7, 190824. [Google Scholar] [CrossRef] [Green Version]
- Diosdado, J.A.V.; Barker, Z.E.; Hodges, H.R.; Amory, J.R.; Croft, D.P.; Bell, N.J.; Codling, E.A. Classification of behaviour in housed dairy cows using an accelerometer-based activity monitoring system. Anim. Biotelem. 2015, 3, 15. [Google Scholar] [CrossRef] [Green Version]
- Naguib, M.; Krause, E.T. Methoden der Verhaltensbiologie, 2nd ed.; Springer Spektrum: Berlin/Heidelberg, Germany, 2020. [Google Scholar]
- Iserbyt, A.; Griffioen, M.; Borremans, B.; Eens, M.; Müller, W. How to quantify animal activity from radio-frequency identification (RFID) recordings. Ecol. Evol. 2018, 8, 10166–10174. [Google Scholar] [CrossRef] [PubMed]
- Will, M.K.; Büttner, K.; Kaufholz, T.; Müller-Graf, C.; Selhorst, T.; Krieter, J. Accuracy of a real-time location system in static positions under practical conditions: Prospects to track group-housed sows. Comput. Electron. Agric. 2017, 142, 473–484. [Google Scholar] [CrossRef]
- Nasirahmadi, A.; Edwards, S.A.; Sturm, B. Implementation of machine vision for detecting behaviour of cattle and pigs. Livest. Sci. 2017, 202, 25–38. [Google Scholar] [CrossRef] [Green Version]
- Valletta, J.J.; Torney, C.; Kings, M.; Thornton, A.; Madden, J. Applications of machine learning in animal behaviour studies. Anim. Behav. 2017, 124, 203–220. [Google Scholar] [CrossRef]
- Nasirahmadi, A.; Sturm, B.; Edwards, S.; Jeppsson, K.H.; Olsson, A.C.; Müller, S.; Hensel, O. Deep Learning and Machine Vision Approaches for Posture Detection of Individual Pigs. Sensors 2019, 19, 3738. [Google Scholar] [CrossRef] [PubMed] [Green Version]
- Yang, A.; Huang, H.; Zheng, B.; Li, S.; Gan, H.; Chen, C.; Yang, X.; Xue, Y. An automatic recognition framework for sow daily behaviours based on motion and image analyses. Biosyst. Eng. 2020, 192, 56–71. [Google Scholar] [CrossRef]
- Redmon, J.; Divvala, S.; Girshick, R.; Farhadi, A. You Only Look Once: Unified, Real-Time Object Detection; Cornell University: Ithaca, NY, USA, 2016; Available online: https://arxiv.org/abs/1506.02640 (accessed on 10 January 2022).
- Wang, J.; Wang, N.; Li, L.; Ren, Z. Real-time behavior detection and judgment of egg breeders based on YOLO v3. Neural Comput. Appl. 2020, 32, 5471–5481. [Google Scholar] [CrossRef]
- Jiang, M.; Rao, Y.; Zhang, J.; Shen, Y. Automatic behavior recognition of group-housed goats using deep learning. Comput. Electron. Agric. 2020, 177, 105706. [Google Scholar] [CrossRef]
- Schütz, A.K.; Schöler, V.; Krause, E.T.; Fischer, M.; Müller, T.; Freuling, C.M.; Conraths, F.J.; Stanke, M.; Homeier-Bachmann, T.; Lentz, H.H.K. Application of YOLOv4 for Detection and Motion Monitoring of Red Foxes. Animals 2021, 11, 1723. [Google Scholar] [CrossRef] [PubMed]
- Freuling, C.M.; Kamp, V.T.; Klein, A.; Günther, M.; Zaeck, L.; Potratz, M.; Eggerbauer, E.; Bobe, K.; Kaiser, C.; Kretzschmar, A.; et al. Long-Term Immunogenicity and Efficacy of the Oral Rabies Virus Vaccine Strain SPBN GASGAS in Foxes. Viruses 2019, 11, 790. [Google Scholar] [CrossRef] [Green Version]
- Kukekova, A.V.; Trut, L.N.; Oskina, I.N.; Johnson, J.L.; Temnykh, S.V.; Kharlamova, A.V.; Shepeleva, D.V.; Gulievich, R.G.; Shikhevich, S.G.; Graphodatsky, A.S.; et al. A meiotic linkage map of the silver fox, aligned and compared to the canine genome. Genome Res. 2007, 17, 387–399. [Google Scholar] [CrossRef] [PubMed] [Green Version]
- Thurmon, J.C.; Tranquilli, W.J.; Benson, G.J.; Lumb, W.V. Lumb & Jones’ Veterinary Anesthesia, 3rd ed.; Williams & Wilkins: Baltimore, MD, USA, 1996; pp. 241–296. [Google Scholar]
- Voipio, H.M.; Baneux, P.; Gomez de Segura, I.A.; Hau, J.; Wolfensohn, S. Guidelines for the veterinary care of laboratory animals: Report of the FELASA/ECLAM/ESLAV Joint Working Group on Veterinary Care. Lab. Anim. 2008, 42, 1–11. [Google Scholar]
- Tzutalin, D. LabelImg: Git Code. 2015. Available online: https://github.com/tzutalin/labelImg (accessed on 10 January 2022).
- Kluyver, T.; Ragan-Kelley, B.; Pérez, F.; Granger, B.E.; Bussonnier, M.; Frederic, J.; Kelley, K.; Hamrick, J.B.; Grout, J.; Corlay, S.; et al. Jupyter Notebooks—A publishing format for reproducible computational workflows. Stand Alone 2016, 2016, 87–90. [Google Scholar]
- van Rossum, G.; Drake, F.L., Jr. The Python Language Reference; Python Software Foundation: Wilmington, DE, USA, 2014. [Google Scholar]
- Redmon, J.; Farhadi, A. YOLOv3: An Incremental Improvement; Cornell University: Ithaca, NY, USA, 2018; Available online: https://arxiv.org/abs/1804.02767 (accessed on 10 January 2022).
- Bochkovskiy, A.; Wang, C.Y.; Liao, H.Y.M. YOLOv4: Optimal Speed and Accuracy of Object Detection; Cornell University: Ithaca, NY, USA, 2020; Available online: https://arxiv.org/abs/2004.10934 (accessed on 10 January 2022).
- Everingham, M.; van Gool, L.; Williams, C.K.I.; Winn, J.; Zisserman, A. The Pascal Visual Object Classes (VOC) Challenge. Int. J. Comput. Vis. 2010, 88, 303–338. [Google Scholar] [CrossRef] [Green Version]
- Fernández-Carrión, E.; Barasona, J.Á.; Sánchez, Á.; Jurado, C.; Cadenas-Fernández, E.; Sánchez-Vizcaíno, J.M. Computer Vision Applied to Detect Lethargy through Animal Motion Monitoring: A Trial on African Swine Fever in Wild Boar. Animals 2020, 10, 2241. [Google Scholar] [CrossRef] [PubMed]
- Rushen, J.; Chapinal, N.; De Passille, A. Automated monitoring of behavioural-based animal welfare indicators. Anim. Welf.-UFAW J. 2012, 21, 339. [Google Scholar] [CrossRef]
- Fernández-Carrión, E.; Martínez-Avilés, M.; Ivorra, B.; Martínez-López, B.; Ramos, Á.M.; Sánchez-Vizcaíno, J.M. Motion-based video monitoring for early detection of livestock diseases: The case of African swine fever. PLoS ONE 2017, 12, e0183793. [Google Scholar] [CrossRef] [PubMed] [Green Version]
- Rice, C.A.; Eberhart, N.L.; Krawczel, P.D. Prepartum Lying Behavior of Holstein Dairy Cows Housed on Pasture through Parturition. Animals 2017, 7, 32. [Google Scholar] [CrossRef] [Green Version]
- Speroni, M.; Malacarne, M.; Righi, F.; Franceschi, P.; Summer, A. Increasing of Posture Changes as Indicator of Imminent Calving in Dairy Cows. Agriculture 2018, 8, 182. [Google Scholar] [CrossRef] [Green Version]
- GitHub. AlexeyAB/darknet, 22 November 2021. Available online: https://github.com/AlexeyAB/darknet (accessed on 10 January 2022).


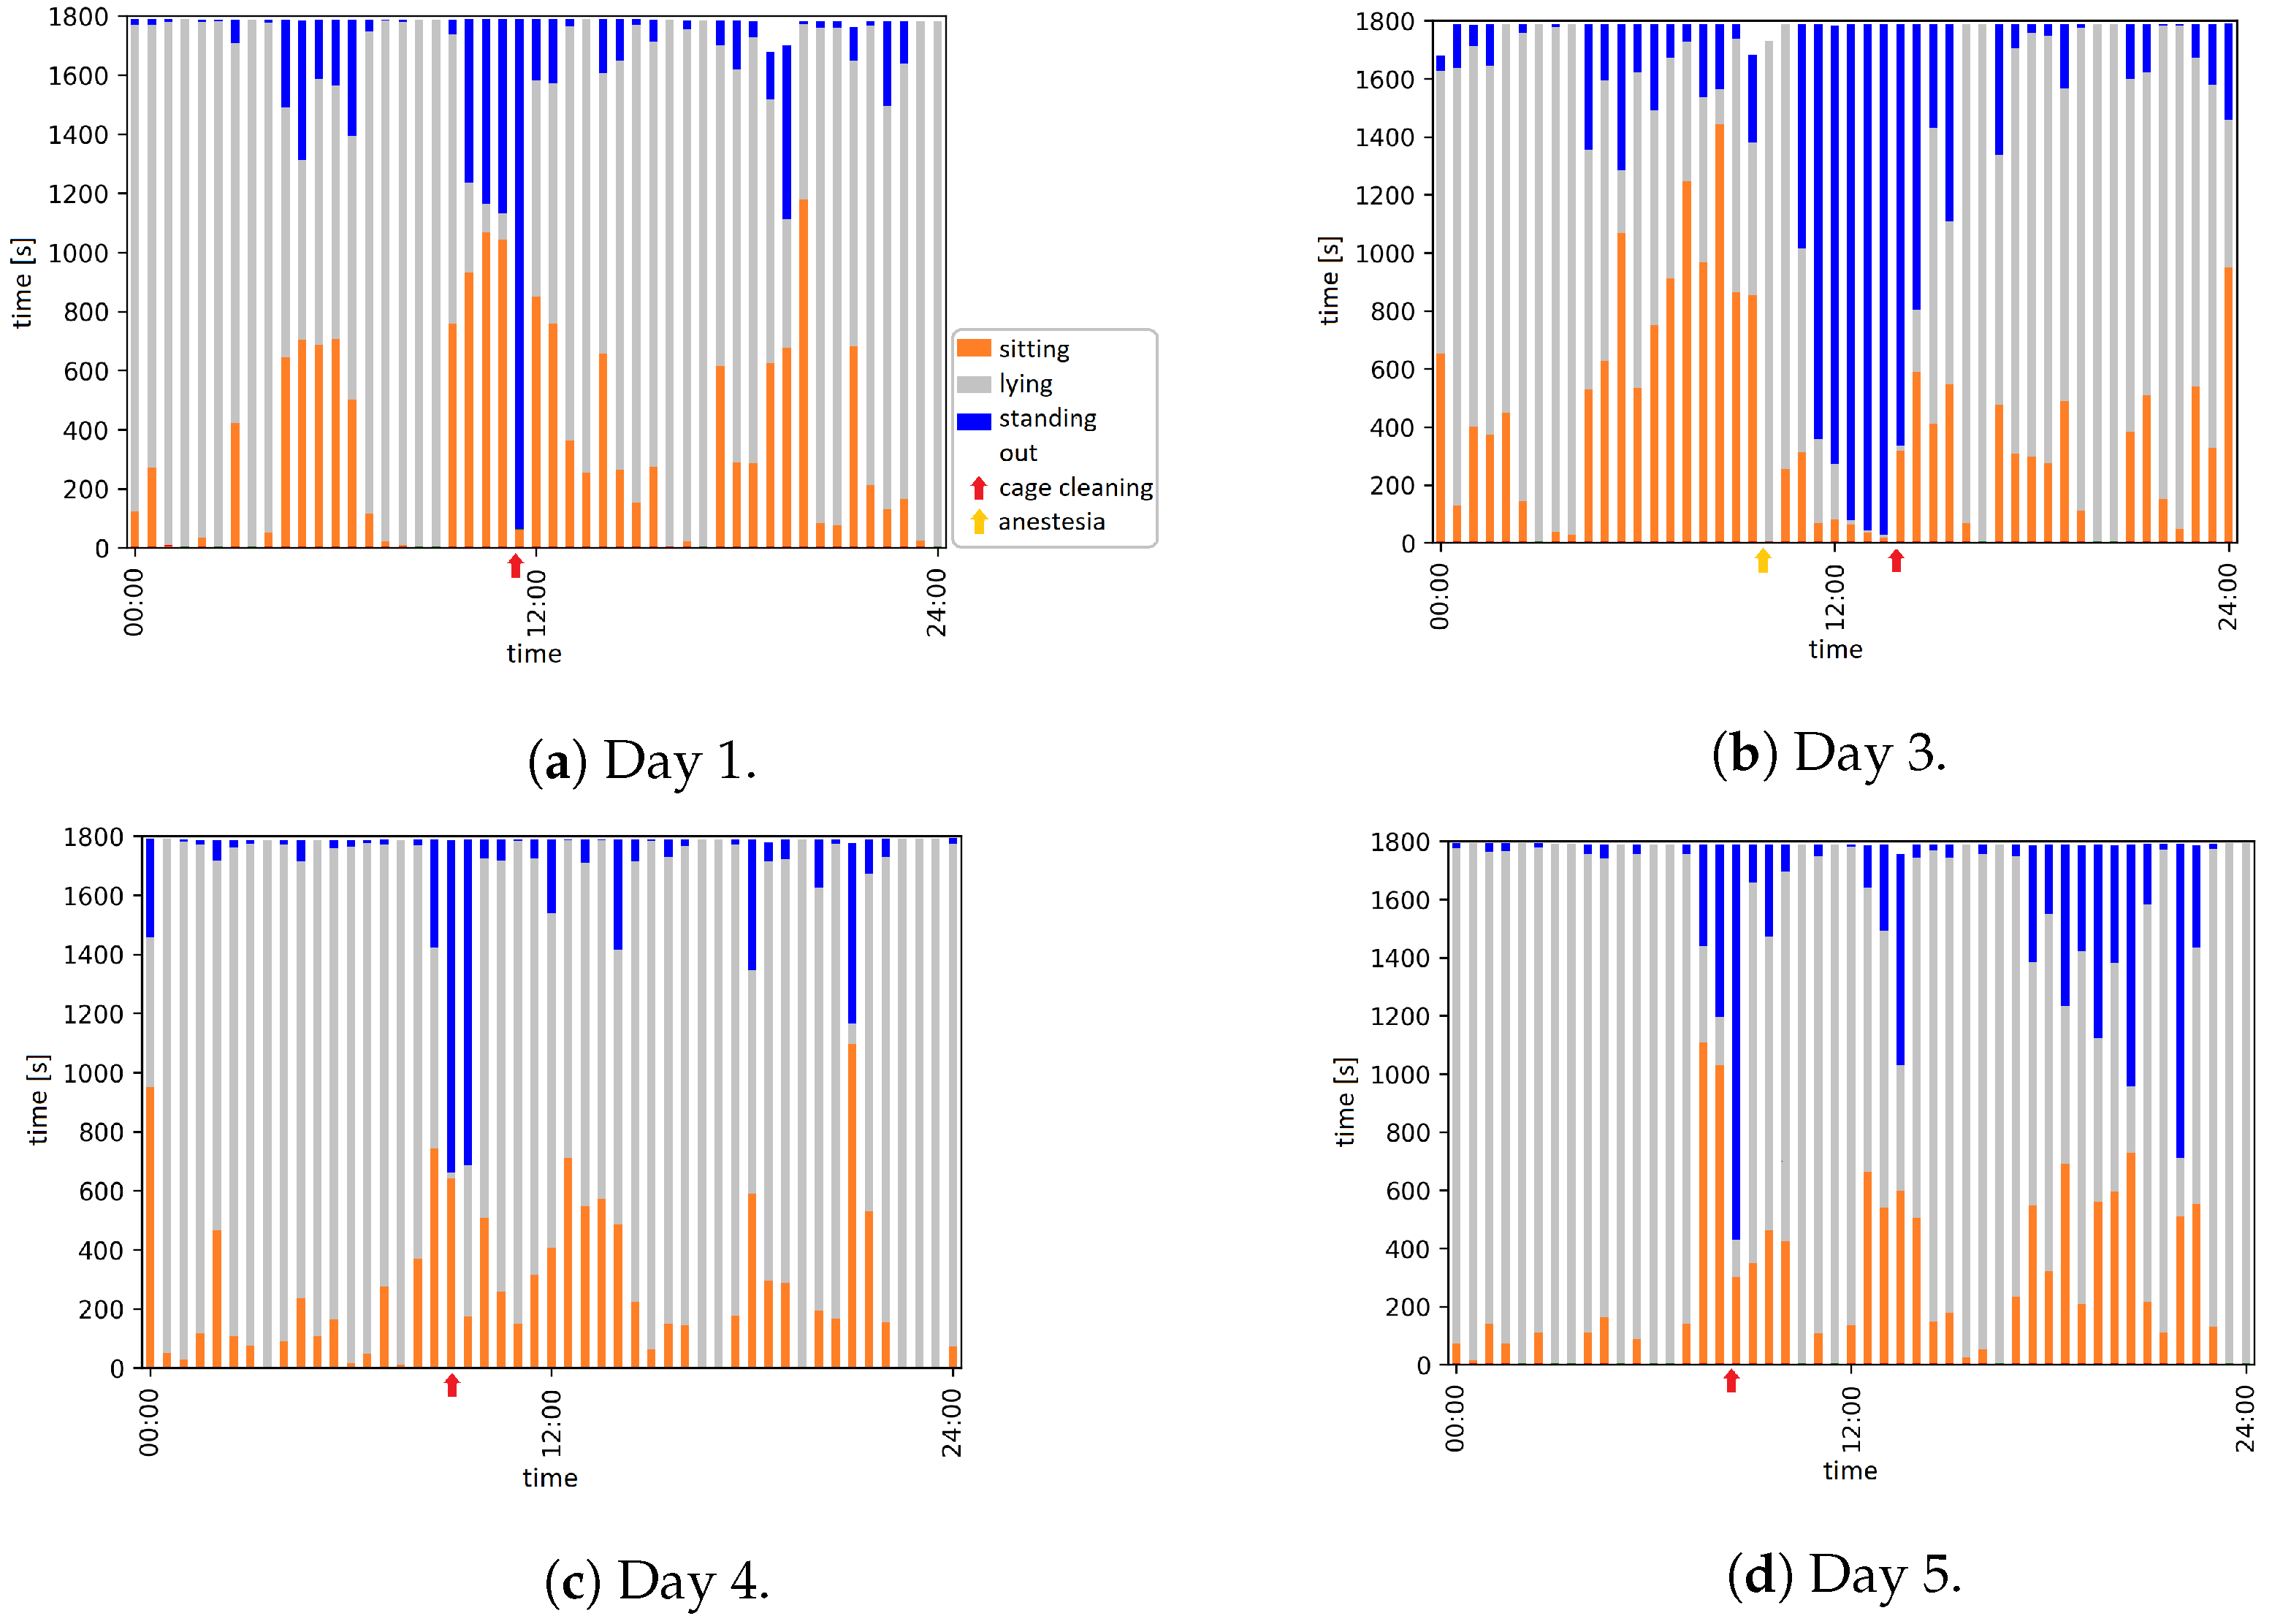
| Day | Time | Event |
|---|---|---|
| 1 | 11:30 to 11:55 | Animal caretaker is in the room and cleans the cage |
| 3 | 09:56 | Anesthesia |
| 13:59 to 14:09 | Animal caretaker is in the room and cleans the cage | |
| 4 | 09:18 to 09:31 | Animal caretaker is in the room and cleans the cage |
| 5 | 08:22 to 08:34 | Animal caretaker is in the room and cleans the cage |
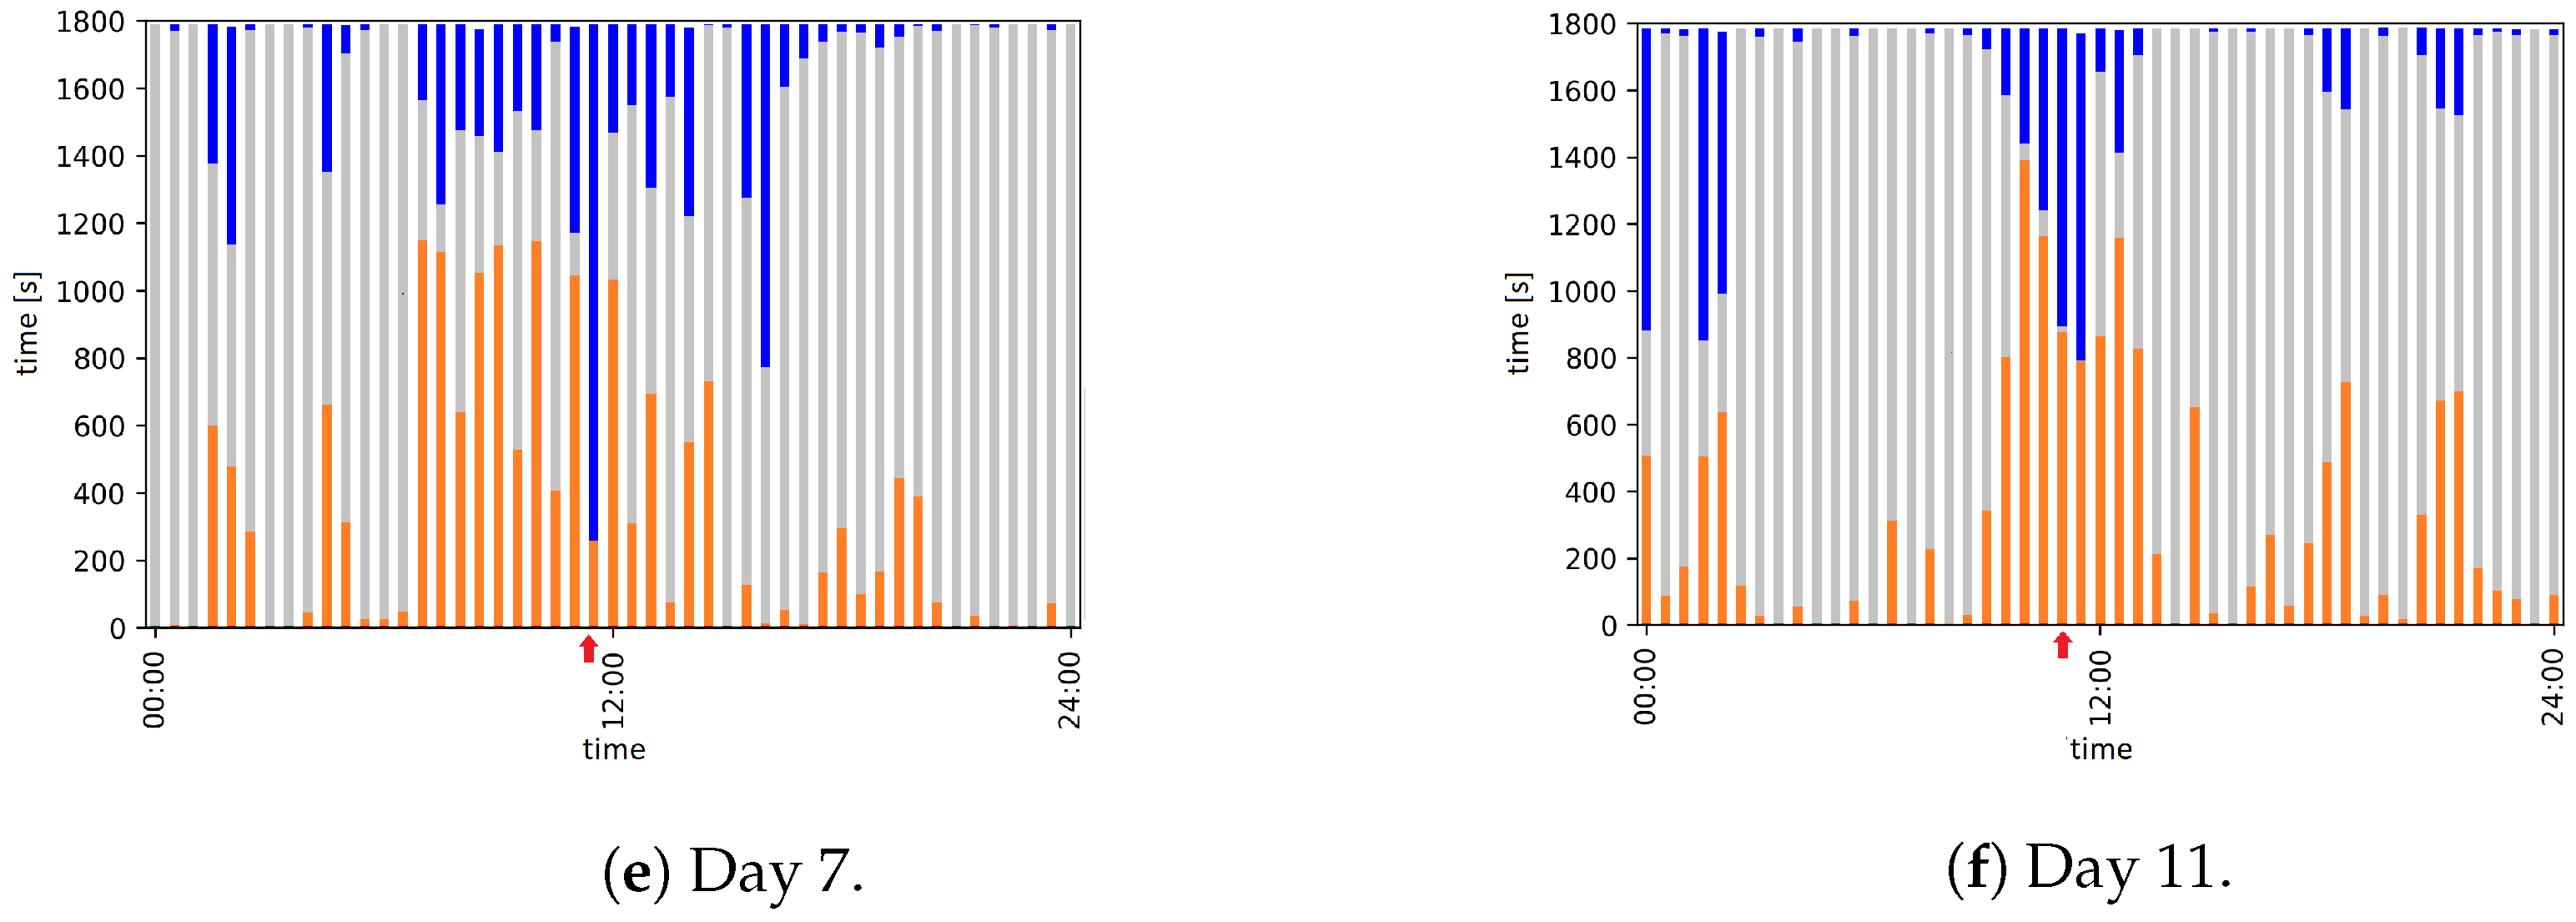
| 7 | 11:30 to 11:55 | Animal caretaker is in the room and cleans the cage |
| 11 | 11:18 to 11:34 | Animal caretaker is in the room and cleans the cage |
| Total | Lying | Sitting | Standing | |
|---|---|---|---|---|
| Training set | 7129 frames | 775 frames | 3688 frames | 2370 frames |
| Test set | 1784 frames | 194 frames | 922 frames | 593 frames |
| Parameter | Value |
|---|---|
| Input size | |
| Classes | 3 |
| Maxbatches | 6000 |
| Filters | 24 |
| Steps | 4800, 5400 |
| Learning rate | |
| Batch size | 64 |
| Class | ||||
|---|---|---|---|---|
| Sitting | % | % | % | |
| Lying | % | % | % | |
| Standing | % | % | % |
| Detection Speed | ||||
|---|---|---|---|---|
| % | % | % | 73.31 ms |
Publisher’s Note: MDPI stays neutral with regard to jurisdictional claims in published maps and institutional affiliations. |
© 2022 by the authors. Licensee MDPI, Basel, Switzerland. This article is an open access article distributed under the terms and conditions of the Creative Commons Attribution (CC BY) license (https://creativecommons.org/licenses/by/4.0/).
Share and Cite
Schütz, A.K.; Krause, E.T.; Fischer, M.; Müller, T.; Freuling, C.M.; Conraths, F.J.; Homeier-Bachmann, T.; Lentz, H.H.K. Computer Vision for Detection of Body Posture and Behavior of Red Foxes. Animals 2022, 12, 233. https://doi.org/10.3390/ani12030233
Schütz AK, Krause ET, Fischer M, Müller T, Freuling CM, Conraths FJ, Homeier-Bachmann T, Lentz HHK. Computer Vision for Detection of Body Posture and Behavior of Red Foxes. Animals. 2022; 12(3):233. https://doi.org/10.3390/ani12030233
Chicago/Turabian StyleSchütz, Anne K., E. Tobias Krause, Mareike Fischer, Thomas Müller, Conrad M. Freuling, Franz J. Conraths, Timo Homeier-Bachmann, and Hartmut H. K. Lentz. 2022. "Computer Vision for Detection of Body Posture and Behavior of Red Foxes" Animals 12, no. 3: 233. https://doi.org/10.3390/ani12030233
APA StyleSchütz, A. K., Krause, E. T., Fischer, M., Müller, T., Freuling, C. M., Conraths, F. J., Homeier-Bachmann, T., & Lentz, H. H. K. (2022). Computer Vision for Detection of Body Posture and Behavior of Red Foxes. Animals, 12(3), 233. https://doi.org/10.3390/ani12030233