
The Spatial Distribution of the House Mouse, Mus musculus domesticus, in Multi-Family Dwellings

 ,
, 

Abstract
:Simple Summary
Abstract
1. Introduction
2. Materials and Methods
2.1. Study Sites
2.2. Building-Wide Monitoring
2.3. Data Analysis
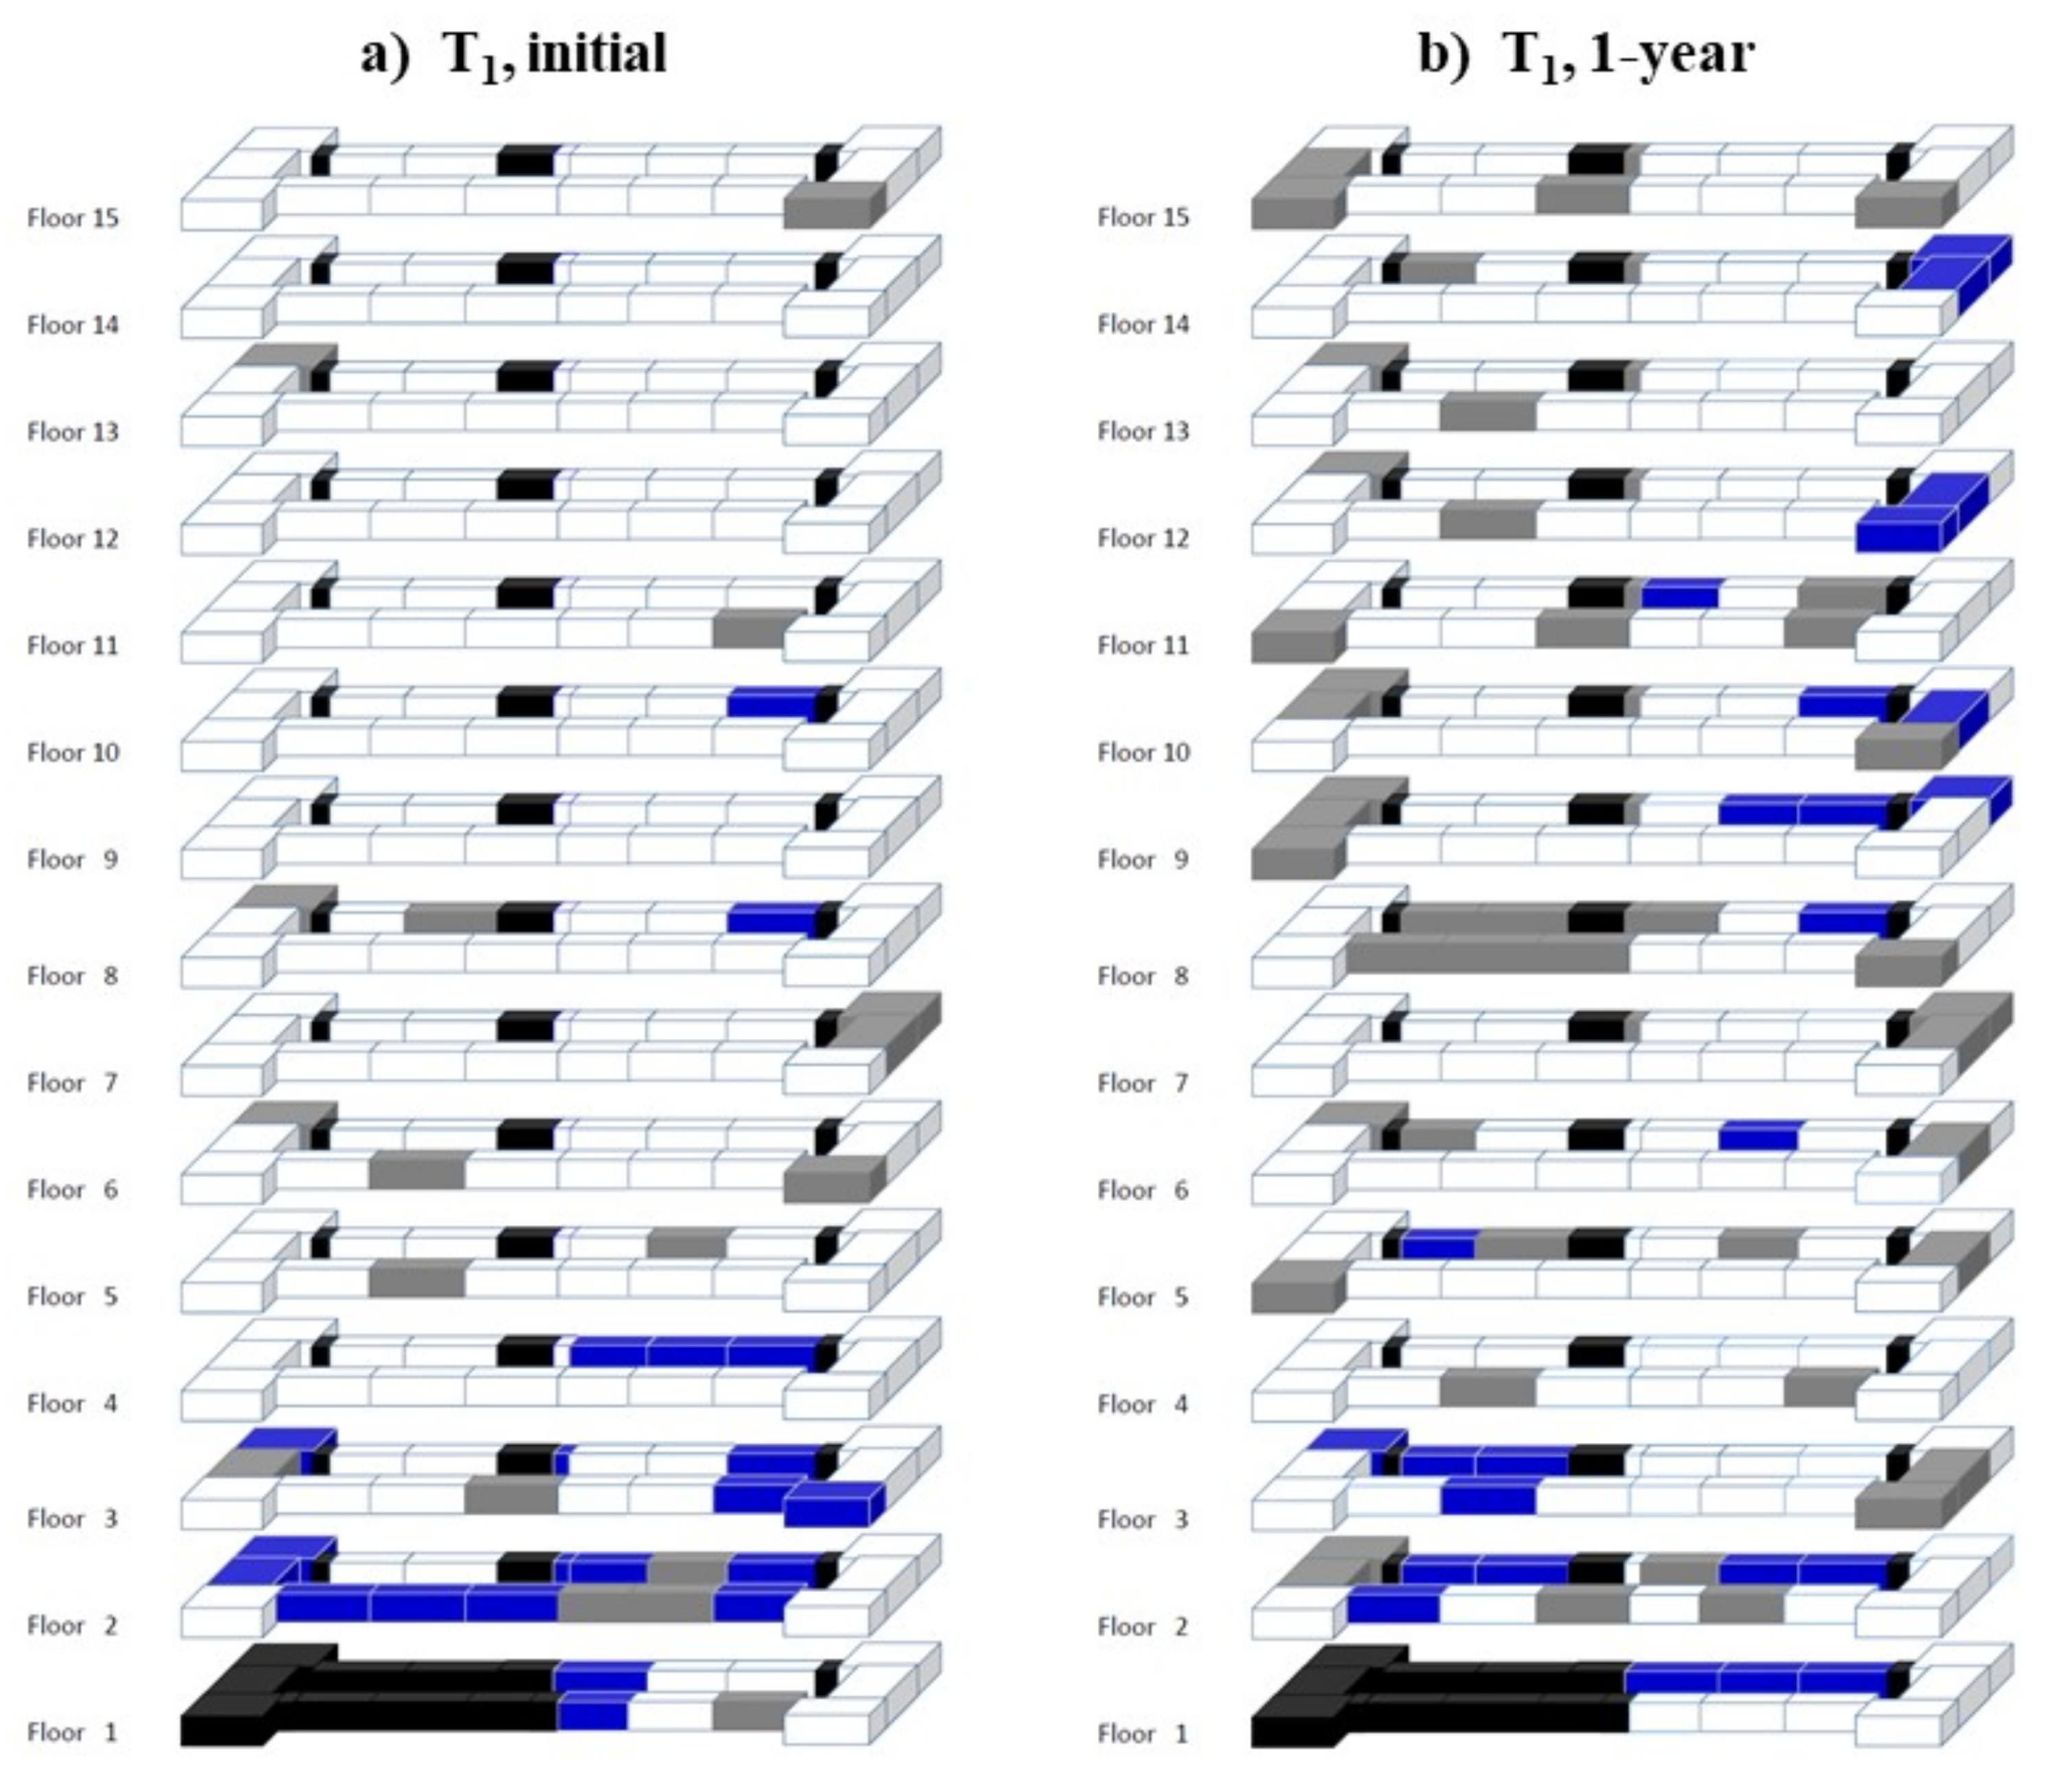
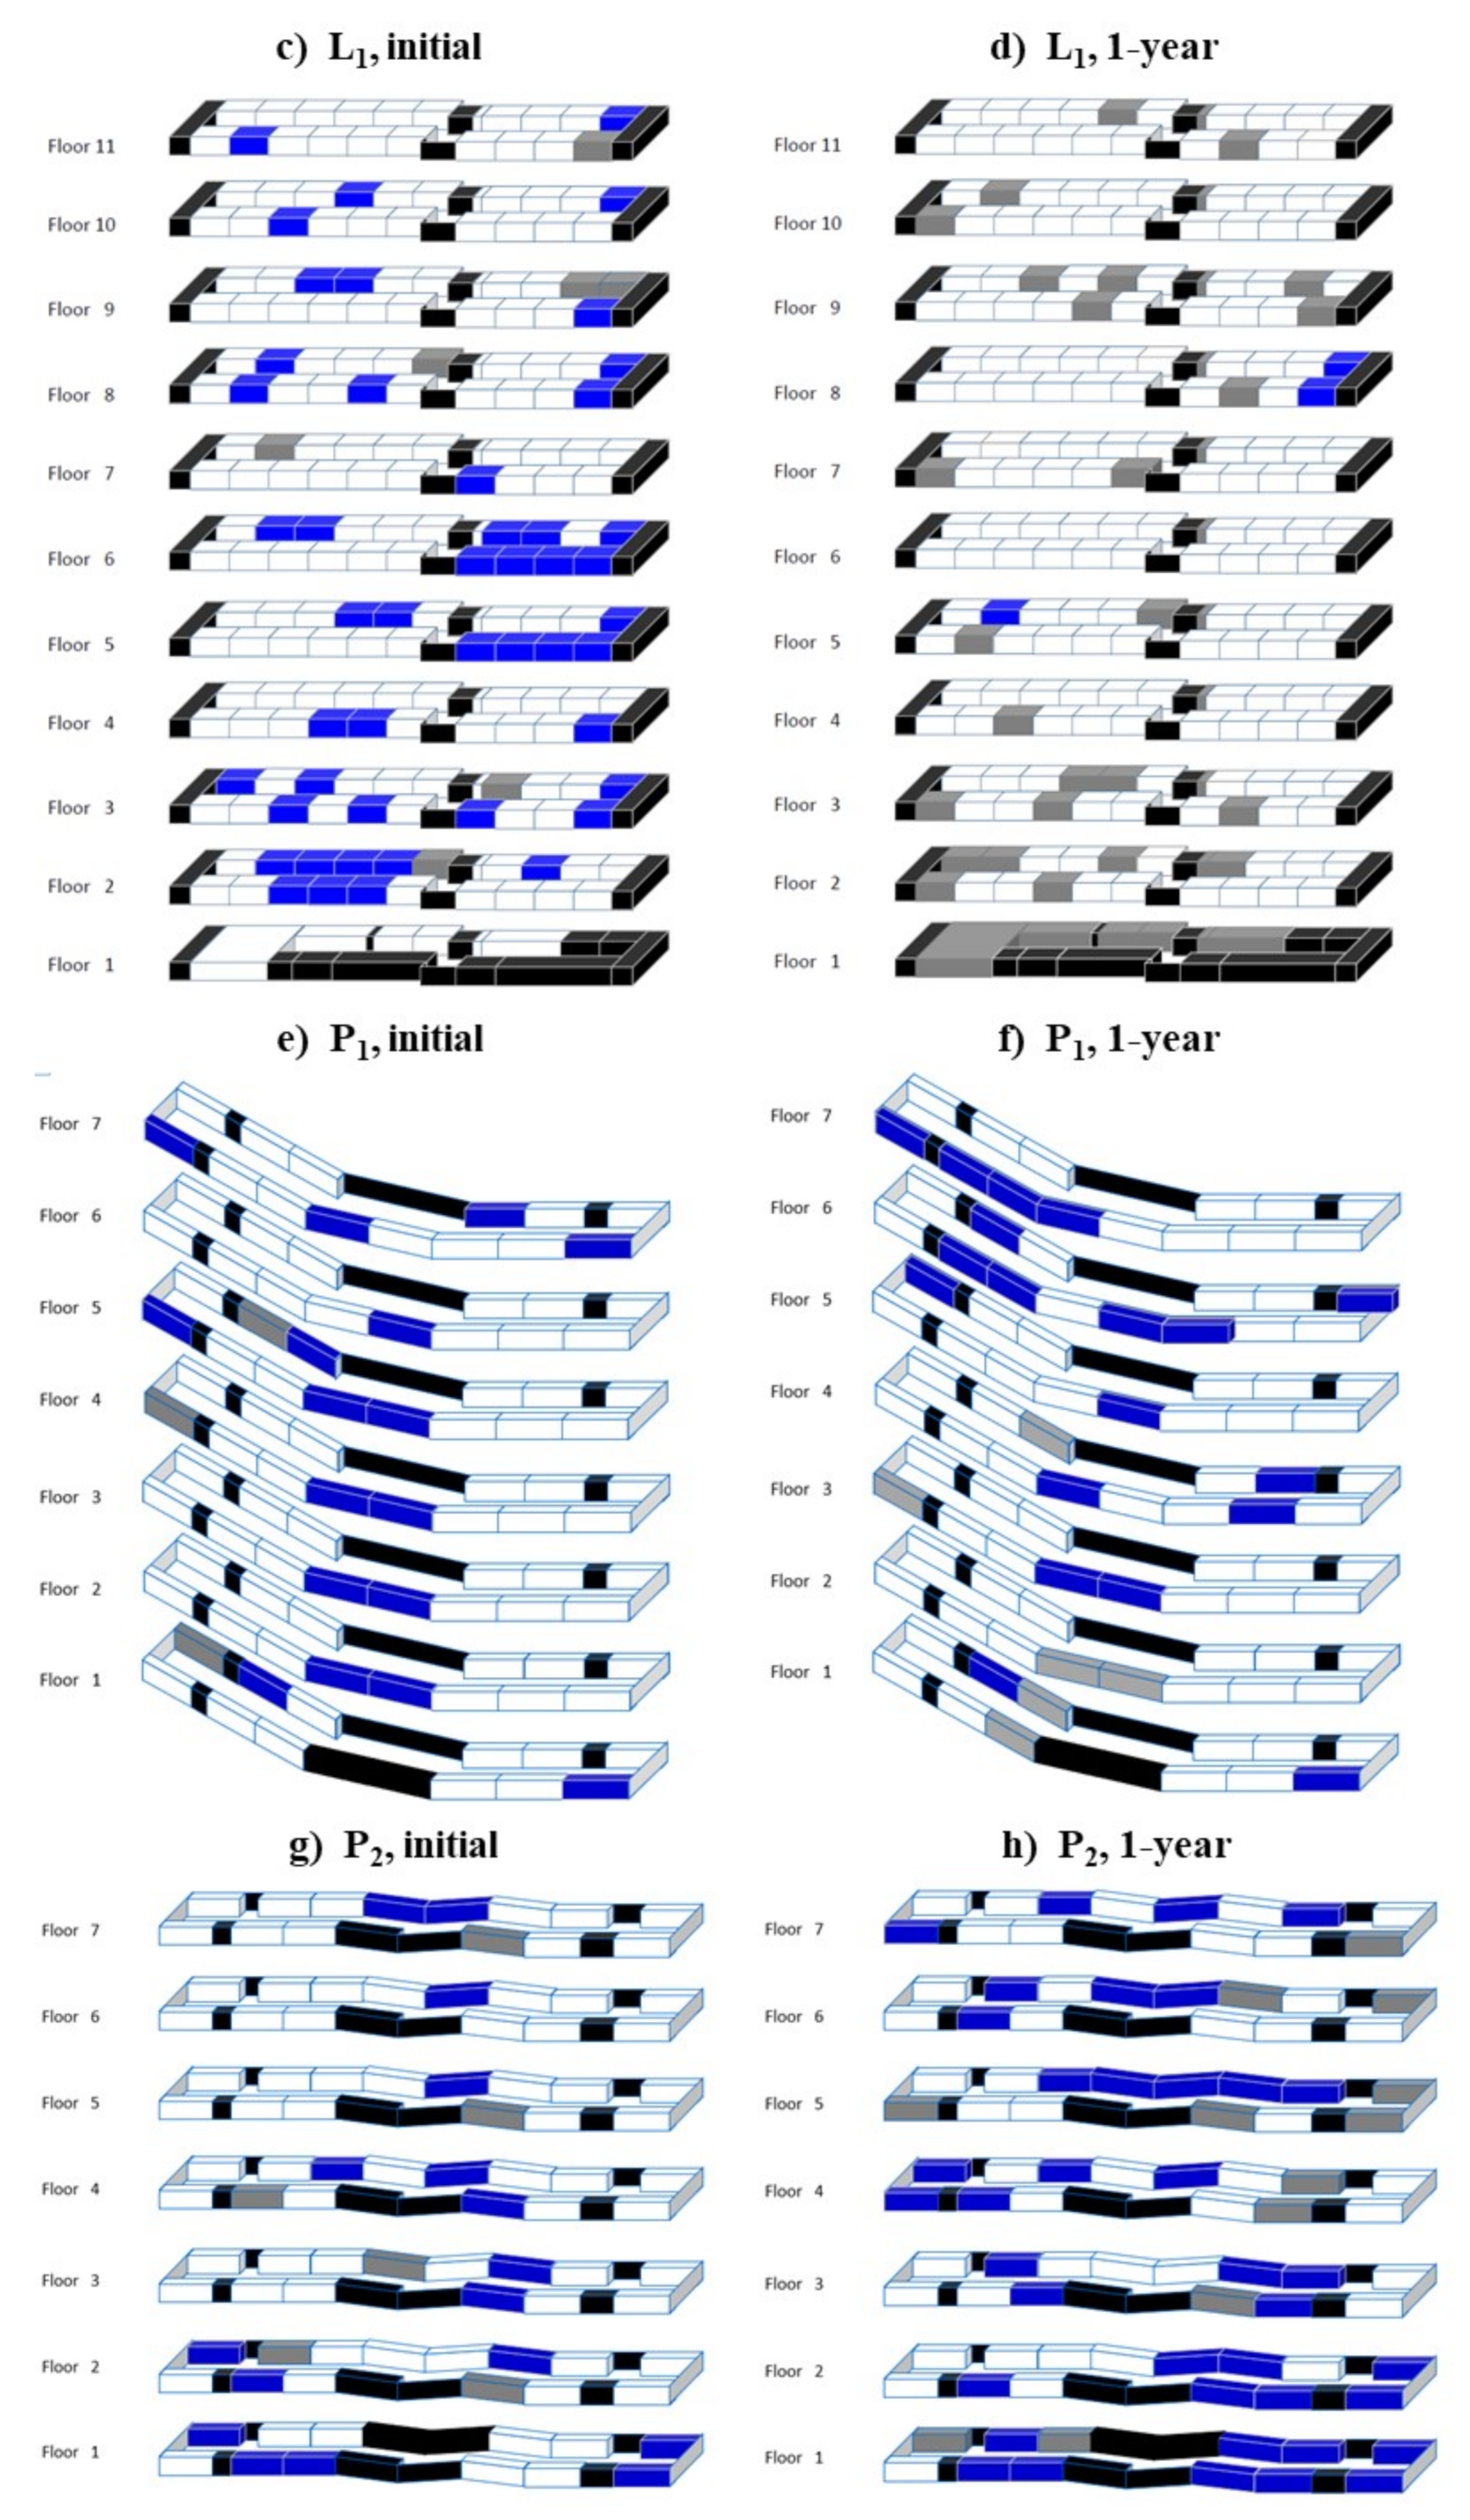
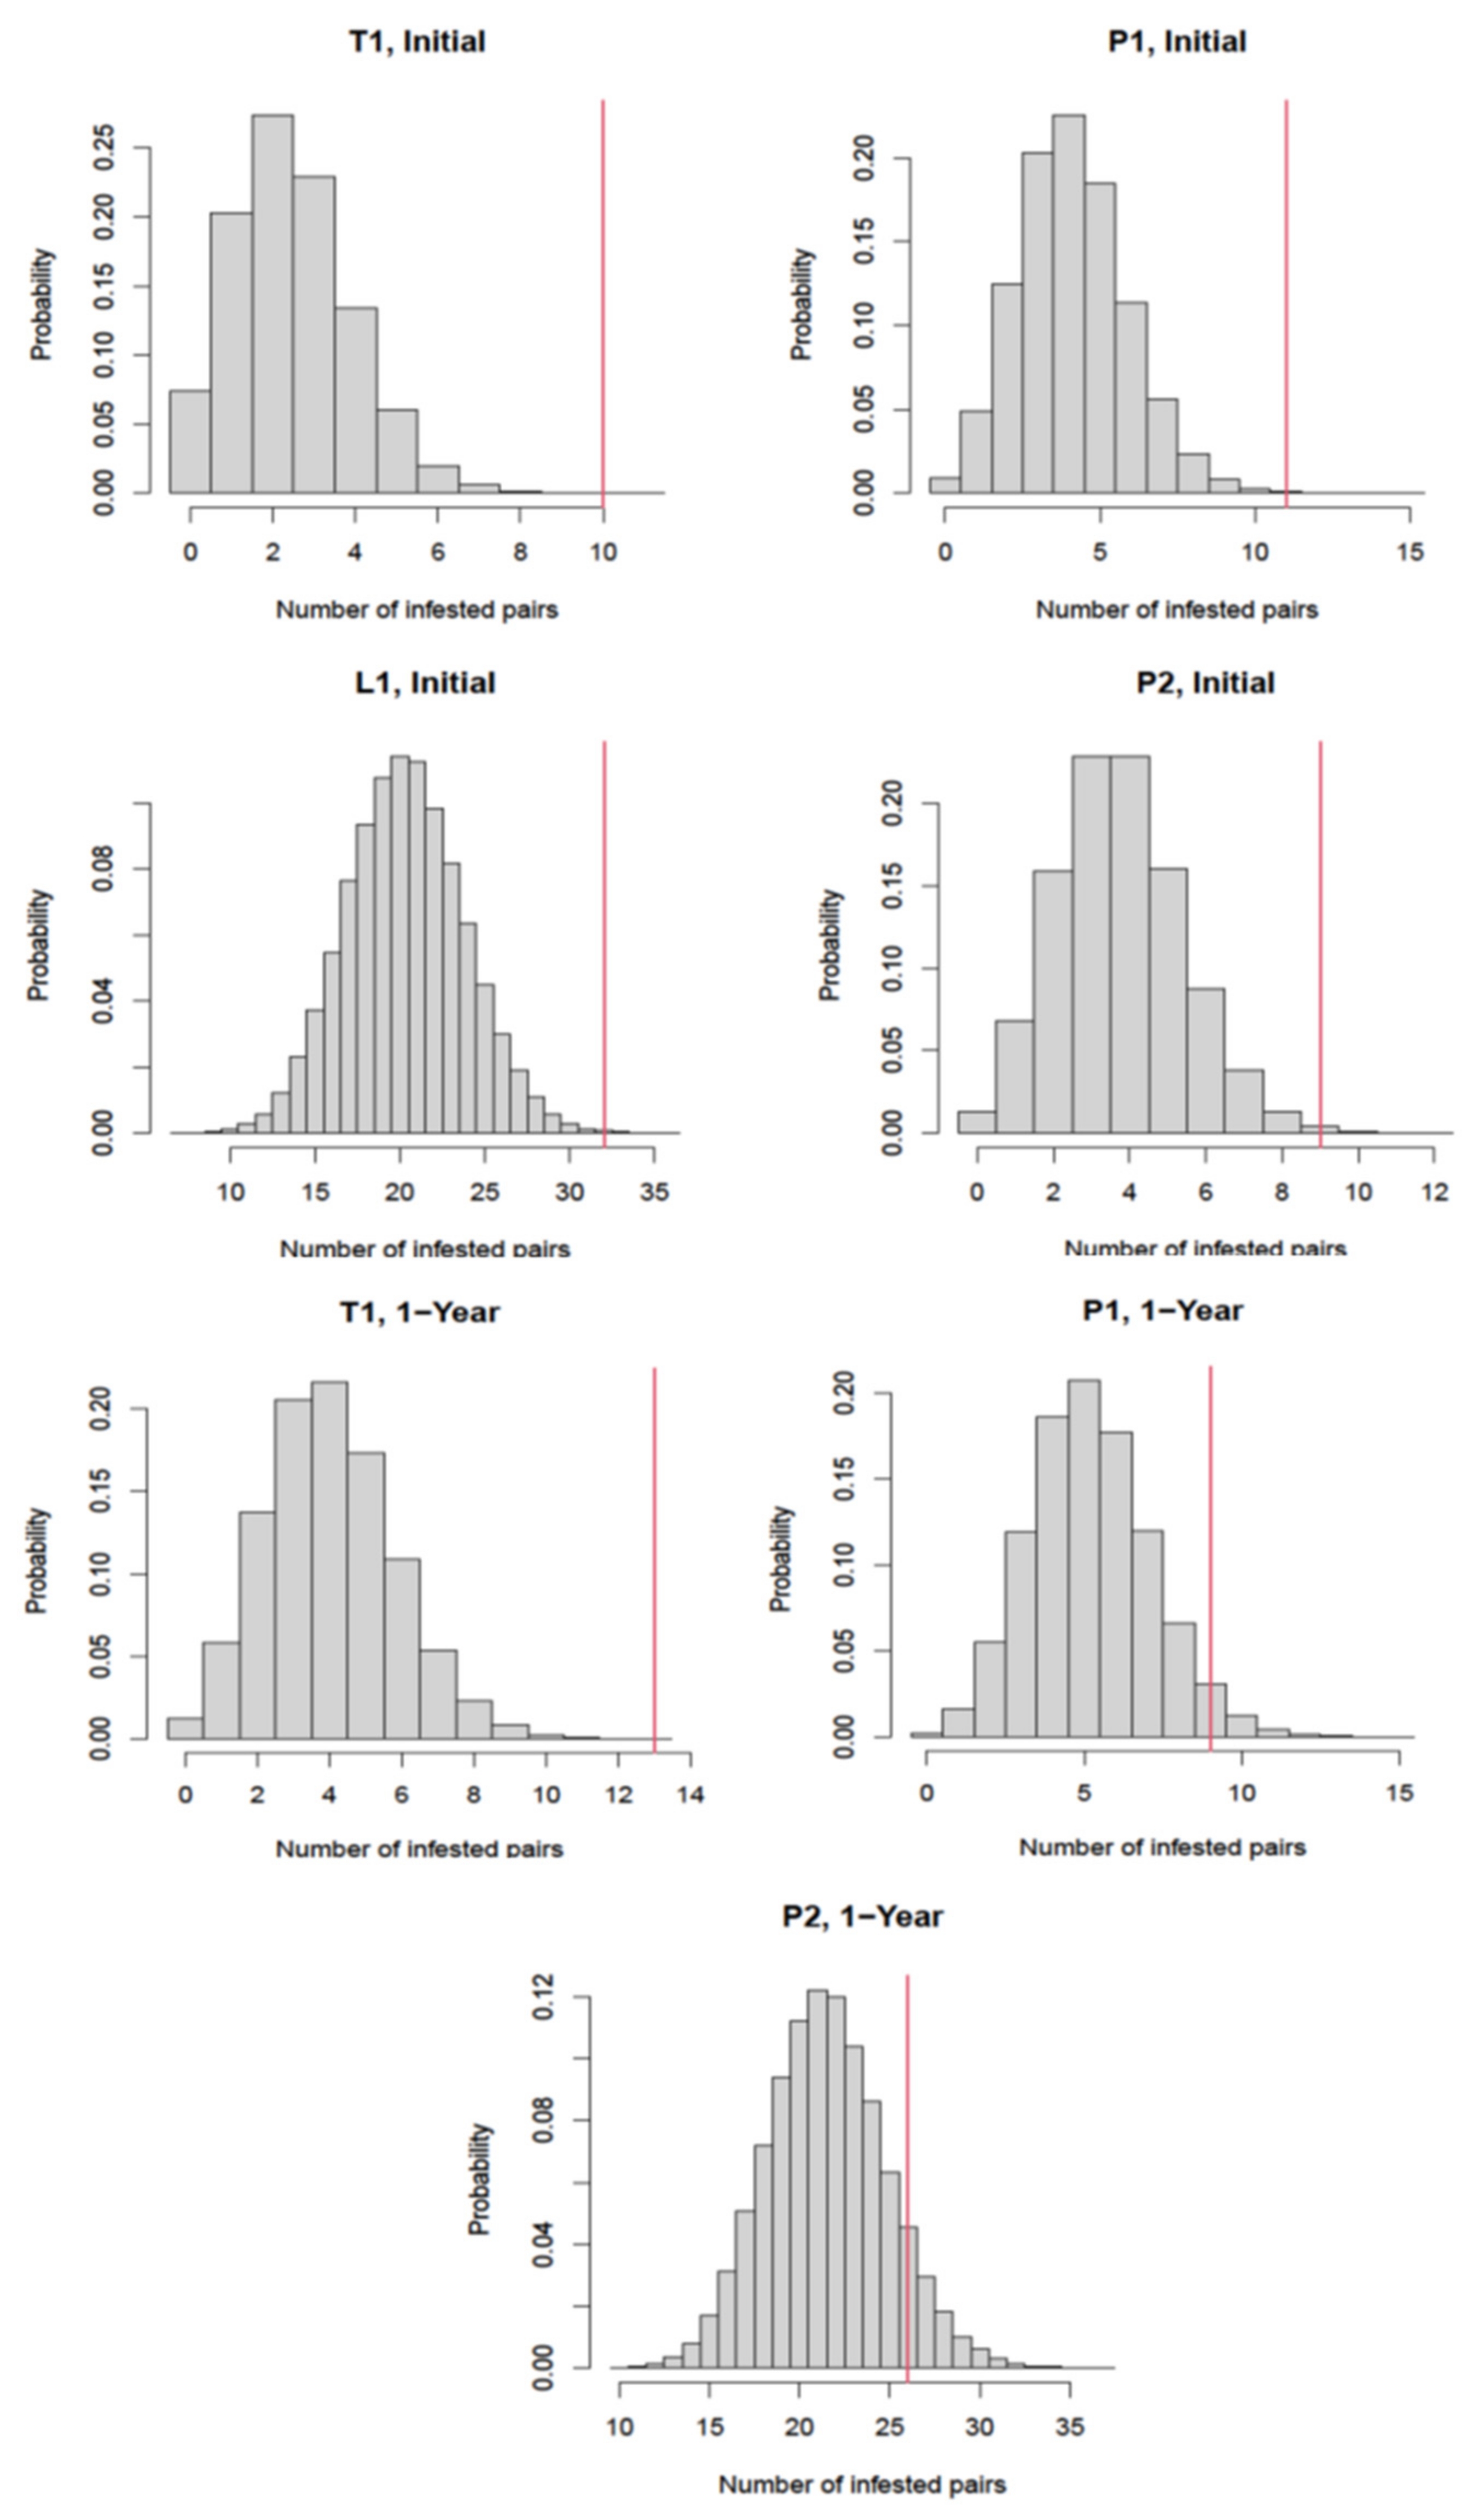
3. Results
4. Discussion
5. Conclusions
Author Contributions
Funding
Institutional Review Board Statement
Data Availability Statement
Acknowledgments
Conflicts of Interest
References
- Corrigan, R.M. Rats and Mice. In The Mallis Handbook of Pest Control, 10th ed.; Hedges, S., Moreland, D., Eds.; GIE Publications: Cleveland, OH, USA, 2011; pp. 11–148. [Google Scholar]
- Childs, J.; Glass, G.; LeDuc, J. Rodent sightings and contacts in an inner-city population of Baltimore, Maryland, USA. Bull. Soc. Vector Ecologist. 1991, 16, 245–255. [Google Scholar]
- Marshall, P.A.; Murphy, R.G. Investigating residents’ perceptions of urban rodents in Manchester. In Rats, Mice and People: Rodent Biology and Management; Singleton, G.R., Hinds, L.A., Krebs, C.J., Spratt, D.M., Eds.; Aciar Mg: Canberra, Australia, 2003; Volume 96, pp. 473–476. [Google Scholar]
- Wang, C.; El-Nour, M.M.A.; Bennett, G.W. Survey of pest infestation, asthma, and allergy in low-income housing. J. Commun. Health 2008, 33, 31–39. [Google Scholar] [CrossRef] [PubMed]
- Mcnally, R.J.; Steketee, G.S. The etiology and maintenance of severe animal phobias. Bahav. Res. Ther. 1985, 23, 431–435. [Google Scholar] [CrossRef]
- Jahrling, P.; Peters, C. Lymphocytic choriomeningitis virus; A neglected pathogen of man. Arch. Pathol. Lab. Med. 1992, 116, 486–488. [Google Scholar] [PubMed]
- Gratz, N. Rodents as carriers of disease. In Rodent Pests and Their Control; Buckle, A.P., Smith, R.H., Eds.; CAB International: Wallingford, UK; Oxon, UK, 1994; pp. 85–108. [Google Scholar]
- Childs, J.E.; McLafferty, S.L.; Sadek, R.; Miller, G.L.; Khan, A.S.; DuPree, E.R.; Advani, R.; Glass, G.E. Epidemiology of rodent bites and prediction of rat infestation in New York City. Am. J. Epidemiol. 1998, 148, 78–87. [Google Scholar] [CrossRef] [Green Version]
- Mills, J.N.; Childs, J.E. Ecologic studies of rodent reservoirs: Their relevance for human health. Emerg. Infect. Dis. 1998, 4, 529. [Google Scholar] [CrossRef] [Green Version]
- Pocock, M.; Searle, J.; Betts, W.; White, P. Patterns of infection by Salmonella and Yersinia spp. in commensal house mouse (Mus musculus domesticus) populations. J. Appl. Microbiol. 2001, 90, 755–760. [Google Scholar] [CrossRef] [PubMed]
- Phipatanakul, W. Rodent allergens. Curr. Allergy Asthm. R. 2002, 2, 412–416. [Google Scholar] [CrossRef]
- Pocock, M.J.; Hauffe, H.C.; Searle, J.B. Dispersal in house mice. Biol. J. Linn. Soc. 2005, 84, 565–583. [Google Scholar] [CrossRef] [Green Version]
- Murphy, R.G.; Williams, R.H.; Hide, G. Population Biology of the Urban Mouse (Mus domesticus) in the UK. In Proceedings of the Fifth International Conference on Urban Pests, Singapore, 11–13 July 2005; pp. 351–355. [Google Scholar]
- IBIS-World. IBIS World Industry Report 56171: Pest Control in the US. 2011. Available online: http://www.ibisworld.com (accessed on 22 December 2020).
- Williams, S.H.; Che, X.; Garcia, J.; Klena, J.D.; Lee, B.; Muller, D.; Ulrich, W.; Corrigan, R.M.; Nichol, S.T.; Jain, K.; et al. Viral diversity of house mice in New York City. Mol. Biol. 2018, 9, e01354-17. [Google Scholar] [CrossRef] [Green Version]
- Williams, S.H.; Che, X.; Paulick, A.; Guo, C.; Lee, B.; Muller, D.; Uhlemann, A.-C.; Lowy, F.D.; Corrigan, R.M.; Lipkin, I. New York City house mice (Mus musculus) as potential reservoirs for pathogenic bacteria and antimicrobial resistance determinants. Mol. Biol. 2018, 9, e0062418. [Google Scholar] [CrossRef] [Green Version]
- Rowe, F.P. Aspects of mouse behaviour related to control. Mamm. Rev. 1973, 3, 58–63. [Google Scholar] [CrossRef]
- Berry, R.J. House mouse Mus domesticus. In The Handbook of British Mammals; Corbet, G.B., Harris, S., Eds.; Blackwell Science, Inc.: Oxford, UK, 1991; pp. 239–247. [Google Scholar]
- MacKay, J. Datasheet; Mus musculus (house mouse). In Invasive Species Compendium: Detailed Coverage of Invasive Species Threatening Livelihoods and the Environment Worldwide; CAB International: London, UK, 2010; Available online: https://www.cabi.org/isc/datasheet/35218 (accessed on 12 December 2020).
- Liebhold, A.M.; Tobin, P.C. Population ecology of insect invasions and their management. Annu. Rev. Entomol. 2008, 53, 387–408. [Google Scholar] [CrossRef] [PubMed] [Green Version]
- MacArthur, R.H.; Wilson, E.O. The strategy of colonization. In The Theory of Island Biogeography; Princeton University Press: Princeton, NJ, USA, 1967; pp. 68–94. [Google Scholar]
- Mollison, D. Modeling biological invasions: Chance, explanation, prediction. Philos. Trans. R. Soc. London Ser. 1986, 314, 675–693. [Google Scholar]
- Berek, L.; Angulo, E.; Courchamp, F. Multiple allele effects and population management. Trends. Ecol. Evol. 2007, 22, 185–191. [Google Scholar] [CrossRef]
- Clark, B.R.; Faeth, S.H. The consequences of larval aggregation in the butterfly. Chlosyne lacinia. Ecol. Entomol. 1997, 22, 408–415. [Google Scholar] [CrossRef]
- Lande, R. Anthropogenic, ecological and genetic factors in extinction and conservation. Res. Popul. Ecol. 1998, 40, 259–269. [Google Scholar] [CrossRef]
- Gascoigne, J.C.; Lipcius, R.N. Allele effects driven by predation. J. Appl. Ecol. 2004, 41, 801–810. [Google Scholar] [CrossRef]
- Hughes, N.K.; Banks, P.B. Interacting effects of predation risk and signal patchiness on activity and communication in house mice. J. Anim. Ecol. 2010, 79, 88–97. [Google Scholar] [CrossRef]
- Crowcroft, P. Spatial distribution of feeding activity in the wild house-mouse (Mus musculus L.). Ann. Appl. Biol. 1959, 47, 150–155. [Google Scholar] [CrossRef]
- MacKay, J.W.B.; Russell, J.C.; Clout, M.N.; Murphy, E.C.; Hauber, M.E. See how they run: Increased ranging behavior counters potential allele effects in experimentally introduced house mice on an island. Biol. Invasions 2018, 21, 1669–1681. [Google Scholar] [CrossRef]
- Lippens, C.; Estoup, A.; Hima1, M.K.; Loiseau, A.; Tatard, C.; Dalecky, A.; Bâ, K.; Kane, M.; Diallo, M.; Sow, A.; et al. Genetic structure and invasion history of the house mouse (Mus musculus domesticus) in Senegal, West Africa: A legacy of colonial and contemporary times. Heredity 2017, 119, 64–75. [Google Scholar] [CrossRef] [PubMed] [Green Version]
- Corrigan, R.M. A Profile of the Norway rat, Rattus norvegicus, in New York City: Its’ impact on city infrastructures and the need for collaborative interagency management programs. In Proceedings of the 22nd Vertebrate Pest Conference, Berkeley, CA, USA, 1–4 March 2004; Timm, T.M., O’Brien, J.M., Eds.; University of California-Davis Publications: Davis, CA, USA, 2006; pp. 131–141. [Google Scholar]
- Gray, S.; Jensen, S.P.; Hurst, J.L. Structural complexity of territories: Preference, use of space and defense in commensal house mice, Mus domesticus. Anim. Behav. 2000, 60, 765–772. [Google Scholar] [CrossRef] [PubMed] [Green Version]
- Battersby, S.; Hirschhorn, R.B.; Amman, B.R. Commensal rodents. In Public Health Significance of Urban Pests; Bonnefoy, X., Kampen, H., Sweeney, K., Eds.; World Health Organization: Geneva, Switzerland, 2008; pp. 387–419. [Google Scholar]
- Gray, S.J.; Jensen, S.P.; Hurst, J.L. Effects of resource distribution on activity and territory defense in house mice, Mus domesticus. Anim. Behav. 2002, 63, 531–539. [Google Scholar] [CrossRef] [Green Version]
- Andrzejewski, R.; Petrusewicz, K.; Walkowa, W. Absorption of newcomers by a population of white mice. Ekologia Polska 1963, 11, 223–240. [Google Scholar]
- Berry, R. The natural history of the house mouse. Field Studies 1970, 3, 219–262. [Google Scholar]
- Bronson, F. The reproductive ecology of the house mouse. Q. Rev. Biol. 1979, 54, 265–299. [Google Scholar] [CrossRef]
- Palanza, P.; Morley-Fletcher, S.; Laviola, G. Novelty seeking in periadolescent mice: Sex differences and influence of intrauterine position. Physiol. Behav. 2001, 72, 255–262. [Google Scholar] [CrossRef]
- Lidicker, W.Z.; Stenseth, N.C. To disperse or not to disperse: Who does it and why? In Animal Dispersal: Small Mammals as a Model; Stenseth, N.C., Lidicker, W.Z., Eds.; Chapman & Hall: London, UK, 1992; pp. 21–36. [Google Scholar]
- Krebs, C.J.; Kenney, A.J.; Singleton, G.R. Movements of feral house mice in agricultural landscapes. Aust. J. Zool. 1995, 43, 293–302. [Google Scholar] [CrossRef]
- Fitzgerald, B.M.; Karl, B.J.; Moller, H. Spatial organisation and ecology of a sparse population of house mice (Mus musculus) in a New Zealand forest. J. Anim. Ecol. 1981, 50, 489–518. [Google Scholar] [CrossRef]
- Lund, M. Commensal Rodents. In Rodent Pests and Their Control; Buckle, A.P., Smith, R.H., Eds.; CAB: Wallingford, UK, 1994; pp. 23–44. [Google Scholar]
- Seto, K.C.; Fragkias, M.; Guneralp, B.; Reilly, M.K. A meta-analysis of global urban land expansion. PLoS ONE 2011, 6, e23777. [Google Scholar] [CrossRef]
- Sked, S.L.; Abbar, S.; Cooper, R.; Corrigan, R.; Pan, X.; Ranabhat, S.; Wang, C. Monitoring and controlling house mouse, Mus musculus domesticus, infestations in low-income multi-family dwellings. Animals 2011, 11, 648. [Google Scholar] [CrossRef]
- Abbar, S.; Cooper, R.; Ranabhat, S.; Pan, X.; Sked, S.; Wang, C. Prevalence of cockroaches, bed bugs, and house mice in low-income housing and evaluation of baits for monitoring house mouse infestations. J. Med. Entomol. 2022. under review. [Google Scholar]
- Stoloff, J.A. A Brief History of Public Housing. In Proceedings of the Annual Meeting of the American Sociological Association, San Francisco, CA, USA, 14 August 2004; Available online: https://www.asanet.org/sites/default/files/2004_annual_meeting_program.pdf (accessed on 3 December 2021).
- R Core Team. R: A Language and Environment for Statistical Computing; R Foundation for Statistical Computing: Vienna, Austria, 2021; Available online: https://www.r-project.org/ (accessed on 20 October 2021).
- Crowcroft, P. Mice All Over; Foulis, G.T., Ed.; G.T. Foulis and Co.: London, UK, 1966. [Google Scholar]
- Alyan, S.; Jander, R. Short-range homing in the house mouse, Mus musculus: Stages in the learning of directions. Anim. Behav. 1994, 48, 285–298. [Google Scholar] [CrossRef] [Green Version]
- Alyan, S. Evidence for resetting the directional component of path integration in the house mouse (Mus musculus). Ethology 1996, 102, 629–638. [Google Scholar] [CrossRef]
- Rowe, F.; Taylor, E. Chudley H, The numbers and movements of house mice (Mus musculus L.) in the vicinity of four corn ricks. J. Anim. Ecol. 1963, 32, 87–97. [Google Scholar] [CrossRef]
- DeLong, K. Population ecology of feral house mice. Ecology 1967, 48, 611–634. [Google Scholar] [CrossRef]
- Cooper, R.; Wang, C.; Singh, N. Mark-release-recapture reveals extensive movement of bed bugs (Cimex lectularius L.) with and between apartments. PLoS ONE 2015, 10, e0136462. [Google Scholar] [CrossRef] [PubMed] [Green Version]
- Zha, C.; Wang, C.; Eiden, A.; Cooper, R.; Wang, D. Spatial distribution of German cockroaches in a high-rise apartment building during building-wide integrated pest management. J. Econ. Entomol. 2019, 112, 2302–2310. [Google Scholar] [CrossRef] [PubMed] [Green Version]


| Building | Number of Apartments | Number of Floors | Percent Apartments with Two Shared Walls | Percent Apartments with One Shared Wall | Percent Apartments with No Shared Walls |
|---|---|---|---|---|---|
| T1 | 246 | 15 | 65% | 35% | 0% |
| L1 | 200 | 11 | 60% | 40% | 0% |
| P1 | 96 | 7 | 32% | 46% | 22% |
| P2 | 96 | 7 | 25% | 46% | 29% |
| Building | Inspection Occurrence | Number of Apartments Accessed and Inspected | Number of Apartments Infested | Infestation Rate of Apartments Inspected | Number (%) of Infested Apartments with Shared Walls or Ceiling/Floors |
|---|---|---|---|---|---|
| T1 | Initial | 226 | 19 | 8% | 15 (79%) |
| 1-year | 202 | 25 | 12% | 18 (72%) | |
| L1 | Initial | 172 | 49 | 28% | 39 (80%) |
| 1-year | 178 | 3 | 2% | 0 (0%) | |
| P1 | Initial | 93 | 17 | 18% | 9 (53%) |
| 1-year | 90 | 19 | 21% | 11(58%) | |
| P2 | Initial | 90 | 17 | 19% | 14 (82%) |
| 1-year | 84 | 39 | 46% | 28 (72%) |
Publisher’s Note: MDPI stays neutral with regard to jurisdictional claims in published maps and institutional affiliations. |
© 2022 by the authors. Licensee MDPI, Basel, Switzerland. This article is an open access article distributed under the terms and conditions of the Creative Commons Attribution (CC BY) license (https://creativecommons.org/licenses/by/4.0/).
Share and Cite
Sked, S.; Liu, C.; Abbar, S.; Corrigan, R.; Cooper, R.; Wang, C. The Spatial Distribution of the House Mouse, Mus musculus domesticus, in Multi-Family Dwellings. Animals 2022, 12, 197. https://doi.org/10.3390/ani12020197
Sked S, Liu C, Abbar S, Corrigan R, Cooper R, Wang C. The Spatial Distribution of the House Mouse, Mus musculus domesticus, in Multi-Family Dwellings. Animals. 2022; 12(2):197. https://doi.org/10.3390/ani12020197
Chicago/Turabian StyleSked, Shannon, Chaofeng Liu, Salehe Abbar, Robert Corrigan, Richard Cooper, and Changlu Wang. 2022. "The Spatial Distribution of the House Mouse, Mus musculus domesticus, in Multi-Family Dwellings" Animals 12, no. 2: 197. https://doi.org/10.3390/ani12020197
APA StyleSked, S., Liu, C., Abbar, S., Corrigan, R., Cooper, R., & Wang, C. (2022). The Spatial Distribution of the House Mouse, Mus musculus domesticus, in Multi-Family Dwellings. Animals, 12(2), 197. https://doi.org/10.3390/ani12020197