
Identification of Genes Associated with Crest Cushion Development in the Chinese Crested Duck

 and
and 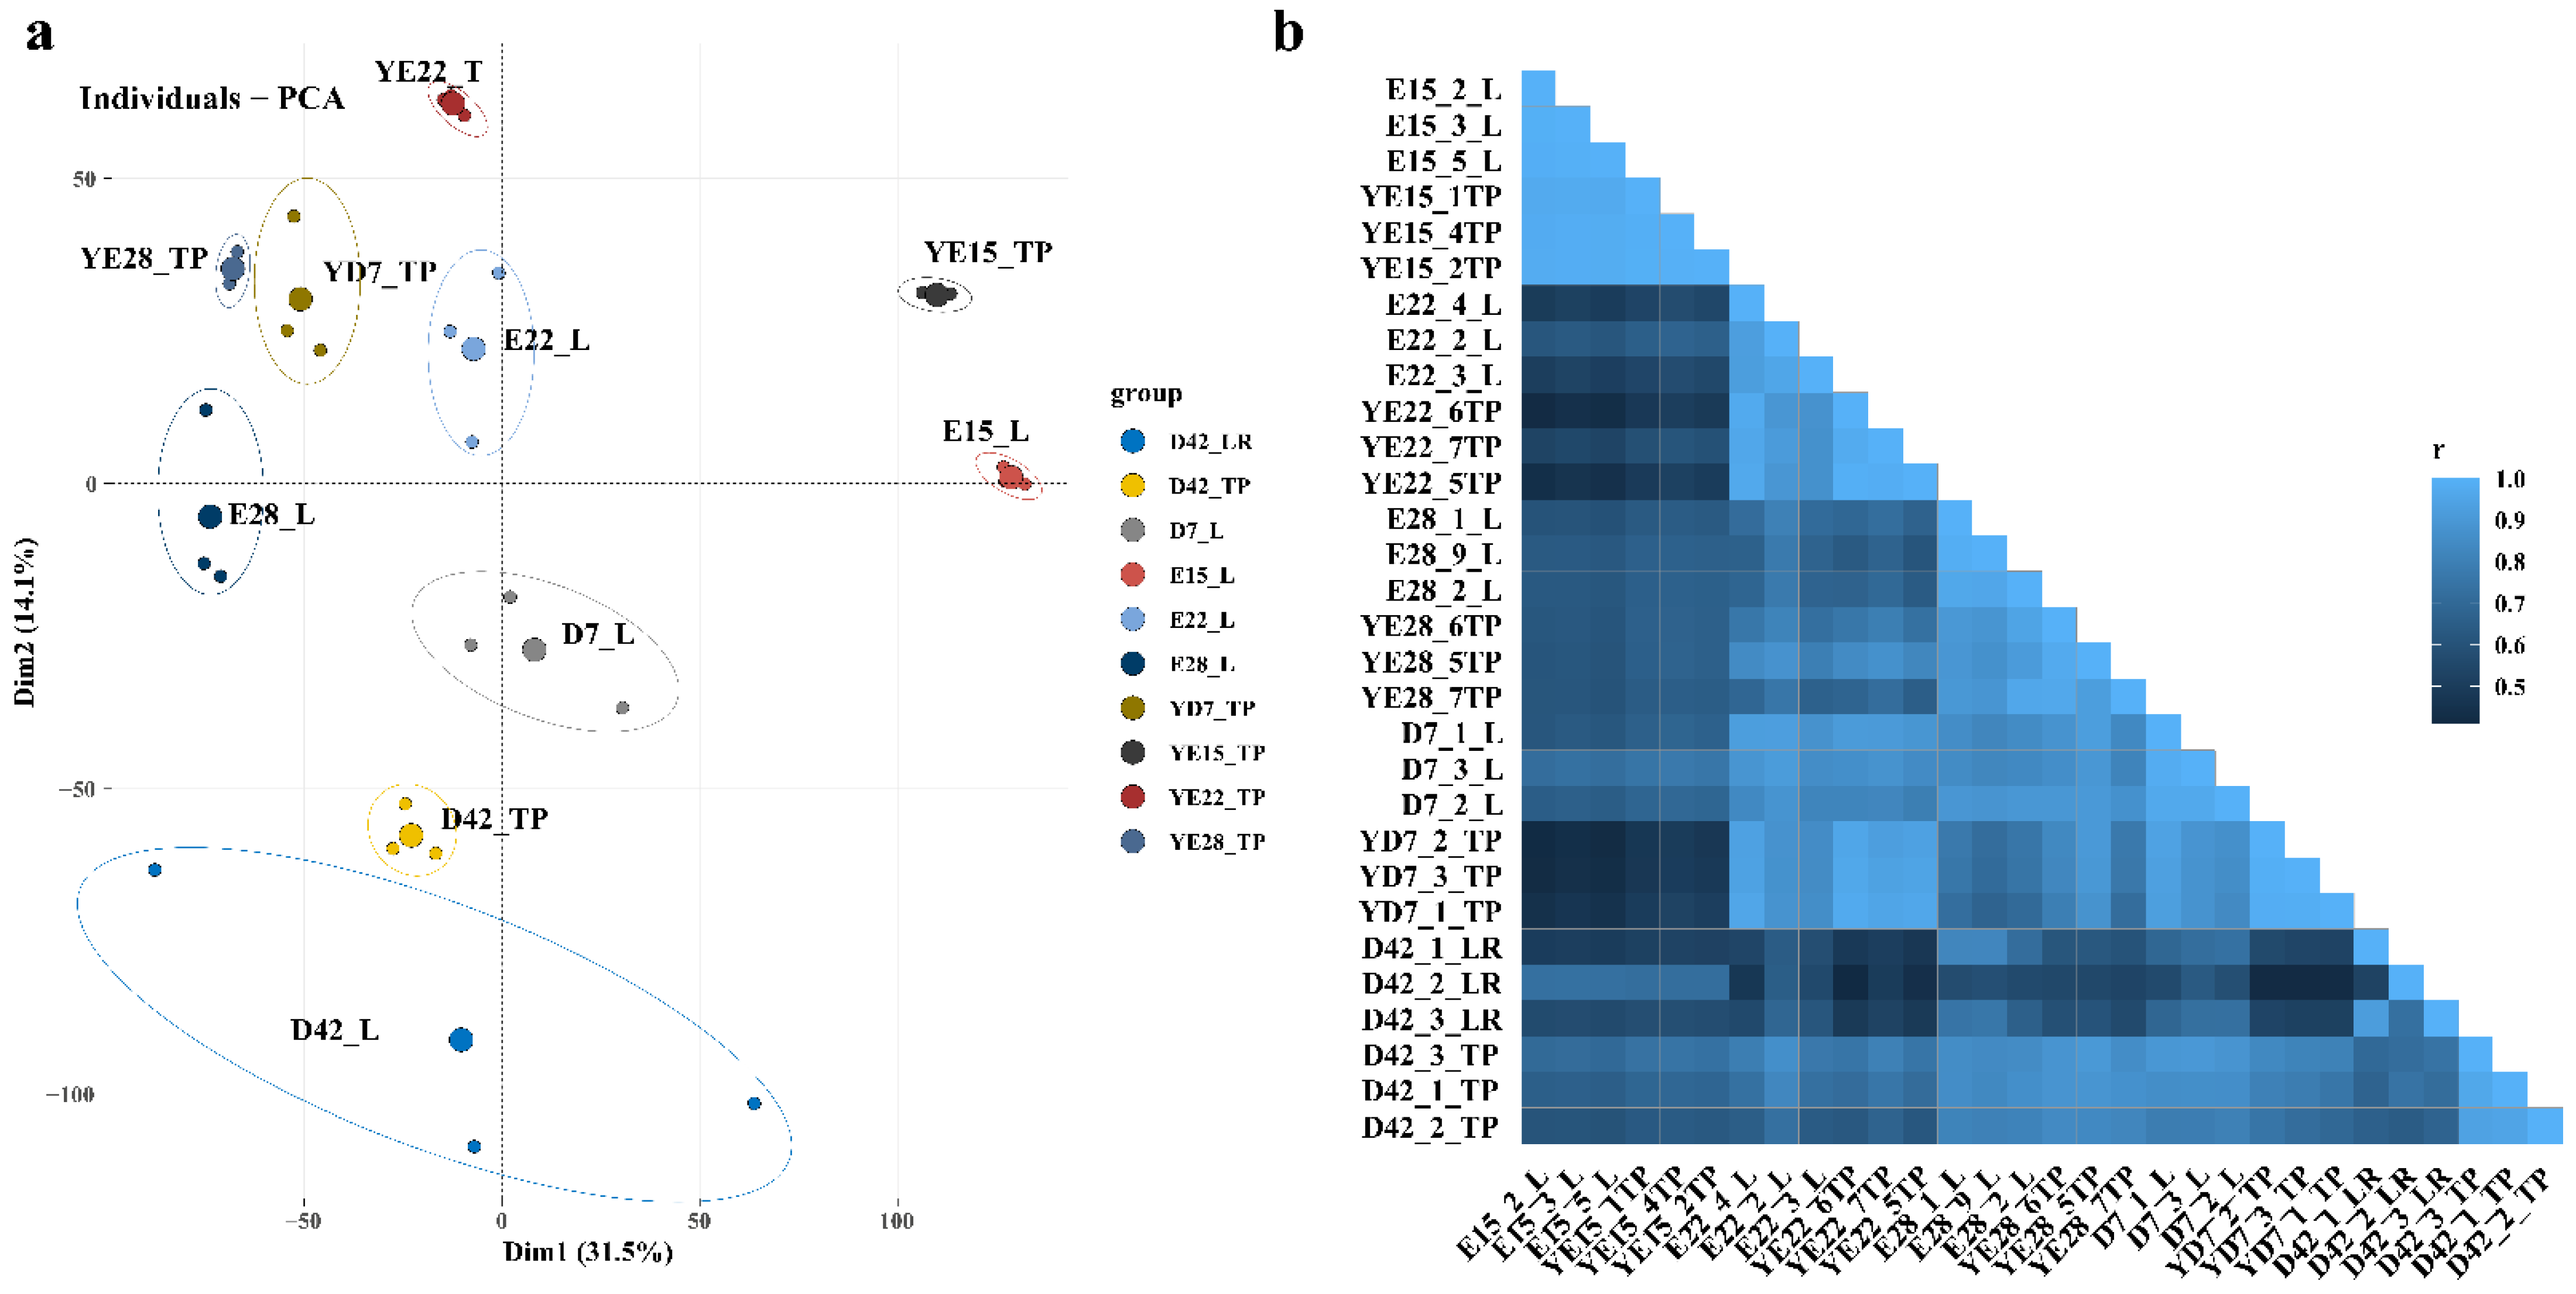
Abstract
Simple Summary
Abstract
1. Introduction
2. Materials and Methods
2.1. Ethical Approval
2.2. Experimental Animals and Sample Collection
2.3. Library Construction and Sequencing
2.4. Analysis of Differentially Expressed Genes (DEGs)
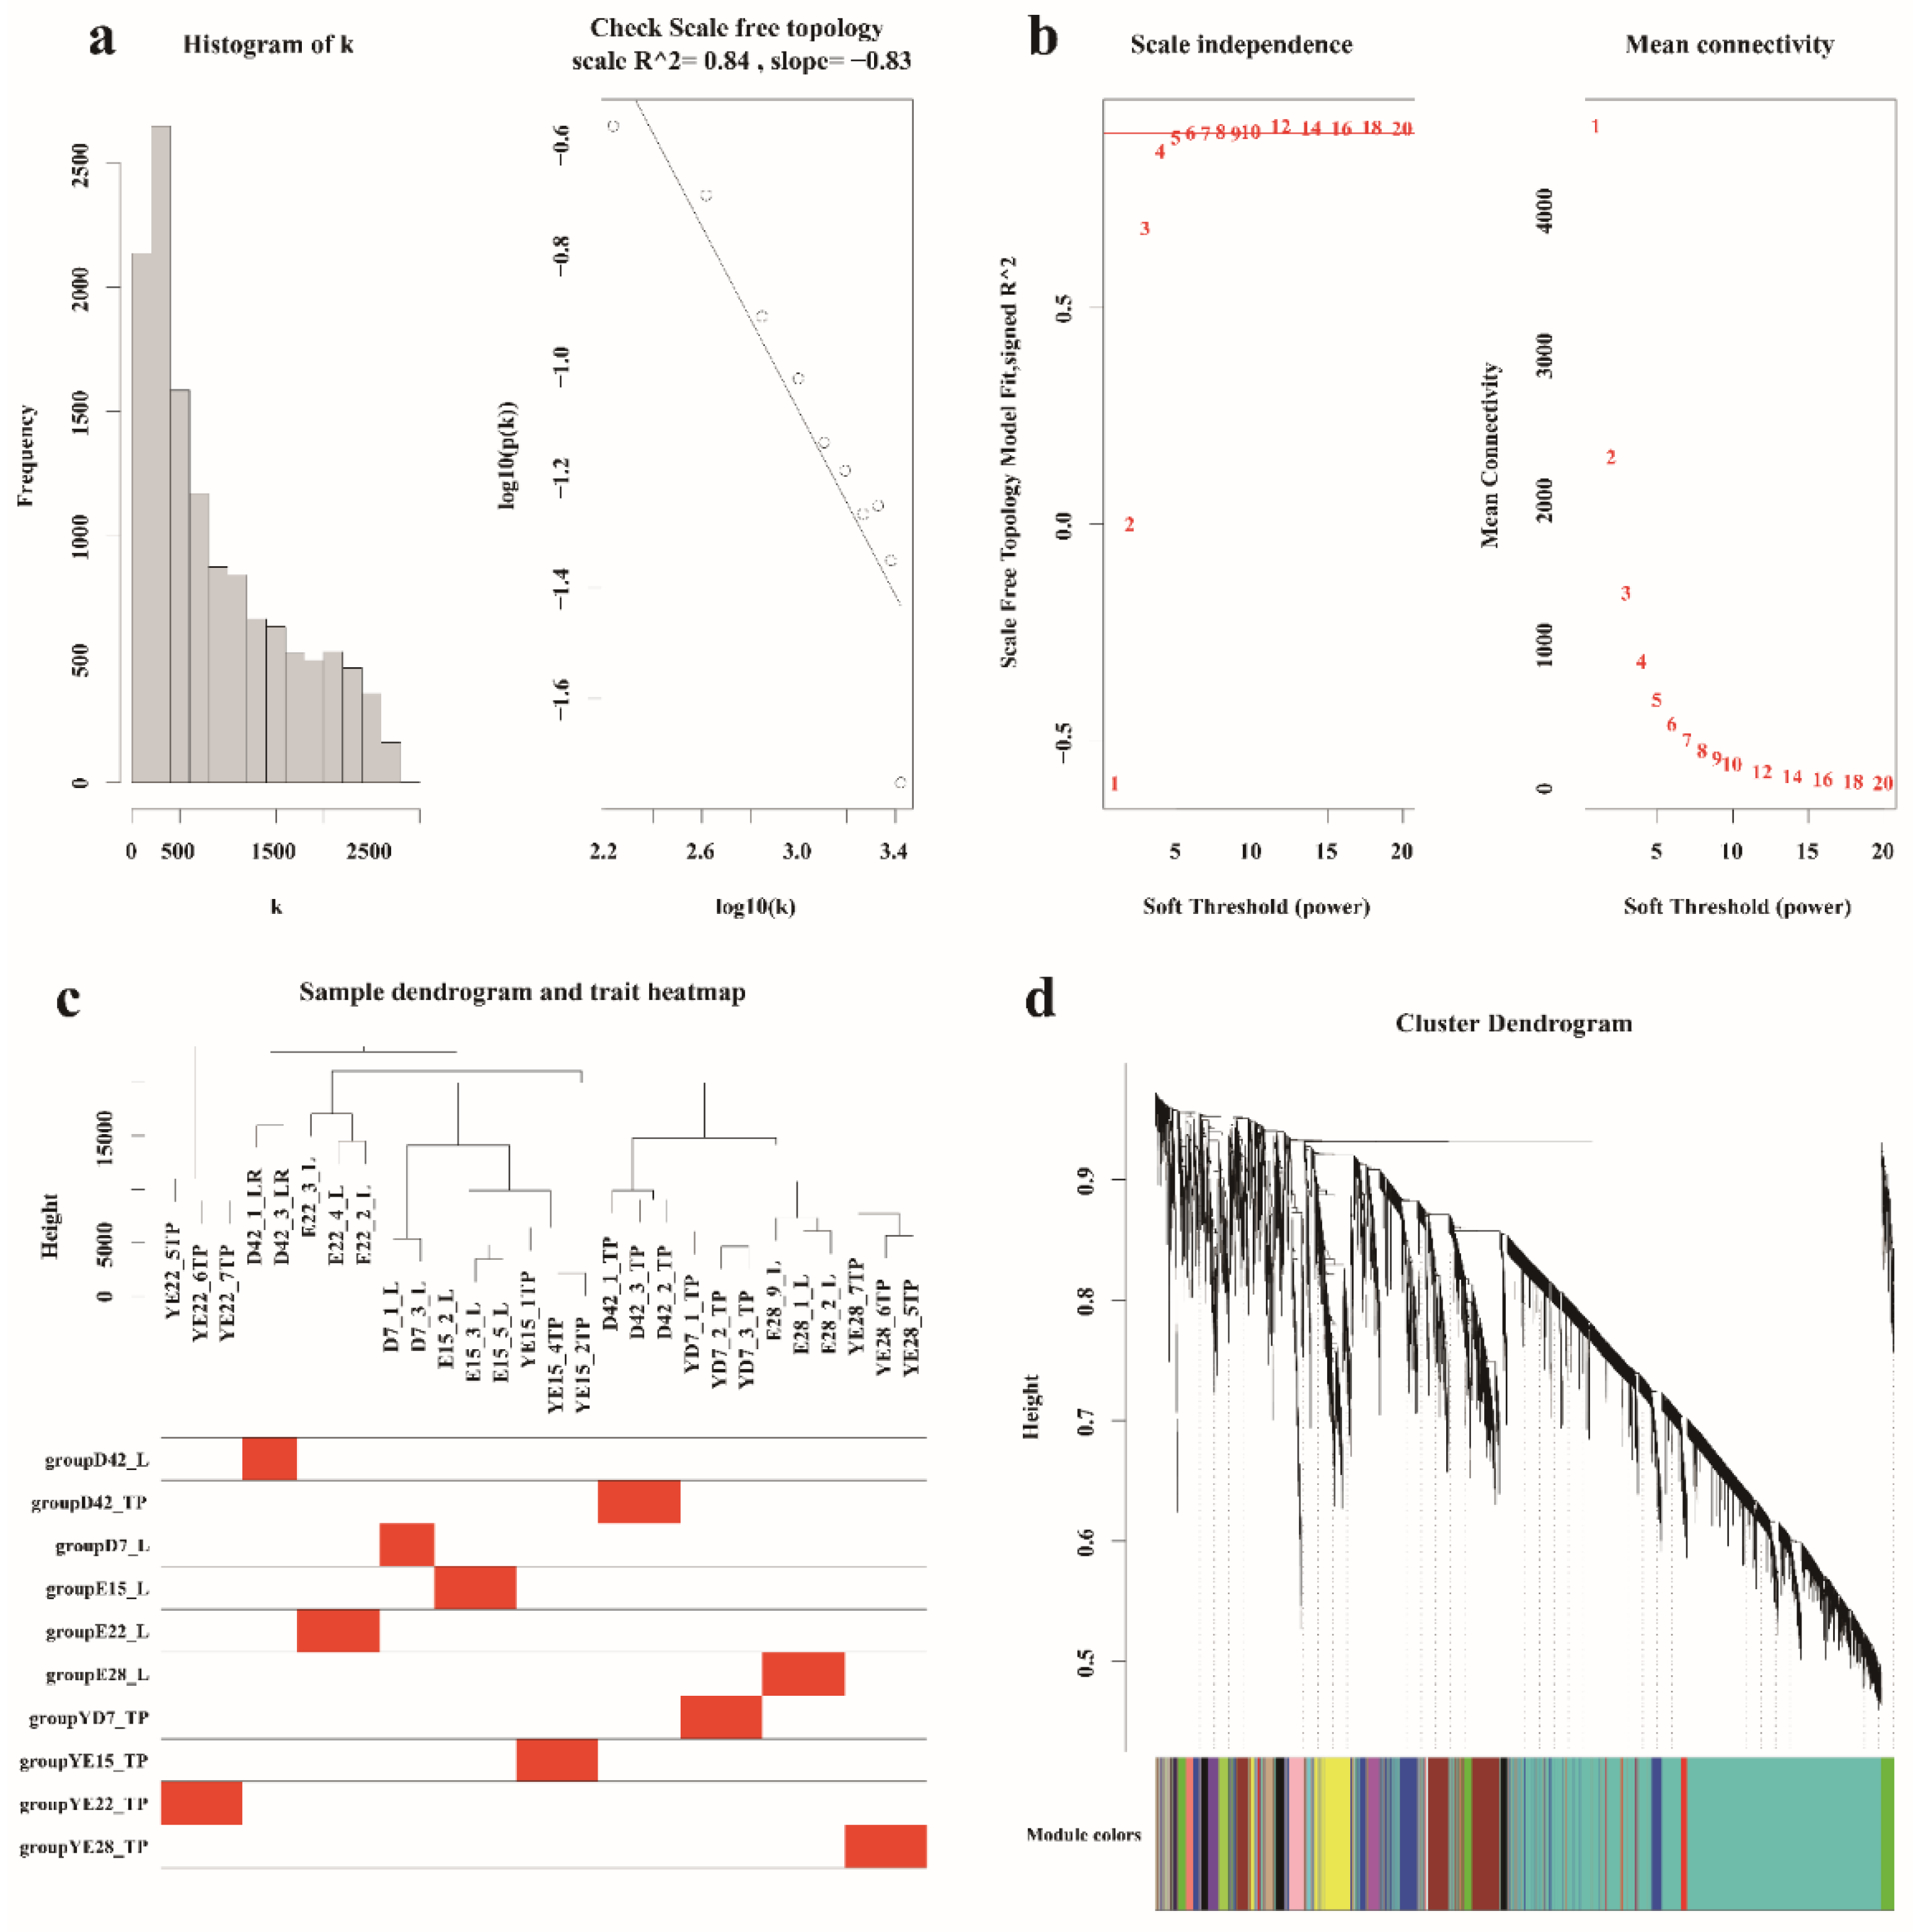
2.5. WGCNA
2.6. Real-Time Quantitative Polymerase Chain (RT-qPCR)
2.7. Statistical Analysis
3. Results
3.1. Overview of RNA Sequencing Data
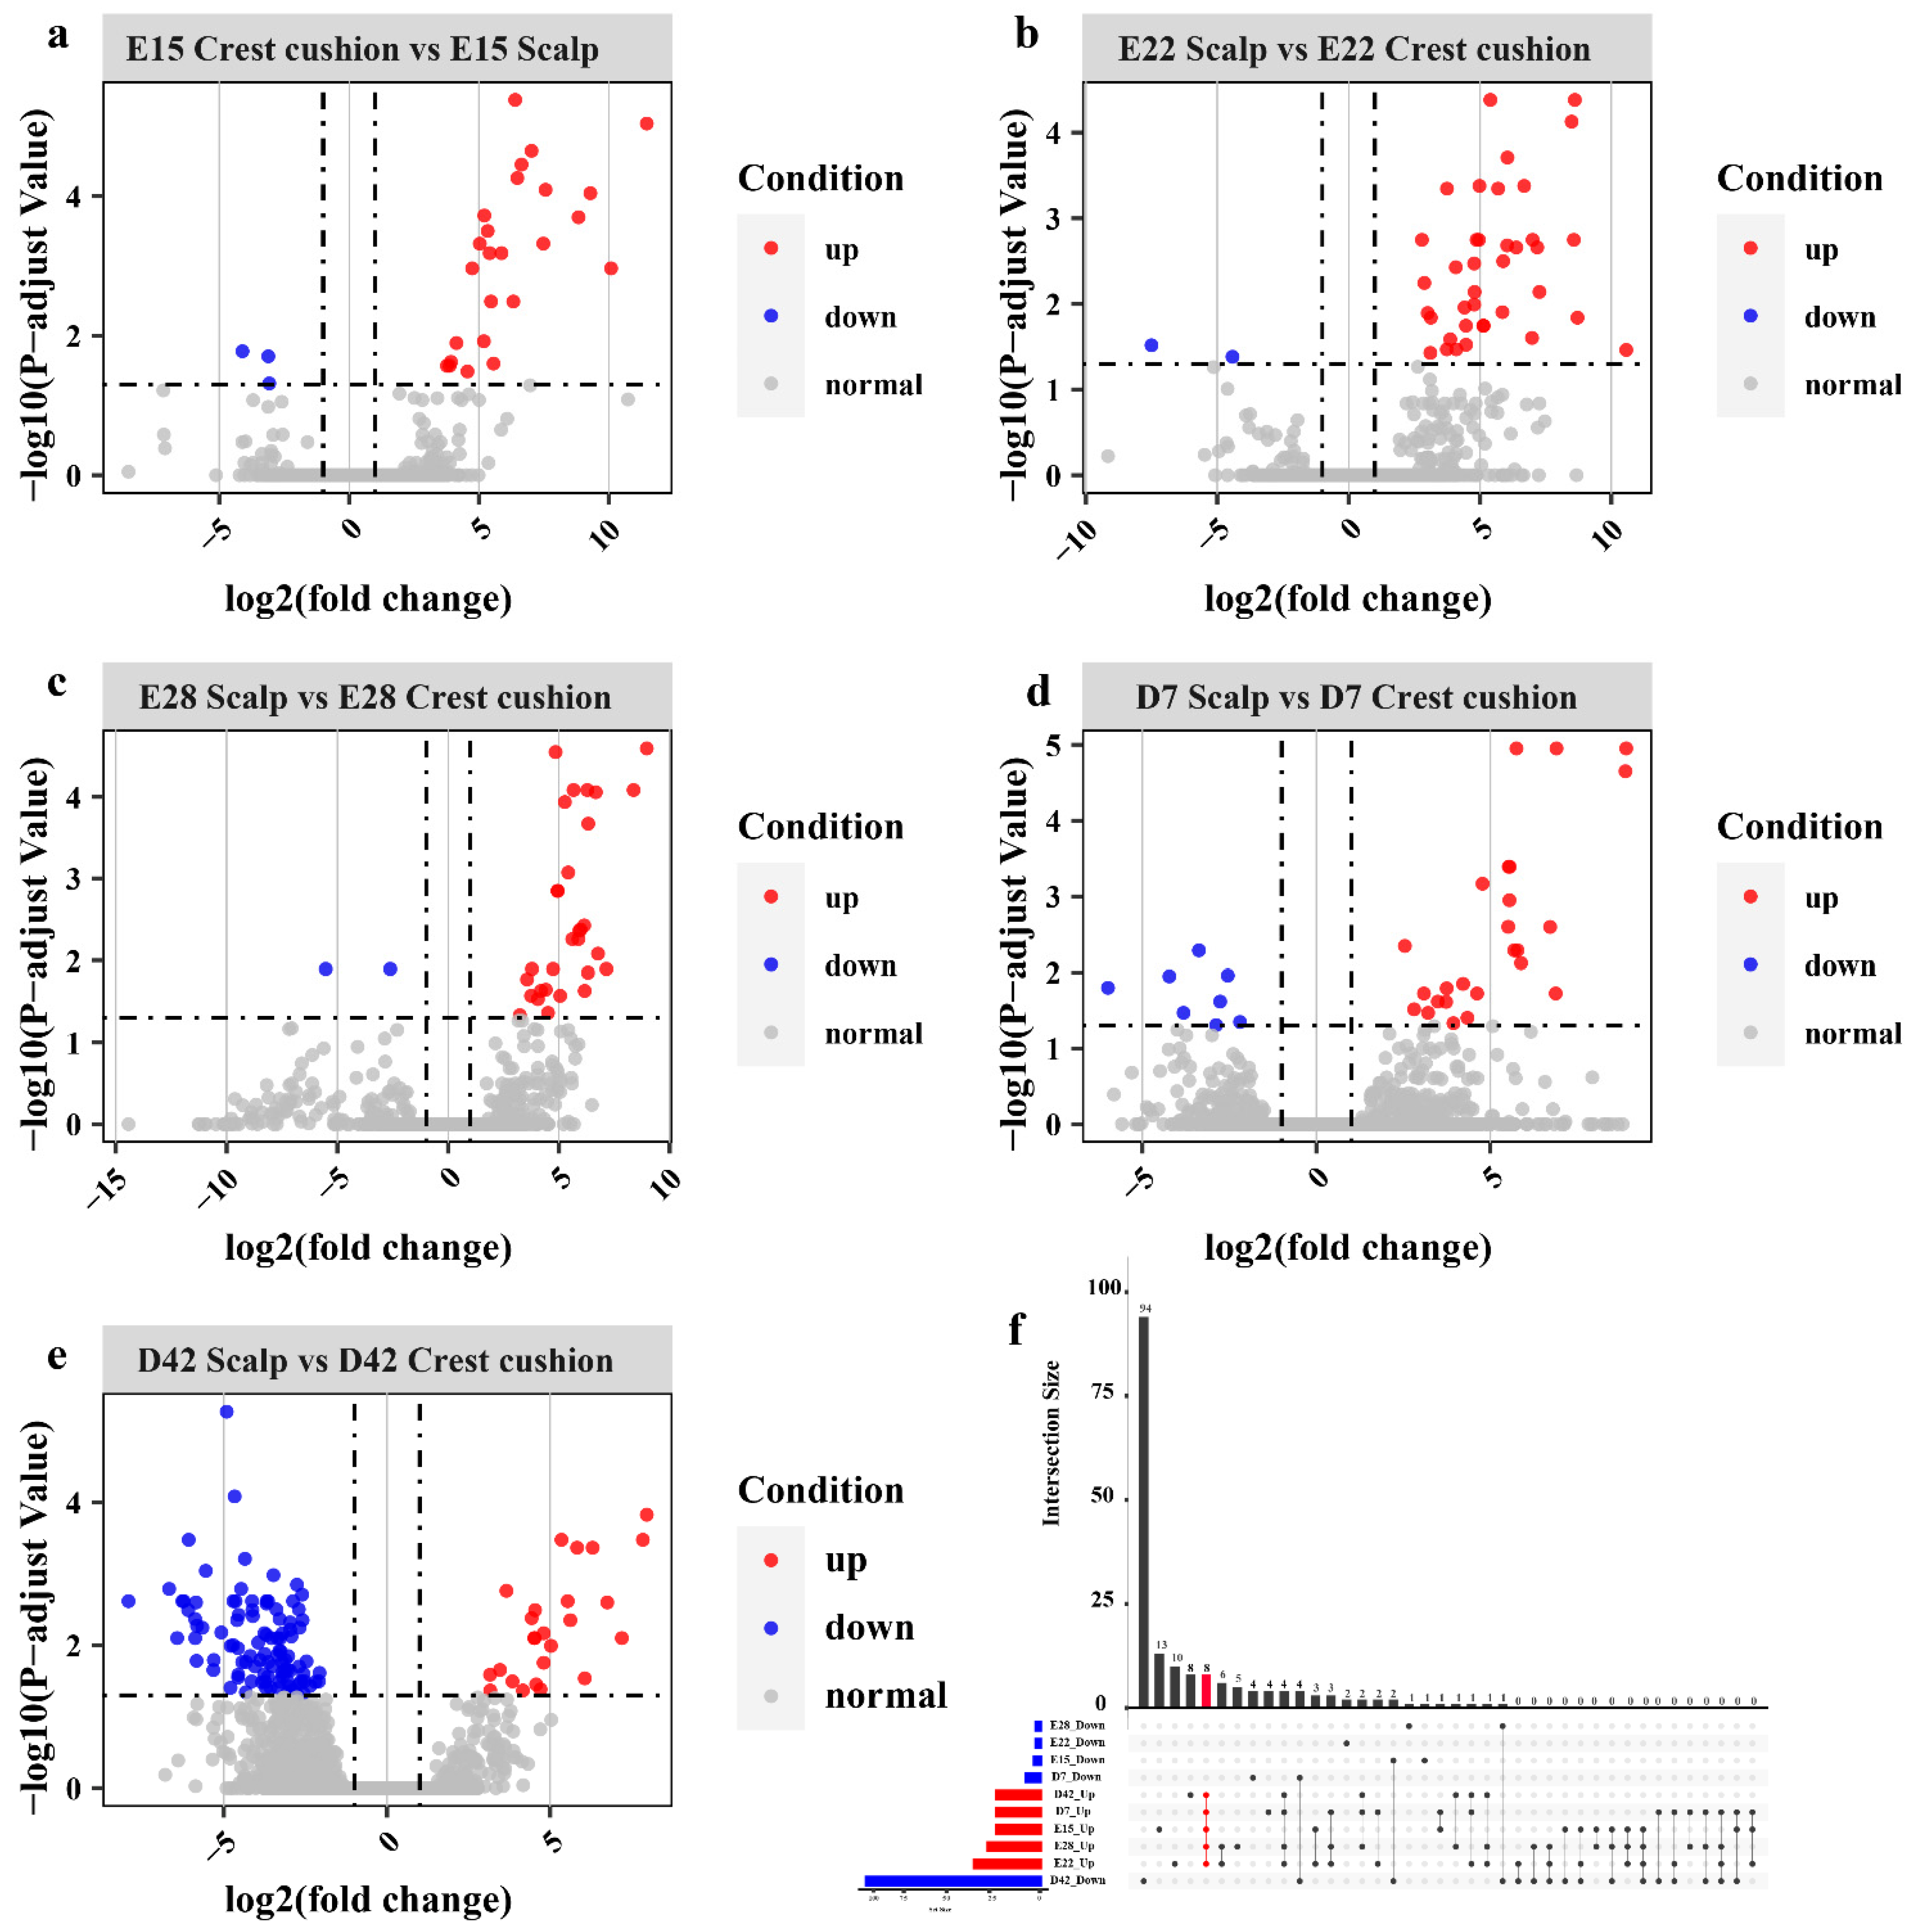
3.2. Differential Gene Expression Analysis in Each Stage
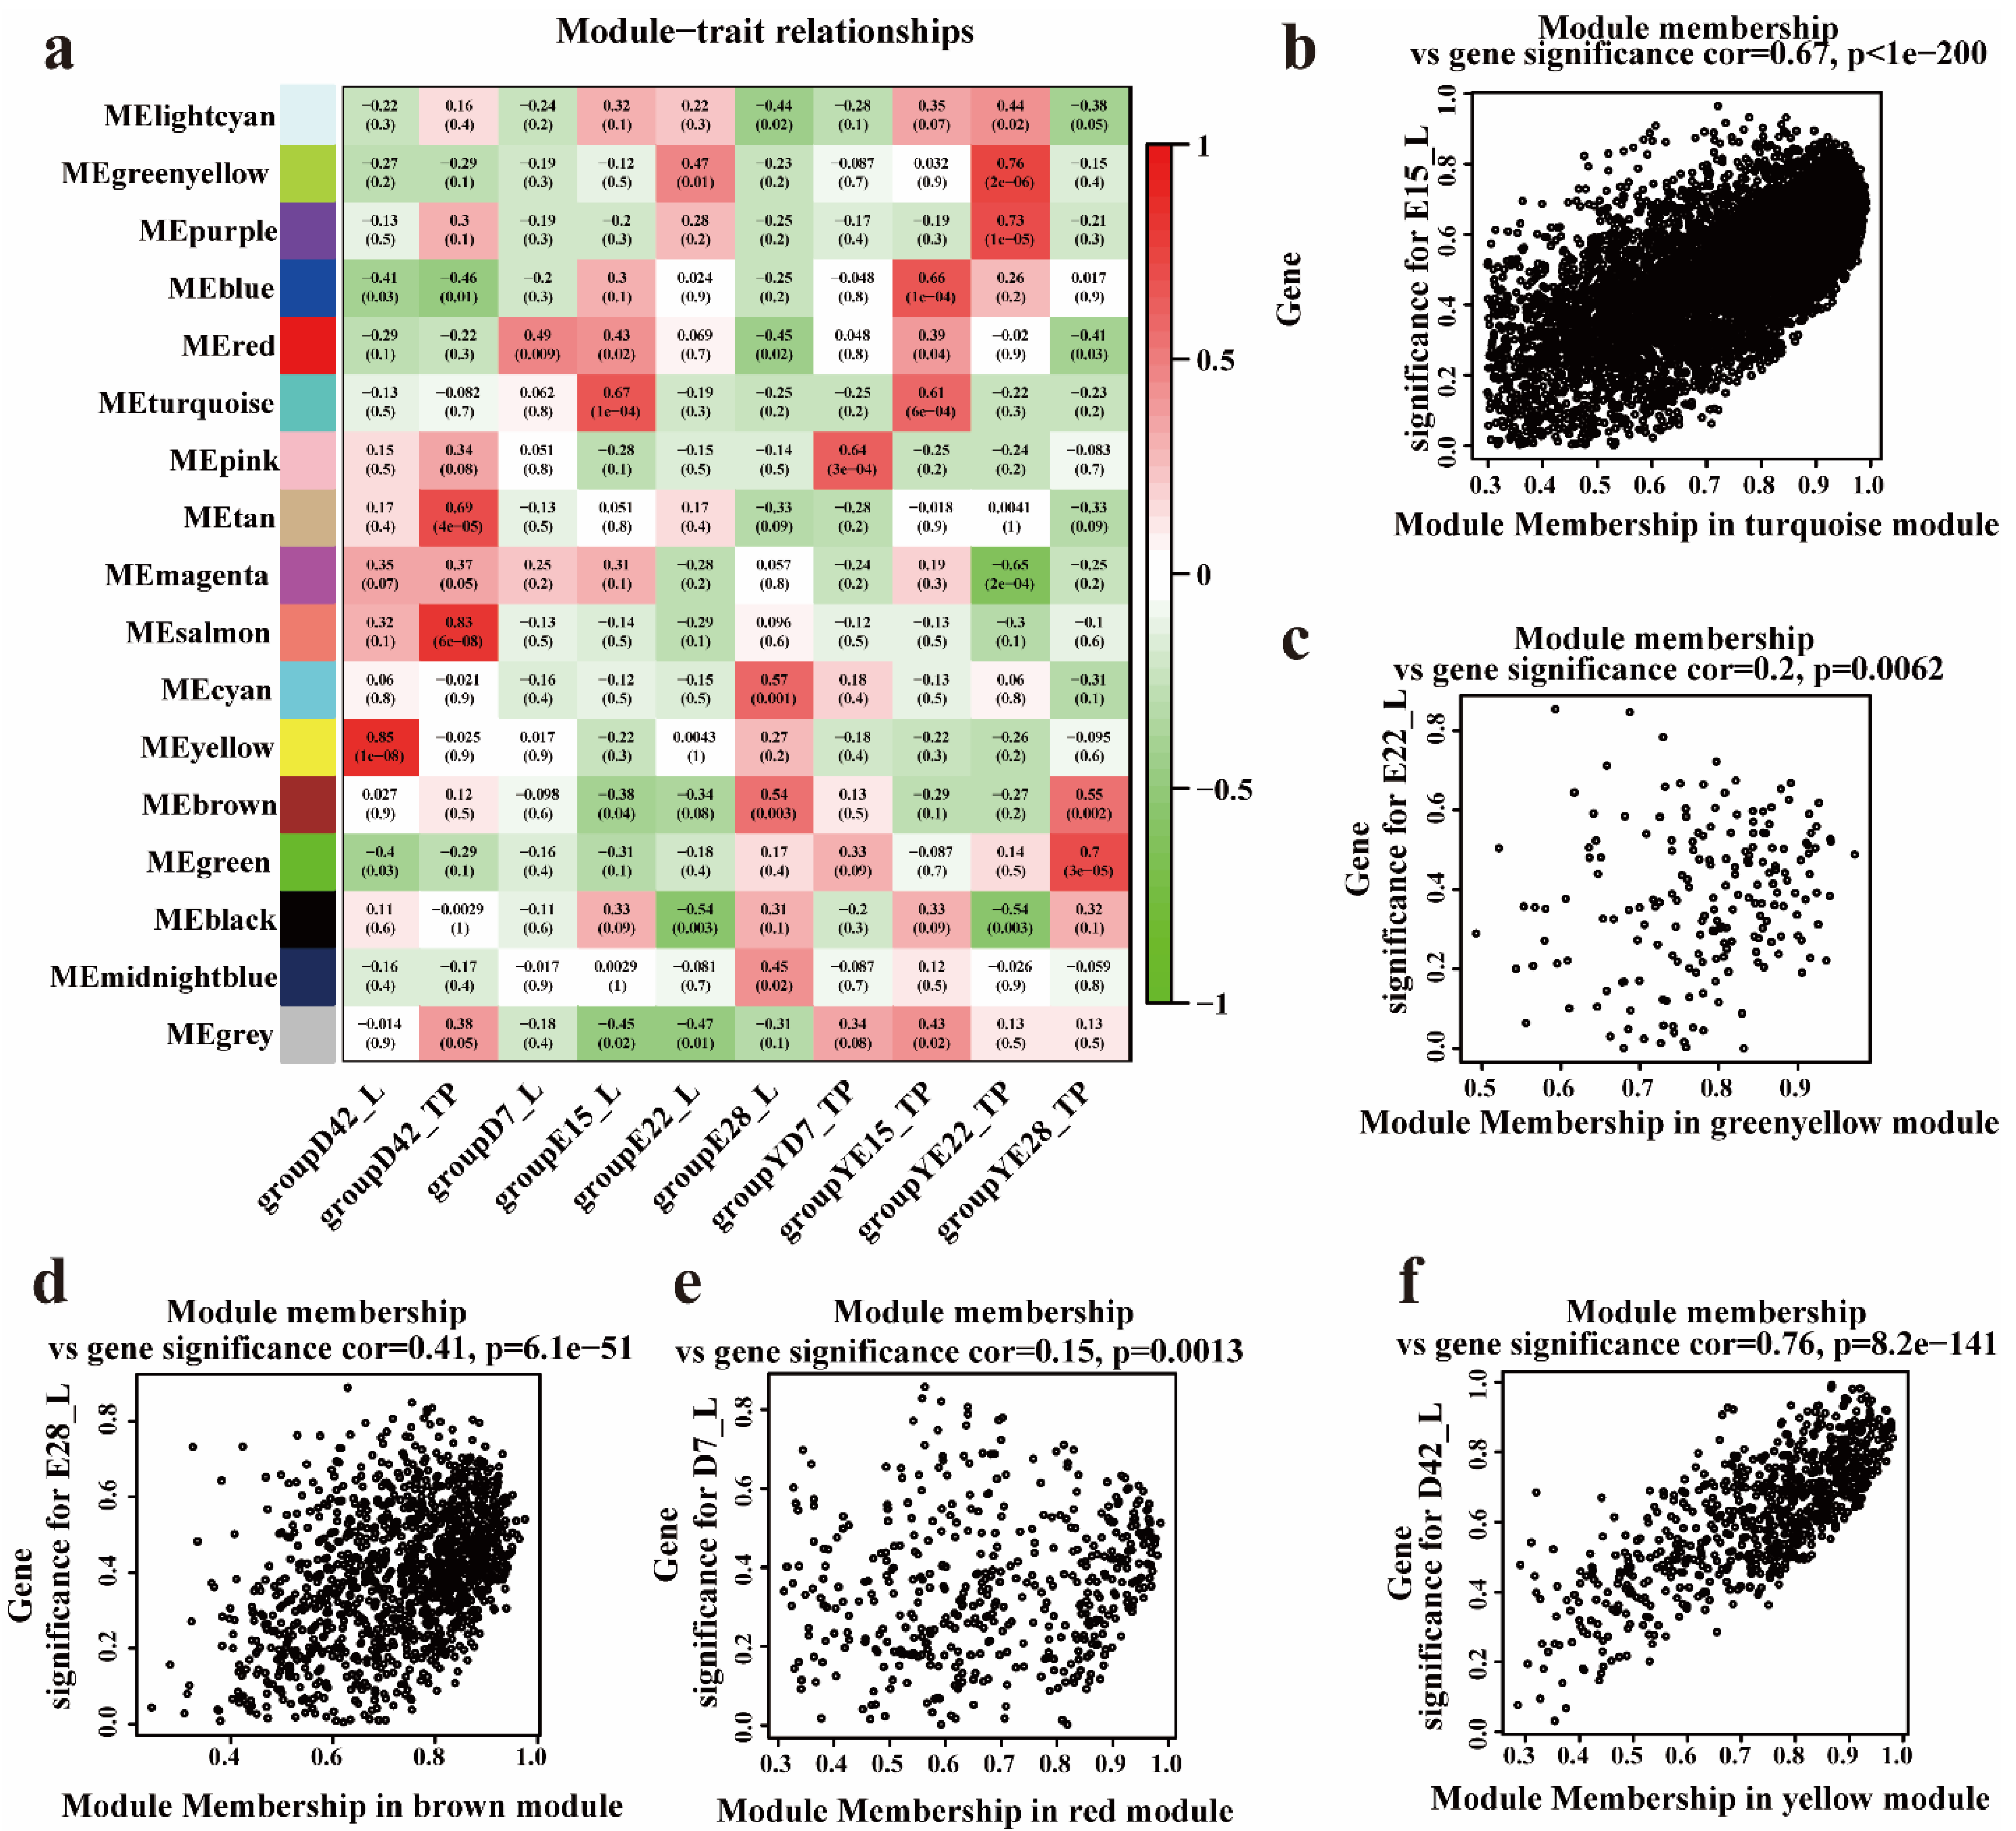
3.3. Hub Genes Identified in the Crest Cushion by Weighted Coexpression Network Analysis
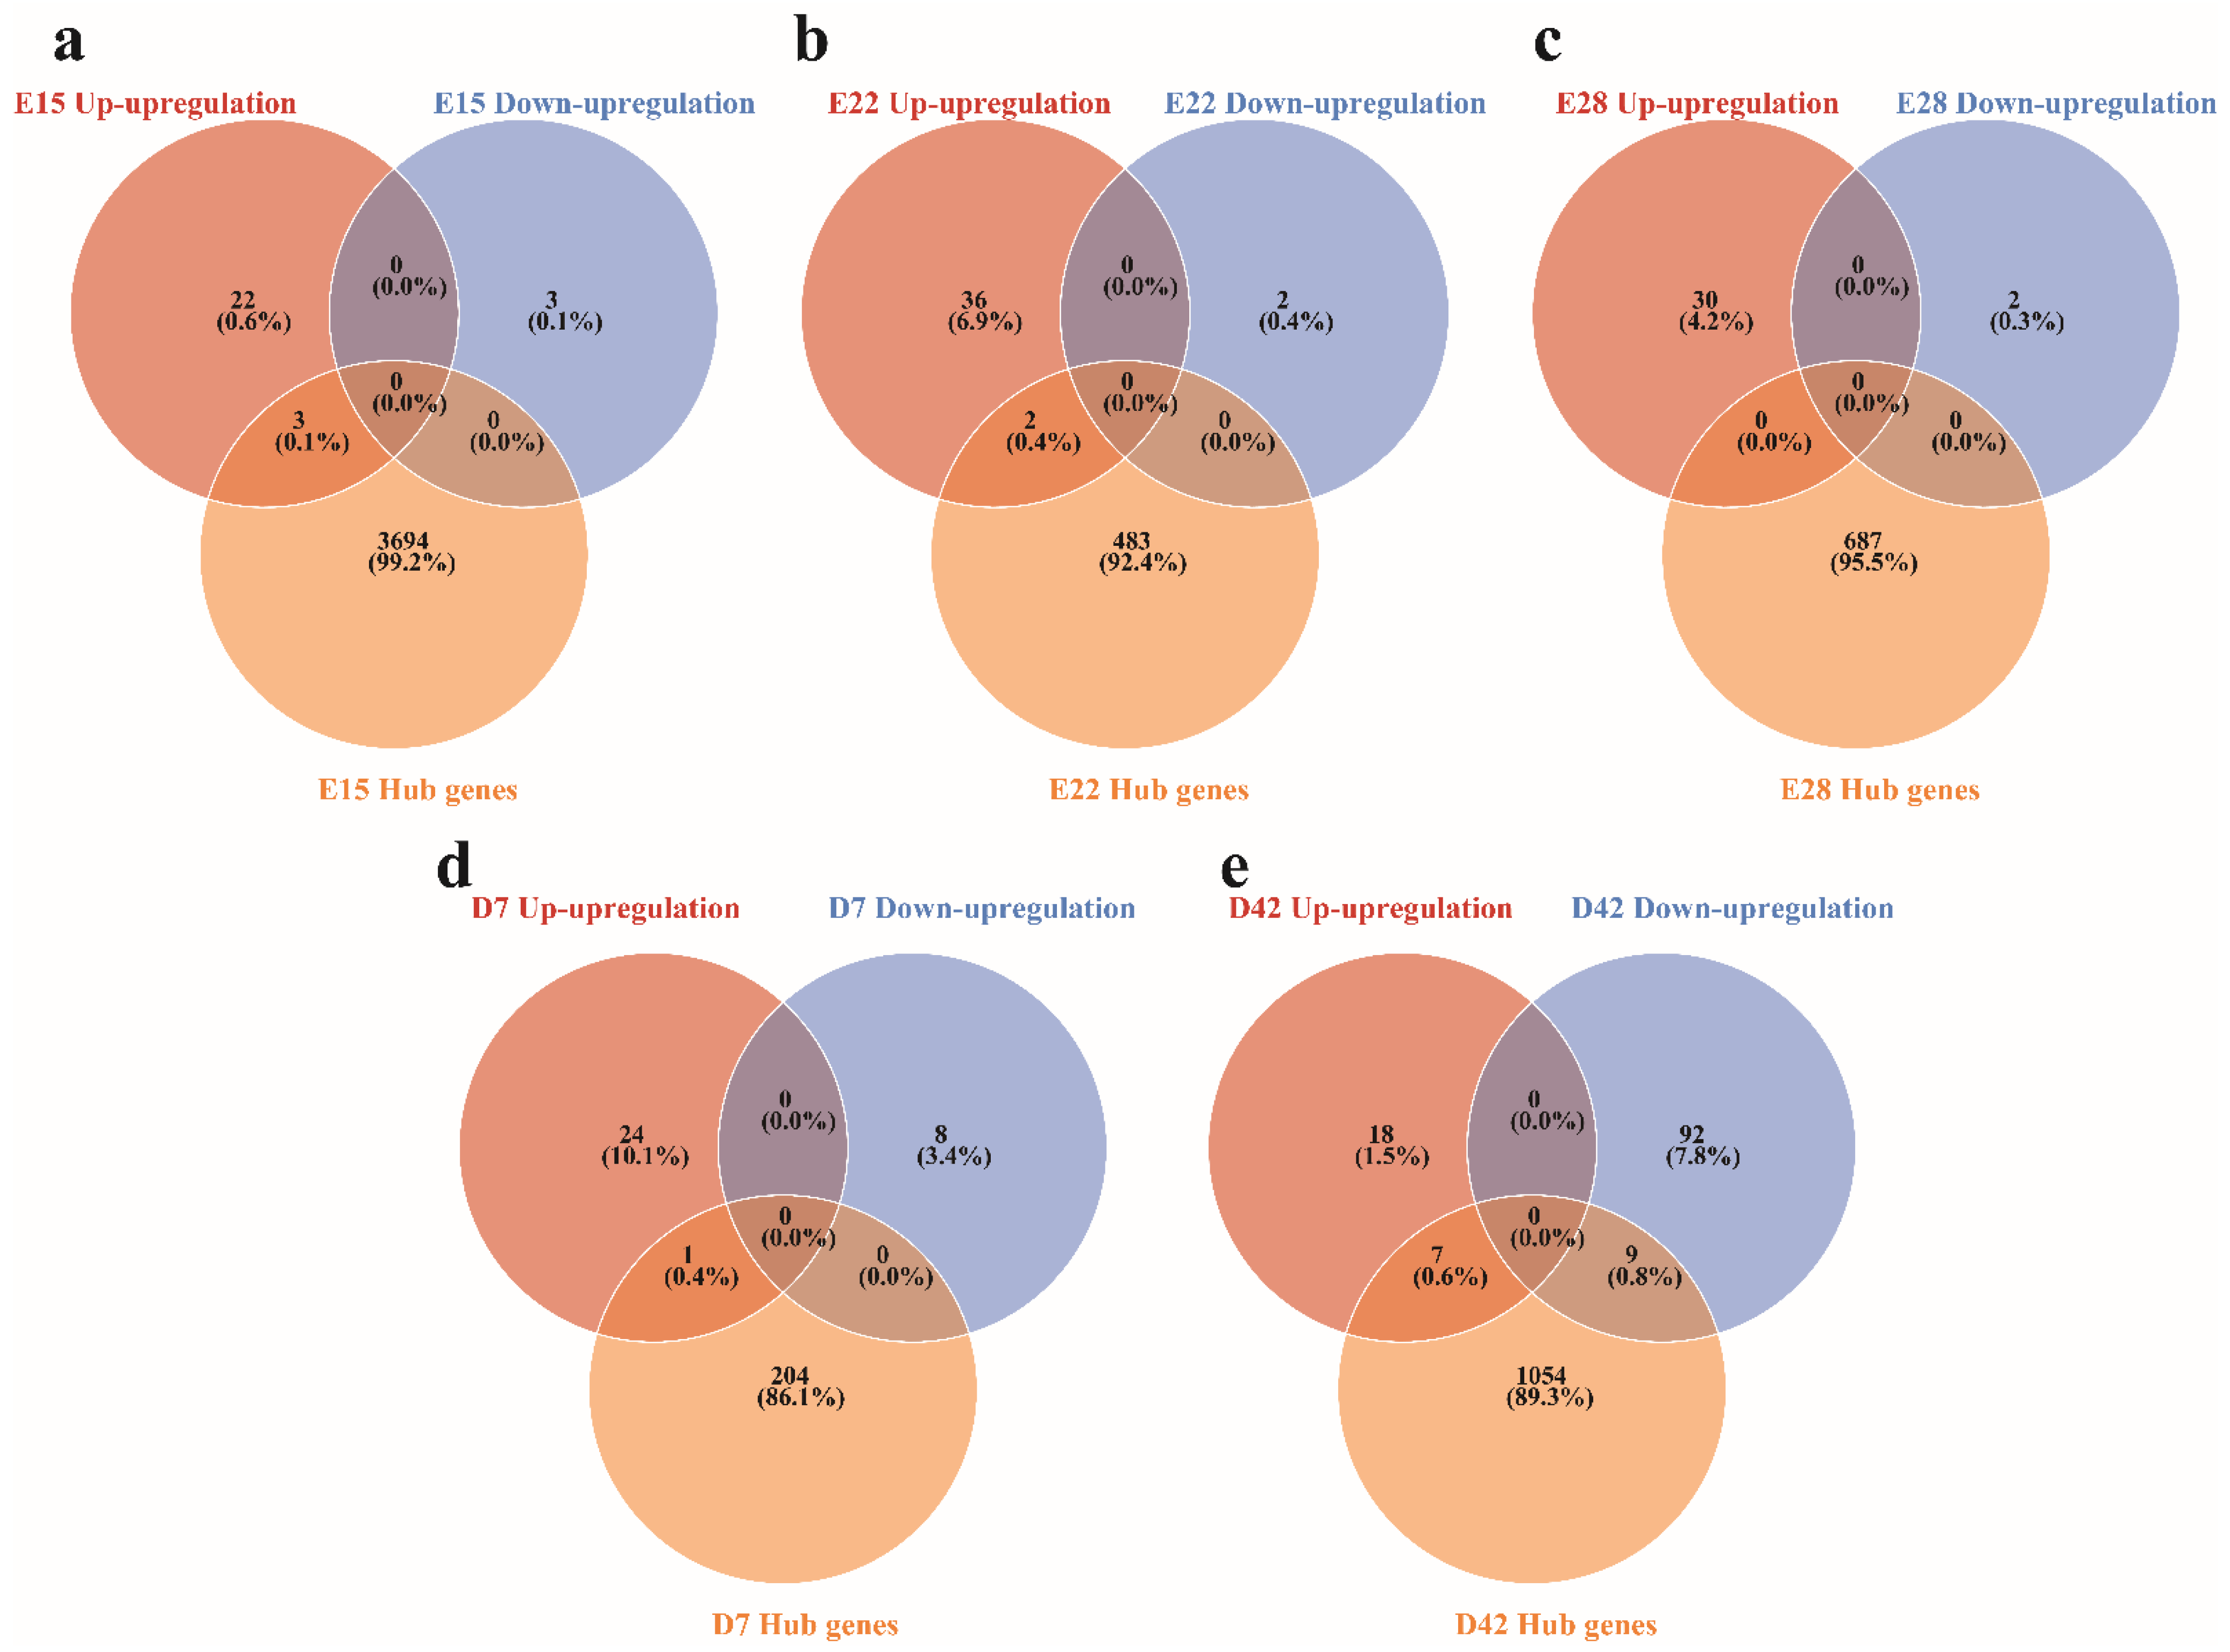
3.4. Identifying Hub Genes Associated with the Crest Cushion in the Different Developmental Stages
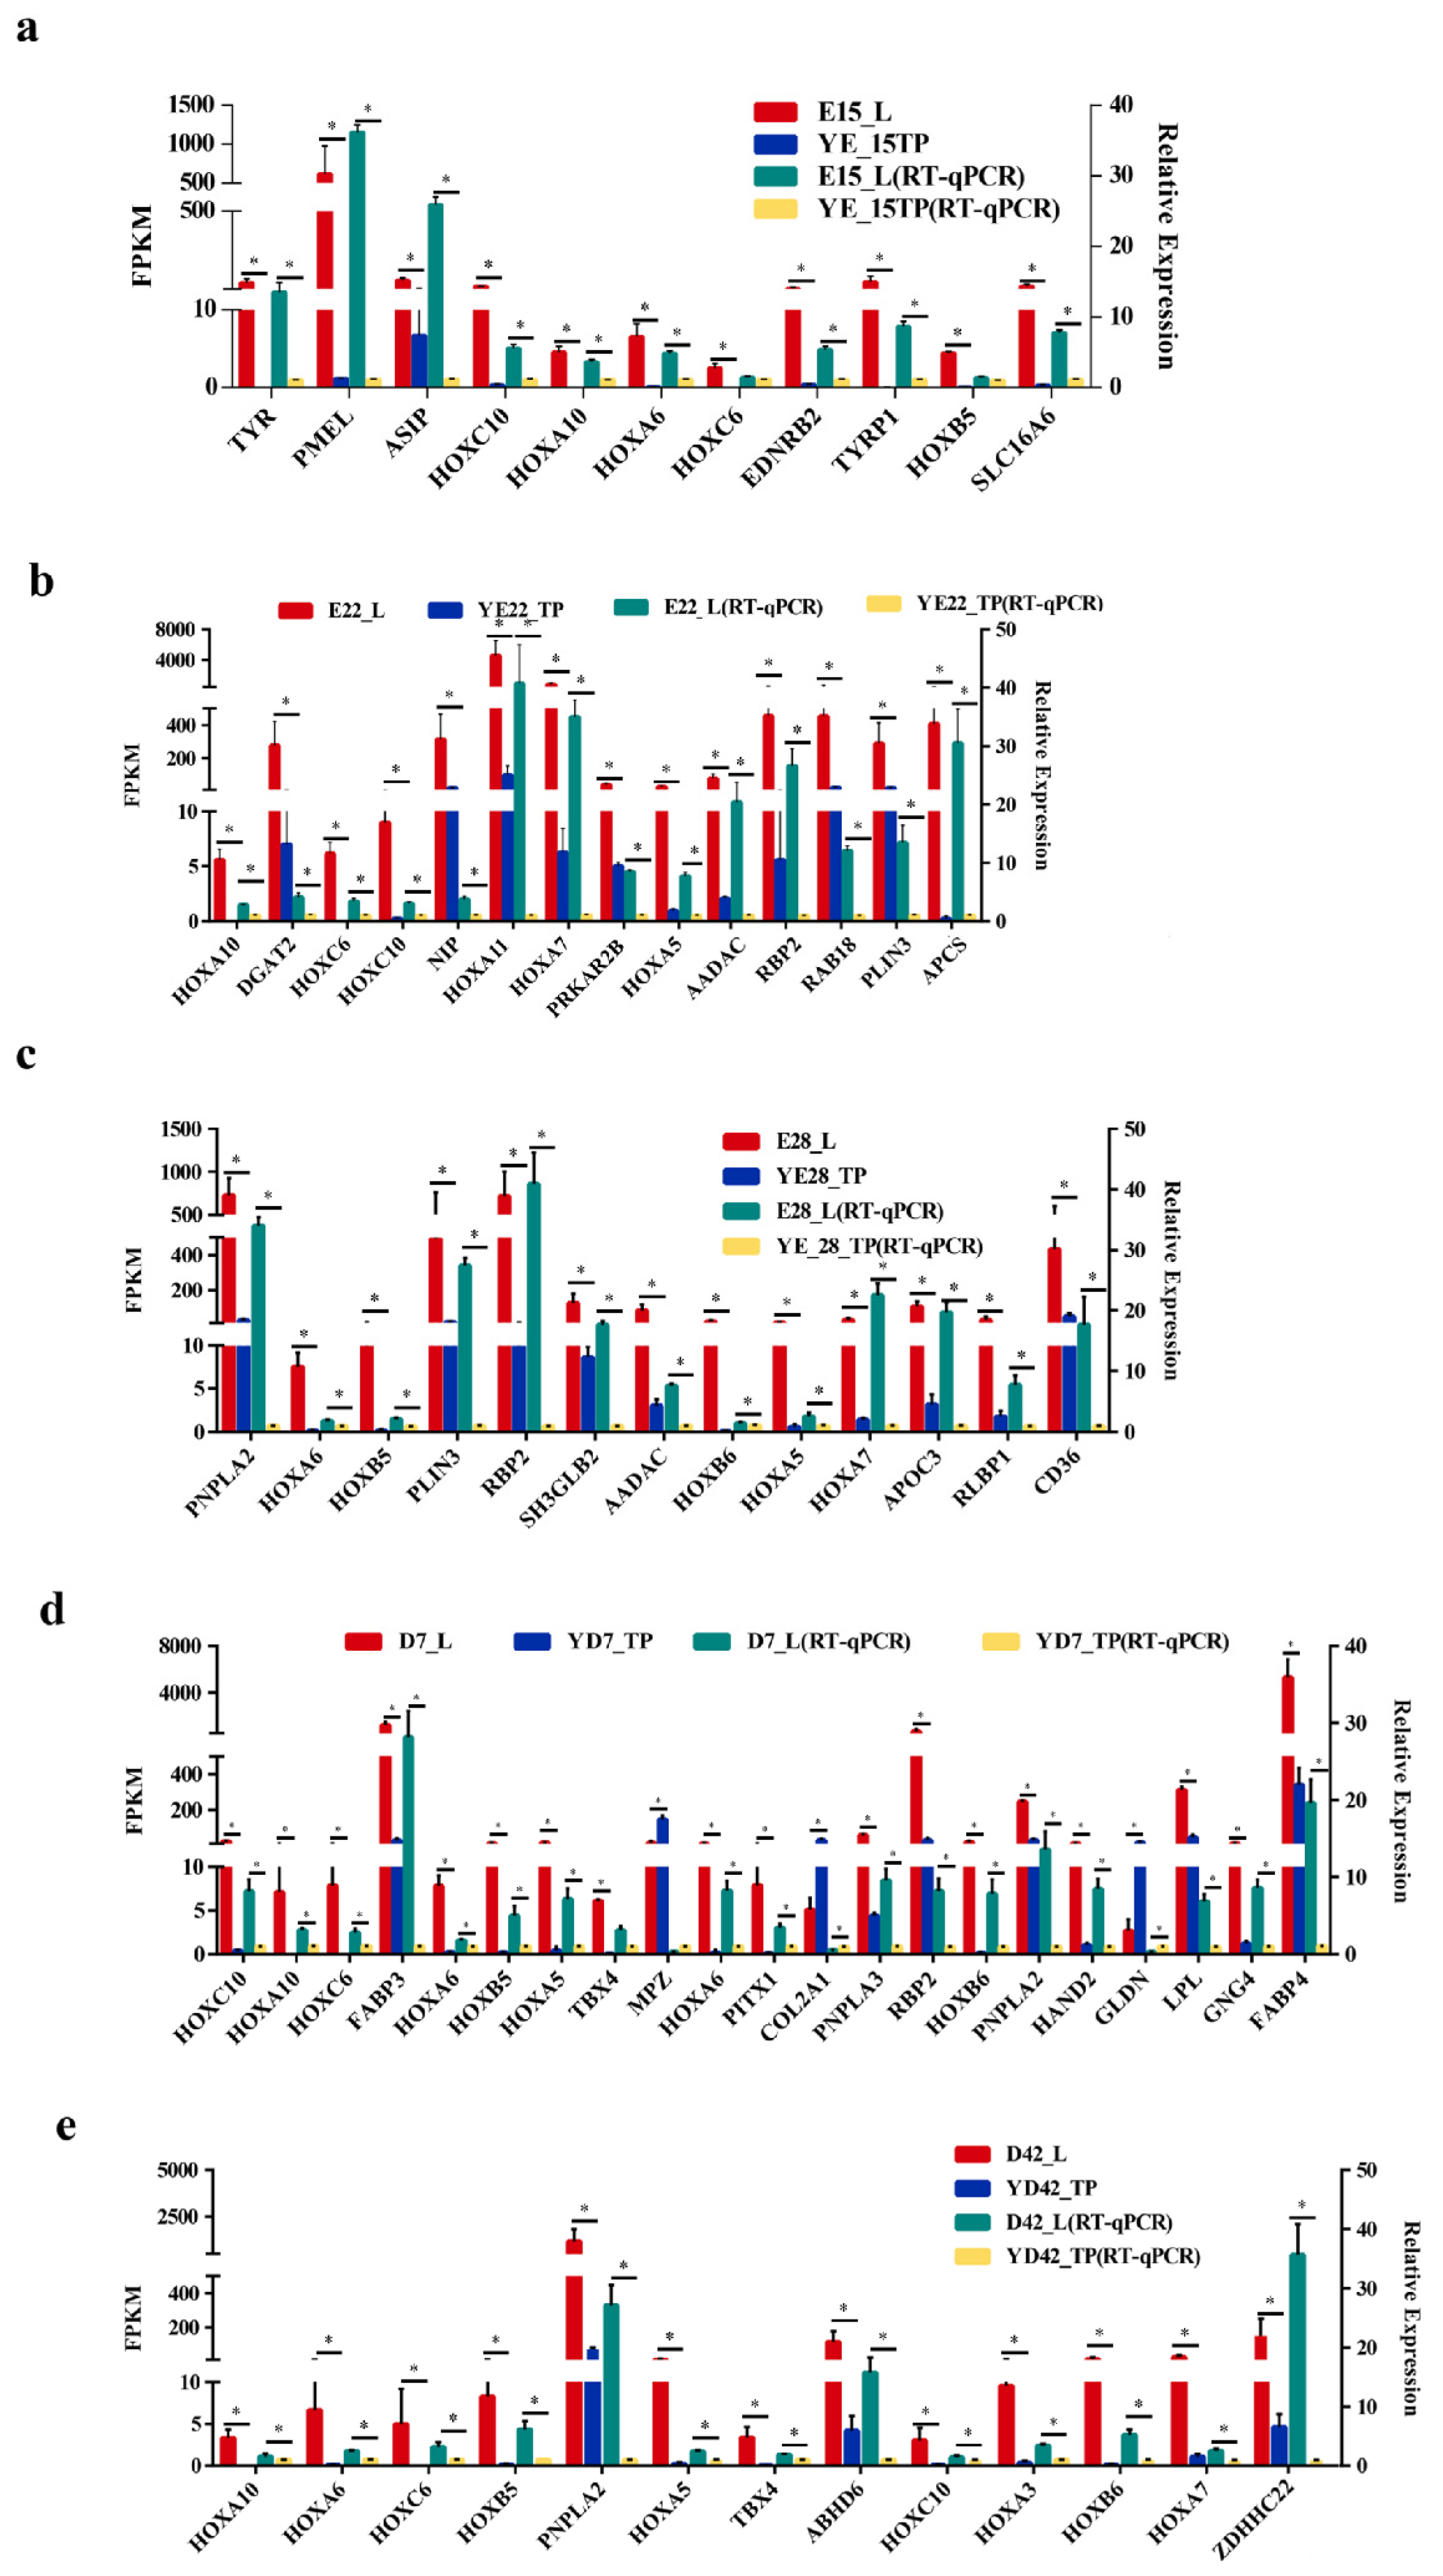
3.5. Validation of Genes Associated with the Crest Cushion
4. Discussion
5. Conclusions
Supplementary Materials
Author Contributions
Funding
Institutional Review Board Statement
Informed Consent Statement
Data Availability Statement
Acknowledgments
Conflicts of Interest
References
- Reeves, R.R.; Tracey, S. Monodon monoceros. Mamm. Species 1980, 127, 1–7. [Google Scholar] [CrossRef]
- Jarman, P.J. The Social Organisation of Antelope in Relation To Their Ecology. Behaviour 1974, 48, 215–267. [Google Scholar] [CrossRef]
- Krieger, J.; Breer, H. Olfactory reception in invertebrates. Science 1999, 286, 720–723. [Google Scholar] [CrossRef]
- Davis, E.B.; Brakora, K.A.; Lee, A.H. Evolution of ruminant headgear: A review. Proc. Biol. Sci. 2011, 278, 2857–2865. [Google Scholar] [CrossRef]
- Hassanin, A.; Douzery, E.J. Molecular and morphological phylogenies of ruminantia and the alternative position of the moschidae. Syst. Biol. 2003, 52, 206–228. [Google Scholar] [CrossRef]
- Hernández Fernández, M.; Vrba, E.S. A complete estimate of the phylogenetic relationships in Ruminantia: A dated species-level supertree of the extant ruminants. Biol. Rev. 2005, 80, 269–302. [Google Scholar] [CrossRef]
- Wang, T.; Zhang, Y.; Guo, Y.; Zhang, X.; Yang, H.; Tian, X.; Zhu, M.; Guo, Z.; Zeng, S.; Luo, K.; et al. RNA-sequence reveals differentially expressed genes affecting the crested trait of Wumeng crested chicken. Poult. Sci. 2021, 100, 101357. [Google Scholar] [CrossRef]
- Cnotka, J.; Frahm, H.D.; Mpotsaris, A.; Rehkamper, G. Motor incoordination, intracranial fat bodies, and breeding strategy in Crested ducks (Anas platyrhynchos f.d.). Poult. Sci. 2007, 86, 1850–1855. [Google Scholar] [CrossRef]
- Chang, G.; Yuan, X.; Guo, Q.; Bai, H.; Cao, X.; Liu, M.; Wang, Z.; Li, B.; Wang, S.; Jiang, Y.; et al. The first crested duck genome reveals clues to genetic compensation and crest cushion formation. bioRxiv 2021. bioRxiv:2021.2007.2025.452189. [Google Scholar] [CrossRef]
- Darwin, C.R. The Variation of Animals and Plants under Domestication. Br. Foreign Med. Chir. Rev. 1868, 42, 143–166. [Google Scholar]
- Frahm, H.D.; Rehkamper, G.; Werner, C.W. Brain alterations in crested versus non-crested breeds of domestic ducks (Anas platyrhynchos f.d.). Poult. Sci. 2001, 80, 1249–1257. [Google Scholar] [CrossRef]
- Alonso, C.R. Hox proteins: Sculpting body parts by activating localized cell death. Curr. Biol. 2002, 12, R776–R778. [Google Scholar] [CrossRef][Green Version]
- Dunn, J.; Thabet, S.; Jo, H. Flow-Dependent Epigenetic DNA Methylation in Endothelial Gene Expression and Atherosclerosis. Arterioscler. Thromb. Vasc. Biol. 2015, 35, 1562–1569. [Google Scholar] [CrossRef] [PubMed]
- Dunn, J.; Simmons, R.; Thabet, S.; Jo, H. The role of epigenetics in the endothelial cell shear stress response and atherosclerosis. Int. J. Biochem. Cell Biol. 2015, 67, 167–176. [Google Scholar] [CrossRef]
- Myers, C.; Charboneau, A.; Boudreau, N. Homeobox B3 promotes capillary morphogenesis and angiogenesis. J. Cell Biol. 2000, 148, 343–351. [Google Scholar] [CrossRef]
- Chen, Y.; Xu, B.; Arderiu, G.; Hashimoto, T.; Young, W.L.; Boudreau, N.; Yang, G.Y. Retroviral delivery of homeobox D3 gene induces cerebral angiogenesis in mice. J. Cereb. Blood Flow Metab. 2004, 24, 1280–1287. [Google Scholar] [CrossRef]
- Myers, C.; Charboneau, A.; Cheung, I.; Hanks, D.; Boudreau, N. Sustained expression of homeobox D10 inhibits angiogenesis. Am. J. Pathol. 2002, 161, 2099–2109. [Google Scholar] [CrossRef]
- Mace, K.A.; Hansen, S.L.; Myers, C.; Young, D.M.; Boudreau, N. HOXA3 induces cell migration in endothelial and epithelial cells promoting angiogenesis and wound repair. J. Cell Sci. 2005, 118, 2567–2577. [Google Scholar] [CrossRef]
- Wang, Y.; Gao, Y.; Imsland, F.; Gu, X.; Feng, C.; Liu, R.; Song, C.; Tixier-Boichard, M.; Gourichon, D.; Li, Q.; et al. The crest phenotype in chicken is associated with ectopic expression of HOXC8 in cranial skin. PLoS ONE 2012, 7, e34012. [Google Scholar] [CrossRef]
- Li, J.; Lee, M.O.; Davis, B.W.; Wu, P.; Hsieh Li, S.M.; Chuong, C.M.; Andersson, L. The crest phenotype in domestic chicken is caused by a 197 bp duplication in the intron of HOXC10. G3 2021, 11, jkaa048. [Google Scholar] [CrossRef]
- Wu, Y.; Moser, M.; Bautch, V.L.; Patterson, C. HoxB5 is an upstream transcriptional switch for differentiation of the vascular endothelium from precursor cells. Mol. Cell Biol. 2003, 23, 5680–5691. [Google Scholar] [CrossRef] [PubMed]
- Fessner, A.; Esser, J.S.; Bluhm, F.; Grundmann, S.; Zhou, Q.; Patterson, C.; Bode, C.; Moser, M. The transcription factor HoxB5 stimulates vascular remodelling in a cytokine-dependent manner. Cardiovasc. Res. 2014, 101, 247–255. [Google Scholar] [CrossRef] [PubMed]
- Behrens, A.N.; Iacovino, M.; Lohr, J.L.; Ren, Y.; Zierold, C.; Harvey, R.P.; Kyba, M.; Garry, D.J.; Martin, C.M. Nkx2-5 mediates differential cardiac differentiation through interaction with Hoxa10. Stem Cells Dev. 2013, 22, 2211–2220. [Google Scholar] [CrossRef] [PubMed]


Publisher’s Note: MDPI stays neutral with regard to jurisdictional claims in published maps and institutional affiliations. |
© 2022 by the authors. Licensee MDPI, Basel, Switzerland. This article is an open access article distributed under the terms and conditions of the Creative Commons Attribution (CC BY) license (https://creativecommons.org/licenses/by/4.0/).
Share and Cite
Guo, Q.; Huang, L.; Jiang, Y.; Wang, Z.; Chen, G.; Bai, H.; Chang, G. Identification of Genes Associated with Crest Cushion Development in the Chinese Crested Duck. Animals 2022, 12, 2150. https://doi.org/10.3390/ani12162150
Guo Q, Huang L, Jiang Y, Wang Z, Chen G, Bai H, Chang G. Identification of Genes Associated with Crest Cushion Development in the Chinese Crested Duck. Animals. 2022; 12(16):2150. https://doi.org/10.3390/ani12162150
Chicago/Turabian StyleGuo, Qixin, Lan Huang, Yong Jiang, Zhixiu Wang, Guohong Chen, Hao Bai, and Guobin Chang. 2022. "Identification of Genes Associated with Crest Cushion Development in the Chinese Crested Duck" Animals 12, no. 16: 2150. https://doi.org/10.3390/ani12162150
APA StyleGuo, Q., Huang, L., Jiang, Y., Wang, Z., Chen, G., Bai, H., & Chang, G. (2022). Identification of Genes Associated with Crest Cushion Development in the Chinese Crested Duck. Animals, 12(16), 2150. https://doi.org/10.3390/ani12162150