Review

Comparison of Nutritive Values of Tropical Pasture Species Grown in Different Environments, and Implications for Livestock Methane Production: A Meta-Analysis

by
Priyanath Jayasinghe
1,2,*,
Thiagarajah Ramilan
1,
Daniel J. Donaghy
1,
Keith G. Pembleton
3 and
David G. Barber
4
1
School of Agriculture and Environment, Massey University, Private Bag 11 222, Palmerston North 4440, New Zealand
2
Department of Animal Science, Faculty of Animal Science and Export Agriculture, Uva Wellassa University, Badulla 90000, Sri Lanka
3
Centre for Sustainable Agricultural Systems and School of Agriculture and Environmental Science, University of Southern Queensland, Toowoomba, QLD 4350, Australia
4
Agri-Science Queensland, Department of Agriculture and Fisheries Queensland, University of Queensland Gatton Campus, Lawes, QLD 4343, Australia
*
Author to whom correspondence should be addressed.
Animals 2022, 12(14), 1806; https://doi.org/10.3390/ani12141806
Submission received: 11 June 2022 / Revised: 7 July 2022 / Accepted: 11 July 2022 / Published: 14 July 2022
(This article belongs to the Section Animal Nutrition)

Abstract

:

Simple Summary

Globally, tropical pasture species predominate in tropical and subtropical climates, and are the primary feed source for grazing livestock including dairy cattle. Therefore, this study aimed at systematically analysing the nutritive values of tropical pastures and the implications of potential methane gas production from tropical pasture species and livestock, in relation to the growing conditions and agronomic management approaches used (defoliation frequency and intensity) across different climates. This analysis allowed us to understand the better performing tropical pasture species grown across wider geographical regions, in order to improve pasture-based livestock production systems. Results revealed that pasture quality and methane gas production varied among and within species, and were significantly affected by the climate and by the agronomic management regime as well.

Abstract

The demand for dairy products is ever increasing across the world. The livestock sector is a significant source of greenhouse gas (GHG) emissions globally. The availability of high-quality pasture is a key requirement to increase the productivity of dairy cows as well as manage enteric methane emissions. Warm-season perennial grasses are the dominant forages in tropical and subtropical regions, and thus exploring their nutritive characteristics is imperative in the effort to improve dairy productivity. Therefore, we have collated a database containing a total of 4750 records, with 1277 measurements of nutritive values representing 56 tropical pasture species and hybrid cultivars grown in 26 different locations in 16 countries; this was done in order to compare the nutritive values and GHG production across different forage species, climatic zones, and defoliation management regimes. Average edaphoclimatic (with minimum and maximum values) conditions for tropical pasture species growing environments were characterized as 22.5 °C temperature (range 17.5–29.30 °C), 1253.9 mm rainfall (range 104.5–3390.0 mm), 582.6 m elevation (range 15–2393 m), and a soil pH of 5.6 (range 4.6–7.0). The data revealed spatial variability in nutritive metrics across bioclimatic zones and between and within species. The ranges of these nutrients were as follows: neutral detergent fibre (NDF) 50.9–79.8%, acid detergent fibre (ADF) 24.7–57.4%, crude protein (CP) 2.1–21.1%, dry matter (DM) digestibility 30.2–70.1%, metabolisable energy (ME)3.4–9.7 MJ kg−1 DM, with methane (CH4) production at 132.9–133.3 g animal−1 day−1. The arid/dry zone recorded the highest DM yield, with decreased CP and high fibre components and minerals. Furthermore, the data revealed that climate, defoliation frequency and intensity, in addition to their interactions, have a significant effect on tropical pasture nutritive values and CH4 production. Overall, hybrid and newer tropical cultivars performed well across different climates, with small variations in herbage quality. The current study revealed important factors that affect pasture nutritive values and CH4 emissions, with the potential for improving tropical forage through the selection and management of pasture species.

1. Introduction

Demand for dairy products is ever increasing across the world; however, the livestock sector is a significant source of global greenhouse gas (GHG) emissions [1]. Forage plants provide feed for an estimated 1.5 billion cattle and 0.2 billion buffalo around the world, supplying humans with our daily protein requirements [2]. Approximately 47% of global milk comes from tropical and subtropical regions [3]. Due to increasing populations in developing countries, global food production needs to substantially increase in the future; the demand is expected to nearly double by 2050 [4]. Parallel to the expansion of food production, GHG emissions have climbed; anthropogenic emissions account for a substantial proportion (58%) of these global emissions [5], with 18% (5.0–5.8 Gt CO2eq yr−1) of that generated by agriculture [6], contributing 25% of methane (CH4) production from the enteric fermentation of ruminants [4]. Dairy production in tropical regions is often lower than in temperate regions, due to a range of factors including lower nutritive value of forage grasses, lack of access to inorganic nitrogen (N) fertiliser, infertile soils, and adverse climatic conditions [7]. Mostly tropical cattle are fed a diet that is based essentially on pasture species that generally have low nutritive value, with large seasonal variations in quantity and quality [8]. However, nutrient intensification through planting improved forage options [9], in addition to adopting appropriate harvesting, fertilizing, and grazing practices [10], have substantially improved the nutritive value of tropical pastures.
The largest differences in nutritive values of herbage have been observed among different groups of forages (grasses and legumes, tropical and temperate species), but there are still substantial differences between species and even between different cultivars within a species [11]. Improving dairy cattle nutrition through adequate feeding of quality forage, choice of appropriate herbage species and cultivars depends on the adaptability of selected species to the farm environment and the resulting balance between quantity and quality [11]. However, a paucity of data that compares the nutritive values of tropical pastures grown across different environments limits the selection of forages for livestock. Therefore, gauging the performances of different pasture species and cultivars across different environments aids in identifying different spatial and temporal niches that are suitable for growing tropical pastures, in order to improve dairy cattle nutrition and lower GHG emissions in the tropics.
The age of the plants at their time of utilisation (by grazing or cutting) is an important aspect to consider in tropical pasture production, as this significantly affects their yield and chemical composition, which consequently affects milk production [12]. While dry matter (DM) production significantly increases with maturity, the digestibility and the crude protein (CP) content both rapidly decline with advancing plant maturity [13,14]. Although forage maturity reduces its nutritive value, environmental and agronomic management factors can alter the relationship between plant maturity and forage nutritive value [13,15]. Herbage accumulation and the nutritive value of grasses are both strongly affected by management factors, such as defoliation (grazing and cutting) frequency, intensity, and the application of N fertiliser (amount and frequency) [16,17]. Sward characteristics are highly sensitive to environmental conditions such as rainfall, air temperature, and incident solar radiation [18]. Therefore, herbage nutritive value might vary considerably in plants harvested at the same stage of maturity, if they are grown in different environments. Variable environmental conditions (e.g., increased temperature, low precipitation) can induce physiological and phenological changes in plants to delay or to hasten anthesis, which is associated with greater stem production (increased stem:leaf ratio) [19,20], leading to variations in nutritive value. Therefore, systematically assessing the nutritive values of various tropical pasture species in relation to the growing conditions and agronomic management approaches (defoliation frequency and intensity) across different climates allows some of these interactions to be identified; in turn, this information can provide a basis to explore options for intensification of tropical livestock production systems.
In addition to increasing milk production, improving the nutritive value of tropical pasture species may also have environmental co-benefits in terms of reducing GHG emissions [10]. Forages generally have enhanced nutritive value for livestock if they contain a greater proportion of readily fermentable components, such as sugars, organic acids, and proteins, as well as a lower proportion of fibre [21]. The chemical composition and morphology of pasture species determines their preference and subsequently influences the feed intake, the efficiency of rumination, the rates of weight gain, the quality and volume of milk produced, and the reproductive performance of grazing ruminants [22]; moreover, the chemical composition and morphology of pasture species may also change the environmental footprint of livestock products in terms of CH4 emissions. Increased pasture nutritive value can reduce CH4 emissions by 5% with increasing total tract neutral detergent fibre digestibility (NDFD) [23], and this also is expected to increase the production of volatile fatty acids (VFA), thereby increasing milk production [23]. Furthermore, better nutritive values of herbages increase the DM intake (DMI) and subsequently decrease CH4 emissions by 2–6% for each kilogram of increased DMI [23].
Despite the array of individual studies conducted that relate to tropical pasture production and nutritive value assessment, no study has accessed the multiple nutritive metrics of commonly cultivated tropical pasture species and newer cultivars in different agroclimatic conditions under varying defoliation management regimes (frequency and intensity). Further, subsequent effects of nutritive value on possible CH4 emissions have not been well elucidated. Therefore, this meta-analysis aimed at the following: (i) to compare the nutritive value variation between tropical pasture species grown in different bioclimatic environments with implications for subsequent CH4 production from dairy cows; and (ii) to evaluate the effect of defoliation interval, intensity, and bioclimate on nutritive values and CH4 emissions using a georeferenced tropical pasture nutritive metrics database.

2. Materials and Methods

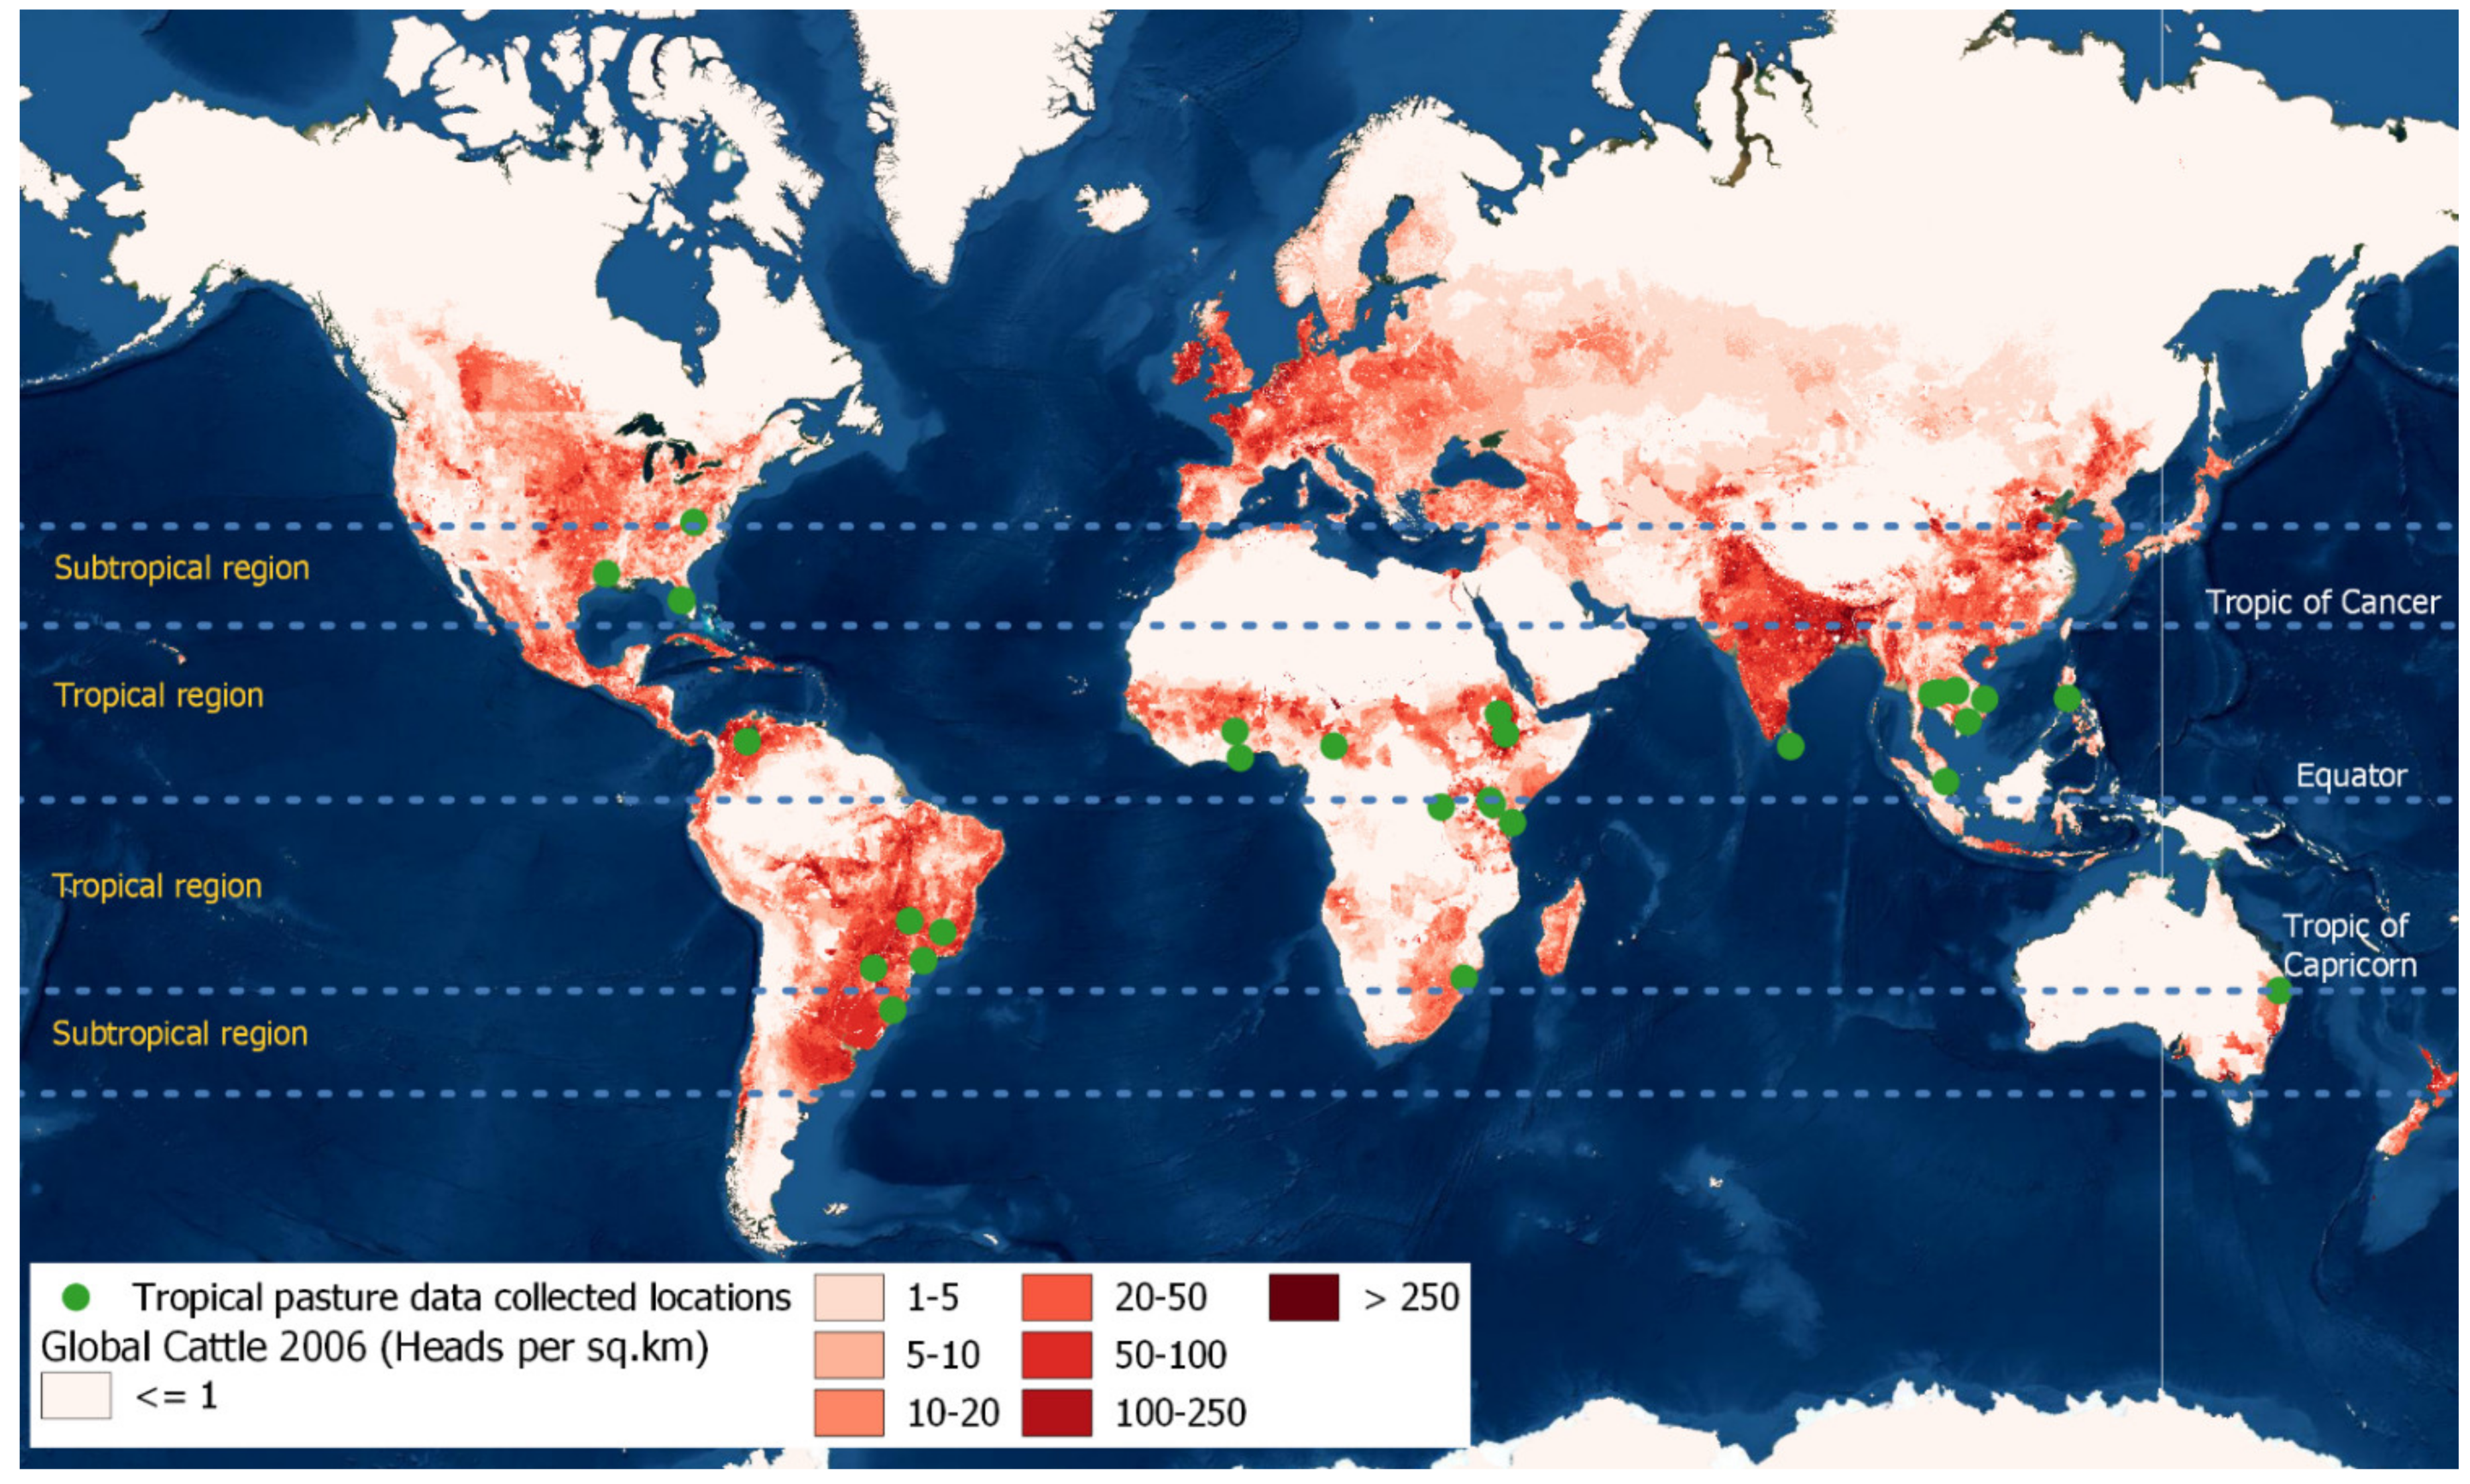
2.1. Data Collection

We constructed a georeferenced database from the tropical forage experimental data. Experiments that were included were identified by systematically searching the available literature on the Discover, Web of Science, Scopus, and Google Scholar databases from 15 March–20 April 2021. Initial search terms used were ‘defoliation’, ‘harvesting time’, ‘cutting interval’, ‘methane gas’, ‘CH4 gas’, ‘emission’, combined with ‘tropical pasture’, ‘pasture quality’, and ‘nutritive value’. The searched articles were included in the database if the nutritive value or chemical composition had been analysed for a specific tropical grass species, or for those that were hybrid grown and tested under field conditions at a defined location and harvested more than once. This meta-analysis did not intend to explore the tropical legumes, herbs, and cereal grasses; therefore, such articles were excluded. All experiments that tested in climate-controlled environments (e.g., glasshouses) were also excluded from the database.
Collated articles were closely scrutinized based on important descriptive statistics, in order to be considered as data input for the analysis. Experimental, site-specific geospatial data (latitude, longitude, altitude, mean sea level (MSL)), as well as climate parameters (mean annual temperature (MAT) and mean annual rainfall (MAR)) were also recorded where available. Google Earth Pro Version 7.3.1 (Google Inc, Mountain View, CA, USA) was used to supplement missing geospatial data for certain locations. Similarly, missing climate variables were obtained from NASA POWER data access viewer (https://power.larc.nasa.gov (accessed on 22 April 2021) by generating agroclimatology files. Site-specific climate data were used with criteria in the Köppen-Geiger climate classification [24], in order to identify the climatic types for each experimental location. Soil physical properties such as soil type and soil pH were also included, where possible, in order to describe the experimental site. All species and hybrids were designated with unique codes; in addition, for each grass species, defoliation frequency and nutritive value metrics were assigned to a new row as a treatment in the database. Defoliation frequency was recorded in days for each defoliation event. In total, 35 individual studies consisting of 294 treatments were included in the database (Supplementary Table S2).
Dry matter yield of the pasture species was recorded in units of t ha−1 year−1. Organic matter (OM) and forage nutritive values (CP, acid detergent fibre (ADF), NDF, and acid detergent lignin (ADL)) were included if analysed by either the Association of Official Agricultural Chemists (AOAC, 1975) or by near-infrared spectroscopy (NIRS) methods and recorded as either percentages of DM or g kg−1. Wherever forage CP was analysed using wet chemistry and expressed as N content, CP was estimated by multiplying the determined nitrogen (N) content by 6.25. Tropical forage digestibility metrics (DM digestibility (DMD) and OM digestibility (OMD)) were included in the database if they were estimated using in vivo, in vitro or NIRS techniques, and if forage energy values (MJ kg−1 DM) were expressed in terms of metabolisable energy (ME) [25].

2.2. Data Processing and Analyses

The metabolisable energy [25] and OMD [26] of each tropical pasture were estimated using the following equations:
ME = (0.16 × OMD) − 1.8
OMD (%) = 3.802 + 0.97051 × DMD (%)
Methane gas (g CH4 animal−1 day−1) was estimated using the NDF and DMI in the database for tropical pasture species using a published relationship. This selected equation that follows was a product of a meta-analysis [26] where the database consisted mainly of tropical pastures fed to cattle in tropical regions:
CH4 (g CH4 animal−1 day−1) = 17.0 (±0.99) × DMI + 0.03 (±0.01) × NDF
According to the meta-analysis of Lee et al. [27], the average DMI of tropical cattle was assumed to be 7.7 kg day−1 [28].
Nutritive value parameters and CH4 production were descriptively analysed and correlated with frequency of defoliation.
Following data processing, weighted, restricted maximum likelihood linear mixed-effects (LME) models were fitted [29], as shown below, in order to determine the nutritive value and CH4 production variation between bioclimatic zones as well as the effects of environmental and management determinants:
Y i j = B 0 + b 0 + B 1 × 1 i j + b 1 ×   1 i j + B 2   ×   2 i j + ...... + B p   X p i j + e i j
where Y i j represents the nutritive value parameters and CH4 in the ith treatment of the jth study; B 0 , B 1 ×   1 i j ,   B 2   ×   2 i j …., B p   X p i j are the fixed effects (intercept and effects of independent variables); b 0 (intercept) and b 1 (slope) are the random study effects (i = 1…. n treatments and j = 1…. n studies); and e i j is the sampling error.
Model fitting was carried out by including nutritive metrics and CH4 as response variables with multiple potential explanatory variables and their interactions. Defoliation frequency and defoliation intensity, along with the climatic type, were added as fixed effects. Different cultivars from the same site were recorded in the database and were repeatedly measured for the same nutritive metrics; therefore, when defining random effect, observations (treatment) were nested within cultivars, and different cultivars in the same study were nested within the study (site) in the LME model. Furthermore, mean annual rainfall, mean annual temperature, and mean sea level were added as covariates. Soil pH and soil type were shown to have no significant relationships (p > 0.05) with nutritive metrics and CH4; thus, these variables were not considered in the initial LME model. All the data were analysed using R statistical computing software (R Foundation for Statistical Computing, Vienna, Austria) [30].

3. Results

3.1. Description of the Analytical Database

The database contained a total of 4750 records, with 1277 measurements of nutritive value parameters representing 56 tropical pasture species and hybrid cultivars grown in 26 different tropical environments in 16 countries (Figure 1). In some studies, not all of the chosen variables were reported; therefore, the number of observations was not uniform (Table 1). According to the collated data, tropical forage growing environments were characterized as 22.5 °C MAT (range 17.5–29.30 °C), 1253.9 mm MAR (range 104.5–3390.0 mm), 582.6 m MSL (range 15–2393 m), and 5.6 (range 4.6–7.0) mean soil pH.
Crude protein was the most commonly measured nutritive value (in 83% of the records), followed by NDF (70%), and ADF (67%). Acid detergent lignin was the least measured metric (15%), followed by OM (19%). According to the database of the present study, records were the most numerous from the tropical/equatorial bioclimatic zone, comprising 55% of the data set, compared with 36% from the warm temperate and 9% from the arid/dry bioclimatic zones. Multiple nutritive metrics contained in tropical/equatorial bioclimatic zone studies contributed to the largest total number of measurements in the database. Interestingly, genus Brachiaria was the commonly reported (34%) tropical pasture, followed by Cynodon (19%), and Pennisetum (16%). Within the genus, Brachiaria Mulato II was the most popular cultivar (20%). Descriptive statistics of key variables across all types of tropical pasture species are summarised in Table 1. There were large differences between minimum and maximum values (see the Table 1) in the data set for climate (MAT, MAR, MSL), defoliation frequency (days), DM yield, and nutritive values (CP, ADF, DMD, OMD, and ME).

3.2. Comparisons of the Nutritive Values

Nutritive values across all tropical pasture species are summarised (Supplementary Table S1), and ascending median values of main nutritive value components (CP and ME) and CH4 production are presented in Figure 2, Figure 3 and Figure 4, respectively. There was substantial variations in nutritive values both within and between species in different environments.

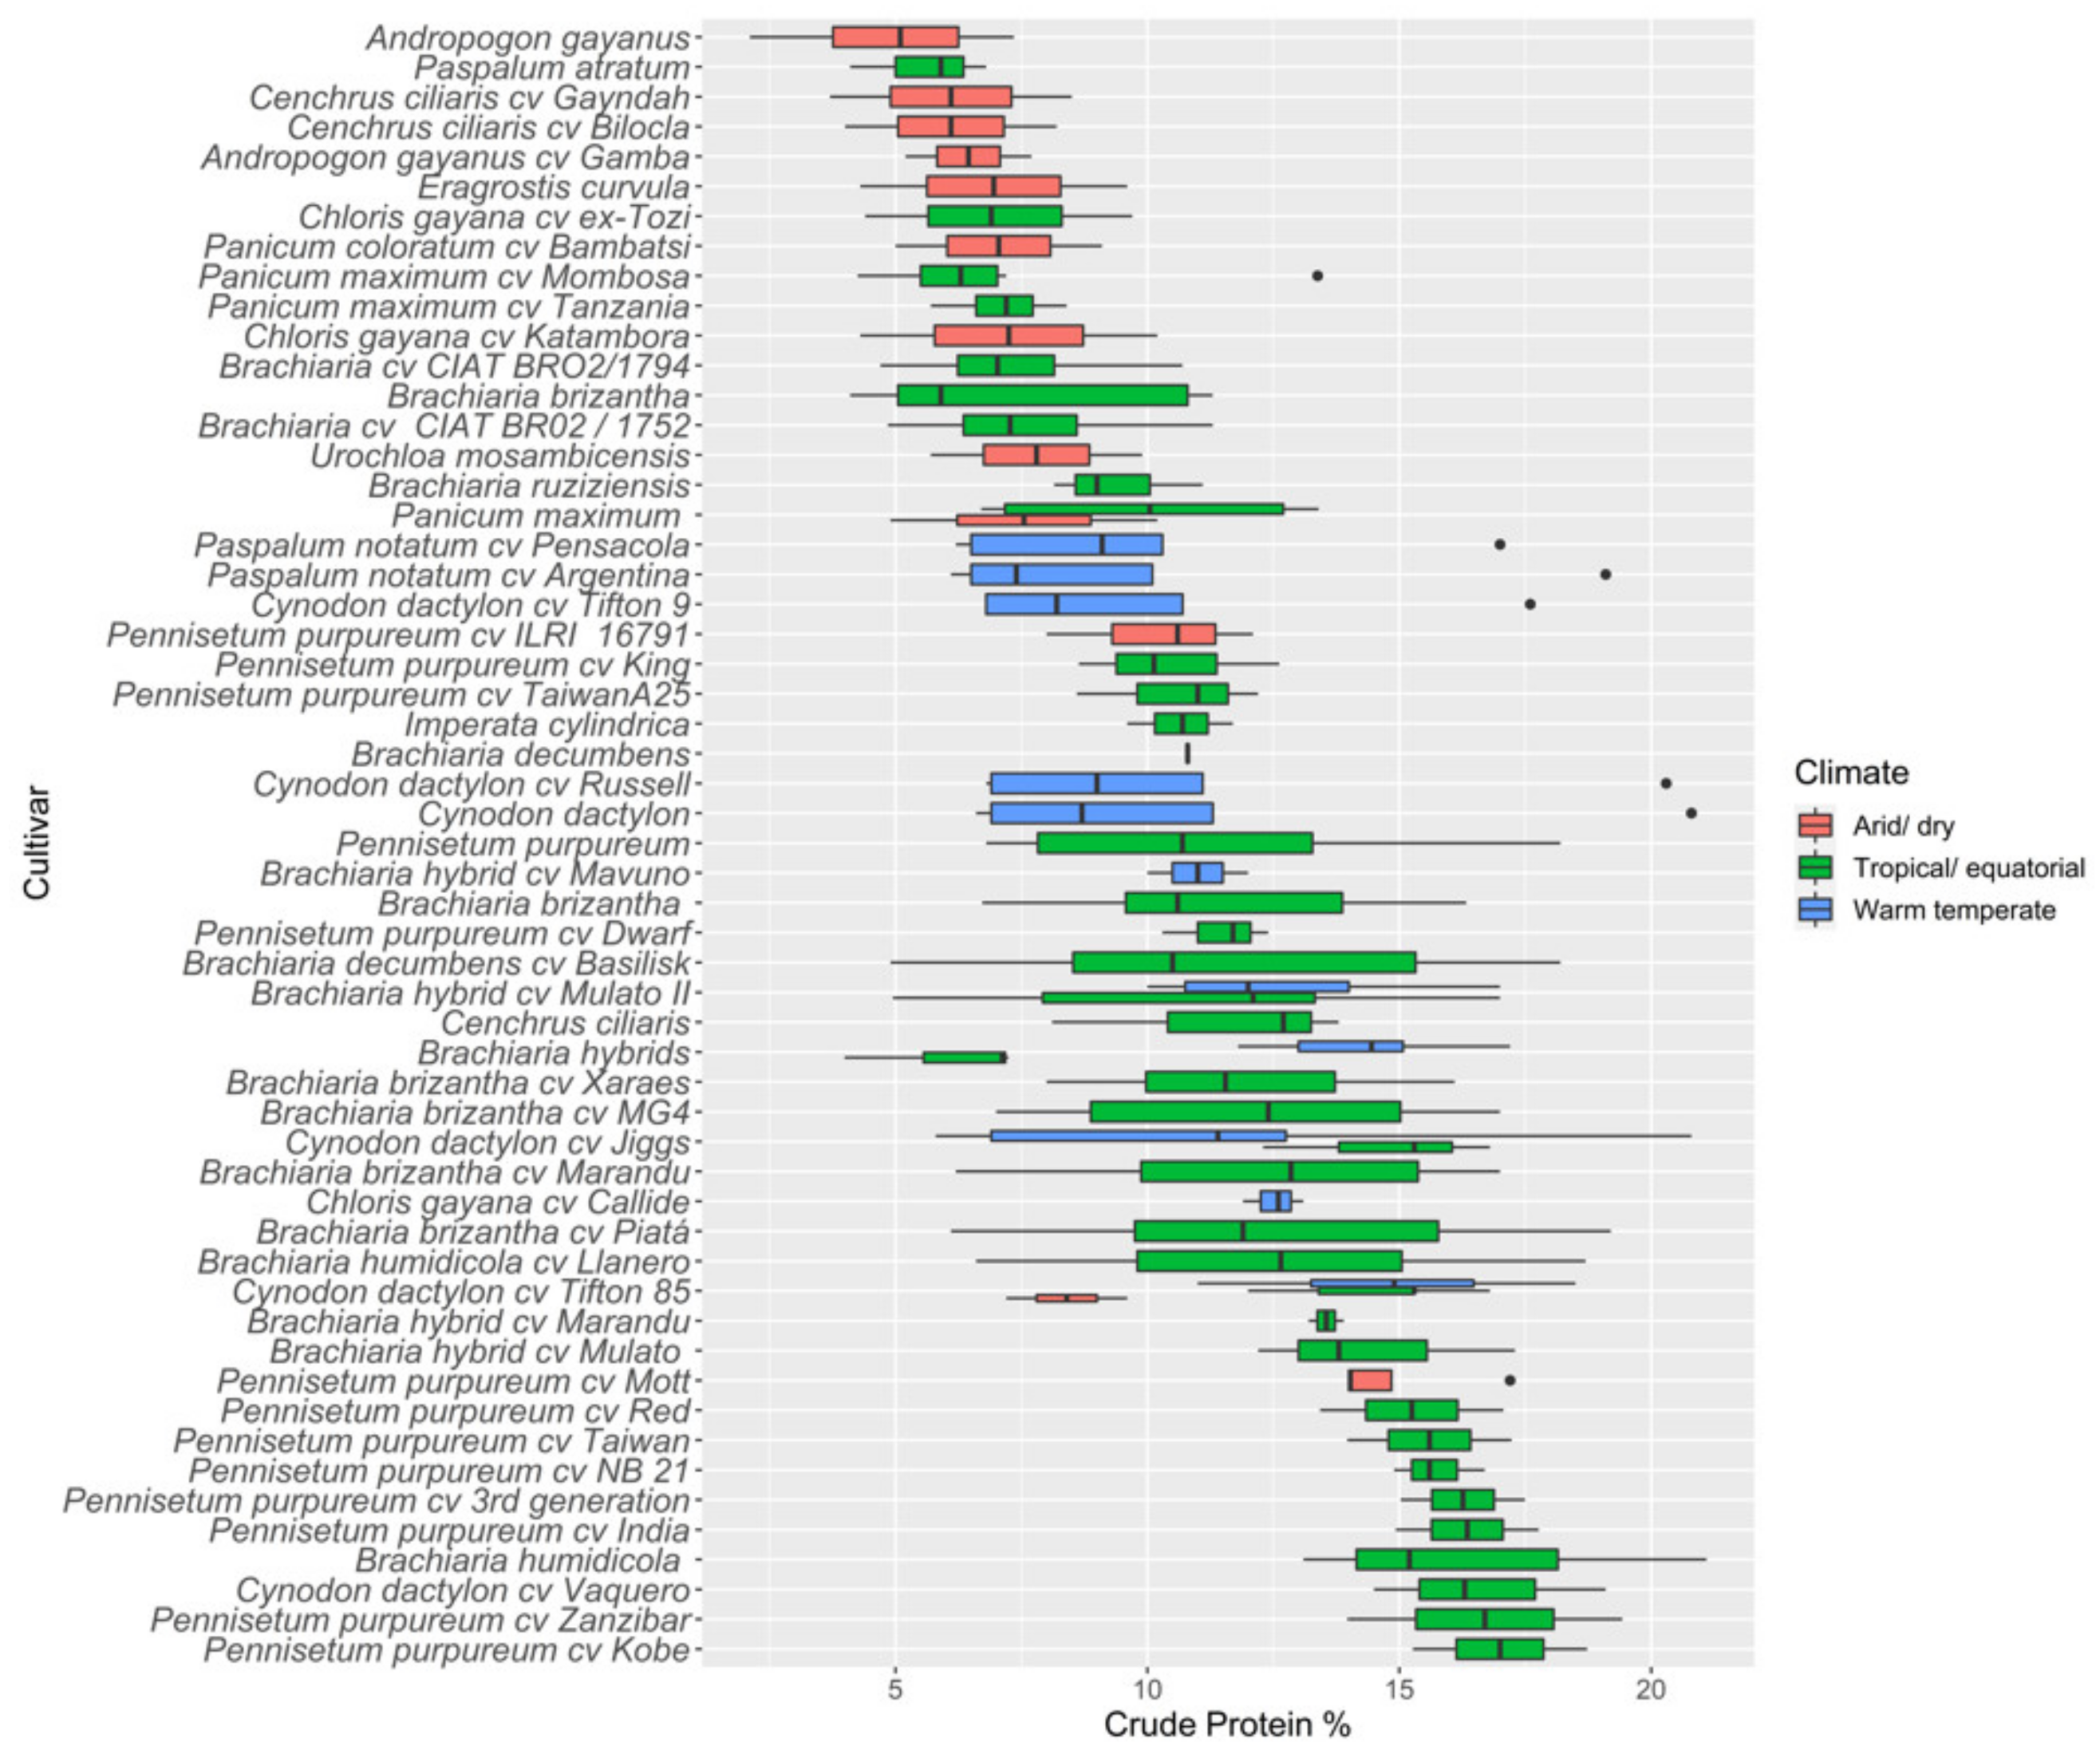
3.2.1. Crude Protein

The largest absolute CP values were recorded from the grasses Pennisetum purpureum cv Kobe at 17%, Pennisetum purpureum cv Zanzibar at 16.7%, and Brachiaria humidicola at 16.4%. Minimum average CP values were measured for Andropogon gayanus at 4.6%, Chloris gayana cv ex-Tozi at 7%, and Panicum maximum cv Mombosa at 7.1%, across all growing environments. Among all tropical pasture species, Pennisetum species reported greater mean CP percentages, followed by Brachiaria; in contrast, Paspalum and Panicum species had lower CP values. Between species, Brachiaria (7.36–16.4%) and Pennisetum (10.2–17%) recorded the largest ranges of CP values; within species, Brachiaria had higher variations.

3.2.2. Fibre

Fibre components of the tropical pasture species were recorded in terms of NDF and ADF percentages. There were substantial variations in NDF values between and within species (see Supplementary Table S1). The highest NDF values were recorded from Panicum with a maximum at 76.2%, Paspalum notatum at 74.9%, and Cynodon dactylon cv Tifton 85 at 74.7%. The minimum values for NDF were recorded for the Pennisetum and Brachiaria species, where Pennisetum purpureum cv ILRI 16791 and Brachiaria cv CIAT BR02/1752 had mean NDF values of 54.7% and 61.3%, respectively; both Brachiaria hybrid cv Mavuno and Brachiaria hybrid cv Mulato II consisted of 61.5% NDF. Mean ADF values across all tropical pasture species summarised that maximum values were measured for Chloris gayana cv ex-Tozi at 48.1%, Brachiaria brizantha at 47%, and Panicum maximum at 45.9%. Cynodon dactylon, Cynodon nlemfuensis, and Brachiaria cv CIAT BRO2/1794 accounted for the lowest ADF values at 31%, 32.8%, 33.1%, respectively. Within and between species, all ADF values were below 50%, and the majority ranged between 30 and 45%, whereas the majority of NDF values ranged between 60 and 70%. Within species, Brachiaria had a substantial variation of ADF and NDF at 33.1–47% and 61.5–71.7%, respectively.

3.2.3. Digestibility

The mean digestibility of the tropical grasses was reportedly 57.9%. Comparatively higher OMDs were recorded for Pennisetum purpureum, with the cultivar Pennisetum purpureum cv Red having the greatest absolute OMD at 69.3% across all reported tropical pasture species. Organic matter digestibility of Brachiaria brizantha followed that of Pennisetum purpureum. Brachiaria recorded an average of 58.1% OMD for all Brachiaria species and ranged between 61.9 and 54.6%. Across the genus Brachiaria, Brachiaria hybrid cv Mavuno and Brachiaria hybrid cv Mulato II had the greater digestibilities at 64.75% and 61.2%, respectively. The minimum average OMDs were measured for the Chloris gayana cv ex-Tozi, Cynodon nlemfuensis cv Florona, and Cynodon dactylon cv Jiggs varieties at 44.1%, 45%, and 49.2%, respectively. Interestingly, 73.3% of tropical pasture species from the database had OMDs that were greater than 55%, and all species were improved hybrid varieties of standard tropical pastures.

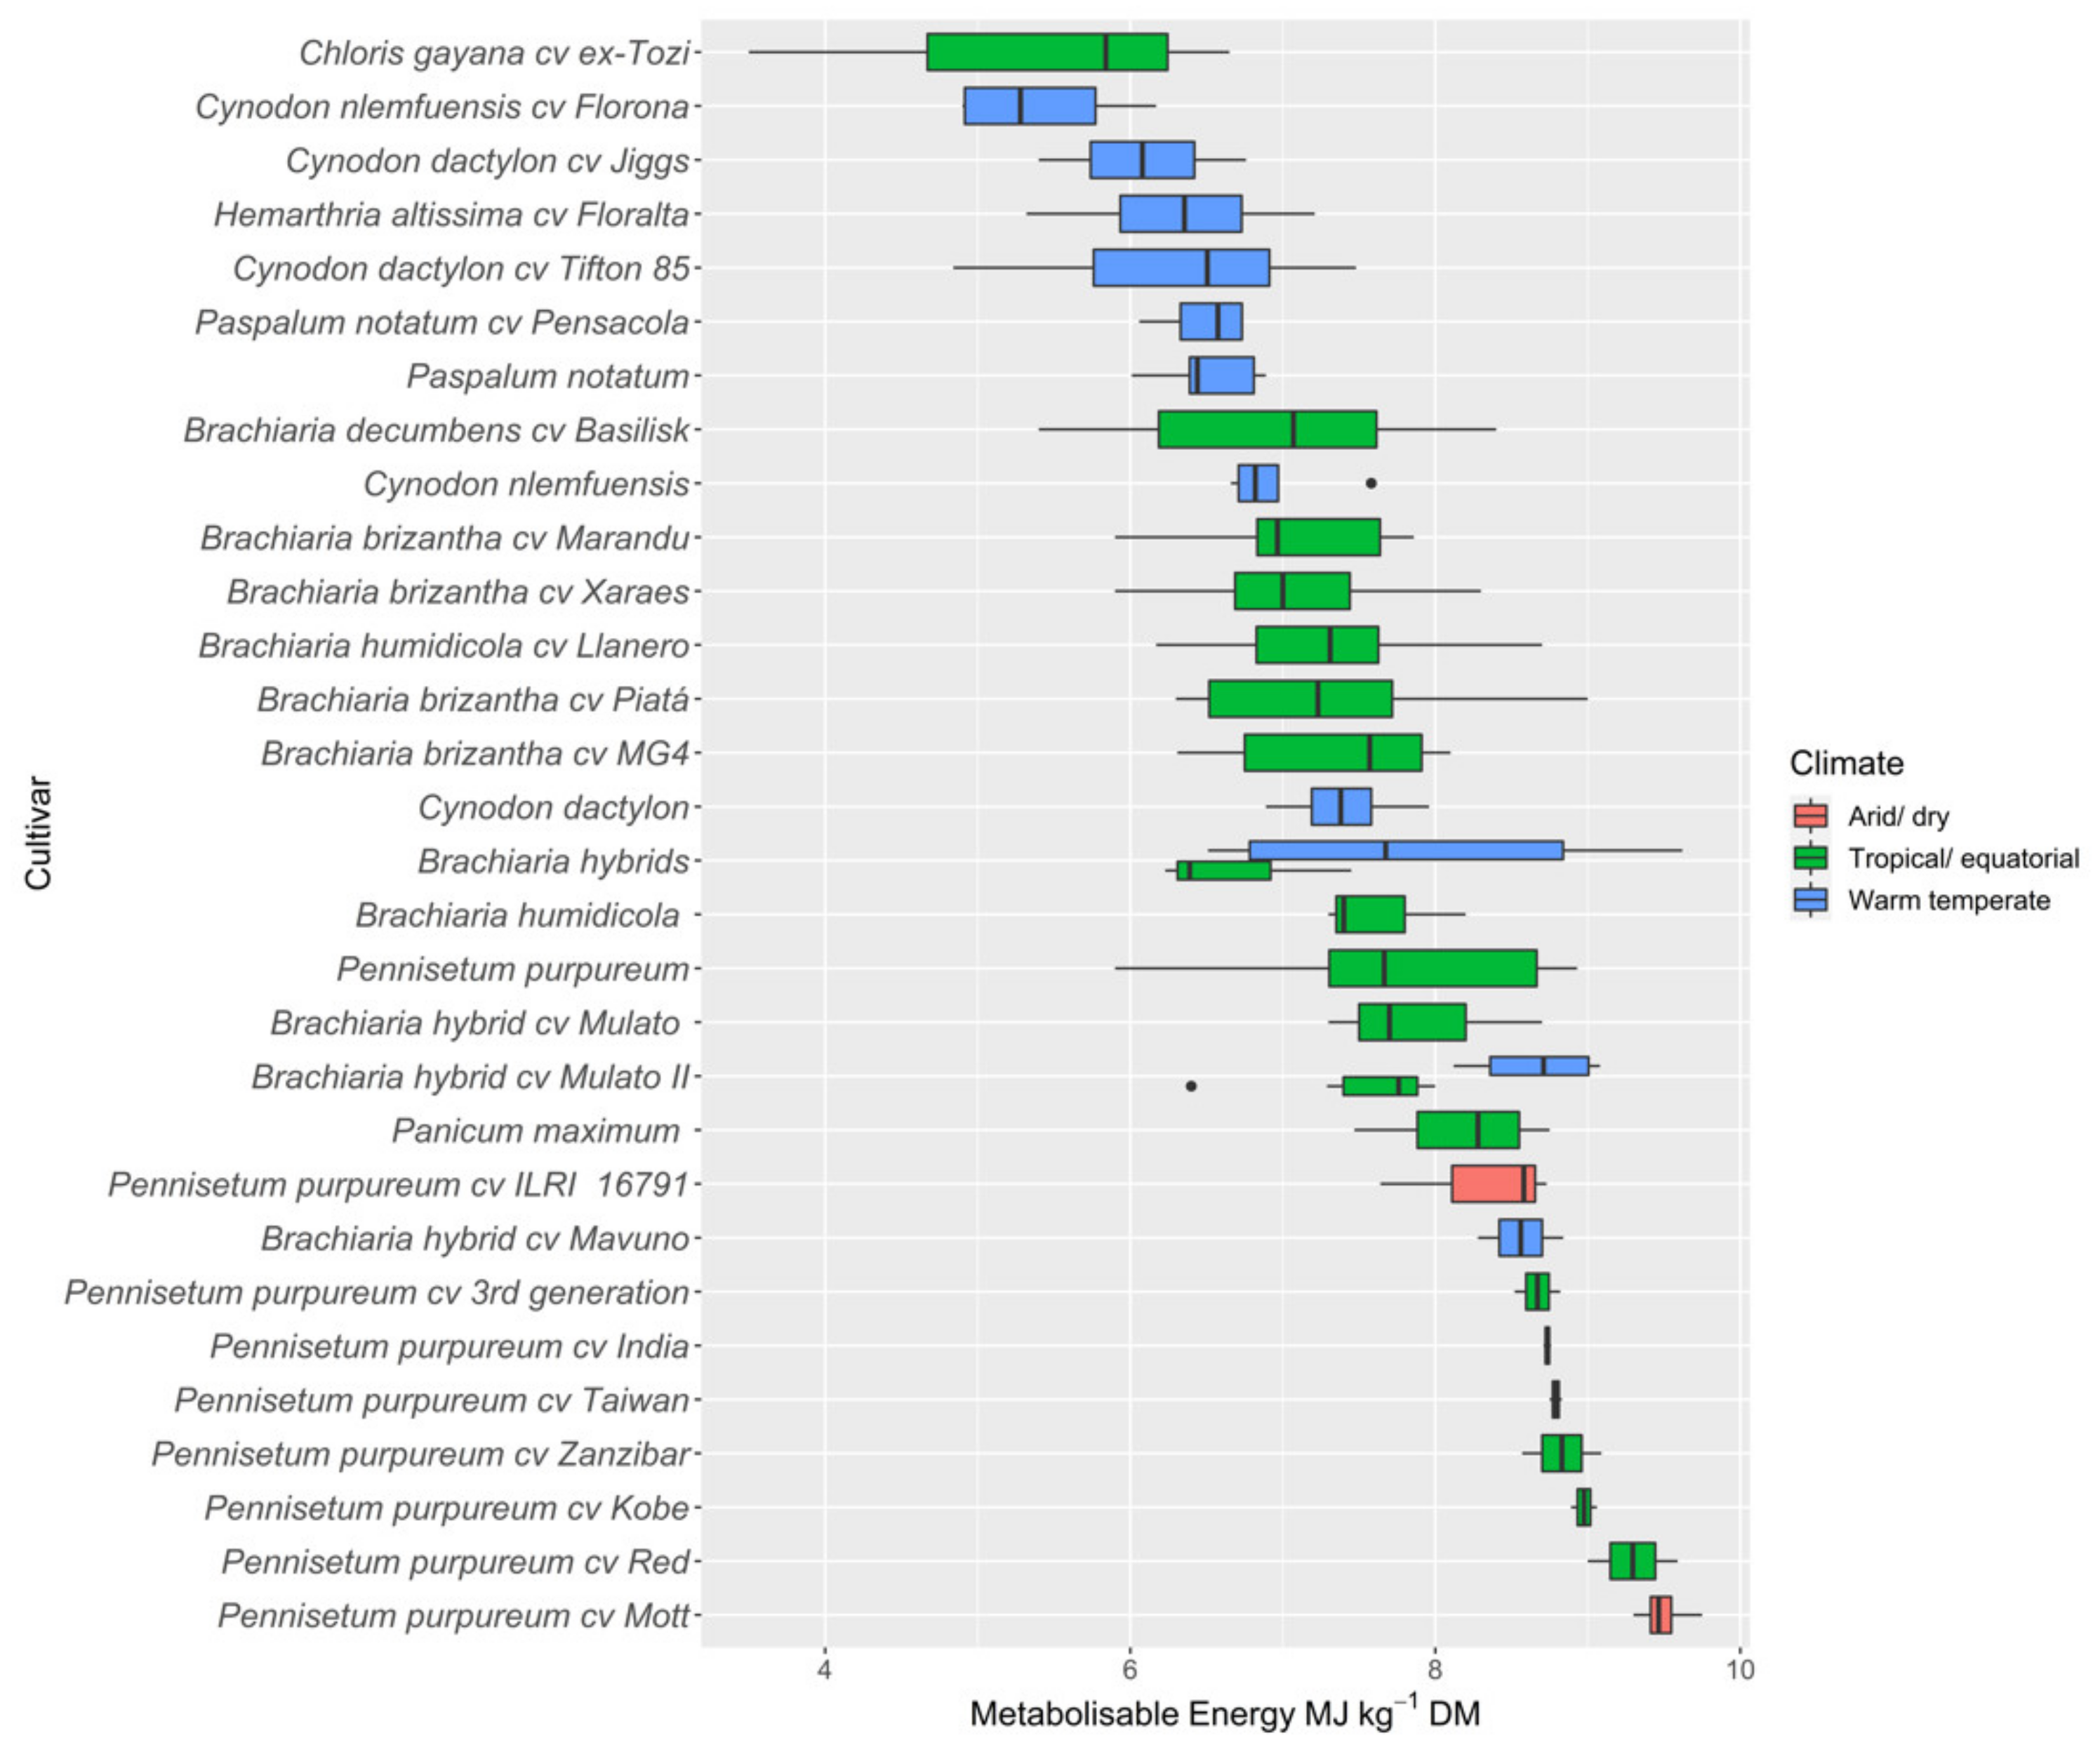
3.2.4. Metabolisable Energy
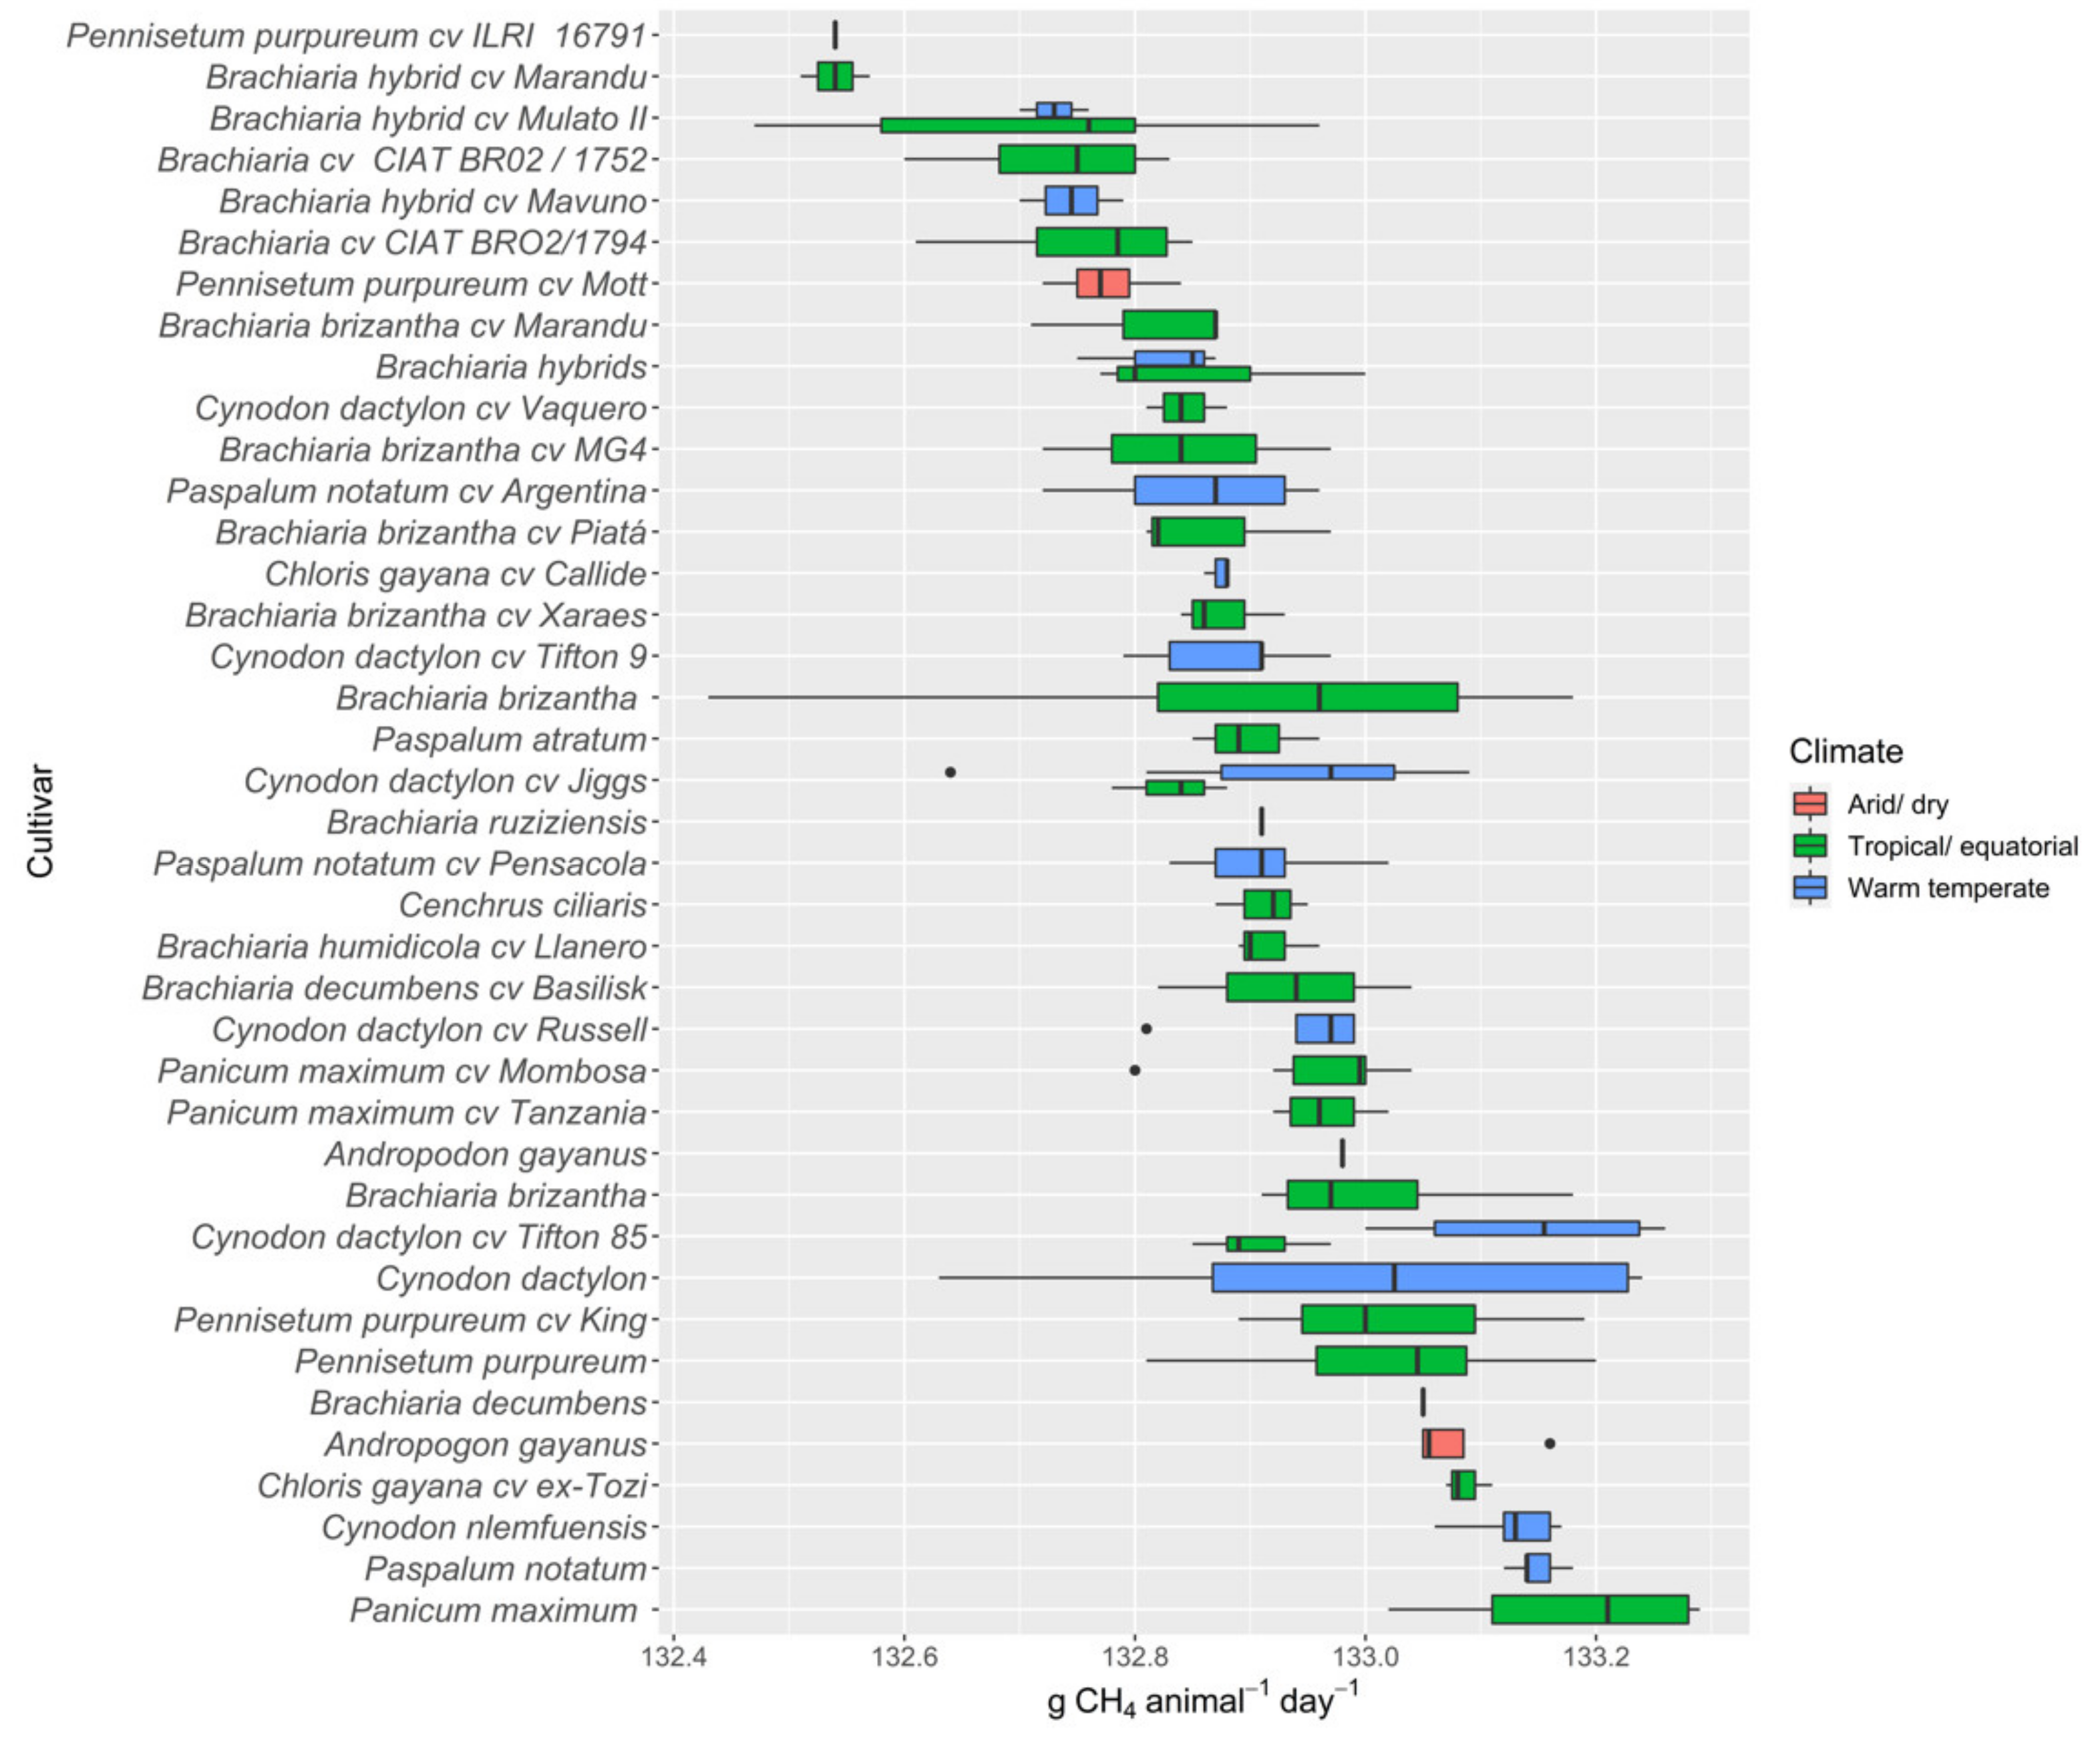
Metabolisable energy of tropical pasture species in the database ranged between 5.4–9.3 MJkg−1 DM at a mean ME of 7.4 MJ kg−1 DM. Between species, the maximum absolute ME values were measured for the Pennisetum purpureum cultivars, consisting of a mean ME of 8.6 that ranged between 7.7 and 9.3 MJ kg−1 DM, followed by Brachiaria brizantha at a mean ME of 7.5 MJ kg−1 DM. The metabolisable energy level for Brachiaria brizantha ranged between 6.9–8.1 MJ kg−1 DM for Brachiaria decumbens cv. Basilisk and Mulato II, respectively. Between and within species, Chloris gayana cv ex-Tozi and Cynodon nlemfuensis cv Florona had the lowest MEs at 5.3 MJ kg−1 DM and 5.4 MJ kg−1 DM, respectively.

3.2.5. Methane Gas

Estimated enteric CH4 emissions (g CH4 animal−1 day−1) of tropical pasture species are presented in Figure 4. Results did not show a substantial variation in CH4 emissions between and within species. Between different tropical pasture species, Panicum maximum at 133.19, Paspalum notatum at 133.15, and Cynodon dactylon cv Tifton 85 at 133.14 g CH4 animal−1 day−1 had the maximum estimated enteric CH4 emissions. The minimum values for the estimated CH4 were recorded for the Pennisetum and Brachiaria species, where Pennisetum purpureum cv ILRI 16791 and Brachiaria cv CIAT BR02 1752 recorded mean values of 132.5 and 132.7 g CH4 animal−1 day−1, respectively.

3.3. Bioclimatic Variations in Nutritive Metrics

The nutritive values for a range of tropical pasture species are presented in Table 2, across three different bioclimatic zones (arid/dry, tropical/equatorial, and warm temperate). Greater mean DM yields were reported for the arid/dry zone, followed by the tropical/equatorial zone at 17.5 t ha−1 and 10.3 t ha−1, respectively, while DM yield in the warm temperate zone averaged only 4.0 t ha−1. All nutritive metrics except NDF, digestibility, ADL, and CH4 showed significant differences between bioclimatic zones. Significantly higher CP values were found in tropical pasture species grown in the warm temperate zone, and values were lower in warmer regions (arid and tropical). The highest mean ADF was reported for the tropical/equatorial zone followed by the arid/dry zone, whereas NDF did not significantly vary (p > 0.05) between zones. Nutritive values across all tropical pasture species are summarised in Supplementary Table S1, and ascending median values of main nutritive value components (CP and ME) and CH4 production are presented in Figure 2 and Figure 4, respectively. There were substantial variations in nutritive values of pastures within one species as well as between species in different environments.
Digestibility parameters (OMD and DMD) did not vary significantly between warm temperate and tropical zones. Ash, ADL, and OM contents were high in forage samples collected across the tropical zone, and ME was higher in pasture species grown in the arid zone. Methane production did not vary between zones. Tropical pastures grown in warm temperate climates had higher nutritive values than those from tropical/equatorial and arid/dry bioclimatic zones, although nutritive values significantly varied between the three bioclimatic zones. Overall, results showed that tropical pasture species grown in warmer regions tend to have lower nutritive values despite their higher yields compared to those in temperate regions.

3.4. Management and Environmental Determinants

Tropical pasture species harvested at different fixed defoliation frequencies in contrasting environments were correlated against their nutritive metrics and estimated methane production (Table 3). Results revealed that the NDF, ADF, minerals, ME, OM, and estimated CH4 were positively correlated with the defoliation frequency of tropical pastures. There were significant relationships for all positively correlated nutritive metrics except for OM. Crude protein, ADL, DMD, and OMD were negatively correlated with defoliation frequency. Acid detergent lignin showed no significant relationship in the data set.
According to the fitted LME model, mean annual rainfall, mean annual temperature, or mean sea level were shown to be significant only for the DM yield in the data set. Defoliation frequency and its interaction with climate were significant for all nutritive metrics (CP, NDF, ADF, ME, DMD, OMD, CH4, ADL, Ash) of tropical pasture species (p < 0.0001). There was a significant effect of defoliation intensity for NDF, ME, OMD, DMD, CH4, and Ash (p < 0.0001), whereas intensity had an interaction with climate for ADF and CP. The fitted model shows a positive effect for NDF, ADF, CH4, and ADL, with increasing defoliation frequencies and values of the same nutritive metrics decreasing with increasing defoliation intensity of tropical pastures (Table 4). Crude protein decreased in longer defoliation frequencies, and CP values increased with increasing defoliation intensity. Metabolisable energy and ADL values decreased due to both higher defoliation frequencies and intensities. Digestibility parameters (OMD, DMD) were negatively affected by longer defoliations, and values increased with higher intensities (Table 4).

4. Discussion

4.1. Nutritive Value of Tropical Pastures

There was a significant variation in the nutritive values of tropical pastures between and within species. According to Lean et al. [33], a minimum CP of 10–12% DM is required in dairy cattle diets in order to maintain adequate rumen function and DMI. Lactating cows require more CP (16–19%) according to their body weight, pregnancy status, level of milk production, and milk composition [33,34]. Although the present data set showed an average CP of 10.9% DM across all tropical pasture species at any given harvest interval, the CP content of hybrid cultivars (i.e., Brachiaria, Pennisetum) ranged between 16.4% and 17% DM, suggesting that hybrids only would be adequate to meet the CP requirements of lactating cows, apart from peak lactation. While the average NDF in the present data set (67.5% DM) is similar to the average value (66.2% DM) reported for tropical pastures by Van Soest [35], it is well above the minimum required NDF (25–33% DM) for lactating cows [34], and may therefore affect DMI negatively. This is especially true of NDF under longer harvesting intervals. The ADF in this data set had a greater range (previously mentioned) as well as a higher average (38.8% DM) than that reported for tropical pastures by Katoch [36] (range 31.9–35.4% DM, average 33.6% DM); furthermore, all ADF values were again above the minimum required ADF (17–21% DM) recommended for lactating cows [34]. Metabolisable energy was reported for tropical grasses as 5 to 11 MJ kg−1 DM [37], and the average ME of this data set was recorded as 7.5 MJ kg−1 DM. The present data set reported that ME was below the NRC-recommended [34] energy content required for lactating cows (8.4–10.3 MJ kg−1 DM, average 9.3 MJ kg−1 DM). Overall, the findings of this meta-analysis provide preliminary evidence about the existing limitations of tropical pastures for a productive dairy system in terms of their inherently poor average nutritive value compared with some other feed types (e.g., concentrates and temperate grasses).
An increase in the average nutritive value of tropical pastures will have a greater impact on pasture-based dairy systems. According to Ayele et al. [38] and Hall et al. [39], one of the main approaches used to increase the nutritive value and deliver quality forages on a consistent basis is to develop improved forage options and evaluate for their yield, quality, and impact on animal productivity parameters. Lowe et al. [11] observed substantial quality differences between species and between cultivars within the same species. Van Soest [35] reported that even under identical conditions, not all forages have the same quality. Results from this data set agree with Lowe et al. [11] and Van Soest [35] in that the majority of nutritive values for tropical pastures vary largely among species and within cultivars. This variation is also attributed to cultivar breeding (genotypic variation) for improved quality [9] and different physiological responses (adaptations) of individual plants to environmental factors [35]. This appeared to be more evident in this data set, as protein and digestibility values were generally higher for hybrids and cultivars within the same species (e.g., Brachiaria, Pennisetum purpureum cultivars). Apart from using hybrids and cultivars, an appropriate defoliation management regime has greater impact on average nutritive values of tropical pasture species. In addition to improving nutritive value, efforts are needed to increase and satisfy the long-term feed requirement in tropical regions. Rao et al. [40] explained the “LivestockPlus” concept for sustainable intensification of forage-based systems in the tropics under three intensification processes (genetic, ecological, and socio-economic). These enable the use of better pasture management approaches along with improved pasture species to produce better yields and nutritive values that ultimately provide livelihood (better milk production) and ecosystem (reduced GHG) benefits. Therefore, this data set that compares the nutritive values of tropical pasture species grown across different environments provides a basis for selection of quality forage options (e.g., Brachiaria, Pennisetum purpureum cultivars) that perform better across a wider geographical background, and can consequently improve tropical pasture-based dairy production systems.

4.2. Bioclimatic Variation

The data collected for this study covered a wide range of geographical locations (with different mean annual temperatures, mean annual rainfall values, mean sea levels, soils), and results showed interaction between defoliation management approach (defoliation frequency and intensity) and climate, through nutritive metrics. Van Soest [35] reported that climate has an effect on forage nutritive values, accounting for regional variations in composition. According to Jego et al. [41], warmer regions have been associated with taller, slow-growing, and less nutritious forages. This data set showed that the biomasses of tropical pastures harvested from arid/dry and tropical/equatorial areas were generally lower in CP, and higher in ADF, ADL, and minerals. Conversely, tropical pastures harvested from warm temperate areas were higher in CP. Both Lee et al. [27] and Lee [42] studied a range of forages in different bioclimatic zones and revealed similar results for warm and cooler areas. However, average values for NDF, ME, and digestibility metrics are different. This is explained by our data set comprising fixed defoliation frequencies for tropical pastures. These defoliation frequencies generally varied from 14 to 140 days for some tropical pastures (Brachiaria brizantha, Paspalum notatum, Cynodon dactylon cv Tifton 85) sampled in warm temperate areas where the frequencies ranged between 14 to 90 days in arid/dry and tropical/equatorial areas. The high NDF, low ME, and digestibility may be driven by increased structural substances (greater stem:leaf ratios) due to less intense management as well as adaptations to heat stress and water loss. Herbage production in the data set was high in warm areas, and results are in agreement with Lowe et al. [11] that DM yield is more than double in tropical areas when both the fertility and moisture are non-limiting. This greater DM yield may also explain the lower CP in warm areas that is attributed to N dilution effects caused by greater herbage accumulation [14].
The interactions of nutritive values with climate in the present data set revealed that DM yield and sward characteristics are sensitive to variables such as the environment [15,43] and the morphogenesis of plant species [44]. This may also explain the lower correlations between nutritive values across multiple pasture species and defoliation frequencies in the present data set. Therefore, the generic defoliation management options for tropical pastures are unlikely to produce better agronomic results, as they do not consider the species-specific growth nor the physiological stages induced by climate. Ruolo et al. [45] highlighted that plant-related indicators that are associated with regrowth are more sensible to use in determining pasture defoliation. This may require good information on the morphological characteristics of cultivated species. In particular, for improved tropical pastures which have not been explored to a similar degree as temperate species in order to determine the suitability for specific conditions of pasture production and management.

4.3. Management Determinants

The present study assessed all edible plant parts rather than focusing on their botanical compositions (leaf, stem, and dead materials). The greater range of values may be explained by the combination of different proportions of plant materials. Herbage maturity influences the forage nutritive value due to phenological and physiological changes of the plant [14]. Even though the nutritive value changes due to these phenological and physiological changes were not disentangled in our meta-analysis, the relationships reported in Table 3 explain the typical changes in nutritive value of tropical pasture species during maturity. It is widely known that CP and DMD decrease as harvesting intervals increase [46,47,48,49,50,51], and that NDF, ADF, and ADL increase with increasing harvesting intervals [14,47,48,49]. This data set is also consistent with the previous literature. In addition, the fitted LME model for the nutritive metrics explained the same relationships based on the frequency of defoliation. Defoliation intensity greatly affects the pasture nutritive value. It further explains the significant relationship between the intensity of defoliation for ME, OMD, DMD, and CH4, and ash. Metabolisable energy, OMD, and DMD all increased as a result of increasing defoliation intensity, while CH4 and ash decreased. Defoliation intensities for all tropical pastures ranged between 50 and 200 mm (100 mm average) in the data set, and this may change the vertical sward canopy structure [52] and nutritive composition [15,43] that is largely determined by the leaves and stem accumulation in each stratum [53,54,55,56,57].

4.4. Implications for Livestock Methane Production

Direct measurement of enteric CH4 has begun relatively recently due to high equipment costs and the sophisticated methodologies that are required to measure CH4 emissions from live animals [26]. Therefore, mathematical models are commonly used to estimate CH4 emissions from cattle. Current livestock models that are available to estimate CH4 production require many inputs that are not readily available across all experiments, and these models do not account for variations between animal breeds, regions, and climate-driven pasture nutritive values [27]. Therefore, the present meta-analysis only attempted to estimate the CH4 production of tropical pasture species grown in different climates as a function of NDF, based on an average DMI that is consumed by tropical dairy cattle. However, actual values may differ due to variations in DMI and diet selection, especially in grazing scenarios. The chemical composition of the forage determines the enteric CH4 production [58]. Forages rich in structural carbohydrates tend to result in greater CH4 amounts than diets higher in non-structural carbohydrates [59,60,61]. This is explained by the nutritive value results of this study that show the minimum estimated enteric CH4 emissions values for the Pennisetum and Brachiaria species. According to Hegarty [62] as well as Liu et al. [63], the amount of feed intake, moderated by feed digestibility and animal characteristics, affects enteric fermentation and CH4 production. The CH4 production for Brachiaria pasturelands was studied by Ruggieri et al. [58], who revealed that CH4 emissions varied from 106 to 177 g CH4 animal−1 day−1, at an average of 141.5 g CH4 animal−1 day−1. Our data set also produced similar results for a constant dry matter intake of 7.7 kg d−1 [28]. The Intergovernmental Panel on Climate Change (IPCC) default CH4 emissions factor for tropical pastures is considered to be 149 g CH4 animal−1 day−1 [64]; the data set presented here showed lower average values across all tropical pasture species. According to the fitted model, the effect of both intensity and frequency of defoliation, and their interaction with climate, have been shown to be significant for CH4 production. This relationship verified the finding of Chaves et al. [65] who found that the diet quality affected CH4 production. Moreover, Boadi et al. [66] demonstrated that steers that grazed on young developing growth pasture produced up to 45% less CH4 than if they grazed on mid- and late-season pastures. Beauchemin et al. [67] also highlighted that harvesting forage at an earlier maturity stage is a strategy that can be used to decrease enteric CH4 production. Meister et al. [68] also found that CH4 production for Panicum maximum cv Tanzania increases linearly with the number of grazing days, possibly reflecting a reduction in quality. De Souza Filho et al. [69] revealed that the intensity of defoliation affected CH4 production in the tropics, and a target height of 230–300 mm has the potential of reducing CH4 emissions by 13–14%. Overall, these results provide important insights for the potential of utilising lower CH4-producing pasture species and the potential for low emissions dairy farming through nutritive value improvements in tropical pastures through better management.

5. Conclusions

This meta-analysis showed that nutritive value, digestibility, and ME of tropical pastures greatly vary between and within species. Tropical pasture species Pennisetum purpureum followed by Brachiaria species showed high CP, OMD, and ME, and low NDF. Furthermore, the analysis demonstrated the variations in nutritive values of tropical pasture species across bioclimatic environments, and that nutritive values are lower in warmer and drier regions. The newer and hybrid cultivars performed better than the standard cultivars across wider bioclimatic areas, with the least quality variations suggesting their ability to deliver improved livestock forage options for tropical areas. The frequency of defoliation, defoliation intensity, climate, and their interactions had a significant effect on multiple agronomic nutritive metrics and on CH4 production of tropical pastures. Climate was found to be a key variable that determines tropical pasture nutritive values. This information explains the importance of setting climate-sensible defoliation strategies in order to improve tropical pasture nutritive value for sustainable dairy farming in the tropics. These results could also form the basis for further studies that research pasture agronomy from a livestock study prospective, as pastures are grown to rear livestock that ultimately produce food products for humans.

Supplementary Materials

The following supporting information can be downloaded at: https://www.mdpi.com/article/10.3390/ani12141806/s1, Table S1: Nutritive value of different tropical pasture species and cultivars; Table S2: References of the studies included in the meta-analysis.

Author Contributions

Conceptualization, methodology, data curation, analytical software, data analysis, and original draft preparation, P.J.; conceptualisation, methodology, supervision, review, and editing, T.R.; conceptualisation, methodology, supervision, review, and editing, D.J.D.; conceptualisation, methodology, supervision, review, and editing, K.G.P.; conceptualisation, methodology, supervision, review, and editing, D.G.B. All authors have read and agreed to the published version of the manuscript.

Funding

This research received no external funding.

Institutional Review Board Statement

Not applicable.

Informed Consent Statement

Not applicable.

Data Availability Statement

The data presented in this study are available in the Supplementary Materials. The digital data set of the present study is available from the corresponding author upon a reasonable request.

Acknowledgments

This research was supported by the Accelerating Higher Education Expansion and Development (AHEAD) Project launched by the Sri Lankan Government under the funds of the World Bank, providing a PhD scholarship to the first author.

Conflicts of Interest

The authors declare no conflict of interest.

References

  1. Opio, C.; Gerber, P.; Mottet, A.; Falcucci, A.; Tempio, G.; MacLeod, M.; Vellinga, T.; Henderson, B.; Steinfeld, H. Greenhouse Gas Emissions from Ruminant Supply Chains—A Global Life Cycle Assessment; Food and Agriculture Organization of the United Nations: Rome, Italy, 2013. [Google Scholar]
  2. FAO Stat. FAOSTAT Statistical Database 2018. Available online: https://www.fao.org/faostat/en/#data/QCL (accessed on 20 May 2021).
  3. FAO (Ed.) Mitigation of Greenhouse Gas Emissions in Livestock Production: A Review of Technical Options for Non CO2 Emissions; Food and Agriculture Organization of the United Nations: Rome, Italy, 2013; p. 226. [Google Scholar]
  4. Thornton, P.K.; Herrero, M. Potential for reduced methane and carbon dioxide emissions from livestock and pasture management in the tropics. Proc. Natl. Acad. Sci. USA 2010, 107, 19667–19672. [Google Scholar] [CrossRef] [Green Version]
  5. EPA. DRAFT: Global Anthropogenic Non-CO2 Greenhouse Gas Emissions 1990–2030; Publication 430-D-11-003; EPA: Washington, DC, USA, 2011. [Google Scholar]
  6. Smith, P.; Bustamante, M.; Ahammad, H. Climate Change 2014: Mitigation of Climate Change. Contribution of Working Group III to the Fifth Assessment Report of the Intergovernmental Panel on Climate Change; Cambridge University Press: Cambridge, UK; New York, NY, USA, 2014; pp. 811–922. [Google Scholar]
  7. Thornton, P.K.; Jones, P.G.; Ericksen, P.J.; Challinor, A.J. Agriculture and food systems in sub-Saharan Africa in a in a +4 °C world. Philos. Trans. R. Soc. A 2011, 369, 117–136. [Google Scholar] [CrossRef] [Green Version]
  8. Boval, M.; Edouard, N.; Sauvant, D. A meta-analysis of nutrient intake, feed efficiency and performance in cattle grazing on tropical grasslands. Anim. Consort. 2015, 9, 973–983. [Google Scholar] [CrossRef] [Green Version]
  9. Capstaff, N.M.; Miller, A.J. Improving the yield and nutritional quality of forage crops. Front. Plant Sci. 2018, 9, 535. [Google Scholar] [CrossRef] [Green Version]
  10. Paul, B.K.; Koge, J.; Maass, B.L.; Notenbaert, A.; Peters, M.; Groot, J.C.J.; Tittonell, P. Tropical forage technologies can deliver multiple benefits in Sub-Saharan Africa. A meta-analysis. Agron. Sustain. Dev. 2020, 40, 22. [Google Scholar] [CrossRef]
  11. Boga, M.; Ayasan, T. Determination of Nutritional Value of Alfalfa Varieties and Lines by Using the In Vitro Method and Gas Production Technique. J. Hell. Vet. Med. Soc. 2022, 73, 3613–3620. [Google Scholar] [CrossRef]
  12. Congio, G.F.S.; Batalha, C.D.A.; Chiavegato, M.B.; Berndt, A.; Oliveira, P.P.A.; Frighetto, R.T.S.; Maxwell, T.M.R.; Gregorini, P.; Da Silva, S.C. Strategic grazing management towards sustainable intensification at tropical pasture-based dairy systems. Sci. Total Environ. 2018, 636, 872–880. [Google Scholar] [CrossRef]
  13. Siqueira da Silva, H.M.; Vendramini, J.M.B.; Leite de Oliveira, F.C.; Soares Filho, C.V.; Kaneko, M.; Silveira, M.L.; Dalmazo Sanchez, J.M.; Yarborough, J.K. Harvest frequency effects on herbage characteristics of ‘Mavuno’ brachiariagrass. Crop Sci. 2020, 60, 1113–1122. [Google Scholar] [CrossRef]
  14. Inyang, U.; Vendramini, J.M.B.; Sellers, B.; Silveira, M.L.A.; Lunpha, A.; Sollenberger, L.E.; Adesogan, A.; Paiva, L.M. Harvest frequency and stubble height affect herbage accumulation, nutritive value, and persistence of ‘Mulato II’ Brachiariagrass. Forage Grazinglands 2010, 8, 1–7. [Google Scholar] [CrossRef]
  15. Moyo, M.; Nsahlai, I. Consequences of increases in ambient temperature and effect of climate type on digestibility of forages by ruminants: A meta-analysis in relation to global warming. Animals 2021, 11, 172. [Google Scholar] [CrossRef]
  16. Pontes, L.d.S.; Baldissera, T.C.; Giostri, A.F.; Stafin, G.; dos Santos, B.R.C.; Carvalho, P.C.d.F. Effects of nitrogen fertilization and cutting intensity on the agronomic performance of warm-season grasses. Grass Forage Sci. 2017, 72, 663–675. [Google Scholar] [CrossRef]
  17. Woodard, K.R.; Sollenberger, L.E. Broiler litter vs. ammoniumnitrate as N source for bermudagrass hay production: Yield, nutritive value, and nitrate leaching. Crop Sci. 2011, 51, 1342–1352. [Google Scholar] [CrossRef]
  18. Gastal, F.; Lemaire, G. Defoliation, shoot plasticity, sward structure and herbage utilization in pasture: Review of the underlying ecophysiological processes. Agriculture 2015, 5, 1146–1171. [Google Scholar] [CrossRef] [Green Version]
  19. Kering, M.K.; Guretzky, J.; Funderburg, E.; Mosali, J. Effect of nitrogen fertilizer rate and harvest season on forage yield, quality, and macronutrient concentrations in midland Bermuda Grass. Commun. Soil Sci. Plant Anal. 2011, 42, 1958–1971. [Google Scholar] [CrossRef]
  20. Gardarin, A.; Garnier, É.; Carrère, P.; Cruz, P.; Andueza, D.; Bonis, A.; Colace, M.P.; Dumont, B.; Duru, M.; Farruggia, A. Plant trait-digestibility relationships across management and climate gradients in permanent grasslands. J. Appl. Ecol. 2014, 51, 1207–1217. [Google Scholar] [CrossRef]
  21. Hoskin, S.O.; Gee, E.K. Feeding value of pastures for horses. N. Z. Vet. J. 2004, 52, 332–341. [Google Scholar] [CrossRef]
  22. Herrero, M.; Wirsenius, S.; Henderson, B.; Rigolot, C.; Thornton, P.; Havlík, P.; Boer, I.d.; Gerber, P.J. Livestock and the Environment: What have we learned in the past decade? Annu. Rev. Environ. Resour. 2015, 40, 177–202. [Google Scholar] [CrossRef]
  23. Knapp, J.R.; Laur, G.L.; Vadas, P.A.; Weiss, W.P.; Tricarico, J.M. Invited review: Enteric methane in dairy cattle production: Quantifying the opportunities and impact of reducing emissions. J. Dairy Sci. 2014, 97, 3231–3261. [Google Scholar] [CrossRef] [Green Version]
  24. Kottek, M.; Grieser, J.; Beck, C.; Rudolf, B.; Rubel, F. World Map of the Köppen-Geiger climate classification updated. Meteorol. Z. 2006, 15, 259–263. [Google Scholar] [CrossRef]
  25. Moran, J. Tropical Dairy Farming: Feeding Management for Small Holder Dairy Farmers in the Humid Tropics; CSIRO Publishing: Collingwood, VIC, Australia, 2005. [Google Scholar]
  26. Benaouda, M.; González-Ronquillo, M.; Appuhamy, J.A.D.R.N.; Kebreab, E.; Molina, L.T.; Herrera-Camacho, J.; Ku-Vera, J.C.; Ángeles-Hernández, J.C.; Castelán-Ortega, O.A. Development of mathematical models to predict enteric methane emission by cattle in Latin America. Livest. Sci. 2020, 241, 104177. [Google Scholar] [CrossRef]
  27. Lee, M.A.; Davis, A.P.; Chagunda, M.G.G.; Manning, P. Forage quality declines with rising temperatures, with implications for livestock production and methane emissions. Biogeosciences 2017, 14, 1403–1417. [Google Scholar] [CrossRef] [Green Version]
  28. Patra, A.K. Prediction of enteric methane emission from cattle using linear and non-linear statistical models in tropical production systems. Mitig. Adapt. Strateg. Glob. Chang. 2017, 22, 629–650. [Google Scholar] [CrossRef]
  29. Bates, D.; Mächler, M.; Bolker, B.; Walker, S. Fitting linear mixed-effects models using lme4. arXiv, 2015; arXiv:1406.5823. [Google Scholar] [CrossRef]
  30. RCoreTeam. R: A Language and Environment for Statistical Computing; R Foundation for Statistical Computing: Vienna, Austria, 2021. [Google Scholar]
  31. Gilbert, M.; Nicolas, G.; Cinardi, G.; Van Boeckel, T.P.; Vanwambeke, S.; Wint, W.G.R.; Robinson, T.P. Global cattle distribution in 2010 (5 min of arc). Harv. Dataverse 2018. [Google Scholar] [CrossRef]
  32. ESRI. ArcGIS Pro 2.8.6; Environmental Systems Research Institute: Redlands, CA, USA, 2021. [Google Scholar]
  33. Lean, I.J.; Golder, H.M.; Hall, M.B. Feeding, evaluating, and controlling rumen function. Vet. Clin. North Am. Food Anim. Pract. 2014, 30, 539–575. [Google Scholar] [CrossRef]
  34. NRC. Nutrient Requirements of Dairy Cattle: Seventh Revised Edition; The National Academies Press: Washington, DC, USA, 2001; p. 405. [Google Scholar]
  35. Van Soest, P.J. Nutritional Ecology of the Ruminant; Cornell University Press: Ithaca, NY, USA, 1994. [Google Scholar]
  36. Katoch, R. Factors influencing forage nutritional quality. In Nutritional Quality Management of Forages in the Himalayan Region; Springer: Singapore, 2022; pp. 99–149. [Google Scholar]
  37. Givens, D.I. Forage Evaluation in Ruminant Nutrition; CABI Books: London, UK, 2000. [Google Scholar]
  38. Ayele, S.; Duncan, A.; Larbi, A.; Khanh, T.T. Enhancing innovation in livestock value chains through networks: Lessons from fodder innovation case studies in developing countries. Sci. Public Policy 2012, 39, 333–346. [Google Scholar] [CrossRef] [Green Version]
  39. Hall, A.; Sulaiman, R.; Bezkorowajnyj, P. Reframing Technical Change: Livestock Fodder Scarcity Revisited as Innovation Capacity Scarcity—A Conceptual Framework; ILRI and UNU/MERIT: Nairobi, Kenya, 2007. [Google Scholar]
  40. Rao, I.M.; Peters, M.; Castro, A.; Schultze-Kraft, R.; White, D.; Fisher, M.; Miles, J.W.; Lascano, C.E.; Blümmel, M.; Bungenstab, D. LivestockPlus: The Sustainable Intensification of Forage-Based Agricultural Systems to Improve Livelihoods and Ecosystem Services in the Tropics; CIAT Publication: Cali, Colombia, 2015. [Google Scholar]
  41. Jégo, G.; Bélanger, G.; Tremblay, G.F.; Jing, Q.; Baron, V.S. Calibration and performance evaluation of the STICS crop model for simulating timothy growth and nutritive value. Field Crops Res. 2013, 151, 65–77. [Google Scholar] [CrossRef]
  42. Lee, M.A. A global comparison of the nutritive values of forage plants grown in contrasting environments. J. Plant Res. 2018, 131, 641–654. [Google Scholar] [CrossRef]
  43. Chapman, D.F. Using ecophysiology to improve farm efficiency: Application in temperate dairy grazing systems. Agriculture 2016, 6, 17. [Google Scholar] [CrossRef] [Green Version]
  44. Lemaire, G.; Da Silva, S.C.; Agnusdei, M.; Wade, M.; Hodgson, J. Interactions between leaf lifespan and defoliation frequency in temperate and tropical pastures: A review. Grass Forage Sci. 2009, 64, 341–353. [Google Scholar] [CrossRef]
  45. Ruolo, M.S.; Pérez, H.E.; Rodriguez, A.M. Chloris gayana Kunth under different defoliation regimes. Morphogenesis, sward structure and leaf area index. Grass Forage Sci. 2019, 74, 720–727. [Google Scholar] [CrossRef]
  46. Hughes, M.P.; Mlambo, V.; Lallo, C.H.O. Optimum nitrogen fertilization rate and nitrogen use efficiency for Brachiaria hybrid and Megathyrsus maximus varies with stage of regrowth. JSFA Rep. 2022, 2, 168–177. [Google Scholar] [CrossRef]
  47. Tessema, Z.; Baars, R.; Alemu, Y.; Dawit, N. In Sacco dry matter and nitrogen degradation and their relationship with in vitro dry matter digestibility of Napier grass (Pennisetum purpureum Schumach) as influenced by plant height at cutting. Aust. J. Agric. Res. 2002, 53, 7–12. [Google Scholar]
  48. Vendramini, J.M.B.; Sollenberger, L.E.; Soares, A.B.; Da Silva, W.L.; Sanchez, J.M.; Valente, A.L.; Aguiar, A.D.; Mullenix, M.K. Harvest frequency affects herbage accumulation and nutritive value of Brachiaria grass hybrids in Florida. Trop. Grassl.-Forrajes Trop. 2014, 2, 197–206. [Google Scholar] [CrossRef] [Green Version]
  49. Tessema, Z.K.; Mihret, J.; Solomon, M. Effect of defoliation frequency and cutting height on growth, dry-matter yield and nutritive value of Napier grass (Pennisetum purpureum (L.) Schumach). Grass Forage Sci. 2010, 65, 421–430. [Google Scholar] [CrossRef]
  50. Arthington, J.D.; Brown, W.F. Estimation of feeding value of four tropical forage species at two stages of maturity. J. Anim. Sci. 2005, 83, 1726–1731. [Google Scholar] [CrossRef]
  51. Pembleton, K.G.; Lowe, K.F.; Bahnisch, M. Utilising leaf number as an indicator for defoliation to restrict stem growth in rhodes grass (Chloris gayana) cv. Callide. Trop. Grassl.-Forrajes Trop. 2009, 43, 79–85. [Google Scholar]
  52. Barbosa, R.A.; Nascimento Júnior, D.d.; Euclides, V.P.B.; Silva, S.C.d.; Zimmer, A.H.; Torres Júnior, R.A.d.A. Tanzânia grass subjected to combinations of intensity and frequency of grazing. Pesqui Agropecu Bras. 2007, 42, 329–340. [Google Scholar] [CrossRef] [Green Version]
  53. Benvenutti, M.A.; Pavetti, D.R.; Poppi, D.P.; Mayer, D.G.; Gordon, I.J. Ingestive behaviour and forage intake responses of young and mature steers to the vertical differentiation of sugarcane in pen and grazing studies. J Agric. Sci. 2017, 155, 1677–1688. [Google Scholar] [CrossRef] [Green Version]
  54. Benvenutti, M.A.; Pavetti, D.R.; Poppi, D.P.; Gordon, I.J.; Cangiano, C.A. Defoliation patterns and their implications for the management of vegetative tropical pastures to control intake and diet quality by cattle. Grass Forage Sci. 2016, 71, 424–436. [Google Scholar] [CrossRef]
  55. Ison, K.; Barber, D.G.; Benvenutti, M.A.; Mayer, D.G.; Findsen, C. Abstracts from the 32nd Biennial Conference of the Australian Society of Animal Production (ASAP). Anim. Prod. Sci. 2018, 58, i–cxxxi. [Google Scholar] [CrossRef]
  56. Ungar, R. Bite horizons and dimensions for cattle grazing herbage to high levels of depletion. Grass Forage Sci. 1999, 54, 357–364. [Google Scholar] [CrossRef]
  57. Benvenutti, M.A.; Findsen, C.; Savian, J.V.; Mayer, D.G.; Barber, D.G. The effect of stage of regrowth on the physical composition and nutritive value of the various vertical strata of kikuyu (Cenchrus clandestinus) pastures. Trop. Grassl.-Forrajes Trop. 2020, 8, 141–146. [Google Scholar] [CrossRef]
  58. Ruggieri, A.C.; Cardoso, A.d.S.; Ongaratto, F.; Casagrande, D.R.; Barbero, R.P.; Brito, L.d.F.; Azenha, M.V.; Oliveira, A.A.; Koscheck, J.F.W.; Reis, R.A. Grazing intensity impacts on herbage mass, sward structure, greenhouse gas emissions, and animal performance: Analysis of Brachiaria pastureland. Agronomy 2020, 10, 1750. [Google Scholar] [CrossRef]
  59. Berça, A.S.; Cardoso, A.D.S.; Longhini, V.Z.; Tedeschi, L.O.; Boddey, R.M.; Berndt, A.; Reis, R.A.; Ruggieri, A.C. Methane production and nitrogen balance of dairy heifers grazing palisade grass cv. Marandu alone or with forage peanut. J. Anim. Sci. 2019, 97, 4625–4634. [Google Scholar] [CrossRef]
  60. Sauvant, D.; Giger-Reverdin, S. Modélisation des interactions digestives et de la production de méthane chez les ruminants. INRAE Prod. Anim. 2009, 22, 375–384. [Google Scholar] [CrossRef] [Green Version]
  61. Neto, A.J.; Messana, J.D.; Granja-Salcedo, Y.T.; Castagnino, P.S.; Fiorentini, G.; Reis, R.A.; Berchielli, T.T. Effect of starch level in supplement with or without oil source on diet and apparent digestibility, rumen fermentation and microbial population of Nellore steers grazing tropical grass. Livest. Sci. 2017, 202, 171–179. [Google Scholar] [CrossRef]
  62. Hegarty, R. Nutritional management options to reduce enteric methane emissions from NSW beef and dairy herds. In Proceedings of the 24th Annual Conference of the Grassland Society of NSW, Taree, NSW, Australia, 5–6 August 2009; pp. 40–47. [Google Scholar]
  63. Liu, Z.; Liu, Y.; Shi, X.; Wang, J.; Murphy, J.P.; Maghirang, R. Enteric methane conversion factor for dairy and beef cattle: Effects of feed digestibility and intake level. Trans. ASABE 2017, 60, 459–464. [Google Scholar] [CrossRef]
  64. Eggleston, H.S.; Buendia, L.; Miwa, K.; Ngara, T.; Tanabe, K. IPCC Guidelines for National Hreenhouse Gas Nventories; IPCC National Greenhouse Gas Inventories Programme, Intergovernmental Panel on Climate Change IPCC, c/o Institute for Global Environmental Strategies IGES, 2108—11, Kamiyamaguchi: Hayama, Japan, 2006. [Google Scholar]
  65. Chaves, A.V.; Thompson, L.C.; Iwaasa, A.D.; Scott, S.L.; Olson, M.E.; Benchaar, C.; Veira, D.M.; McAllister, T.A. Effect of pasture type (alfalfa vs. grass) on methane and carbon dioxide production by yearling beef heifers. Can. J. Anim. Sci. 2006, 86, 409–418. [Google Scholar] [CrossRef]
  66. Boadi, D.A.; Wittenberg, K.M.; McCaughey, W. Effects of grain supplementation on methane production of grazing steers using the sulphur (SF6) tracer gas technique. Can. J. Anim. Sci. 2002, 82, 151–157. [Google Scholar] [CrossRef] [Green Version]
  67. Beauchemin, K.A.; Kreuzer, M.; O’Mara, F.; McAllister, T.A. Nutritional management for enteric methane abatement: A review. Aust. J. Exp. Agric. 2008, 48, 21–27. [Google Scholar] [CrossRef]
  68. Meister, N.C.; Cardoso, A.d.S.; Alari, F.O.; Lemos, N.L.S.; Frighetto, R.T.S.; Malheiros, E.B.; Reis, R.A.; Ruggieri, A.C. Effect of pasture management on enteric methane emissions from goats. Trop. Anim. Health Prod. 2021, 53, 94. [Google Scholar] [CrossRef] [PubMed]
  69. De Souza Filho, W.; Nunes, P.A.d.A.; Barro, R.S.; Kunrath, T.R.; de Almeida, G.M.; Genro, T.C.M.; Bayer, C.; de Faccio Carvalho, P.C. Mitigation of enteric methane emissions through pasture management in integrated crop-livestock systems: Trade-offs between animal performance and environmental impacts. J. Clean. Prod. 2019, 213, 968–975. [Google Scholar] [CrossRef]
Figure 1. Spatial distribution of the tropical pasture data. Base map: global cattle distribution using the Gridded Livestock of the World 2 global distribution [31] derived from ArcGIS Pro 2.8.6 (ESRI, California, USA) [32].
Animals 12 01806 g001
Figure 2. Ascending median values of crude protein (% DM) in tropical pasture species and cultivars grown in different environments.
Animals 12 01806 g002
Figure 3. Ascending median values of metabolisable energy (MJ kg−1 DM) in tropical pasture species and cultivars grown in contrasting environments.
Animals 12 01806 g003
Figure 4. Ascending median values of estimated methane production (g CH4 animal−1 day−1) in tropical pasture species and cultivars grown in contrasting environments. Methane gas production was estimated using CH4 (g CH4 animal−1 day−1) = 17.0 (±0.99) × dry matter intake + 0.03 (±0.01) × neutral detergent fibre.
Animals 12 01806 g004
Table 1. Descriptive statistics of key variables.
ItemnMeanSDMinimumMaximum
Climate
MAT (°C)29422.83.4517.529.30
MAR (mm)2941229.5603.57104.53390.0
MSL (m)294516.2627.6115.02393.0
Defoliation frequency (days)29459.5135.6814.0180.0
Defoliation intensity (mm)285100.150.3640.0200.0
Forage yield (DM t ha−1)1887.846.750.3346.01
Nutritive metrics (DM)
NDF (%)18667.325.7350.9179.80
ADF (%)16038.855.8624.7057.44
ADL (%)305.691.422.838.20
Ash (%)888.753.184.4015.20
CP (%)25410.974.082.1121.10
DMD (%)4956.017.1330.2070.10
OMD (%)14557.997.3033.1172.20
ME (MJkg−1 DM)1367.411.163.509.75
OM (gkg−1)43894.181.93590.00957.00
CH4 production
1 CH4 (g CH4 animal−1 day−1)186132.920.17132.43133.30
(n = number of records, MAT = mean annual temperature, MAR = mean annual rainfall, MSL = mean sea level, CP = crude protein, ADF = acid detergent fibre, NDF = neutral detergent fibre, minerals, OMD = organic matter digestibility, ME = metabolisable energy. 1 Methane gas production was estimated using CH4 (g CH4 animal−1 day−1) = 17.0 (±0.99) × dry matter intake + 0.03 (±0.01) × neutral detergent fibre.
Table 2. Least squares means (±SE) of nutritive values within bioclimatic zones described by the Köppen-Geiger climate classification system.
Nutritive MetricsnClimatep-Value
Arid/DryTropical/
Equatorial
Warm Temperate
CP (%)2457.15 b ± 0.9711.25 a ± 0.4212.02 a ± 0.76<0.0001
NDF (%)17563.64 ± 2.4067.47 ± 0.8768.50 ± 1.210.1989
ADF (%)16437.82 ± 2.27 ab40.97 a ± 0.8235.21 ± 1.36 b<0.0001
OMD (%)142-58.76 ± 1.1456.17 ± 1.570.1845
DMD (%)53-54.37 ± 1.4452.33 ± 3.600.6039
ME (MJ kg−1 DM)1428.67 a ± 0.557.60 b ± 0.187.19 b ± 0.250.0477
ADL (%)344.58 ± 0.786.07 ± 0.424.50 ± 1.370.1913
Ash (%)8813.17 a ± 2.3310.15 a ± 0.585.93 b ± 0.93<0.0001
OM (g kg−1 DM)47726.17 b ± 35.30899.35 a ± 13.57-<0.0001
1 CH4 (g CH4 animal−1 day−1)169132.81 ± 0.07132.93 ± 0.03132.96 ± 0.040.1858
a,b Different superscript letters in the same raw data are significantly different as identified by the linear mixed models (p < 0.05). All nutritive metrics are given as a percentage of dry matter unless specified. n = number of records. Nutrient metrics are as follows: CP = crude protein, NDF = neutral detergent fibre, ADF = acid detergent fibre, OMD = organic matter digestibility, DMD = dry matter digestibility, ME = metabolisable energy, ADL = acid detergent lignin, minerals, OM = organic matter. 1 Methane gas production was estimated using CH4 (g CH4 animal−1 day−1) = 17.0 (±0.99) × dry matter intake + 0.03 (±0.01) × neutral detergent fibre.
Table 3. Pearson correlation coefficients (r) between tropical forage nutritive values and estimated methane production vs. defoliation frequency in the database.
Nutritive Metrics (% DM)Defoliation Frequency
rp-Value
NDF0.29<0.001
ADF0.35<0.001
ADL−0.260.112
Minerals0.190.060
CP−0.31<0.001
DMD−0.360.005
OMD−0.38<0.001
ME (MJ kg−1 DM)0.38<0.001
OM (g kg−1)0.140.334
1 CH4 (g CH4 animal−1 day−1)0.29<0.001
(Nutritive metrics are as follows: CP = crude protein, NDF = neutral detergent fibre, ADF = acid detergent fibre, OMD = organic matter digestibility, DMD = dry matter digestibility, ME = metabolisable energy, ADL = acid detergent lignin, minerals, OM = organic matter. 1 Methane gas production was estimated using CH4 (g CH4 animal−1 day−1) = 17.0 (±0.99) × DMI + 0.03 (±0.01) × NDF.
Table 4. Effect of defoliation frequency and defoliation intensity on nutritive values of tropical pasture species estimated from the linear mixed-effects models.
Nutritive MetricsEffectEstimateSeDFt Valuep-Value
CPIntercept12.410.853714.47<0.0001
Defoliation frequency−0.0820.00778−10.45<0.0001
Defoliation intensity0.0830.087780.960.3411
NDFIntercept59.592.543023.4<0.0001
Defoliation frequency0.0920.035732.590.0117
Defoliation intensity0.0310.308730.10.9192
ADFIntercept39.133.93399.95<0.0001
Defoliation frequency0.0380.0111073.240.0016
Defoliation intensity−0.5240.316107−1.660.1005
MEIntercept6.290.434014.55<0.0001
Defoliation frequency−0.0130.004872.720.0078
Defoliation intensity0.1260.037873.370.0011
OMDIntercept50.592.704018.71<0.0001
Defoliation frequency−0.0830.03087−2.720.0078
Defoliation intensity0.7930.235873.370.0011
DMDIntercept47.514.86129.78<0.0001
Defoliation frequency0.0280.082310.340.7336
Defoliation intensity0.700.19313.590.0011
1 CH4Intercept133.180.12421027.65<0.0001
Defoliation frequency0.000310.000821080.390.701
Defoliation intensity−0.02540.0099108−2.560.012
ADLIntercept7.772.5693.030.0142
Defoliation frequency0.220.061123.70.003
Defoliation intensity−0.0940.07312−1.290.221
MineralsIntercept14.783.19194.630.0002
Defoliation frequency−0.0510.008559−6.05<0.0001
Defoliation intensity−0.440.2059−2.20.0315
(Nutritive metrics are as follows: CP = crude protein, NDF = neutral detergent fibre, ADF = acid detergent fibre, OMD= organic matter digestibility, DMD = dry matter digestibility, ME = metabolisable energy, ADL = acid detergent lignin, minerals, OM = organic matter. 1 Methane gas production was estimated using CH4 (g CH4 animal−1 day−1) = 17.0 (±0.99) × DMI + 0.03 (±0.01) × NDF.
Publisher’s Note: MDPI stays neutral with regard to jurisdictional claims in published maps and institutional affiliations.

