Article

Dynamics of Growth and Egg Traits in Three Dietary Balanced Protein Scenarios Applied for Laying Hens

by
Ingryd Palloma Teodósio Da Nóbrega
1,
Matheus de Paula Reis
1,
Freddy Alexander Horna Morillo
1,
Luis Filipe Villas-Bôas De Freitas
1,
Letícia Cardoso Bittencourt
2,
João Batista Kochenborger Fernandes
1 and
Nilva Kazue Sakomura
1,*
1
Department of Animal Sciences, Faculty of Agrarian and Veterinary Science, São Paulo State University, Jaboticabal 14884-900, SP, Brazil
2
DSM Brazil, Mairinque 18120-000, SP, Brazil
*
Author to whom correspondence should be addressed.
Animals 2022, 12(11), 1371; https://doi.org/10.3390/ani12111371
Submission received: 8 May 2022 / Revised: 22 May 2022 / Accepted: 23 May 2022 / Published: 27 May 2022
(This article belongs to the Collection Poultry Nutrition and Metabolism)

Abstract

:

Simple Summary

This study aimed to investigate the impact of three dietary balanced protein levels on laying hens, during the rearing and laying phases. The performance and body composition were monitored at 7, 11, 15, and 18 weeks old, while for the laying phase the responses were monitored every 28 days, from 19–102 weeks of age. The dietary protein applied in this study did not affect the responses evaluated in the rearing phase, but it clearly affected the long-term egg production. Overall, the egg production of hens consuming a high protein diet was superior compared to hens in the lower protein group and similar results were observed for body weight and body composition. The benefits of this study were to demonstrate the dynamic traits of laying hens in the long-term egg production cycle in three dietary balanced protein scenarios as similar data could not be found elsewhere.

Abstract

The objective of this study was to evaluate laying hens from 8 to 102 weeks old, regarding their changes in performance, body composition, and egg components produced in three scenarios of nutrition. Three treatments designed to contain different levels of balanced protein (BP) were randomly assigned to the experimental units, performing ten replicates per treatment with 20 birds each. A standard feed was formulated to meet hen requirements and the ideal ratio between essential amino acids. Then, two experimental feeds were formulated to contain 20% above or below the dietary BP used in the standard feed. The responses evaluated were cumulated feed intake (g), daily feed intake (g/day), body weight (g), body composition (g of protein, fat, and ash), hen-housed egg production (%/hen-housed), egg production (%), egg weight (g), egg mass (g), and egg components (percentages of yolk, albumen, and eggshell). The dietary BP influenced the body composition, egg production, egg weight, and egg mass of white laying hens. The increase in dietary BP was related to an increase in body contents and egg weight, whereas hens consuming the low dietary balanced protein presented a lower body weight, leaner, and produced smaller eggs.

1. Introduction

Currently, there is a concept to keep hens for extended periods in production, aiming to increase profitability and sustainability. Despite the benefits of doing so, controlling the excess body fat and eggshell quality in old laying hens is reported to be the main concern on poultry farms [1,2]. The body fat and egg components are influenced by the feed offered [3] and eggshell quality reduces as egg weight increases, which may be partially controlled with nutritional strategies [4,5]. In addition, the feed offered to hens during the rearing phase may affect the development of reproductive organs [6], influencing the long-term laying cycle.
The ability of laying hens to overcome a nutritional deficiency or an imbalanced diet is not completely elucidated. Some effort was made to investigate the effects of a previous feed on the laying cycle phase [7,8,9] but little or no knowledge is available in the literature describing how a modern hen may deal with a deficient diet during the growth and its impact in a long-term laying cycle. This information is convenient for poultry nutritionists because they often change the feed formula to improve the economic return and sustainability of egg production farms. In this sense, protein is frequently investigated in poultry nutrition given its importance for growth [10,11], egg production [12,13], economic return [14,15], and sustainability of the farm [16,17]. Because amino acids are the basic constituents of proteins and that essential amino acids should be offered in the feed in a proper ratio with lysine [18], it seems reasonable to investigate the effects of balanced protein in a long-term egg production cycle.
Understanding the dynamics of body and egg components represents a step towards an effective way to improve long-term egg production given feeds should be formulated based on physiological needs and the response of laying hens. In a conventional poultry house, the feed offered is the only source of energy and nutrients for a laying hen. Therefore, a change in voluntary feed intake is the only mechanism that a hen can use to consume a proper amount of all nutrients. If they fail to do so, body and egg components are expected to change [6,19] along with the egg production [20]. This highlights the importance to elucidate the dynamics of body and egg composition over different sets of nutrition scenarios.
The effects of dietary balanced protein for hens in the rearing phase and its cumulated influence in the long-term laying cycle have not been investigated so far. In the context aforementioned, we hypothesized that balanced protein levels affect the body and egg components leading to a shift in the long-term laying cycle; thus, the aim of the present research was to describe how laying hens respond to three levels of dietary balanced protein from 8 to 102 weeks old.

2. Materials and Methods

2.1. Ethics Approval

All procedures described were approved by the Ethical Committee on the Use of Animals of the School of Agrarian and Veterinary Sciences, São Paulo State University (UNESP), Jaboticabal, São Paulo, Brazil (Process 012598/2018; approved on 14 February 2019).

2.2. Bird Husbandry

A total of 600 Lohmann LITE LSL-NA were obtained from a breeding company (Planalto Postura LTDA. Uberlândia, MG. Brazil). The hatchlings were raised in conventional cages from 1 to 7 weeks before being moved to wire rearing cages (375 cm2 per pullet) from 8 to 18 weeks. At 19 weeks, hens were transferred to wire-laying cages (563 cm2 per hen). All cages were equipped with trough feeders and nipple drinkers. Hens received a corn-soybean meal-based diet to meet or exceed breeding company recommendations from 1 to 7 weeks old. A feed program with three feeds was offered from 8 to 18 weeks, for grower (8–11 weeks), developer (12–15 weeks), and pre-laying phases (16–18 weeks). At the laying phase, a feed program with five feeds was formulated according to the breeding company recommendations: layer one (19–26 w-old), layer two (27–46 w-old), layer three (47–66 w-old), layer four (67–82 w-old), and layer five (83–102 w-old). Birds had free access to feed and fresh water throughout the trial. The lighting program adopted was 24 L in the first week, reduced gradually to 12L:12D up to 10-w-old, which was maintained until the pullets achieved 5% of egg production (20-w-old). After the onset of egg production, the lighting program was gradually increased from 12–16 h of light by adding one hour per week and was then kept constant up to 102 weeks of age. In the period of 0–7, 8–18, and 19–102 w-old, the maximum temperatures recorded were 31, 26, and 27 °C, while the minimum were 24, 17, and 19 °C, respectively. The maximum relative humidity of the air was 77, 79, and 84% while the minimum records were 51, 57, and 50%, respectively for the same phases. One laying cycle was considered as 28 consecutive days.

2.3. Experimental Design and Feeds

Three treatments were randomly assigned to 30 experimental units of 20 pullets each, totalling ten replicates per treatment, performing a completed randomized design. Treatments consisted of three dietary levels of balanced protein (BP): 1—standard feed (S), formulated to meet or exceed breeding company recommendations; 2—reduction of 20% in dietary balanced protein (L), in reference to the S feed; 3—increase of 20% in dietary balanced protein (H), in reference to the S feed. Dietary balanced protein was defined as a constant ratio of essential amino acids with lysine [21] and the ratio was the same proposed by the breeding company [22]. Standardized ileal digestible lysine (SID-Lys) was the reference to produce the three levels of dietary balanced protein (Table 1).
In the rearing phase, the S-BP group consumed a feed containing 0.80, 0.70, and 0.74 % of SID-Lys for the grower, developer, and pre-layer phase, respectively. The S-BP feeds in the laying phase contained 0.68, 0.66, 0.63, 0.61, and 0.58% of SID-Lys, respectively for each layer phase (Table 2). The remaining nutrients and energy in the feed were as recommended by the guideline [22].

2.4. Performance Data and Egg Components Measurement

The number of eggs produced, and mortality were daily recorded. Every week, all eggs produced were weighed and the egg mass (rate of egg produced × egg weight) was calculated. The feed leftovers were weighed fortnightly and adjusted by mortality to calculate the food intake. The cumulative feed intake was expressed on g/bird for the rearing (eight to 18 w-old) and the rearing plus laying phases (8–102 w-old). Hen-housed egg production was calculated based on the number of eggs produced in the entire experiment period per number of housed hens at 19 w-old.

2.5. Body Composition

On the first day of the trial, eight birds per treatment were randomly selected and identified for body composition measurements by dual-energy X-ray absorptiometry (Hologic-QDR® model 13.4.2., Marlborough, MA, USA). Throughout the experiment, the same hen was scanned on the last day of every feeding phase. Prior to each scan, hens were fasted for five hours, weighed, anesthetized with isoflurane (2%) diluted in 100% of oxygen, and positioned in dorsal decubitus with the wings and legs flexed [23]. Measures collected were fat mass (g), lean mass (water + protein content, g), bone mineral content (g), and bone mineral density (g/cm²). Data collected were converted to contents of body protein, fat, and ash by applying the equations published by Alves et al. [23].

2.6. Egg Components

At the end of each laying cycle (28 days), a total of nine eggs per experimental unit were collected (three eggs per three sequential days). On each day, the eggs were broken apart individually to measure the albumen, yolk, and shell weights. Before measurement, the eggshell was washed with tap water and dried using a forced oven at 55 °C for 24 h. The percentages of albumen, yolk, and eggshell were then calculated.

2.7. Statistical Analysis

The collected data were examined for outliers, normality, and homoscedasticity. The data of cumulative feed intake and hen-housed egg production were analysed as One-Way ANOVA with a Tukey test to evaluate the differences between dietary balanced protein levels, using a generalized linear model. Two-factor repeated measure design was employed to determine the effects of dietary balanced protein over time, using a mixed model. One factor is represented by the three groups receiving the different series of dietary balanced protein feeds and the other factor is the age of hens. Each experimental unit was the repeated measures factor. Differences were considered to be significant at a probability of 5%. The Statistical Analysis System (SAS Institute Inc., Cary, NC, USA) was used to perform both a One-Way ANOVA and the Two-factor repeated measure analyses procedures. The data was analysed considering 21 cycles of four weeks each.
To test whether the responses differed between dietary balanced protein levels over time, non-linear regression with groups was used, the groups being the dietary balanced protein [24]. The average data per replicate were treated as the experimental unit. Two exponential models were applied and that with the lower Akaike information criterion [25] value was used to describe the response variable. The model used were:
Linear   plus   exponential :   y = A + B × R a g e + C × a g e
where A and C are the y-intercept and slope of the linear segment, respectively, B is the y-intercept of the exponential segment, and R is the exponential base.
Exponential :   y = A 1 + B 1 × R 1 a g e
where A1 + B1 is the y-intercept, and R1 is the exponential base.

3. Results

The reduction and increase of dietary balanced protein in the laying feed did not affect the cumulative feed intake (p > 0.05, Table 3), being on average 4.44 kg (p = 0.986) and 67.7 kg of feed per bird (p = 0.485) in the growth and whole period, respectively. The reduction of dietary balanced protein affected the hen-housed egg production (p < 0.01), with similar results between hens from the S and H groups (p > 0.05).
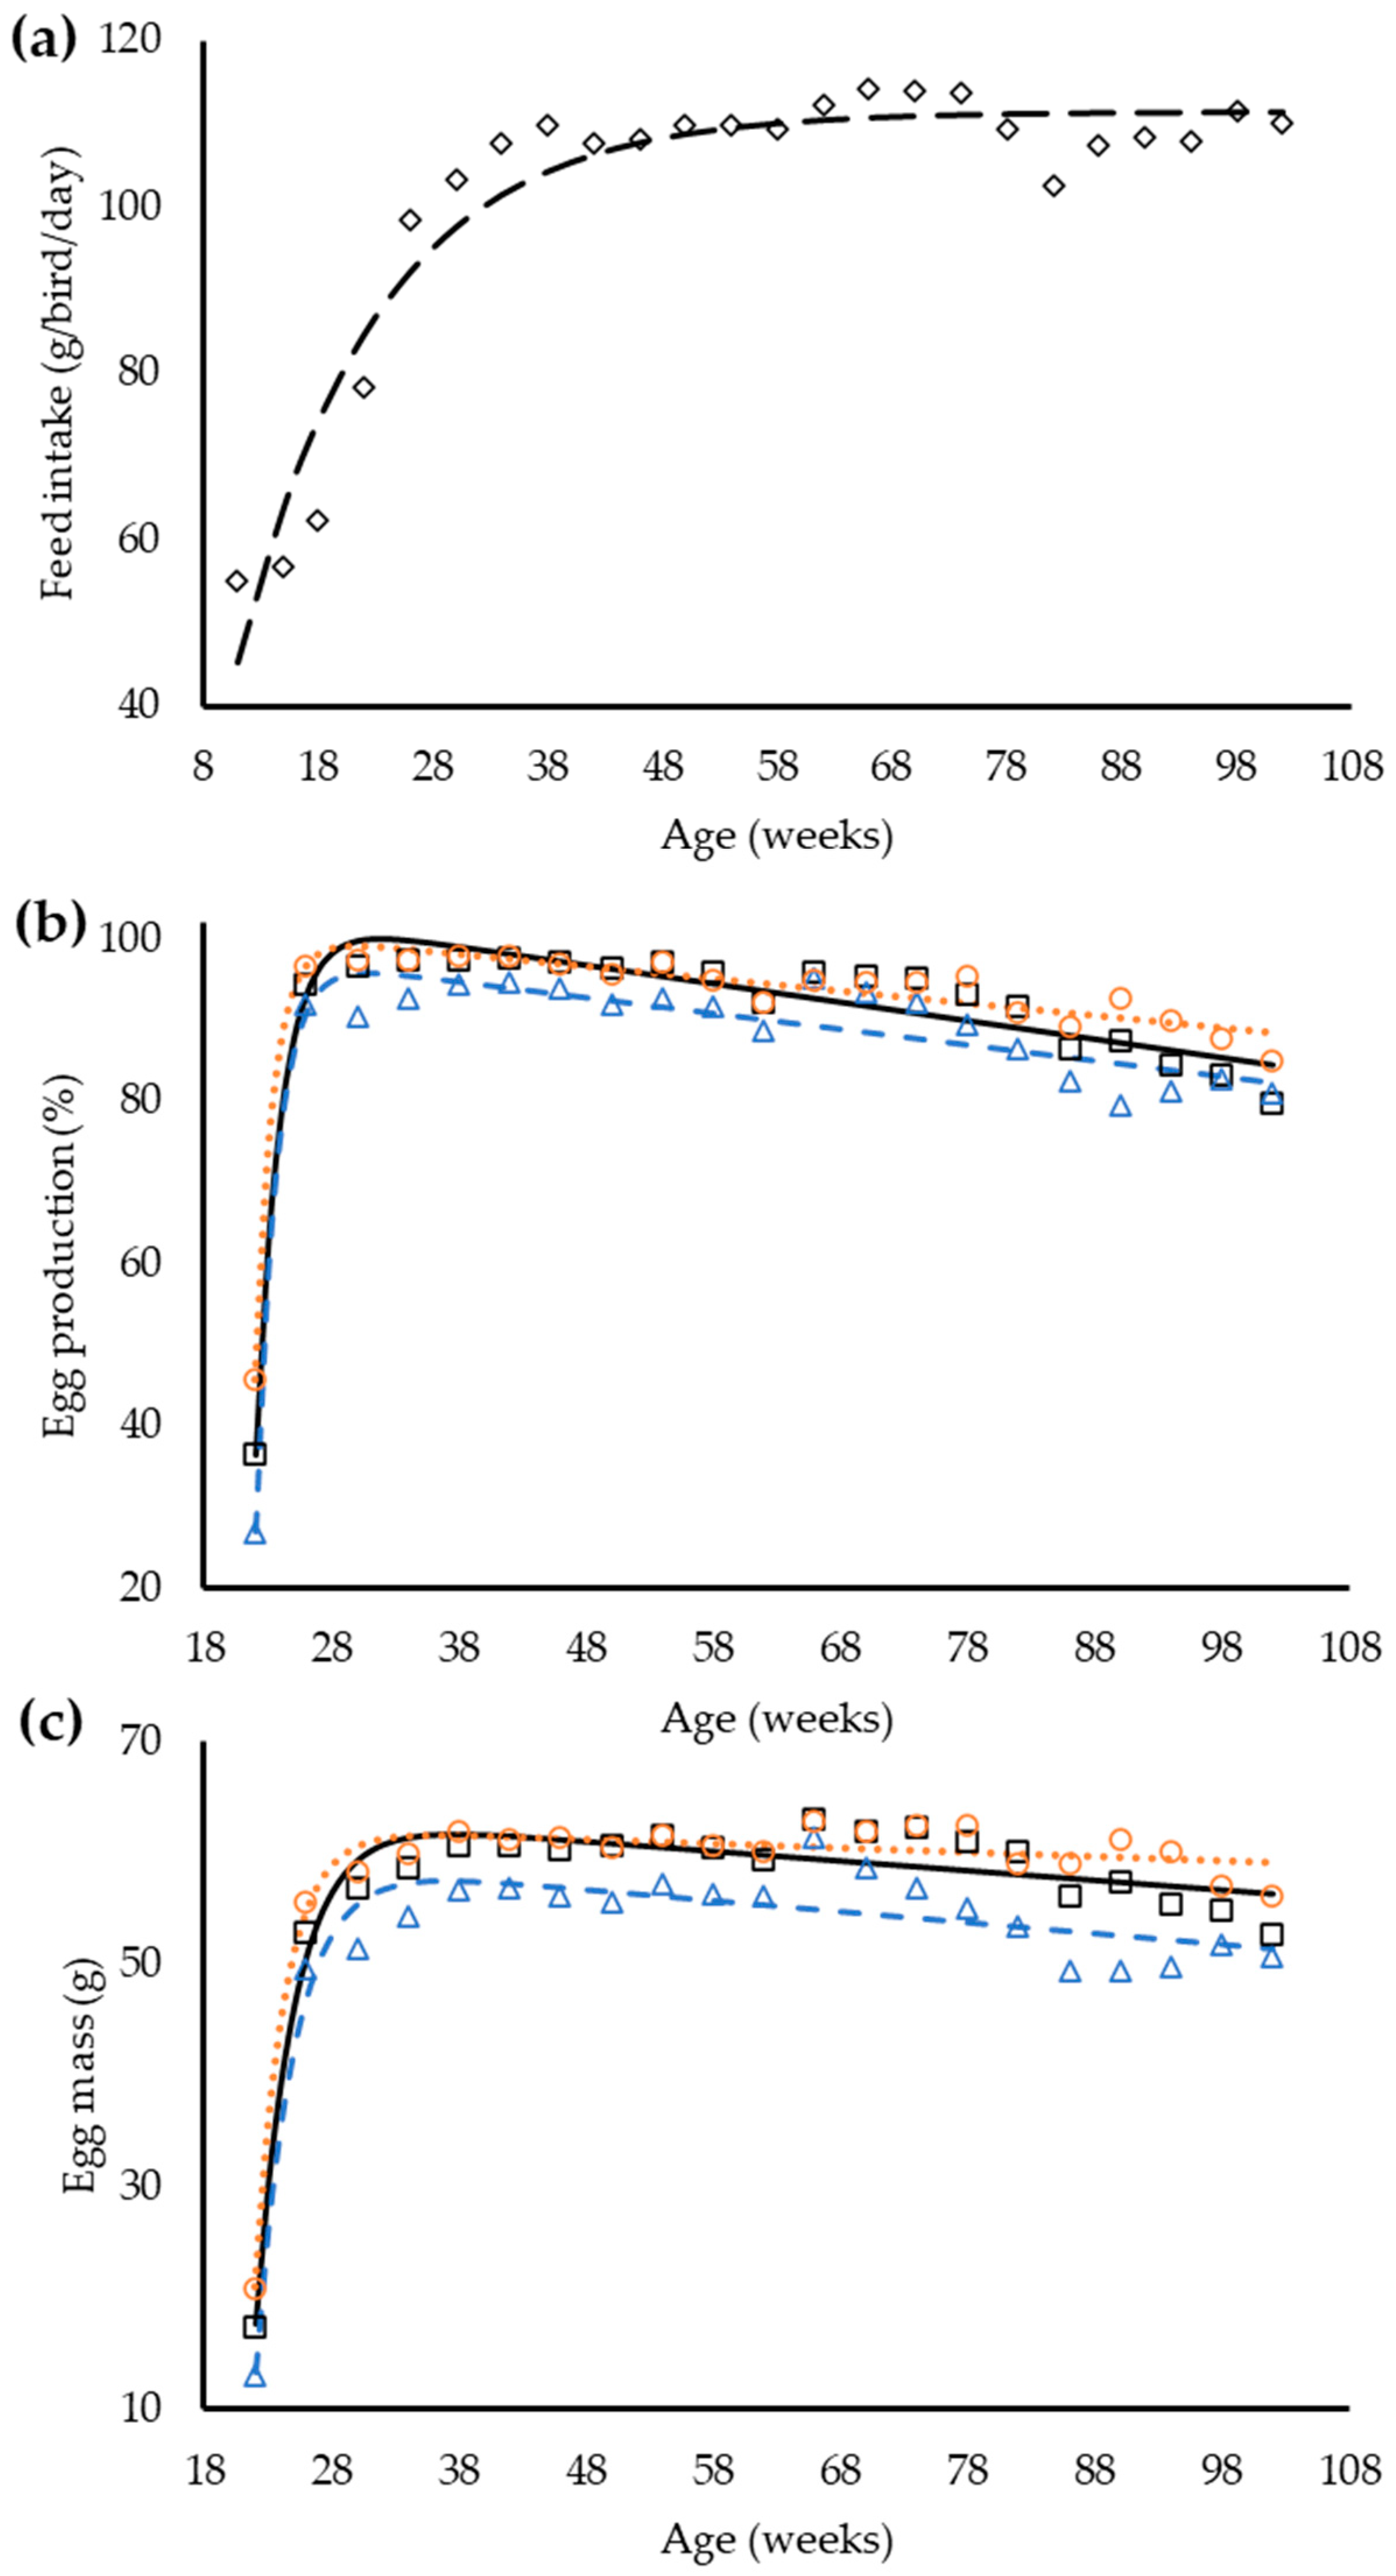
There was an interaction between dietary balanced protein and hens age for feed intake, egg production, and egg mass (p < 0.05, Table 4). For feed intake, differences between treatments were observed only at 26 weeks of age (p < 0.05). For egg production, differences were observed mainly at the beginning (first three laying cycles) and the end (after 74 w-old) of the laying cycle, whereas for egg mass the differences between groups of hens were consistent during the whole experimental period (Table 4).
The exponential equation was used to demonstrate the changes in feed intake and the line plus exponential equation had the best fit for egg production and egg mass (Table 5). The regression with groups identified that a single equation could be used to describe the feed intake between groups, whereas for egg production and egg mass the regression analysis indicates a necessity for different equations for laying hens inside each dietary balanced protein group (Figure 1).
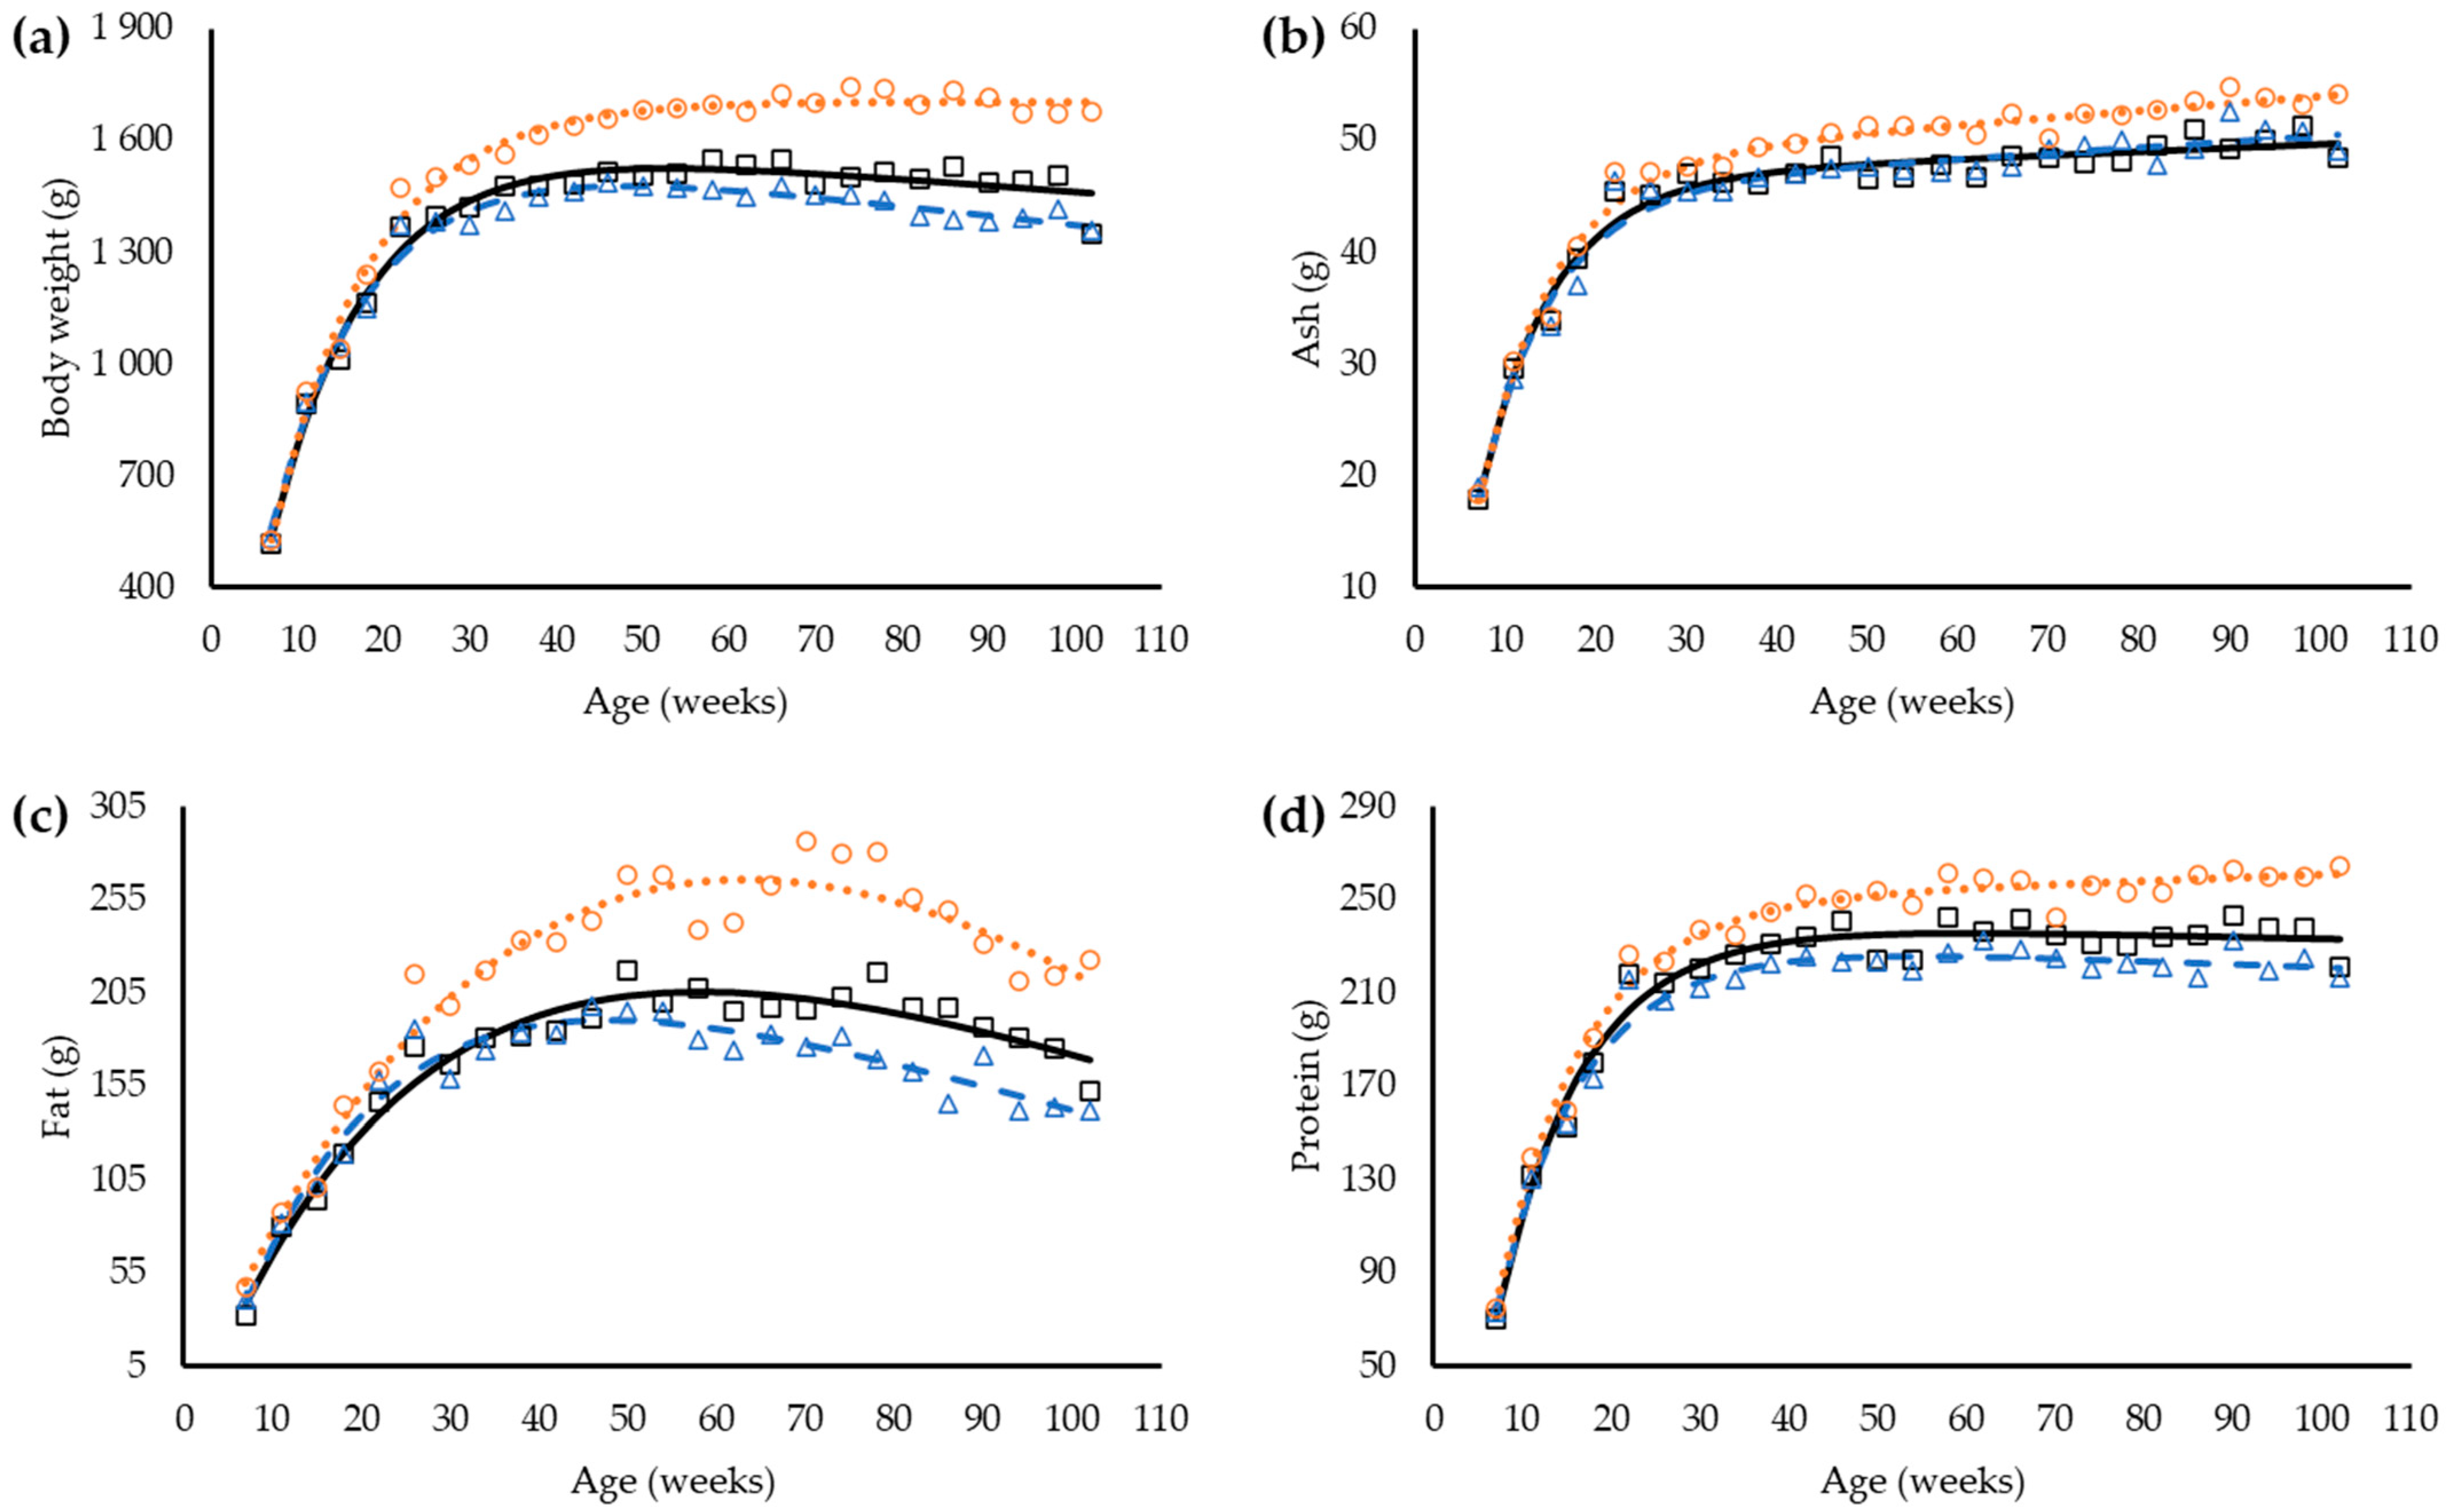
Differences in body weight influenced by dietary balanced protein were observed in 30 w-old hens (p < 0.05, Table 6), with heavier hens in the H group, followed by the S and L groups, respectively. Laying hens in the higher dietary balanced protein feed was fatter (p < 0.05) from 38 w-old and forward (Table 6).
Body contents of ash and protein increased along time for all groups (p < 0.05, Table 7). For body ash, differences were observed from 50 w-old and body protein from 30 w-old, and still relatively constant until the end of the trial.
The linear plus exponential function had the best fit for body weight and body components, and it was used to investigate the differences between hens consuming the different feeds (Table 8). A common coefficient R-value can be used to describe the changes in growth (p < 0.05), despite the levels of dietary balanced protein, except for fat (p < 0.05). However, the coefficients A, B, and C are different between groups (p < 0.05) and specific values are necessary to properly describe the changes in body weight and body composition between hens consuming the different levels of dietary balanced protein (Figure 2).
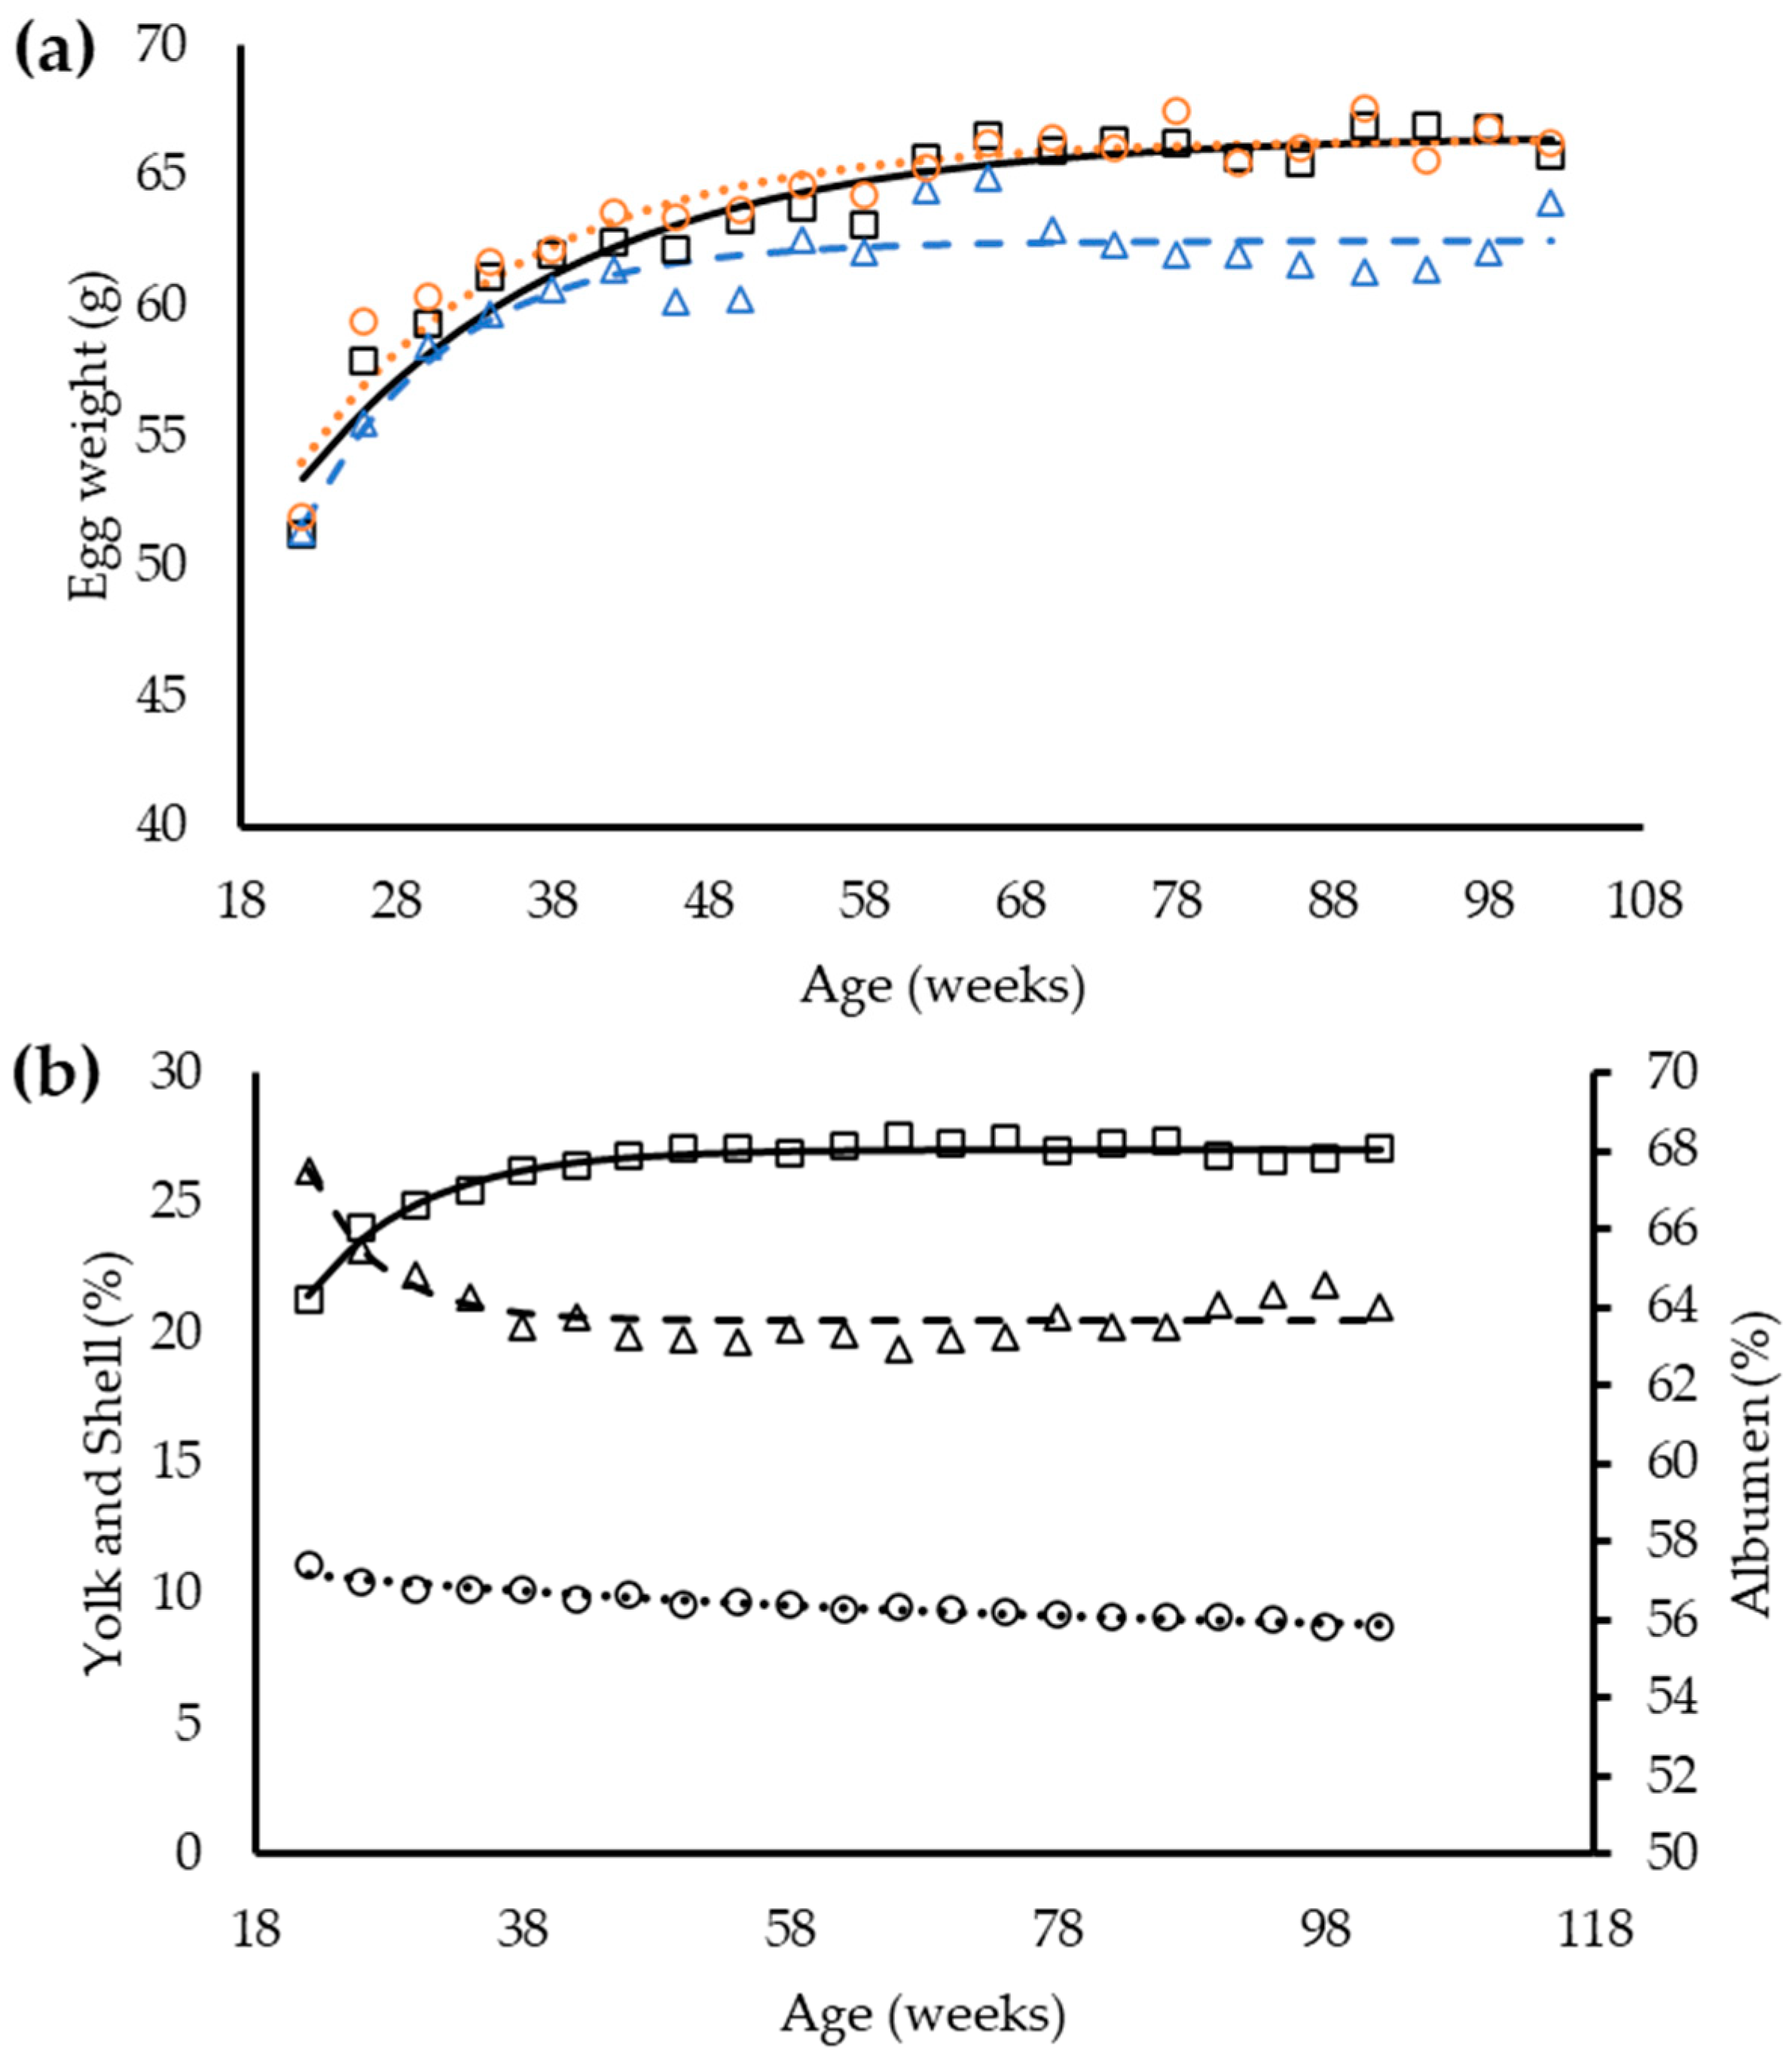
Overall, egg weight of laying hens was affected by dietary balance protein content (p < 0.05, Table 9). At 26 w-old, hens consuming the H feed produced heavier eggs, followed by hens from the S and L groups, respectively. Notably, egg weight was similar between groups of hens from 30 to 42 w-old and from 54 to 66 w-old (p < 0.05). The yolk percentage increased in all feed treatments as the hens aged (p < 0.05).
Different from those observed for yolk, the albumen and eggshell percentages reduced with time (p < 0.05, Table 10). Nevertheless, egg components were similar between groups of hens (p > 0.05) with a tendency for yolk percentage (p < 0.06).
The exponential function had the best fit for egg weight and egg components (Table 11). The analysis indicates that all dietary balanced protein contents used in this study affected the egg weight (p < 0.05) and all equation coefficients need to be changed to estimate the egg weight of hens according to dietary balanced protein. The range in dietary balanced protein levels applied in this study was not sufficient to change the concentration in egg components (p < 0.05); therefore, a single exponential equation was used for each egg component. A tendency was observed for yolk percentage (p = 0.06), suggesting an influence of dietary balanced protein in this egg component. The equation used to describe the albumen percentage had a low R2 value, mainly because a drop in albumen percentage was observed around 68 w-old and followed by a consecutive increase (Figure 3), which was poorly predicted with the exponential equation used.

4. Discussion

The aim of the study was to describe how three scenarios of protein levels elicited variations in the growth of laying hens and how such changes might affect long-term egg production and egg components. To our knowledge, this is the first study to investigate the influence of dietary balanced protein in laying hens, from the rearing period (eight w-old) until the end of laying cycle (102 w-old). Currently, there is a growing concept to keep laying hens for longer periods in production [1]. However, maintaining the egg production and egg quality of a flock of older hens is a challenge. Pieces of evidence demonstrate that body weight of laying hens at the onset of lay may affect the entire egg production [26] and the egg weight [27,28]. Specifically, the body composition of laying hens at the beginning of the laying phase could also affect the peak and persistence of egg production [29]. The dietary protein content is known to affect the growth of broilers and breeder pullets [30,31], and considering the higher cost of dietary protein [32] and the trend in reducing the nitrogen excretion in poultry farms [17], it might be convenient to investigate the effects of dietary protein over the growing and laying phase. Assuming that essential amino acids are required in constant ratios with lysine, in this study the concept of balanced protein was used as proposed by Eits et al. [33].
We observed that dietary balanced protein levels used in this study, poorly affected the daily feed intake of laying hens. A general theory for feed intake regulation was developed over the years [34,35,36], suggesting that feed intake is regulated by the first limiting component in the feed, being energy or essential amino acids. Evidence demonstrates that feed intake of growing broiler chicken and pullet of broiler breeder is affected by dietary protein [30,31]. For laying birds, the feed intake regulation seems to be more complex because the consumed nutrients are also used for egg production. A model proposed by Fisher et al. [37] and recently reviewed by Sakomura et al. [38] accommodated this problem, splitting the amino acid requirement for maintenance and egg mass, which was called the Reading model. Those authors introduced a methodology to predict the requirements of essential amino acids (mg/hen/day), highlighting the importance to understand the mechanisms related to feed intake regulation. In the present study, the higher level of dietary balanced protein elicited an increase in egg mass. According to the cited model, egg mass will affect the requirement of essential amino acids, which may explain why feed intake did not reduce for laying hens in the H group. On the contrary, laying hens in the L group reduced the egg mass, therefore, a lower amino acid was needed for egg production, which may have impacted the feed intake. An interesting behaviour of feed intake was observed after 74 weeks. Laying hens from all groups reduced their intake of feed. For egg production, comparing the values in the peak and that observed at week 74th, egg production reduced by about 2.6, 2.5, and 3.2 units, respectively for hens consuming the standard, low, and high dietary balanced protein feeds, which may be related to a reduction in laying hens needs, consequently, the feed intake.
On the other hand, when the cumulated feed intake was calculated per unit of egg produced, it was evidenced that laying hens in the L group consumed 130 g of feed per unit of egg produced, whereas the S and H groups consumed 122 and 120 g of feed per egg produced. The feed intake per unit of body weight was 50.3, 49.7, and 44.2 kg of feed per kg of body weight for the L, S, and H groups, respectively. Those results suggest that hens attempted to regulate their feed intake to compensate for the reduction in dietary balanced protein when the feed is deficient and reduce the feed intake when the dietary balanced protein is in excess. Recently, Kumar et al. [39] described a quadratic response of feed intake in function of the dietary balanced protein. Different from the study reported herein, laying hens (Lohmann-LSL) received a standard feed in the rearing phase. The laying hen’s current status, regarding body weight and body composition, seems to be an important factor that modulates their response and needs more attention in future studies.
Even though the reduction in dietary balanced protein may reduce the feed cost and nitrogen excretion [16,40], the feed intake per hen-housed egg increased. In this study, the number of eggs produced per hen-housed reduced 31 units for hens in the L group compared with the S group. Therefore, feeding cost (feed price x feed intake), revenue, and viability of hens should be accounted for to properly calculate the economic return. Viability observed in the L group was 85%, whereas for the S and H groups were 90 and 93%, respectively. Laying hens consuming the L feed demonstrated an acute reduction in body fat after 54 w-old. The ovulation cycle was demonstrated to be dependent on plasma-free fatty acids and the body lipid seems to be the main blood source of fatty acids [41]. We hypothesized that the ovulation cycle was affected by a reduction in body fat content, which reduces egg production in the L group. Eventually, a severe reduction of body fat might drastically affect the ovulation cycle and may stop egg production, reducing the viability of hens in the L group.
Laying hens from the H group had a body weight close to the recommendations in the guideline (Lohmann Tierzucht GmbH, Cuxhaven, Germany), whereas the hens from the S and L groups were 200 g lighter. The variation in body weight was mostly due to body fat, since after sexual maturity there is a reduction in body protein deposition, and the change in body weight is given by variations in body fat deposition [2,42]. The observations on body fat and egg production suggest that the hens in the H group did not have an excess of body lipid, as the laying performance was not affected. On the contrary, the persistence of egg production indicates that body fat in the H group was favourable. Milisits et al. [29] observed that laying hens with high body fat content at the onset of lay reduced the egg production in about 11 to 13 eggs when compared with hens with lower body fat content. There is a discussion about the importance of energy reserves as body fat; however, there is a lack of information on the desired body fat content that benefits longer-term egg production.
Using the first derivative of the linear plus exponential equation, the results demonstrated an increase in body fat content until 48 (L), 58(S), and 63 (H) w-old, followed by a linear reduction until 102 w-old. As cited before, few differences were observed between groups, where laying hens from the H group seem to have a delay in body fat mobilization, regarding the age. After the cited ages, the laying hens mobilize body fat, possible to maintain egg production, especially after 82 w-old, when the dietary metabolizable energy was reduced, as recommended by the guideline. Nonis and Gous [43] demonstrated that broiler breeders produce energy from body lipid if they are allowed to do it so, even though the concentration of dietary energy is above requirement, by regulating their feed intake. Similarly, Caldas et al. [44] observed a reduction in broiler breeders fat at the end of egg production phase. In line with our findings, Kumar et al. [17] observed a linear increase in body fat for laying hens consuming a feed with a crescent level of digestible lysine (ranging from 560 to 858 mg/hen/day). However, the authors investigated the effect of balanced protein in Lohmann-LSL Lite NA only until 66 w-old.
The body ash content of laying hens suggested that laying hens did not use mineral reserves to produce an egg, as the body ash increased until the end of the laying cycle. The major portion of minerals used for egg formation is due to calcium carbonate necessary for eggshell formation given approximately 80% of eggshell is formed by this mineral [45]. Around 99% of total body calcium is found in the bone ash [46]. Evidence demonstrates that in a flock of older hens, there are individuals with a tendency to develop osteoporosis [47], and there are an increased number of eggs with thinner eggshells due to lower ability to uptake calcium and phosphorus from the intestinal lumen [48]. In this study, dietary balanced protein seems to have a low or no effect over the dynamics of body ash contents. Apparently, the advanced ages of laying hens used in this study was not sufficient to elicit a negative consequence in the bone structure; however, in all treatments, the eggshell percentage reduced with age, probably due to the increase in egg size with the age of laying hens [49].
The dynamic of egg components observed over time was similar to that reported by Bendezu et al. [5] for white laying hens from 18 to 60 w-old. As the laying hens aged, the yolk percentage increased, and the albumen and eggshell reduced, which was consistent with other reported literature [50,51]. The dietary balanced protein tended to influence yolk percentage. Compared with the L group, the hens consuming the H feed produced eggs with more percentage of yolk. The contribution of dietary protein to yolk formation is probably related to phosvitin as this is the major protein molecule found in egg yolk. Around 56% of the amino acid found in the phosvitin is serine phosphorylated [52,53]. According to Huang et al. [54], it is believed that the role of phosvitin in the egg is related to embryo development, which reinforces the importance of such a constituent in egg yolk. In the present study, the tendency of a lower percentage of yolk observed in eggs of the L group may be related to the lower amount of dietary serine, which is necessary to produce the phosvitin in the egg. With lower sources of dietary serine, essential amino acids might be used to overcome this deficiency.
Among the responses observed in this study, the body fat content between laying hens consuming the different levels of balanced protein was unexpected. Most reports in the literature demonstrate that growing birds would increase body lipid content when they are offered a low balanced protein feed [30,31]. The opposite result is reported when a growing bird consumes a high balanced protein feed. The regulation of body fat content in laying birds seems to be more complex and the prediction of body fat in laying hens should be done with caution. The increase in egg yolk percentage may contribute to a higher value of body fat content as 34% of egg yolk is constituted of lipid [55]. Hocking [56] investigated the effect of body weight and feed intake on the ovarium follicular dynamics and found that feed-restricted broiler breeders reduced the number of yellow follicles. We did not find a similar study for laying hens, which would contribute to a better understanding of the results observed, but we hypothesize that a pullet raised with high level of dietary balanced protein feed may increase the number and the weight of yellow follicles in the ovarium, resulting in more body fat content in laying hens.

5. Conclusions

As expected, the dietary balanced protein influenced the dynamics of performance, body content, egg production, and egg mass of laying hens in the laying phase. The performance of laying hens increased with higher levels of balanced protein but other responses such as the feeding cost also influence the economic return and need to be considered to making a nutritional decision. The hen-housed egg production reduced in laying hens consuming a feed with low levels of dietary balanced protein. In this study, body ash was not mobilized, indicating that the minerals consumed were sufficient for egg production and that the dietary balanced protein levels applied in this study did not influence this variable. On the contrary, a mobilization of body fat was observed, being more evident at the end of laying cycle. The dietary balanced protein levels investigated in this study slightly affected the yolk percentage but had no influence on albumen and eggshell percentages. More persistence of egg production was observed for laying hens consuming a high dietary balanced protein feed.

Author Contributions

Conceptualization, N.K.S., M.d.P.R. and J.B.K.F.; methodology, N.K.S., M.d.P.R., J.B.K.F. and I.P.T.d.N.; validation, N.K.S., J.B.K.F., M.d.P.R., I.P.T.d.N. and F.A.H.M.; formal analysis, M.d.P.R., I.P.T.d.N. and L.F.V.-B.d.F.; investigation, N.K.S., I.P.T.d.N., M.d.P.R. and F.A.H.M.; resources, N.K.S. and L.C.B.; data curation, I.P.T.d.N. and M.d.P.R.; writing—original draft preparation, M.d.P.R. and I.P.T.d.N.; writing—review and editing, M.d.P.R. and I.P.T.d.N.; supervision, N.K.S. and M.d.P.R.; project administration, N.K.S., L.C.B., I.P.T.d.N. and M.d.P.R.; funding acquisition, N.K.S. and L.C.B. All authors have read and agreed to the published version of the manuscript.

Funding

This research was funded by DSM Innovation & Applied Science—Brazil. This study was possible thanks to the scholarship granted from the Brazilian Federal Agency for Support and Evaluation of Graduate Education (CAPES), in the scope of the Program CAPES-PrInt (process number 88887.572699/2020-00).

Institutional Review Board Statement

The study was approved by the Animal Care and Use Committee of Faculty of Agrarian and Veterinary Sciences of the São Paulo State University, Jaboticabal, São Paulo, Brazil (Process 012598/2018), prior to the beginning of the assays.

Informed Consent Statement

Not applicable, as this research did not involve humans.

Data Availability Statement

The data presented in this study are available on request from the corresponding author. The data are not publicly available due to privacy.

Acknowledgments

The authors would like to thank the CAPES—Brazil, grant number 88882.330322/2019-01. We are also grateful to the company Planalto Postura LTDA for the birds’ donation.

Conflicts of Interest

The authors declare no conflict of interest.

References

  1. Bain, M.M.; Nys, Y.; Dunn, I.C. Increasing persistency in lay and stabilizing egg quality in longer laying cycles. What are the challenges? Br. Poult. Sci. 2016, 57, 330–338. [Google Scholar] [CrossRef] [PubMed] [Green Version]
  2. Alfonso-Carrillo, C.; Benavides-Reyes, C.; de los Mozos, J.; Dominguez-Gasca, N.; Sanchez-Rodríguez, E.; Garcia-Ruiz, A.I.; Rodriguez-Navarro, A.B. Relationship between Bone Quality, Egg Production and Eggshell Quality in Laying Hens at the End of an Extended Production Cycle (105 Weeks). Animals 2021, 11, 623. [Google Scholar] [CrossRef] [PubMed]
  3. Nonis, M.K.; Gous, R.M. Changes in the feather-free body of broiler breeder hens after sexual maturity. Anim. Prod. Sci. 2016, 56, 1099–1104. [Google Scholar] [CrossRef]
  4. Pottgüter, R. Feeding laying hens to 100 weeks of age. Lohmann Inf. 2016, 50, 18–21. [Google Scholar]
  5. Bendezu, H.C.P.; Sakomura, N.K.; Malheiros, E.B.; Gous, R.M.; Ferreira, N.T.; Fernandes, J.B.K. Modelling the egg components and internal cycle length of laying hens. Anim. Prod. Sci. 2019, 59, 420–426. [Google Scholar] [CrossRef]
  6. Silva, E.P.; Sakomura, N.K.; Dorigam, J.C.P.; Lima, M.B.; Malheiros, E.B.; Fernandes, J.B.K. Sulfur amino acid requirements for pullets in growth and pre-laying trials. Anim. Prod. Sci. 2021, 61, 1526–1533. [Google Scholar] [CrossRef]
  7. Leeson, S.; Summers, J.D. Effect of rearing diet on performance of early maturing pullets. Can. J. Anim. Sci. 1981, 61, 743–749. [Google Scholar] [CrossRef]
  8. Xin, Q.; Ma, N.; Jiao, H.; Wang, X.; Li, H.; Zhou, Y.; Zhao, J.; Lin, H. Dietary Energy and Protein Levels During the Prelay Period on Production Performance, Egg Quality, Expression of Genes in Hypothalamus-Pituitary-Ovary Axis, and Bone Parameters in Aged Laying Hens. Front. Physiol. 2022, 13, 843. [Google Scholar] [CrossRef]
  9. Babiker, M.S.; Abbas, S.A.; Kijora, C.; Danier, J. The effect of dietary protein and energy levels during the growing period of egg-type pullets on internal egg characteristics of phase one of production in arid hot climate. Int. J. Poult. Sci. 2010, 10, 697–704. [Google Scholar] [CrossRef] [Green Version]
  10. Leeson, S.; Summers, J.D. Response of Leghorn pullets to protein and energy in the diet when reared in regular or hot-cyclic environments. Poult. Sci. 1989, 68, 546–557. [Google Scholar] [CrossRef]
  11. Ocak, N.; Sungu, M. Growth and egg production of layer pullets can be affected by the method of supplying energy and protein sources. J. Sci. Food Agric. 2009, 89, 1963–1968. [Google Scholar] [CrossRef]
  12. Novak, C.; Yakout, H.M.; Scheideler, S.E. The effect of dietary protein level and total sulfur amino acid:lysine ratio on egg production parameters and egg yield in hy-line w-98 hens1. Poult. Sci. 2006, 85, 2195–2206. [Google Scholar] [CrossRef] [PubMed]
  13. Bregendahl, K.; Roberts, S.A.; Kerr, B.; Hoehler, D. Ideal ratios of isoleucine, methionine, methionine plus cystine, threonine, tryptophan, and valine relative to lysine for white leghorn-type laying hens of twenty-eight to thirty-four weeks of age. Poult. Sci. 2008, 87, 744–758. [Google Scholar] [CrossRef]
  14. Novak, C.L.; Yakout, H.M.; Remus, J. Response to varying dietary energy and protein with or without enzyme supplementation on leghorn performance and economics. 2. Laying period. J. Appl. Poult. Res. 2008, 17, 17–33. [Google Scholar] [CrossRef]
  15. Lemme, A. Amino acid recommendations for laying hens. Lohmann Inf. 2009, 44 (Suppl. 2), 21–32. [Google Scholar]
  16. Burley, H.K.; Patterson, P.H.; Elliot, M.A. Effect of a reduced crude protein, amino acid-balanced diet on hen performance, production costs, and ammonia emissions in a commercial laying hen flock. J. Appl. Poult. Res. 2013, 22, 217–228. [Google Scholar] [CrossRef]
  17. Kumar, D.; Raginski, C.; Schwean-Lardner, K.; Classen, H.L. Assessing the response of hen weight, body composition, feather score, egg quality, and level of excreta nitrogen content to digestible balanced protein intake of laying hens. Can. J. Anim. Sci. 2018, 98 (Suppl. 4), 619–630. [Google Scholar] [CrossRef]
  18. Leeson, S.; Summers, J.D. Commercial Poultry Nutrition, 3rd ed.; Nottinghan University Press: Nottinghan, UK, 2005. [Google Scholar]
  19. Novak, C.; Yakout, H.; Scheideler, S. The combined effects of dietary lysine and total sulfur amino acid level on egg production parameters and egg components in Dekalb Delta laying hens. Poult. Sci. 2004, 83, 977–984. [Google Scholar] [CrossRef]
  20. Castro, F.L.S.; Kim, H.Y.; Hong, Y.G.; Kim, W.K. The effect of total sulfur amino acid levels on growth performance, egg quality, and bone metabolism in laying hens subjected to high environmental temperature. Poult. Sci. 2019, 98, 4982–4993. [Google Scholar] [CrossRef]
  21. Eits, R.M.; Kwakkel, R.P.; Verstegen, M.W.A.; Den Hartog, L.A. Dietary balanced protein in broiler chickens. 1. A flexible and practical tool to predict dose–response curves. Br. Poult. Sci. 2005, 46, 300–309. [Google Scholar] [CrossRef]
  22. Lohmann-LSL Lite Management Guide; Lohmann Tierzucht GmbH: Cuxhaven, Germany, 2019.
  23. Alves, W.J.; Malheiros, E.B.; Sakomura, N.K.; Silva, E.P.; Viana, G.S.; Reis, M.P.; Gonçalves, C.A.; Suzuki, R.A. In vivo description of body growth and chemical components of egg-laying pullets. Livest. Sci. 2019, 220, 221–229. [Google Scholar] [CrossRef]
  24. VSN International, 17th ed.; VSN Ltd.: Hemel Hempstead, UK, 2017.
  25. Akaike, H.A. New look at the statistical model identification. IEEE Trans. Autom. Control 1974, 19, 716–723. [Google Scholar] [CrossRef]
  26. Akbas, Y.; Takma, Ç. Canonical correlation analysis for studying the relationship between egg production traits and body weight, egg weight and age at sexual maturity in layers. Czech J. Anim. Sci. 2005, 50, 163–168. [Google Scholar] [CrossRef] [Green Version]
  27. Leeson, S.; Summers, J.D. Effect of immature body weight on laying performance. Poult. Sci. 1987, 66, 1924–1928. [Google Scholar] [CrossRef] [PubMed]
  28. Lacin, E.; Yildiz, A.; Esenbuga, N.; Macit, M. Effects of differences in the initial body weight of groups on laying performance and egg quality parameters of Lohmann laying hens. Czech J. Anim. Sci. 2008, 53, 466–471. [Google Scholar] [CrossRef] [Green Version]
  29. Milisits, G.; Szentirmai, E.; Donkó, T.; Budai, Z.; Ujvári, J.; Áprily, S.; Sütő, Z. Effect of starting body fat content and genotype of laying hens on the changes in their live weight, body fat content, egg production and egg composition during the first egg-laying period. Br. Poult. Sci. 2015, 56, 666–672. [Google Scholar] [CrossRef]
  30. Azevedo, J.M.; Reis, M.P.; Gous, R.M.; Dorigam, J.C.C.P.; Leme, B.B.; Sakomura, N.K. Response of broilers to dietary balanced protein. 1. Feed intake and growth. Anim. Prod. Sci. 2021, 61, 1425–1434. [Google Scholar] [CrossRef]
  31. Van Emous, R.A.; Kwakkel, R.P.; Van Krimpen, M.M.; Hendriks, W.H. Effects of dietary protein levels during rearing and dietary energy levels during lay on body composition and reproduction in broiler breeder females. Poult. Sci. 2015, 94, 1030–1042. [Google Scholar] [CrossRef]
  32. Sakomura, N.K.; Silva, R. Conceitos aplicáveis à nutrição de não ruminantes. In Cadernos Técnicos da Escola de Veterinária; UFMG Brasil: Belo Horizonte, Brazil, 1998; pp. 125–146. [Google Scholar]
  33. Eits, R.M.; Kwakkel, R.P.; Verstegen, M.W.A.; Emmans, G.C. Responses of broiler chickens to dietary protein: Effects of early life protein nutrition on later responses. Br. Poult. Sci. 2003, 44, 398–409. [Google Scholar] [CrossRef]
  34. Pack, M. Factors impacting amino acid levels recommended for growing poultry. In Proceedings of the 11th WPSA Symposium on Poultry Nutrition, Faaborg, Denmark, 24–28 August 1997. [Google Scholar]
  35. Emmans, G.C. A model of the growth and feed intake of ad libitum fed animals, particularly poultry. BSAP Occas. Publ. 1981, 5, 103–110. [Google Scholar] [CrossRef]
  36. Johnston, S.A.; Gous, R.M. Modelling egg production in laying hens. In Mechanistic Modelling in Pig and Poultry Production, 1st ed.; Gous, R., Fisher, C., Morris, T.R., Eds.; CABI: Wallingford, UK, 2006; pp. 188–208. [Google Scholar]
  37. Fisher, C.; Morris, T.R.; Jennings, R.C. A model for the description and prediction of the response of laying hens to amino acid intake. Br. Poult. Sci. 1973, 14, 469–484. [Google Scholar] [CrossRef] [PubMed]
  38. Sakomura, N.K.; Silva, E.P.; Dorigam, J.C.C.P.; Gous, R.M.; St-Pierre, N. Modeling amino acid requirements of poultry. J. Appl. Poult. Res. 2015, 24, 267–282. [Google Scholar] [CrossRef]
  39. Kumar, D.; Raginski, C.; Schwean-Lardner, K.; Classen, H.L. Assessing the performance response of laying hens to intake levels of digestible balanced protein from 27 to 66 wk of age. Can. J. Anim. Sci. 2018, 98, 801–808. [Google Scholar] [CrossRef] [Green Version]
  40. Ji, F.; Fu, S.Y.; Ren, B.; Wu, S.G.; Zhang, H.J.; Yue, H.Y.; Gao, J.; Helmbrecht, A.; Qi, G.H. Evaluation of amino-acid supplemented diets varying in protein levels for laying hens. J. Appl. Poult. Res. 2014, 23, 384–392. [Google Scholar] [CrossRef]
  41. Heald, P.J.; Badman, H.G. Lipid metabolism and the laying hen: I. Plasma-free fatty acids and the onset of laying in the domestic fowl. Biochim. Biophys. Acta (BBA)-Spec. Sect. Lipids Relat. Subj. 1963, 70, 381–388. [Google Scholar] [CrossRef]
  42. Fisher, C.; Gous, R.M. Recent evidence about the protein and amino acid nutrition of broiler breeder hens. In Proceedings of the XXIII World’s Poultry Congress, Brisbane, Australia, 29 June–4 July 2008. [Google Scholar]
  43. Nonis, M.K.; Gous, R.M. Broiler breeders utilise body lipid as an energy source. S. Afr. J. Anim. Sci. 2012, 42, 369–378. [Google Scholar] [CrossRef]
  44. Caldas, J.V.; Hilton, K.; Boonsinchai, N.; England, J.A.; Mauromoustakos, A.; Coon, C.N. Dynamics of nutrient utilization, heat production, and body composition in broiler breeder hens during egg production. Poult. Sci. 2018, 97, 2845–2853. [Google Scholar] [CrossRef]
  45. Liu, N.; Liu, G.H.; Li, F.D.; Sands, J.S.; Zhang, S.; Zheng, A.J.; Ru, Y.J. Efficacy of phytases on egg production and nutrient digestibility in layers fed reduced phosphorus diets. Poult. Sci. 2007, 86, 2337–2342. [Google Scholar] [CrossRef]
  46. Rath, N.C.; Huff, G.R.; Huff, W.E.; Balog, J.M. Factors regulating bone maturity and strength in poultry. Poult. Sci. 2000, 79, 1024–1032. [Google Scholar] [CrossRef]
  47. Sandilands, V. The laying hen and bone fractures. Vet. Rec. 2011, 169, 411–412. [Google Scholar] [CrossRef]
  48. Al-Batshan, H.A.; Scheideler, S.E.; Black, B.L.; Garlich, J.D.; Anderson, K.E. Duodenal calcium uptake, femur ash, and eggshell quality decline with age and increase following molt. Poult. Sci. 1994, 73, 1590–1596. [Google Scholar] [CrossRef] [PubMed]
  49. Gunawardana, P.; Roland, D.A.; Bryant, M.M. Effect of energy and protein on performance, egg components, egg solids, egg quality, and profits in molted hy-line w-36 hens. J. Appl. Poult. Res. 2008, 17, 432–439. [Google Scholar] [CrossRef]
  50. Johnston, S.A.; Gous, R.M. Modelling the changes in the proportions of the egg components during a laying cycle. Br. Poult. Sci. 2007, 48, 347–353. [Google Scholar] [CrossRef]
  51. Gous, R.M.; Nonis, M.K. Modelling egg production and nutrient responses in broiler breeder hens. J. Agric. Sci. 2010, 148, 287–301. [Google Scholar] [CrossRef]
  52. Taborsky, G.; Mok, C.C. Phosvitin: Homogeneity and molecular weight. J. Biol. Chem. 1967, 242, 1495–1501. [Google Scholar] [CrossRef]
  53. Samaraweera, H.; Zhang, W.G.; Lee, E.J.; Ahn, D.U. Egg yolk phosvitin and functional phosphopeptides. J. Food Sci. 2011, 76, 143–150. [Google Scholar] [CrossRef]
  54. Huang, X.; Luo, X.; Liu, L.; Dong, K.; Yang, R.; Lin, C.; Song, H.; Li, S.; Huang, Q. Formation mechanism of egg white protein/κ-Carrageenan composite film and its application to oil packaging. Food Hydrocoll. 2020, 105, 105780. [Google Scholar] [CrossRef]
  55. Tang, S.G.H.; Sieo, C.C.; Kalavathy, R.; Saad, W.Z.; Yong, S.T.; Wong, H.K.; Ho, Y.W. Chemical Compositions of Egg Yolks and Egg Quality of Laying Hens Fed Prebiotic, Probiotic, and Synbiotic Diets. J. Food Sci. 2015, 80, 1686–1695. [Google Scholar] [CrossRef]
  56. Hocking, P.M. Roles of body weight and feed intake in ovarian follicular dynamics in broiler breeders at the onset of lay and after a forced molt. Poult. Sci. 2004, 83, 2044–2050. [Google Scholar] [CrossRef]
Figure 1. Observed and predicted feed intake ((a) ◊, – –) of laying hens from 8 to 102 weeks old and of egg production (b) and egg mass (c) of laying hens from 19 to 102 weeks old in response to age in three dietary balanced protein levels: standard (□, —), low (∆, - -), and high (○, ∙∙∙).
Animals 12 01371 g001
Figure 2. Observed and predicted body weight (a) and body components (ash (b), fat (c), and protein (d)) of laying hens from 8 to 102 weeks old fed three balanced protein feeds: standard (□, —); low (∆, - -) and high (○, ∙∙∙).
Animals 12 01371 g002
Figure 3. Observed and predicted egg weight (a) of laying hens from 19 to 102 weeks old in response to age in three dietary balanced protein levels (standard (□, —); low (∆, - -), and high (○, ∙∙∙)), and egg components (b) yolk (□, —), albumen (∆, - -) and shell (○, ∙∙∙).
Animals 12 01371 g003
Table 1. Composition and nutritional content of experimental feeds in the rearing phase.
Composition (%)Grower (8–11 Weeks)Developer (12–15 Weeks)Pre-Layer (16–18 Weeks)
StandardLowHighStandardLowHighStandardLowHigh
Corn (8.8%)62.268.056.358.263.053.455.561.049.9
Soybean meal (45%)23.315.031.616.910.023.817.110.024.2
Wheat bran10.113.07.1017.520.015.017.020.014.0
Potassium carbonate0.1200.240-0.1050.210-0.1430.2800.005
Corn gluten (60%)---1.501.501.501.00-2.00
Meat and Bone Meal 48%---2.662.662.663.422.973.87
Soybean oil0.8250.1501.500.9350.3701.501.050.6851.42
Dicalcium phosphate1.181.171.200.1500.1400.1610.1050.210-
Limestone1.391.461.321.321.381.263.873.983.75
Salt0.3530.2870.4200.2600.2150.3060.2360.2150.256
Sodium Bicarbonate0.1000.200-0.1330.2000.0650.1540.1980.110
Vitamin and Mineral Premix 10.2000.2000.2000.2000.2000.2000.2000.2000.200
DL-Methionine (99%)0.1080.0550.1610.057-0.1140.0780.0450.111
L-Lysine HCl (78%)0.0620.1000.0240.0190.038-0.0610.0950.027
L-Threonine (98.5%)0.015-0.031------
Choline chloride (60%)0.1000.1000.1000.1000.1000.1000.1000.1000.100
Total100100100100100100100100100
---------- Calculated nutritional content (%) ----------
Met. energy (kcal/kg) 2288128832880286028602860277827782778
Crude protein 317.114.320.017.114.719.517.013.920.2
Crude fibre 33.223.283.304.324.153.754.423.964.33
Starch 345.946.843.040.243.141.538.943.337.8
Digestible Lysine0.8030.6450.9600.7000.5600.8400.7420.5930.890
Digestible Methionine + cysteine0.5920.4760.7090.5440.4340.6530.5520.4420.662
Digestible Threonine0.5890.4750.7030.5530.4710.6350.5460.4410.652
Digestible Tryptophan0.1870.1480.2260.1710.1390.2030.1690.1330.206
Digestible Isoleucine0.6280.4960.7600.5890.4800.6980.5810.4440.719
Digestible Valine0.6980.5680.8270.6800.5730.7870.6720.5320.812
total Calcium1.041.041.041.051.051.052.082.082.08
Available Phosphorus0.4600.4600.4600.4300.4300.4300.4570.4570.457
Sodium0.1800.1800.1800.1700.1700.1700.1700.1700.170
1 Content/kg of feed: Vit. A 9700 IU, Vit. D3 2700 UI, Vit. E 17 UI, Vit. K3 2.79 mg, Vit. B1 2.00 mg, Vit. B2 5.50 mg, Pantothenic acid 10.6 mg, Vit. B6 3.05 mg, Vit. B12 15.0 mcg, Niacin 0.039 g, Folic acid 1.00 mg, Biotin 0.0083 mg, Choline chloride 0.150 g, Iron 0.044 g, Copper 9.00 mg, Manganese 0.050 g, Zinc 0.050 g, iodine 1.00 mg, selenium 0.250 mg, Phytase 600 FYT. 2 Nitrogen-corrected apparent metabolizable energy. 3 Values represent the mean analysed composition by near-infrared spectroscopy (NIR).
Table 2. Composition and nutritional content of experimental feeds in the laying phase.
Composition (%)Layer 1 (19–26 Weeks)Layer 2 (27–46 Weeks)Layer 3 (47–66 Weeks)Layer 4 (67–82 Weeks)Layer 5 (83–102 Weeks)
StandardLowHighStandardLowHighStandardLowHighStandardLowHighStandardLowHigh
Corn (8.8%)59.065.053.061.167.055.361.967.556.263.368.558.063.468.758.1
Soybean meal (45%)16.110.122.018.413.023.916.911.622.316.611.721.416.111.920.2
Wheat bran3.756.001.492.354.70-2.505.00-2.505.00-2.505.00-
Potassium carbonate0.4500.5600.3400.3860.4700.3020.4250.5250.3250.4080.5000.3150.4250.5100.340
Corn gluten (60%)7.505.0010.05.432.558.305.762.958.565.011.958.074.541.107.98
Soybean oil1.070.8901.250.7250.6100.8400.6800.5700.7900.5660.5800.5520.6700.6600.680
Dicalcium phosphate1.311.301.321.161.141.171.111.091.141.111.091.141.010.981.04
Limestone9.119.179.069.469.519.419.779.829.729.779.829.7210.410.410.3
Salt0.3070.2790.3360.3230.2900.3560.2920.2750.3100.2700.2600.2800.2750.2800.270
Sodium Bicarbonate0.1550.2000.1100.1320.1830.0800.1390.1680.1100.1740.1900.1570.1660.1600.172
Vitamin and Mineral Premix 10.2000.2000.2000.2000.2000.2000.2000.2000.2000.2000.2000.2000.2000.2000.200
DL-Methionine (99%)0.0660.0410.0900.0650.0470.0820.0520.0360.0680.0480.0380.0590.0440.0380.050
L-Lysine HCl (78%)0.0990.1190.0780.0150.029-0.0190.038-0.0110.022----
Choline chloride (60%)0.1000.1000.1000.1000.1000.1000.1000.1000.1000.1000.1000.1000.1000.1000.100
Inert 20.8221.0230.6210.0750.150-0.1650.1590.1710.0260.052-0.248-0.495
Total100100100100100100100100100100100100100100100
---------- Calculated nutritional content (%) ----------
AMEn (kcal/kg) 3279527952795278527852785278527852785278527852785277027702770
Crude protein 418.115.621.417.014.620.616.113.320.216.011.718.714.811.418.7
Crude Fibre 43.683.973.923.663.673.913.653.813.93.573.183.693.463.493.50
Starch 440.041.339.339.741.337.341.342.437.440.943.439.043.043.240.7
Digestible Lysine0.6800.5440.8160.6550.5240.7860.6250.5000.7500.6050.4840.7260.5800.4640.696
Digestible Methionine + Cystine0.6000.4800.7200.5800.4640.6960.5600.4480.6720.5400.4320.6480.5200.4160.624
Digestible Threonine0.5710.4590.6830.5700.4590.6810.5550.4460.6640.5400.4330.6470.5240.4200.627
Digestible Tryptophan0.1570.1230.1920.1630.1310.1960.1560.1240.1880.1530.1230.1830.1480.1210.176
Digestible Isoleucine0.6330.4860.7810.6300.4840.7760.6120.4680.7550.5900.4500.7310.5700.4340.707
Digestible Valine0.7160.5630.8690.7060.5530.8590.6890.5390.8390.6660.5180.8130.6440.4990.789
total Calcium3.953.953.954.054.054.054.154.154.154.154.154.154.354.354.35
Available Phosphorus0.4400.4400.4400.4100.4100.4100.4000.4000.4000.4000.4000.4000.3800.3800.380
Sodium0.1750.1750.1750.1750.1750.1750.1650.1650.1650.1650.1650.1650.1650.1650.165
1 Content/kg of feed: Vit. A 9700 Ul, Vit. D3 2700 Ul, Vit. E 15.8 Ul, Vit. K3 2.39 mg, Vit. B1 2.40 mg, Vit. B2 6.00 mg, Pantothenic acid 8.65 mg, Vit. B6 3.04 mg, Vit. B12 15.4 mcg, Niacin 0.032 g, Folic acid 1.00 mg, Biotin 0.083 mg, Choline chloride 0.187 g, Iron 0.044 g, Copper 9.00 mg, Manganese 0.050 g, Zinc 0.050 g, iodine 1.00 mg, selenium 0.250 mg, Phytase 600 FYT. 2 Inert—Washed sand. 3 Nitrogen-corrected apparent metabolizable energy. 4 Values represent the mean analysed composition by near-infrared spectroscopy (NIR).
Table 3. Cumulative feed intake and hen-housed egg production (± standard deviation) of laying hens from 8 to 102 weeks old in response to age in three dietary balanced protein levels.
Treatments 1Cumulative Feed Intake, kg/BirdHen Housed Egg Production 2, und
8 to 18 Weeks8 to 102 Weeks
S4.44 ± 17067.2 ± 1.82516 ± 15 a
L4.45 ± 13167.4 ± 2.88485 ± 24 b
H4.43 ± 15168.4 ± 1.72529 ± 22 a
p-value0.9860.4850.001
1 S—standard, formulated to meet the nutritional recommendation of Lohmann-LSL guideline; L—20% reduction of balanced protein from S; and H—20% increase of balanced protein from S; 2 Distinct letter in the same column is significantly different by Tukey’s.
Table 4. Performance of laying hens from 8 to 102 weeks old in response to three dietary balanced protein feeds.
Age,Feed Intake, g/Bird/DayEgg Production, %Egg Mass, g
WeeksS 1L 2H 3SEM 4p-ValueSLHSEMp-ValueSLHSEMp-Value
1156.055.853.51.160.3930----------
1556.456.956.81.390.9740----------
1861.661.863.41.610.7450----------
2279.275.980.21.260.109036.627.045.71.51<0.000117.413.120.90.927<0.0001
2697.595.61021.210.006094.391.996.81.410.032052.849.755.60.9270.0010
301041021030.940.787096.790.497.51.32<0.000156.851.458.40.927<0.0001
341091051091.200.157097.392.697.41.320.010058.654.3600.9940.0010
381091101101.250.714097.394.498.01.320.099060.656.761.90.9270.0020
421071061101.080.185097.794.698.01.320.114060.656.961.30.9270.0060
461081091080.780.666097.393.896.91.320.113060.456.161.40.9270.0010
501091101101.090.891096.591.995.81.410.024060.855.760.60.9270.0010
541091101110.860.486097.192.897.31.410.022061.657.261.60.9270.0040
581081101100.920.550095.891.794.91.510.066060.656.360.70.9950.0040
621111131131.070.669092.288.792.21.410.079059.556.160.10.9940.0190
661121151151.040.259095.895.194.91.320.865063.061.462.90.9270.4860
701131151150.9000.498095.493.494.71.510.567061.958.762.00.9950.0460
741131131151.280.594095.192.194.81.510.216062.356.862.50.927<0.0001
781091091111.040.572093.389.595.41.510.007061.155.062.50.927<0.0001
821011031031.650.718091.886.490.91.410.007060.153.559.10.927<0.0001
861071061101.290.176086.482.589.31.510.002056.149.559.10.994<0.0001
901091081071.460.682087.479.692.61.61<0.000157.449.461.30.994<0.0001
941071091071.730.623084.581.389.91.41<0.000155.449.960.20.994<0.0001
981091141111.970.215083.282.787.71.610.019054.951.757.10.9940.0020
1021091111101.900.785079.981.085.01.410.016052.750.756.10.9950.0020
Main effects
Age <0.0001 <0.0001 <0.0001
Balanced Protein 0.7210 <0.0001 <0.0001
Interaction 0.0070 <0.0001 <0.0001
1 S—standard, formulated to meet the nutritional recommendation of Lohmann-LSL guideline; 2 L is low, formulated with 20% reduction of balanced protein from S; 3 H is high, formulated with 20% increase of balanced protein from S; 4 Standard error of the mean.
Table 5. Coefficients from an exponential equation for feed intake of laying hens from 8 to 102 weeks old and coefficients from a linear plus exponential equation for egg production and egg Mass of laying hens from 19 to 102 weeks old in response to age in three dietary balanced protein levels.
ParametersFeed Intake, g/Bird/DayEgg Production, %Egg Mass, g
S 1L 2H 3SLH
A111.4108.0102.0104.065.3061.4063.10
B−163.1−5,150,000−51,900,000−272,000,000−63,700−77,000−489,000
C-−0.2280−0.1940−0.1510−0.0870−0.0980−0.0380
R0.92100.59900.54100.49600.72000.71400.6530
SEM 46.0402.9202.960
R2 588.8095.0091.00
1 S—standard, formulated to meet the nutritional recommendation of Lohmann-LSL guideline; 2 L is low, formulated with 20% reduction of balanced protein from S; 3 H is high, formulated with 20% increase of balanced protein from S; 4 Standard error of the mean; 5 Coefficient of determination.
Table 6. Body weight and body lipid of laying hens from 8 to 102 weeks old in response to three dietary balanced protein feeds.
Age,Body Weight, gLipid, g
WeeksS 1L 2H 3SEM 4p-ValueSLHSEMp-Value
85185305278.230.982038.441.141.81.660.8587
1189489992613.20.860880.381.687.72.250.9586
1510101046103826.10.831294.61021014.590.9544
1811521148122928.90.26921161191395.630.5461
2213701366147138.50.193514615416311.20.7326
2613981384150446.90.113917618621519.80.3234
3014221374153349.80.034916715919815.80.1676
3414771412156452.50.051418117421716.50.0970
3814791449161646.90.018617018423411.90.0151
4214851466164147.00.009218418223215.40.0351
4615141485165745.20.014119119824315.70.0402
5015071480168146.90.002620519526814.50.0025
5415231472168952.20.001119219526816.30.0014
5815481470169543.70.001420818023816.10.0312
6214841445167952.70.001218317524317.80.0119
6615501479172458.50.000419718226317.80.0006
7014601454170349.20.000119617628620.2<0.0001
7414671454174347.3<0.000118618228017.6<0.0001
7814831441174044.0<0.000121316928118.6<0.0001
8214621397169641.5<0.000118016225615.3<0.0001
8614631373173340.4<0.000119414125016.8<0.0001
9014521357171432.2<0.000118416323319.20.0553
9414771374167248.2<0.000117213721214.20.0061
9815011398167544.60.000217213921412.70.0079
10213441341168937.1<0.000114913722914.50.0051
Main effects
Age <0.0001 <0.0001
Balanced Protein 0.0032 0.0147
Interaction <0.0001 <0.0001
1 S—standard, formulated to meet the nutritional recommendation of Lohmann-LSL guideline; 2 L is low, formulated with 20% reduction of balanced protein from S; 3 H is high, formulated with 20% increase of balanced protein from S; 4 Standard error of the mean.
Table 7. Body protein and ash of laying hens from 8 to 102 weeks old in response to three dietary balanced protein feeds.
Age,Protein, gAsh, g
WeeksS 1L 2H 3SEM 4p-ValueSLHSEMp-Value
873.073.274.01.520.917118.318.918.00.4010.8248
111321311401.930.679029.628.630.30.5940.6182
151531541593.870.818833.933.434.33.890.8631
181781731895.080.401739.337.140.20.6000.1094
222182142277.770.504945.445.747.212.10.5528
262142062236.500.203245.245.747.29.230.4427
302202122377.070.016847.145.447.711.90.3555
342262152356.380.065146.345.447.712.80.3993
382312232456.610.054846.146.749.45.000.1220
422342262526.340.008647.147.149.79.320.1954
462412232506.290.009648.747.450.64.630.1569
502242242546.720.000646.547.751.312.90.0130
542272202486.010.003147.247.351.311.90.0137
582432272625.570.000447.847.251.34.970.0331
622362322597.020.007046.847.350.613.50.0499
662422292597.740.007748.747.752.413.80.0139
702352252427.140.220147.749.250.212.70.5501
742292202566.670.000246.849.652.412.80.0321
782232232536.170.001647.950.052.314.40.0478
822262212536.230.001748.347.852.74.860.0121
862332132615.68<0.000150.748.953.610.90.0431
902412282629.900.087048.151.954.515.40.0072
942352162606.76<0.000149.550.553.913.80.0697
982302222605.210.000451.150.553.210.20.3497
1022192132667.01<0.000148.348.754.75.810.0018
Main effects
Age <0.0001 <0.0001
Balanced Protein 0.0100 0.0704
Interaction <0.0001 0.0072
1 S—standard, formulated to meet the nutritional recommendation of Lohmann-LSL guideline; 2 L is low, formulated with 20% reduction of balanced protein from S; 3 H is high, formulated with 20% increase of balanced protein from S; 4 Standard error of the mean.
Table 8. Coefficients from linear plus exponential equation for body weight and body composition of laying hens from 8 to 102 weeks old in response to age in three dietary balanced protein levels.
ParametersBody Weight, gAsh, gFat, gProtein, g
S 1L 2H 3SLHSLHSLH
A16381631171246.3546.3547.60345.9280.0816.0240.8234.0247.0
B−2019−1949−2176−68.20−68.20−71.57−382.6−338.8−839.0−347.6−326.0−353.7
C−1.754−2.569−0.09160.03300.03300.0641−1.648−1.367−4.780−0.0775−0.13030.1343
R0.91640.88390.96370.94680.98090.9028
SEM 478.302.67036.7015.50
R2 591.9089.5067.7087.70
1 S—standard, formulated to meet the nutritional recommendation of Lohmann-LSL guideline; 2 L is low, formulated with 20% reduction of balanced protein from S; 3 H is high, formulated with 20% increase of balanced protein from S; 4 Standard error of the mean; 5 Coefficient of determination.
Table 9. Egg weight and egg components of laying hens from 19 to 102 weeks old in response to three dietary balanced protein feeds.
Age,Egg Weight, gYolk, %
WeeksS 1L 2H 3SEM 4p-ValueSLHSEMp-Value
2251.251.351.90.5900.792021.620.921.50.2800.2160
2657.955.559.40.5900.001024.023.924.30.2300.5230
3059.358.560.40.5900.171025.124.525.30.2000.0320
3461.159.761.70.5900.137025.625.525.40.1800.8880
3861.960.662.20.5900.264026.226.226.30.2200.9790
4262.461.463.60.5900.113026.526.026.70.2300.1380
4662.260.263.40.5900.008027.126.526.90.2000.1570
5063.460.363.70.5900.001027.427.027.00.2200.3500
5463.862.664.70.5900.121027.426.927.10.2100.2960
5863.162.164.20.5900.109027.326.627.00.2000.0950
6265.664.465.30.5900.456027.326.927.50.2500.3580
6666.664.966.20.5900.239027.627.227.80.2600.2260
7065.963.066.50.5900.001027.626.427.80.3200.0050
7466.462.466.10.590<0.000127.327.227.80.2100.2200
7866.262.067.50.590<0.000127.026.627.40.2200.0830
8265.761.965.50.6300.000027.127.127.70.2300.1250
8665.561.666.10.590<0.000127.527.127.70.2500.2540
9066.961.367.60.590<0.000127.026.127.50.3300.0200
9466.961.465.60.630<0.000126.726.227.10.2600.0910
9866.962.166.80.590<0.000126.826.327.10.2600.1400
10265.863.966.20.5900.062027.126.727.60.3100.1360
Main effects
Age <0.0001 <0.0001
Balanced Protein 0.0010 0.0600
Interaction <0.0001 0.0590
1 S—standard, formulated to meet the nutritional recommendation of Lohmann-LSL guideline; 2 L is low, formulated with 20% reduction of balanced protein from S; 3 H is high, formulated with 20% increase of balanced protein from S; 4 Standard error of the mean.
Table 10. Egg components of laying hens from 19 to 102 weeks old in response to three dietary balanced protein feeds.
Age,Albumen, %Shell, %
WeeksS 1L 2H 3SEM 4p-ValueSLHSEMp-Value
2267.268.167.20.3200.128011.211.011.30.1000.2160
2665.665.665.20.2800.566010.510.510.50.1000.9710
3064.565.464.60.2200.025010.410.110.10.1000.0780
3464.164.364.40.2000.604010.310.210.20.1000.3500
3863.663.563.50.2200.989010.210.310.20.1000.6580
4263.664.163.60.2500.41509.919.929.670.1000.0630
4663.063.563.30.2200.36209.9410.19.870.1000.1510
5063.063.363.40.2300.60309.599.739.580.1000.3610
5462.863.463.30.2300.26909.749.719.640.1000.6010
5863.163.863.40.2100.11609.639.659.650.1000.9820
6263.263.763.10.2700.24909.549.369.460.1000.5010
6662.963.462.60.3100.28809.469.499.540.1000.8390
7063.063.862.70.3700.12409.419.459.490.1000.8170
7463.463.463.00.2300.42009.289.439.260.1000.4160
7863.764.163.50.2500.28909.329.289.080.1000.2300
8263.863.763.10.2400.15609.139.219.150.1000.8210
8663.563.863.30.2600.31309.069.109.090.1000.9700
9064.164.763.50.3100.04008.999.29.060.1000.3330
9464.564.763.90.3100.19808.819.159.050.1000.0980
9864.565.264.10.3400.07908.728.818.850.1000.7340
10264.164.563.50.3700.20208.798.768.790.1100.9800
Main effects
Age <0.0001 <0.0001
Balanced Protein 0.1010 0.8480
Interaction 0.0970 0.1690
1 S—standard, formulated to meet the nutritional recommendation of Lohmann-LSL guideline; 2 L is low, formulated with 20% reduction of balanced protein from S; 3 H is high, formulated with 20% increase of balanced protein from S; 4 Standard error of the mean.
Table 11. Coefficients for the exponential equation for egg weight and egg components of laying hens from 19 to 102 weeks old in response to age for three dietary balanced protein levels.
ParametersEgg Weight, gYolk, %Albumen, %Shell, %
S 1L 2H 3SLHSLHSLH
A166.6062.5066.4027.1063.68.23
B1−45.60−115.0−56.20−81.10234.03.72
R0.94500.89900.93400.88600.83000.9830
SEM 41.8400.65400.76500.2030
R2 572.0072.2043.5086.50
1 S—standard, formulated to meet the nutritional recommendation of Lohmann-LSL guideline; 2 L is low, formulated with 20% reduction of balanced protein from S; 3 H is high, formulated with 20% increase of balanced protein from S; 4 Standard error of the mean; 5 Coefficient of determination.
Publisher’s Note: MDPI stays neutral with regard to jurisdictional claims in published maps and institutional affiliations.

