
Metabolomic Analysis Reveals That the Moor Frog Rana arvalis Uses Both Glucose and Glycerol as Cryoprotectants

 ,
,  , ,
, ,
Abstract
:Simple Summary
Abstract
1. Introduction
2. Materials and Methods
2.1. Animals
2.2. NMR Measurements
3. Results
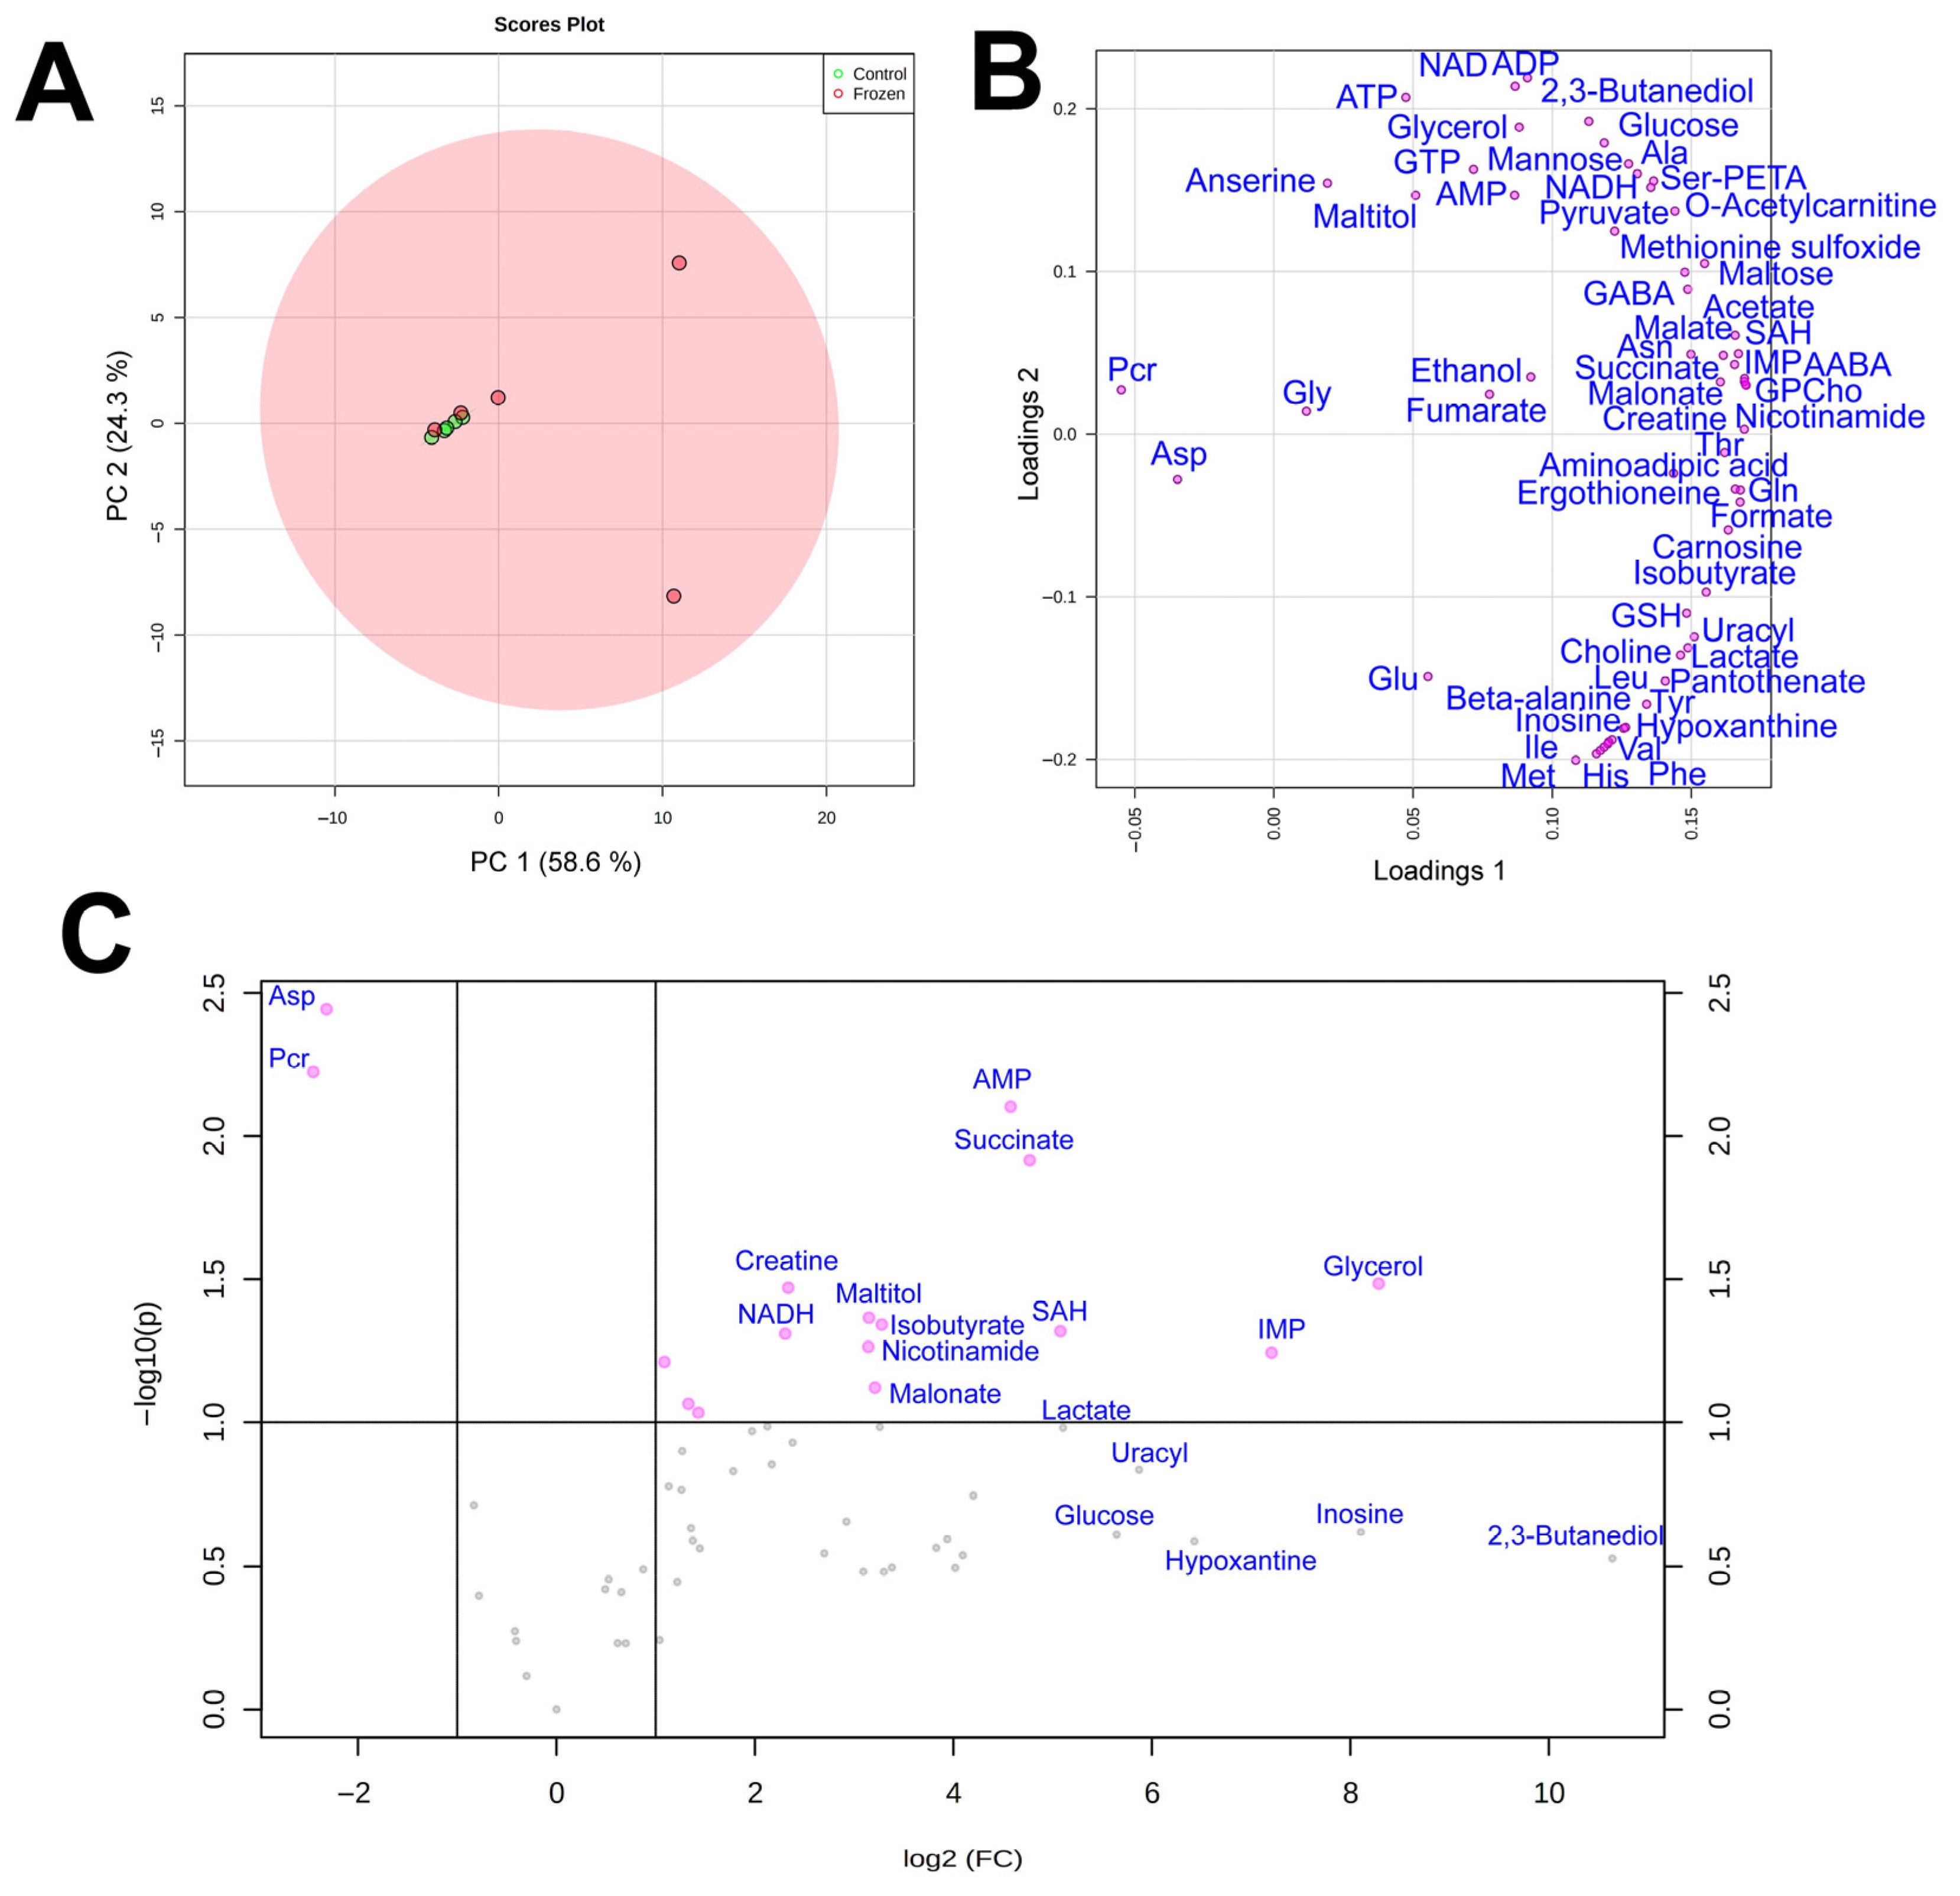
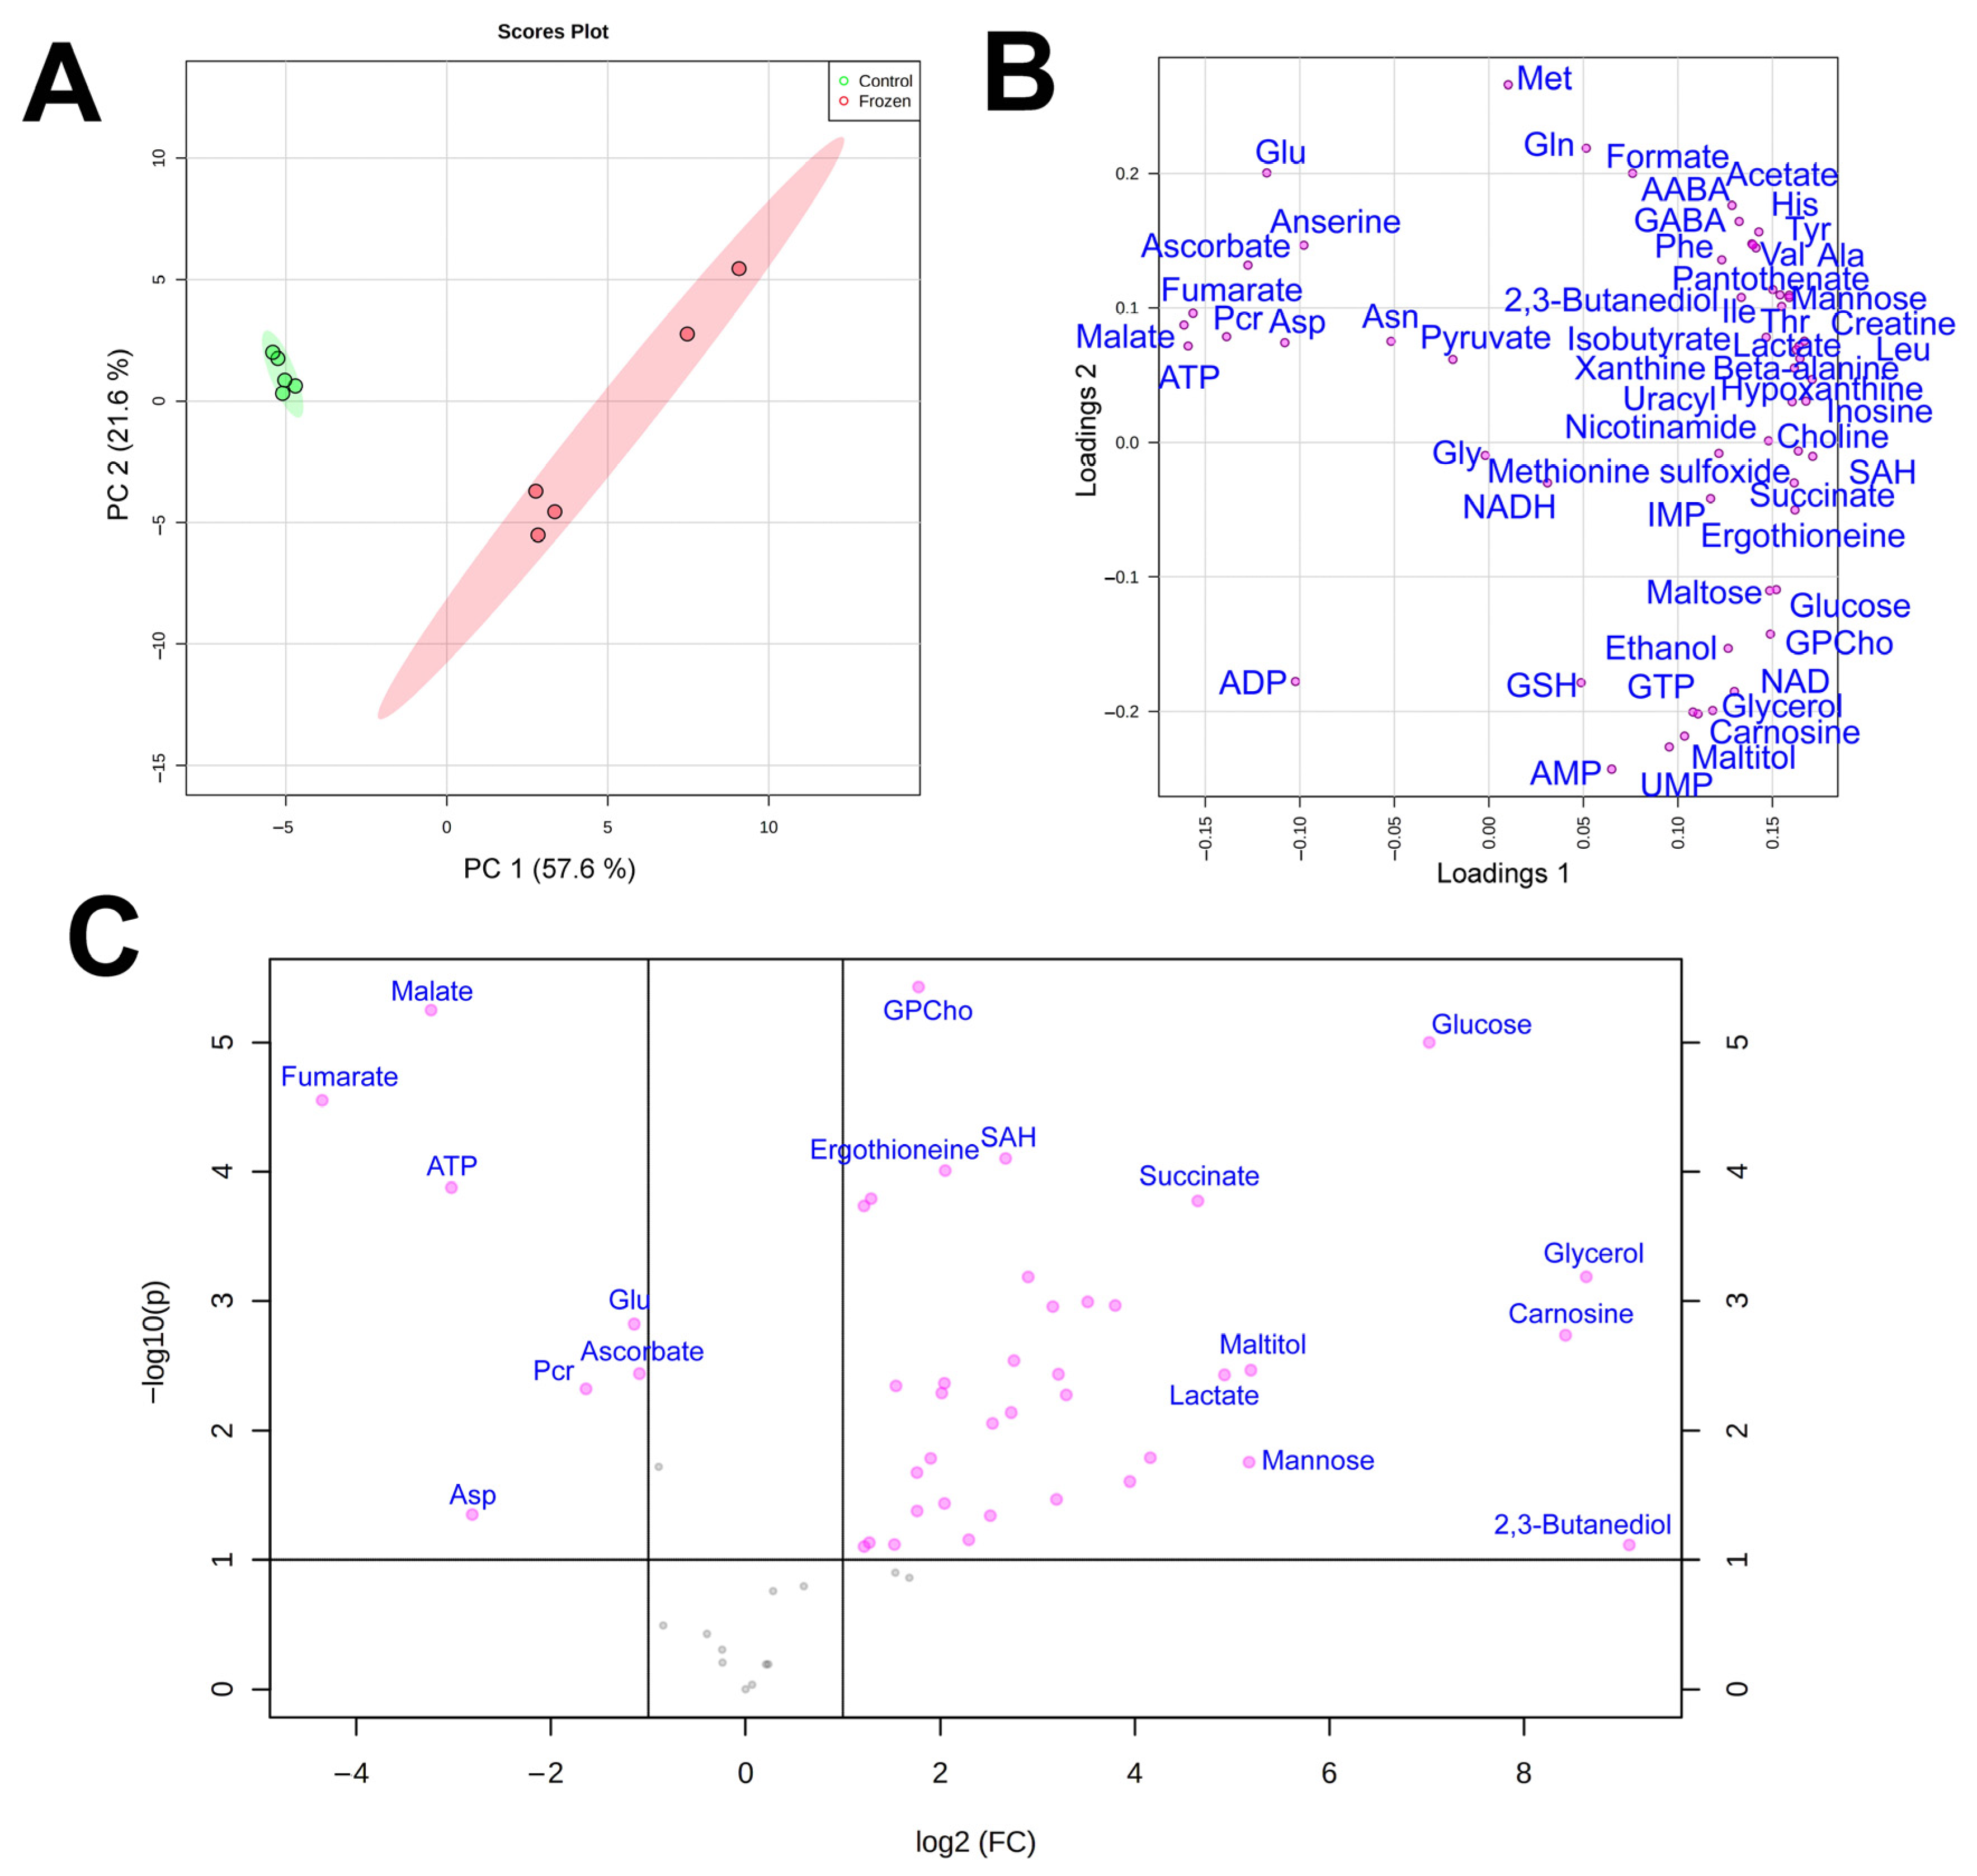
3.1. NMR Analysis
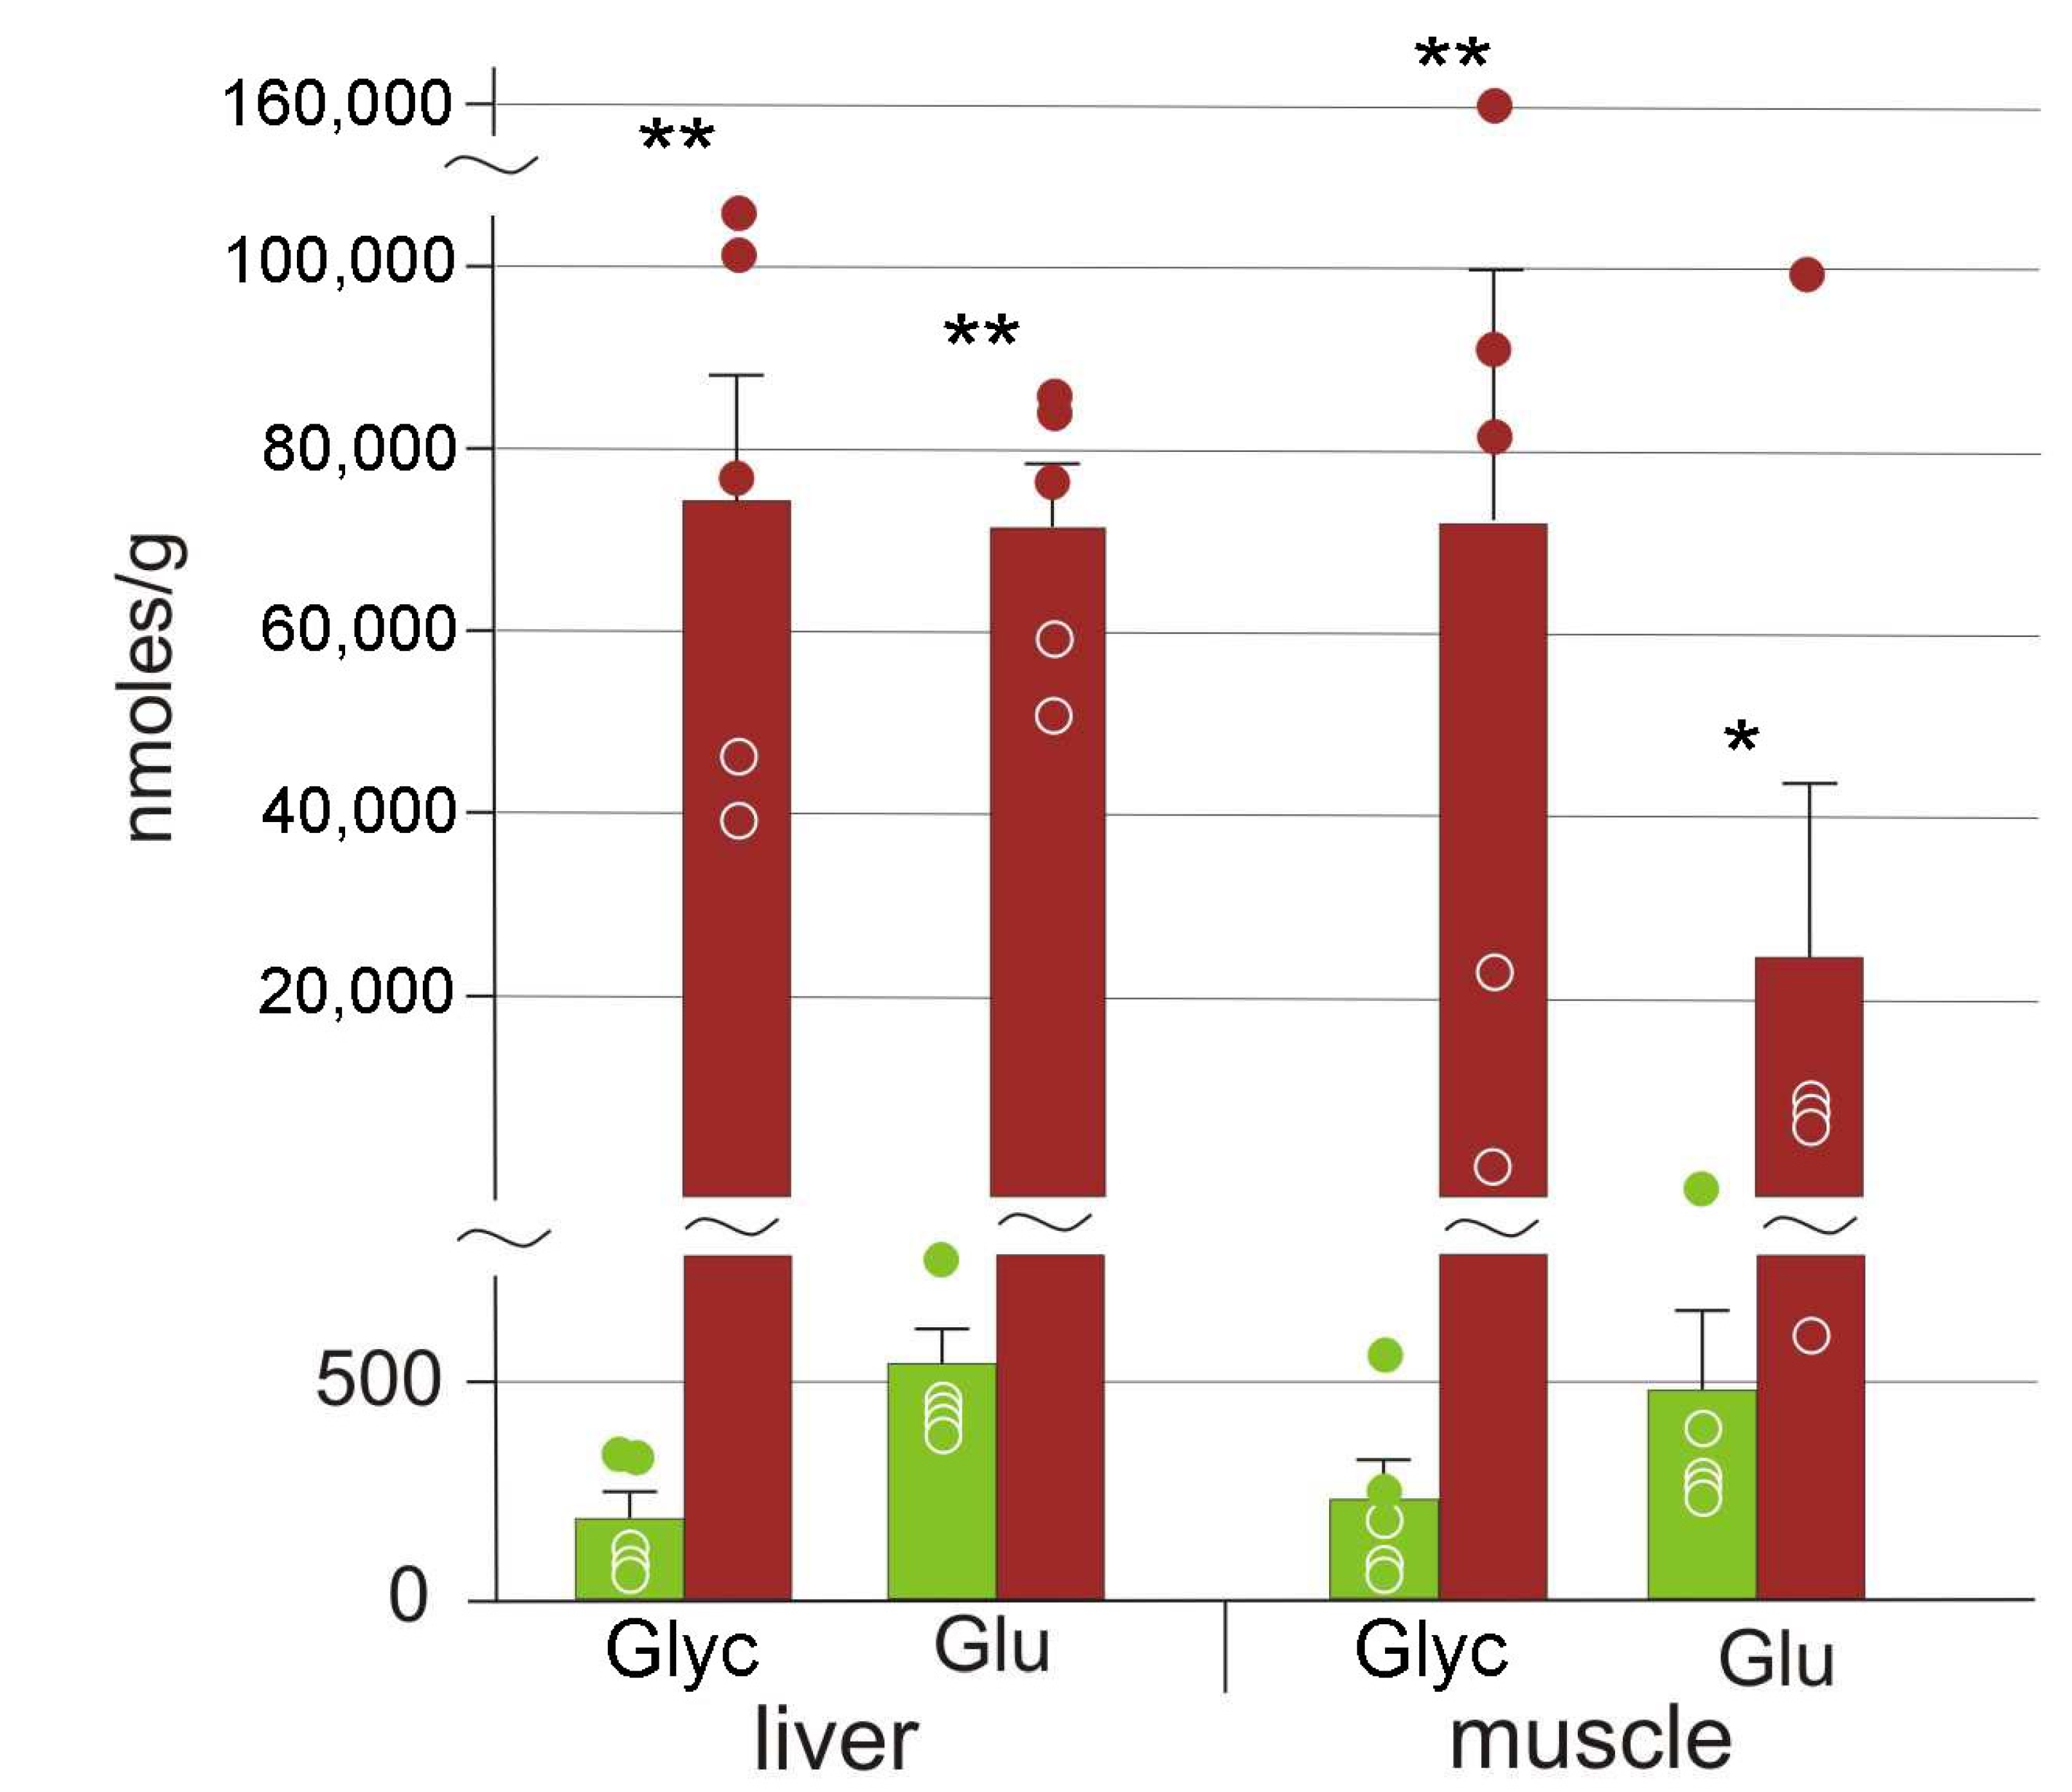
3.2. Cryoprotectants
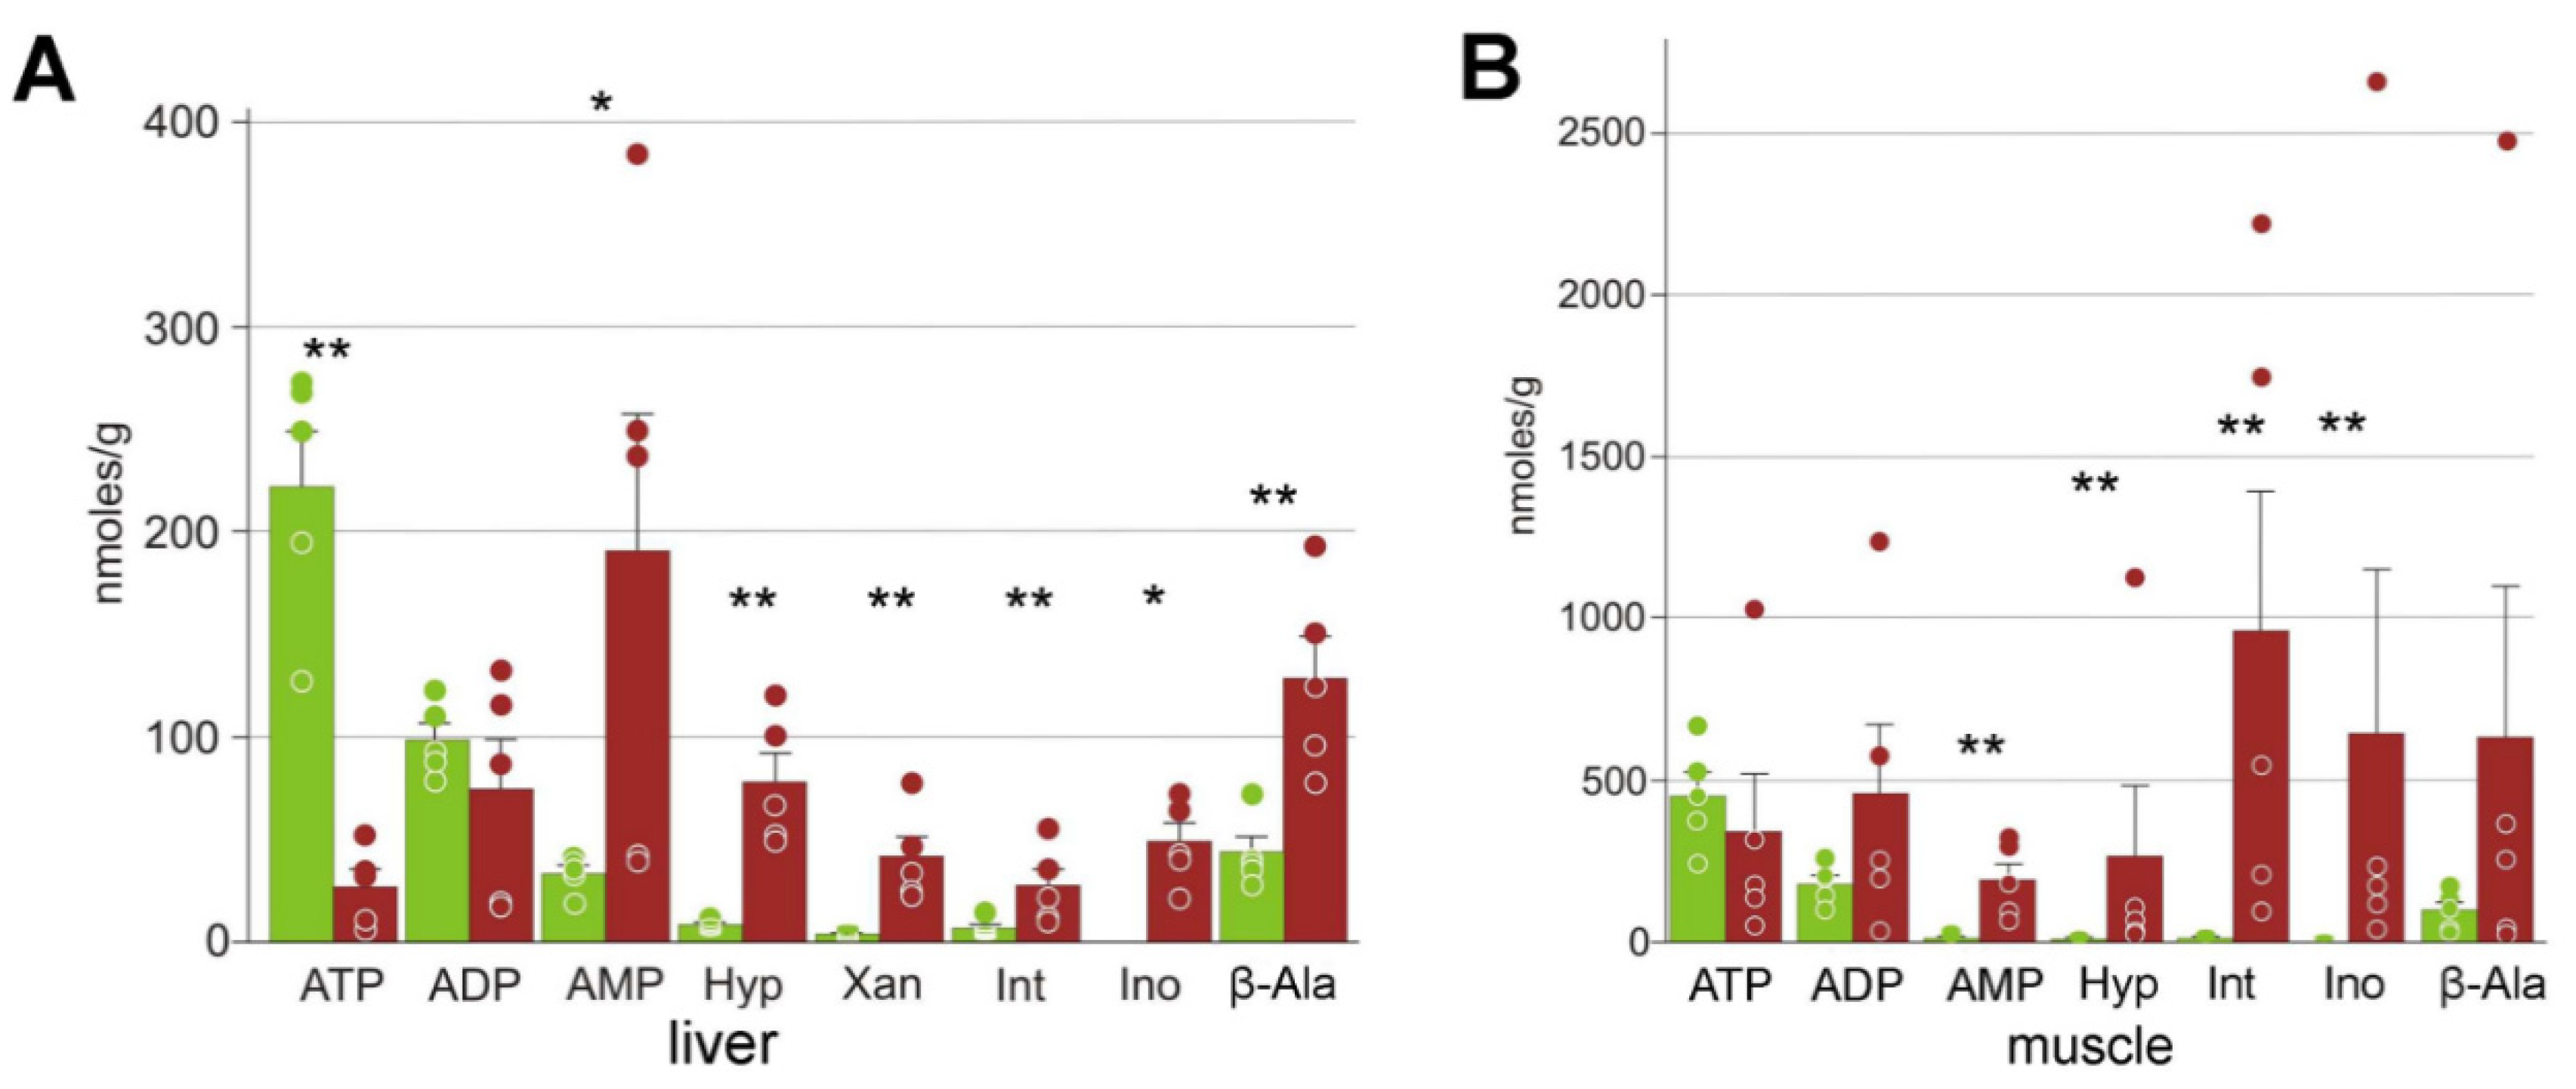
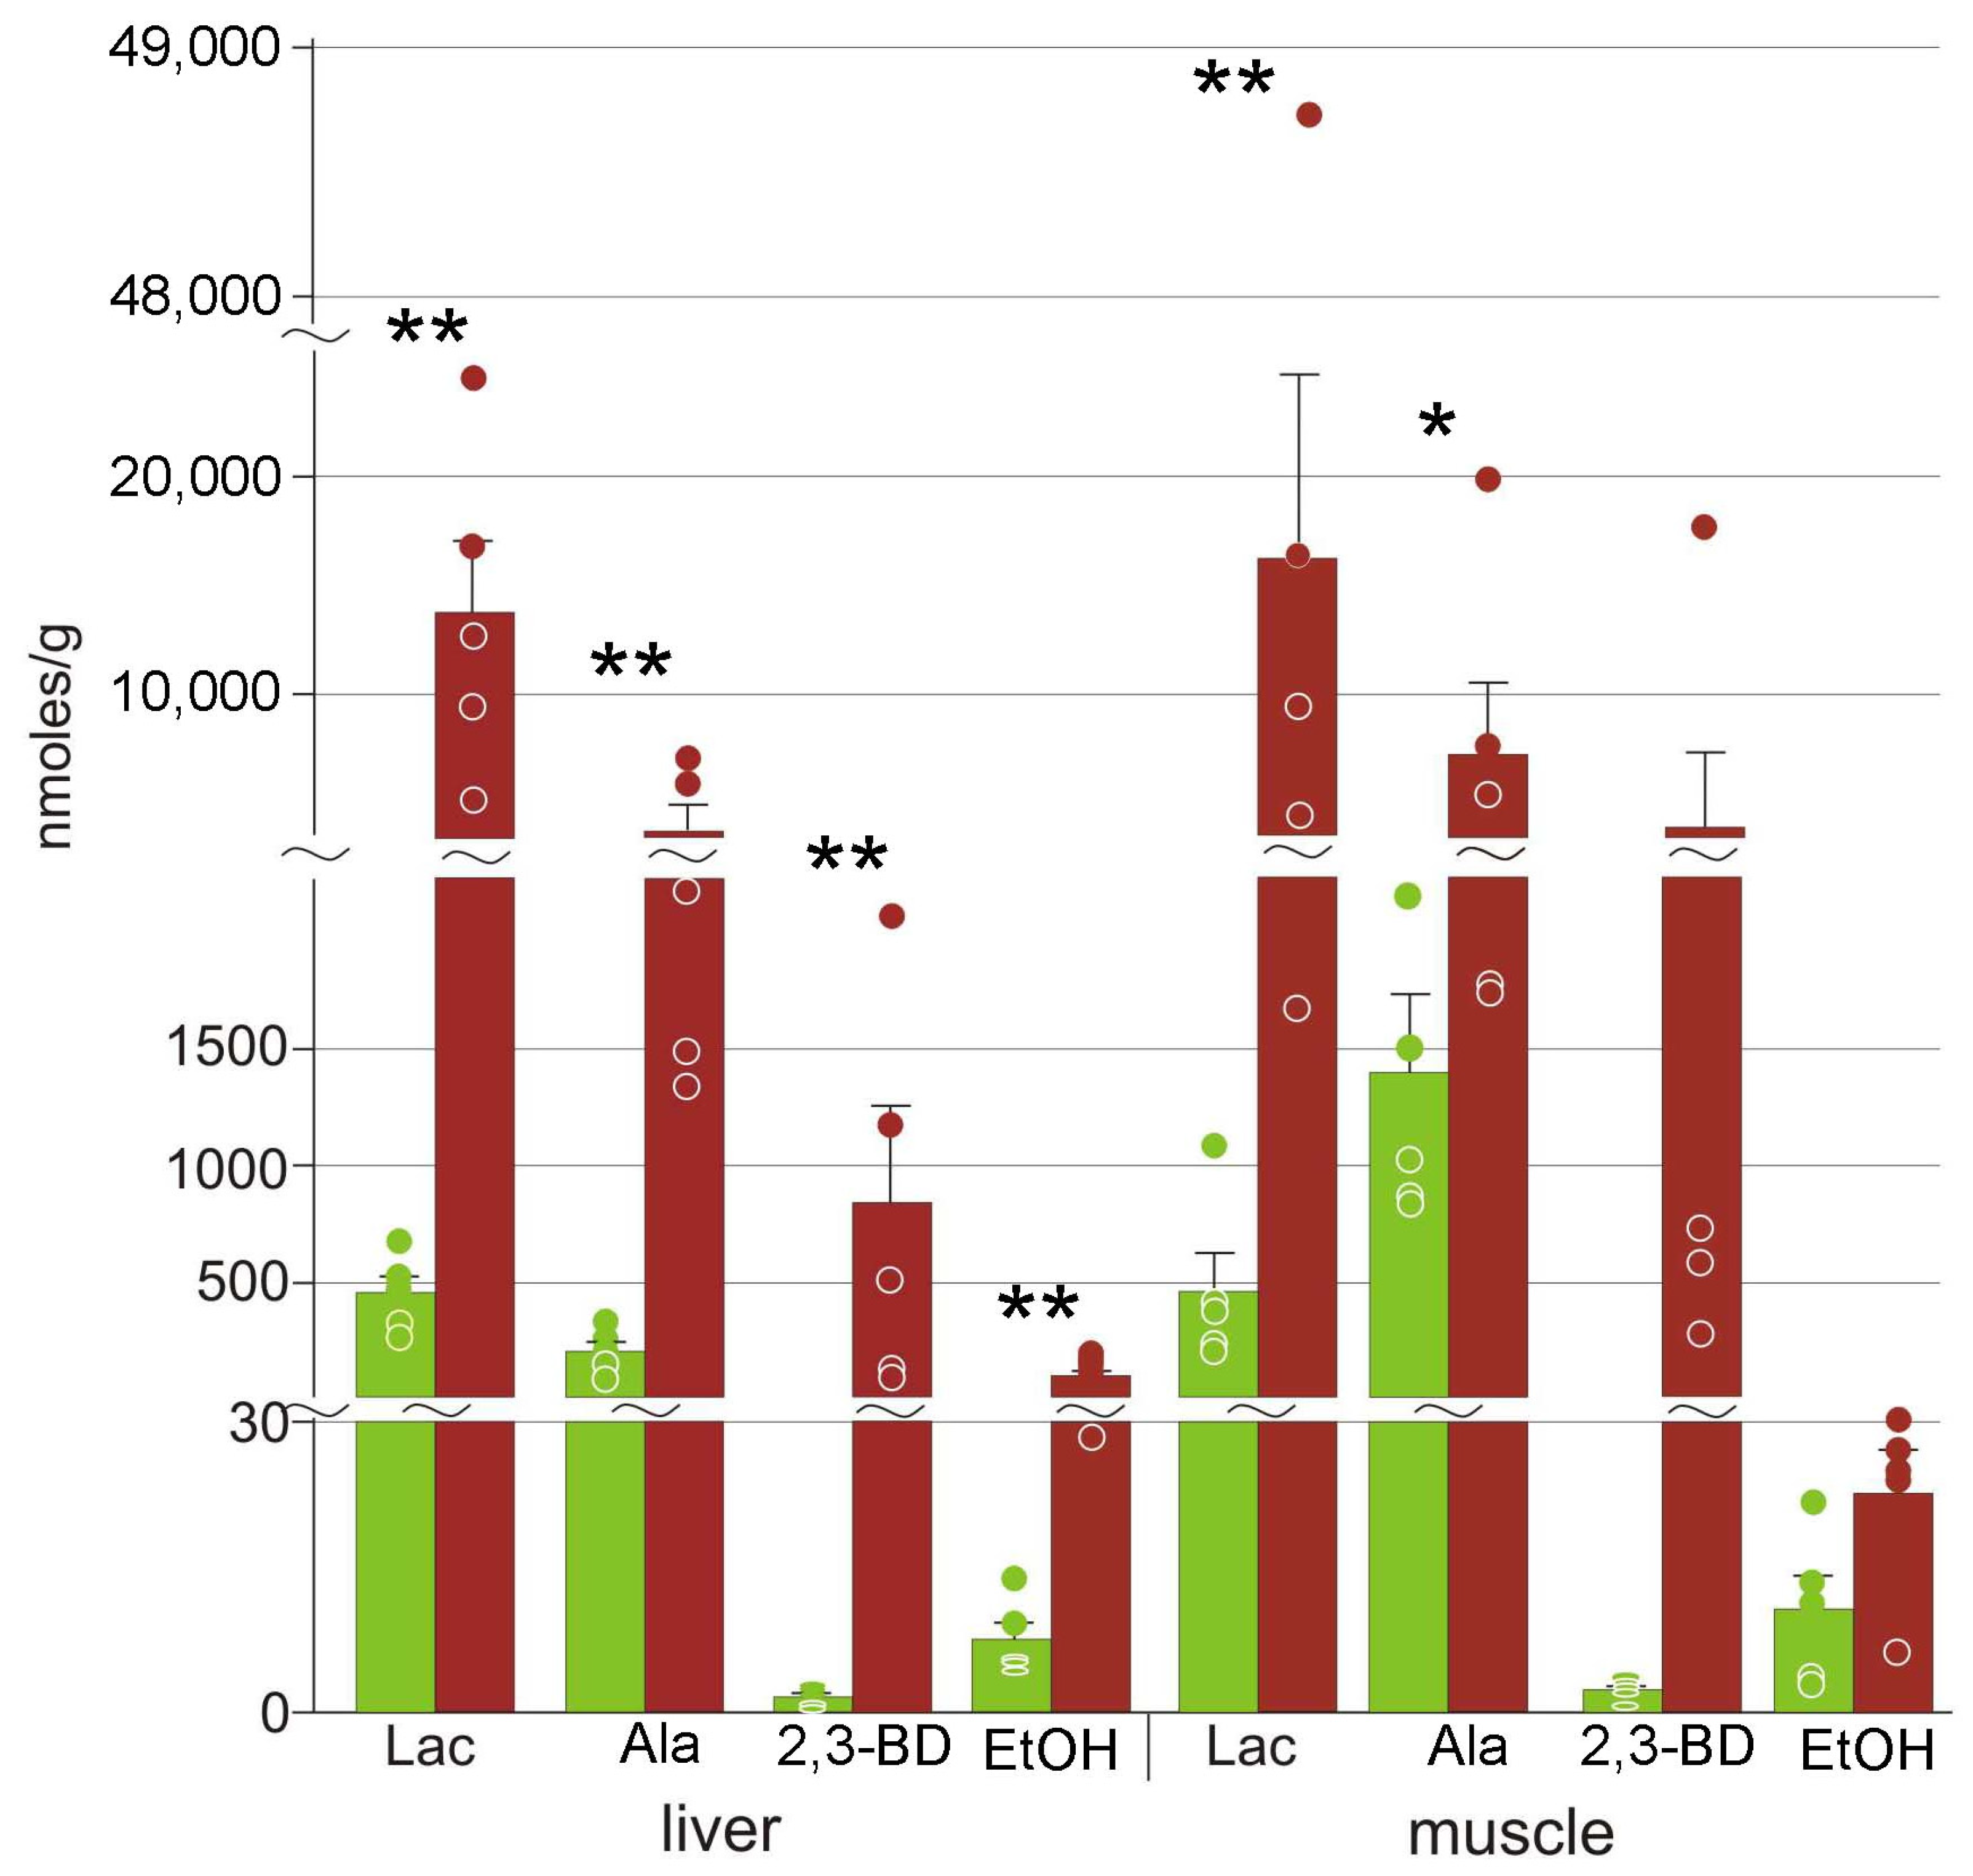
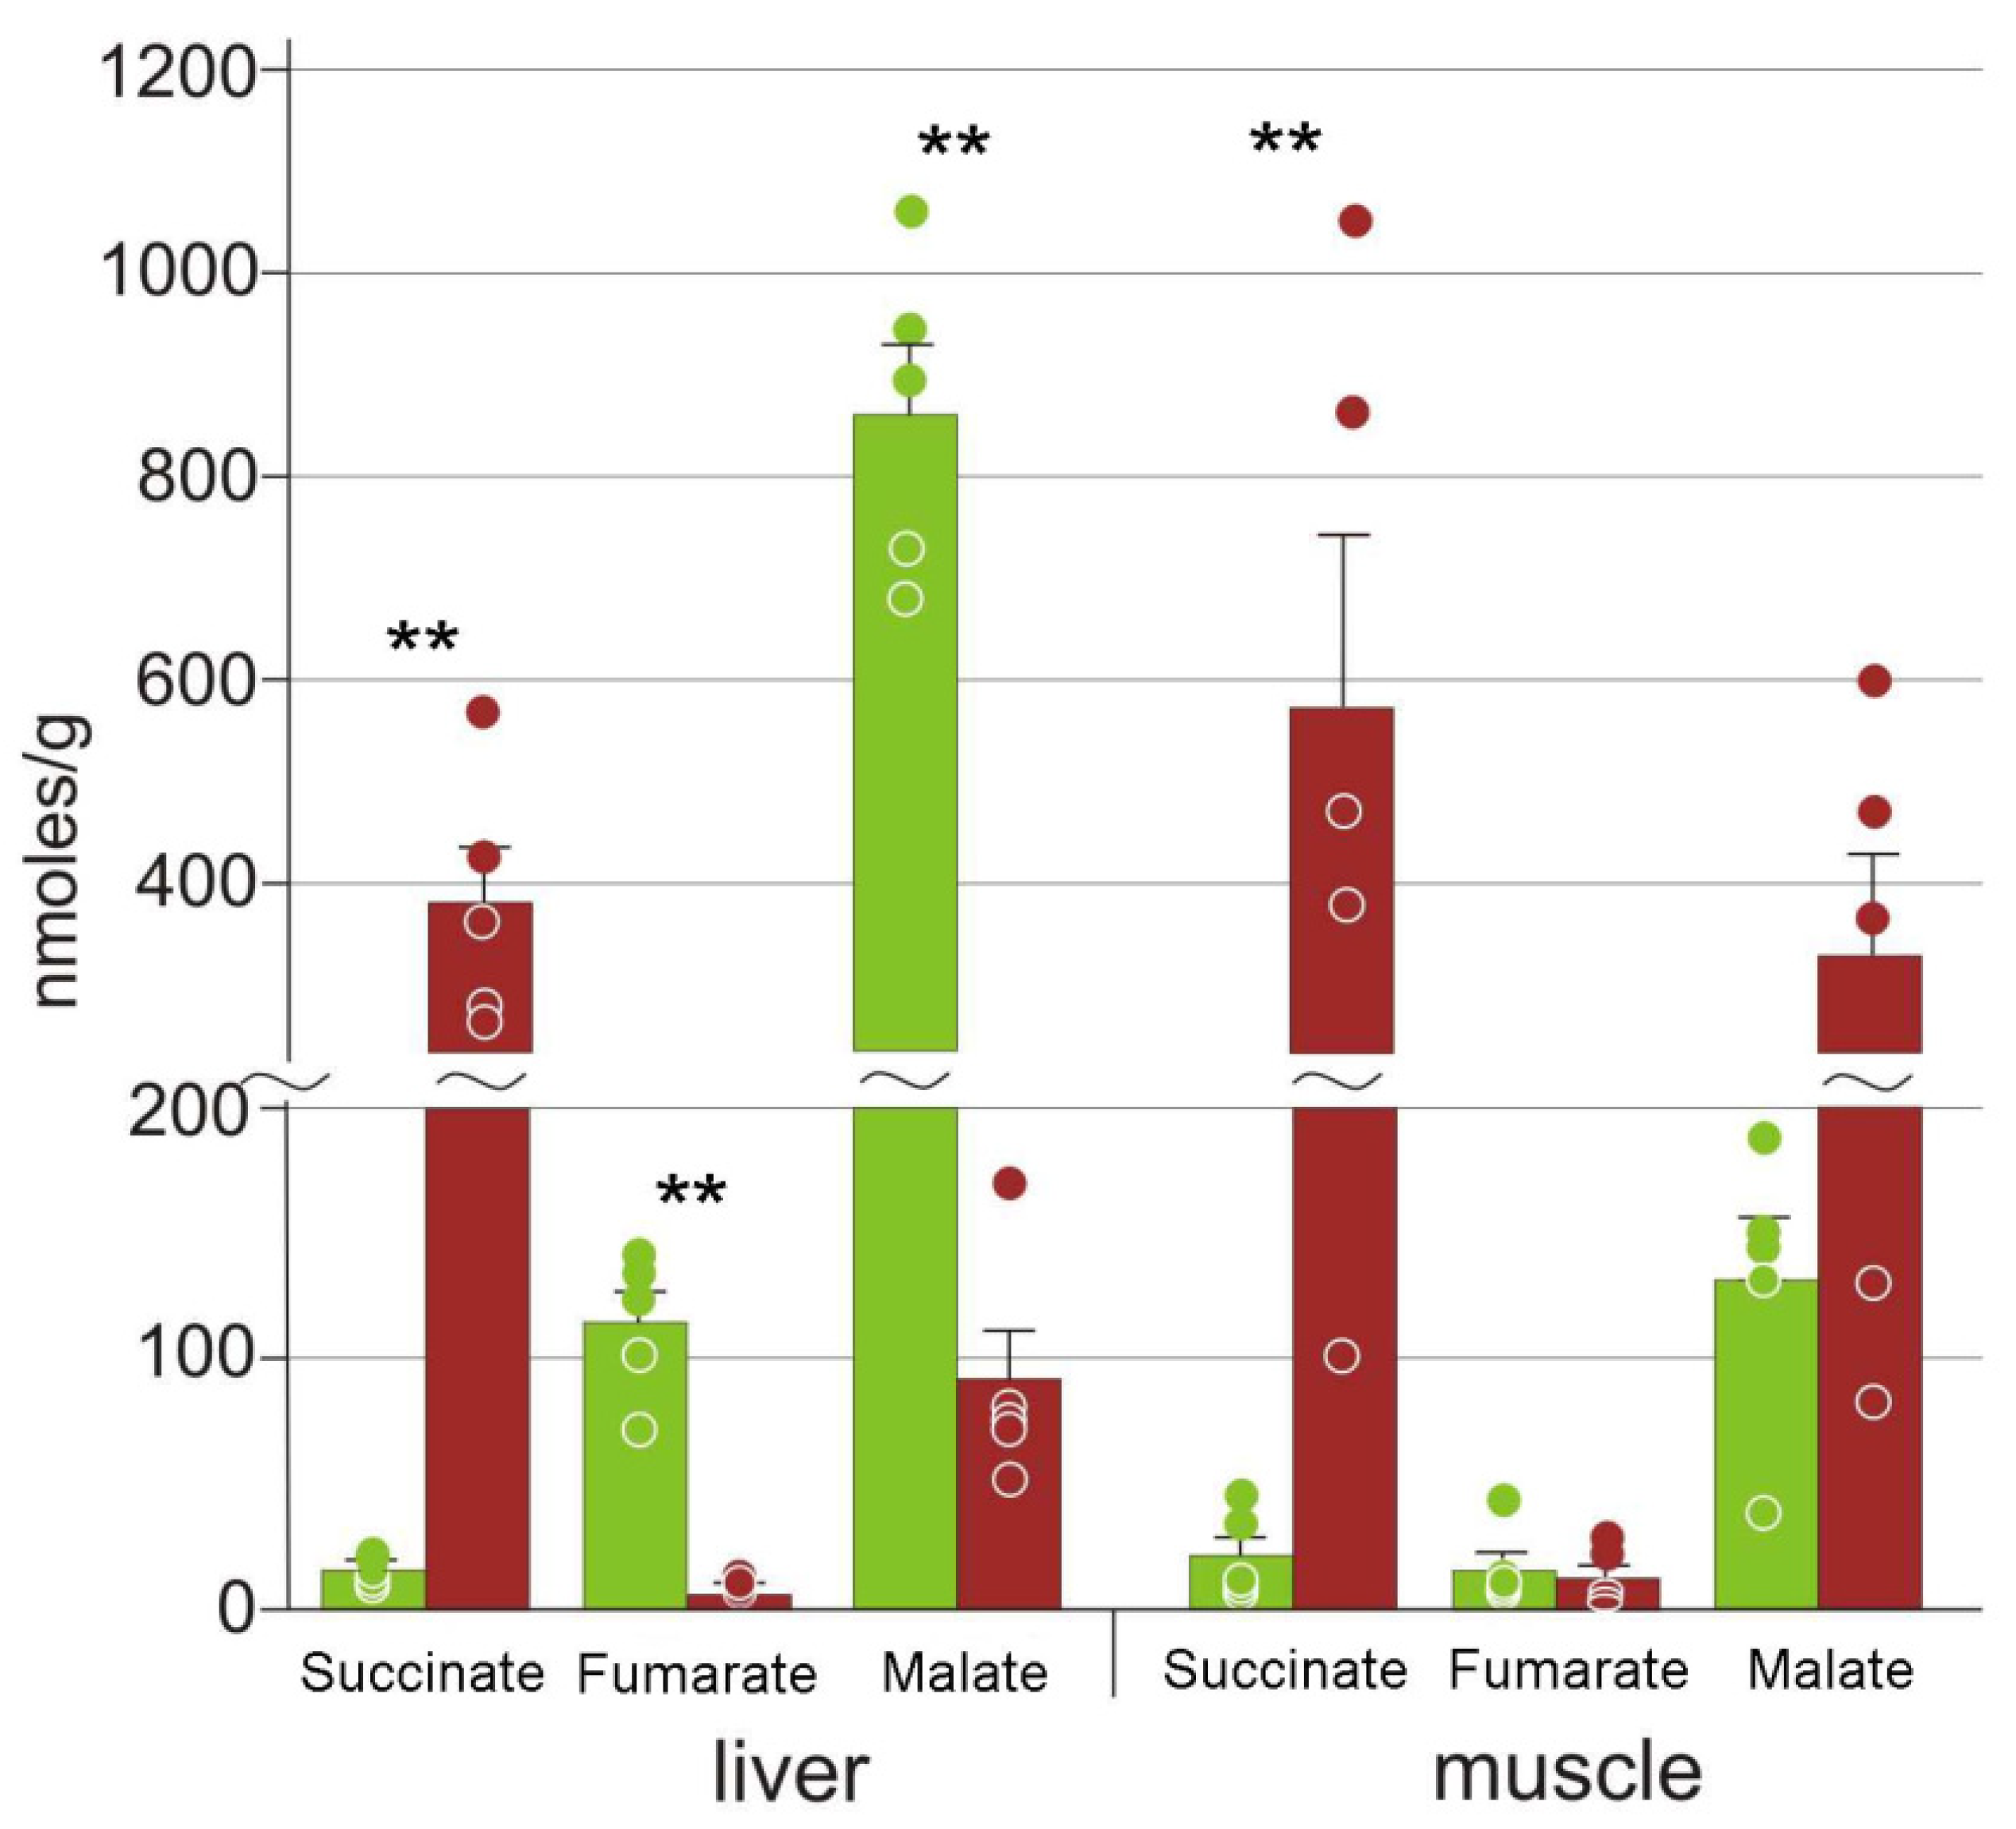
3.3. Energy Metabolism
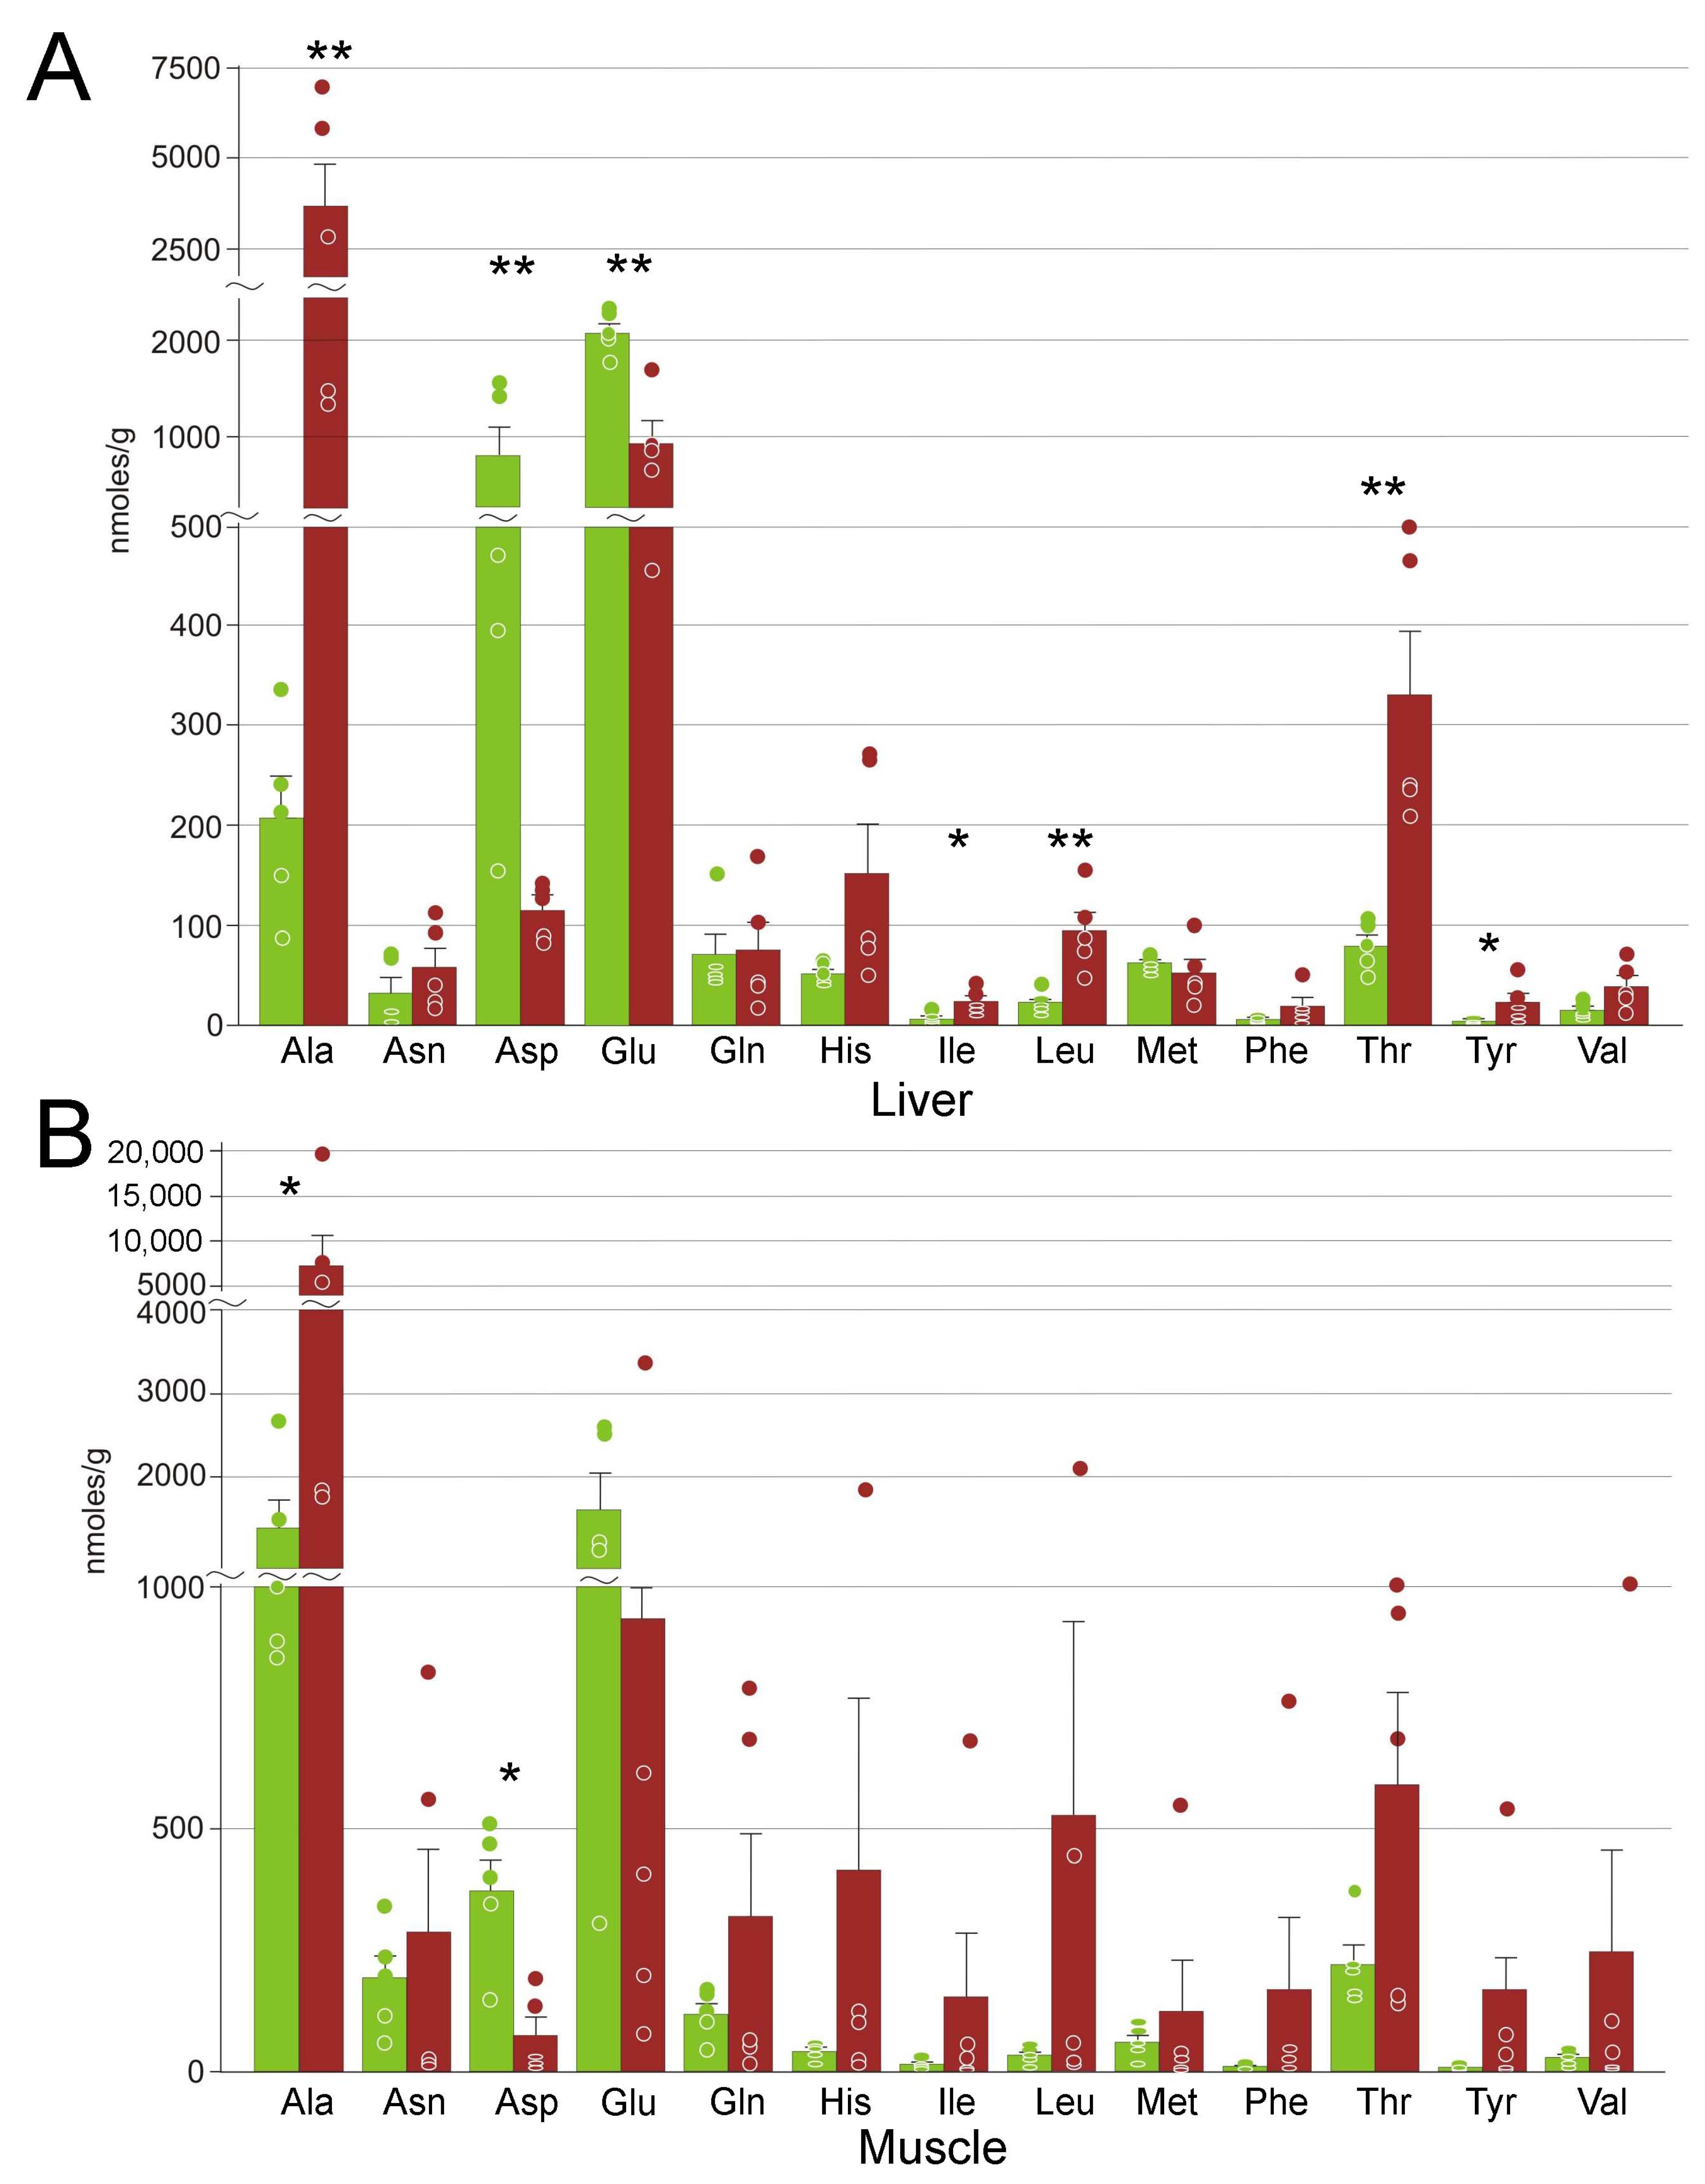
3.4. Amino Acids
3.5. Subcutaneous Ice
4. Discussion
4.1. Cryoprotectants in the Moor Frog
4.2. Glucose Variation Patterns
4.3. Energetic Processes during Freezing
4.4. Markers of Stress
4.5. Subcutaneous Ice
5. Conclusions
Author Contributions
Funding
Institutional Review Board Statement
Informed Consent Statement
Data Availability Statement
Conflicts of Interest
References
- Schmid, W.D. Survival of frogs in low temperature. Science 1982, 215, 697–698. [Google Scholar] [CrossRef] [PubMed]
- Berman, D.I.; Leirikh, A.N.; Mikhailova, E.I. Winter hibernation of the Siberian salamander Hynobius keyserlingi. J. Evol. Biochem. Physiol. 1984, 3, 323–327. [Google Scholar]
- Storey, K.B. Life in a frozen state: Adaptive strategies for natural freeze tolerance in amphibians and reptiles. Am. J. Physiol. Integr. Comp. Physiol. 1990, 258, R559–R568. [Google Scholar] [CrossRef] [PubMed]
- Lee, R.E., Jr.; Costanzo, J.P. Biological ice nucleation and ice distribution in cold-hardy ectothermic animals. Ann. Rev. Physiol. 1998, 60, 55–72. [Google Scholar] [CrossRef]
- Voituron, Y.; Barré, H.; Ramløv, H.; Douady, C.J. Freeze tolerance evolution among anurans: Frequency and timing of appearance. Cryobiology 2009, 58, 241–247. [Google Scholar] [CrossRef]
- Berman, D.I.; Meshcheryakova, E.N.; Bulakhova, N.A. Extreme negative temperatures and body mass loss in the Siberian salamander (Salamandrella keyserlingii, Amphibia, Hynobiidae). Dokl. Biol. Sci. 2016, 468, 137–141. [Google Scholar] [CrossRef]
- Storey, K.B.; Storey, J.M. Molecular physiology of freeze tolerance in vertebrates. Physiol. Rev. 2017, 97, 623–665. [Google Scholar] [CrossRef]
- Costanzo, J.P. Overwintering adaptations and extreme freeze tolerance in a subarctic population of the wood frog, Rana sylvatica. J. Comp. Physiol. B 2019, 189, 1–15. [Google Scholar] [CrossRef]
- Storey, K.B.; Storey, J.M. Natural freezing survival in animals. Ann. Rev. Ecol. Syst. 1996, 27, 365–386. [Google Scholar] [CrossRef] [Green Version]
- Pinder, A.W.; Storey, K.B.; Ultsch, G.R. Estivation and Hibernation. In Environmental Physiology of the Amphibians; Feder, M.E., Burggren, W.W., Eds.; University of Chicago Press: Chicago, IL, USA, 1992; pp. 250–274. [Google Scholar]
- Storey, K.B.; Storey, J.M. Molecular Biology of Freezing Tolerance. In Comprehensive Physiology; Wiley: New York, NY, USA, 2013; pp. 1283–1308. [Google Scholar]
- Larson, D.J.; Middle, L.; Vu, H.; Zhang, W.; Serianni, A.S.; Duman, J.; Barnes, B.M. Wood frog adaptations to overwintering in Alaska: New limits to freezing tolerance. J. Exp. Biol. 2014, 72, 1420–1425. [Google Scholar] [CrossRef] [Green Version]
- Voituron, Y.; Paaschburg, L.; Holmstrup, M.; Barré, H.; Ramløv, H. Survival and metabolism of Rana arvalis during freezing. J. Comp. Physiol. B 2009, 179, 223–230. [Google Scholar] [CrossRef] [PubMed]
- Berman, D.I.; Bulakhova, N.A.; Meshcheryakova, E.N.; Shekhovtsov, S.V. Overwintering and cold tolerance in the moor frog (Rana arvalis) across its range. Can. J. Zool. 2020, 98, 705–714. [Google Scholar] [CrossRef]
- Costanzo, J.P.; do Amaral, M.C.F.; Rosendale, A.J.; Lee, R.E. Hibernation physiology, freezing adaptation and extreme freeze tolerance in a northern population of the wood frog. J. Exp. Biol. 2013, 216, 3461–3473. [Google Scholar] [CrossRef] [PubMed] [Green Version]
- Yanshole, V.V.; Yanshole, L.V.; Zelentsova, E.A.; Tsentalovich, Y.P. Ovothiol A is the main antioxidant in fish lens. Metabolites 2019, 9, 95. [Google Scholar] [CrossRef] [Green Version]
- Wishart, D.S.; Feunang, Y.D.; Marcu, A.; Guo, A.C.; Liang, K.; Vázquez-Fresno, R.; Sajed, T.; Johnson, D.; Li, C.; Karu, N.; et al. HMDB 4.0: The human metabolome database for 2018. Nucleic Acids Res. 2018, 46, D608–D617. [Google Scholar] [CrossRef]
- Snytnikova, O.A.; Yanshole, L.V.; Iskakov, I.A.; Yanshole, V.V.; Chernykh, V.V.; Stepakov, D.A.; Novoselov, V.P.; Tsentalovich, Y.P. Quantitative metabolomic analysis of the human cornea and aqueous humor. Metabolomics 2017, 13, 152. [Google Scholar] [CrossRef]
- Chong, J.; Soufan, O.; Li, C.; Caraus, I.; Li, S.; Bourque, G.; Wishart, D.S.; Xia, J. MetaboAnalyst 4.0: Towards more transparent and integrative metabolomics analysis. Nucleic Acids Res. 2018, 46, W486–W494. [Google Scholar] [CrossRef] [Green Version]
- Shekhovtsov, S.V.; Bulakhova, N.A.; Tsentalovich, Y.P.; Zelentsova, E.A.; Meshcheryakova, E.N.; Poluboyarova, T.V.; Berman, D.I. Biochemical response to freezing in the Siberian salamander Salamandrella keyserlingii. Biology 2021, 10, 1172. [Google Scholar] [CrossRef]
- Berman, D.I.; Meshcheryakova, E.N.; Bulakhova, N.A. The Japanese tree frog (Hyla japonica), one of the most cold-resistant species of amphibians. Dokl. Biol. Sci. 2016, 471, 276–279. [Google Scholar] [CrossRef]
- Costanzo, J.P.; Wright, M.F.; Lee, R.E. Freeze tolerance as an overwintering adaptation in Cope’s grey treefrog (Hyla chrysoscelis). Copeia 1992, 2, 565–569. [Google Scholar] [CrossRef]
- Storey, J.M.; Storey, K.B. Adaptations of metabolism for freeze tolerance in the gray tree frog, Hyla versicolor. Can. J. Zool. 1985, 63, 49–54. [Google Scholar] [CrossRef]
- Storey, K.B.; Storey, J.M. Persistence of freeze tolerance in terrestrially hibernating frogs after spring emergence. Copeia 1987, 3, 720–726. [Google Scholar] [CrossRef]
- Davies, P.L. Ice-binding proteins: A remarkable diversity of structures for stopping and starting ice growth. Trends Biochem. Sci. 2014, 39, 548–555. [Google Scholar] [CrossRef] [PubMed]
- Bar Dolev, M.; Braslavsky, I.; Davies, P.L. Ice-binding proteins and their function. Ann. Rev. Biochem. 2016, 85, 515–542. [Google Scholar] [CrossRef] [PubMed]
- Vance, T.D.R.; Bayer-Giraldi, M.; Davies, P.L.; Mangiagalli, M. Ice-binding proteins and the ‘domain of unknown function’ 3494 family. FEBS J. 2019, 286, 855–873. [Google Scholar] [CrossRef] [PubMed] [Green Version]
- Hochachka, P.W.; Somero, G.N. Biochemical Adaptation: Mechanism and Process in Physiological Evolution; Oxford University Press: Oxford, UK, 2002; p. 408. ISBN 0195353676. [Google Scholar]
- Storey, K.B.; Storey, J.M. Natural freeze tolerance in ectothermic vertebrates. Ann. Rev. Physiol. 1992, 54, 619–637. [Google Scholar] [CrossRef] [PubMed]
- Edwards, J.R.; Koster, K.L.; Swanson, D.L. Time course for cryoprotectant synthesis in the freeze-tolerant chorus frog, Pseudacris triseriata. Comp. Biochem. Physiol. A 2000, 125, 367–375. [Google Scholar] [CrossRef]
- Layne, J.R.; Stapleton, M.G. Annual variation in glycerol mobilization and effect of freeze rigor on post-thaw locomotion in the freeze-tolerant frog Hyla versicolor. J. Comp. Physiol. B 2009, 179, 215. [Google Scholar] [CrossRef]
- Storey, K.B. Freeze tolerance in the frog, Rana sylvatica. Experientia 1984, 40, 1261–1262. [Google Scholar] [CrossRef]
- Storey, K.B.; Storey, J.M. Biochemical adaption for freezing tolerance in the wood frog, Rana sylvatica. J. Comp. Physiol. B 1984, 155, 29–36. [Google Scholar] [CrossRef]
- Higgins, S.A.; Swanson, D.L. Urea is not a universal cryoprotectant among hibernating anurans: Evidence from the freeze-tolerant boreal chorus frog (Pseudacris maculata). Comp. Biochem. Physiol. A 2013, 164, 344–350. [Google Scholar] [CrossRef] [PubMed]
- Layne, J.R. Freeze tolerance and cryoprotectant mobilization in the gray treefrog (Hyla versicolor). J. Exp. Zool. 1999, 283, 221–225. [Google Scholar] [CrossRef]
- Layne, J.R.; Jones, A.L. Freeze tolerance in the gray treefrog: Cryoprotectant mobilization and organ dehydration. J. Exp. Zool. 2001, 290, 1–5. [Google Scholar] [CrossRef] [PubMed]
- Irwin, J.T.; Lee, J.R.E. Geographic variation in energy storage and physiological responses to freezing in the gray treefrogs Hyla versicolor and H. chrysoscelis. J. Exp. Biol. 2003, 206, 2859–2867. [Google Scholar] [CrossRef] [PubMed] [Green Version]
- Bulakhova, N.; Shishikina, K. Pre-hibernation energy reserves and their consumption during freezing in the moor frog Rana arvalis in Siberia. Eur. Zool. J. 2022, 89, 556–567. [Google Scholar] [CrossRef]
- Reynolds, A.M.; Lee, R.E.; Costanzo, J.P. Membrane adaptation in phospholipids and cholesterol in the widely distributed, freeze-tolerant wood frog, Rana sylvatica. J. Comp. Physiol. B 2014, 184, 371–383. [Google Scholar] [CrossRef] [Green Version]
- Gupta, A.; Storey, K.B. Regulation of antioxidant systems in response to anoxia and reoxygenation in Rana sylvatica. Comp. Biochem. Physiol. B 2020, 243, 110436. [Google Scholar] [CrossRef]
- Bickler, P.E.; Buck, L.T. Hypoxia tolerance in reptiles, amphibians, and fishes: Life with variable oxygen availability. Ann. Rev. Physiol. 2007, 69, 145–170. [Google Scholar] [CrossRef]
- Storey, K.B.; Storey, J.M. Freeze tolerant frogs: Cryoprotectants and tissue metabolism during freeze–thaw cycles. Can. J. Zool. 1986, 64, 49–56. [Google Scholar] [CrossRef]
- Storey, K.B. Organ-specific metabolism during freezing and thawing in a freeze-tolerant frog. Am. J. Physiol. 1987, 253, R292–R297. [Google Scholar] [CrossRef]
- Churchill, T.A.; Storey, K.B. Effects of dehydration on organ metabolism in the frog Pseudacris crucifer: Hyperglycemic responses to dehydration mimic freezing-induced cryoprotectant production. J. Comp. Physiol. B 1994, 164, 492–498. [Google Scholar] [CrossRef] [PubMed]
- Shoubridge, E.A.; Hochachka, P.W. Ethanol: Novel end product of vertebrate anaerobic metabolism. Science 1980, 209, 308–309. [Google Scholar] [CrossRef] [PubMed]
- Nilsson, G.E. Surviving anoxia with the brain turned on. Physiology 2001, 16, 217–221. [Google Scholar] [CrossRef] [PubMed]
- Shekhovtsov, S.V.; Bulakhova, N.A.; Tsentalovich, Y.P.; Zelentsova, E.A.; Yanshole, L.V.; Meshcheryakova, E.N.; Berman, D.I. Metabolic response of the Siberian wood frog Rana amurensis to extreme hypoxia. Sci. Rep. 2020, 10, 14604. [Google Scholar] [CrossRef]
- Chouchani, E.T.; Pell, V.R.; Gaude, E.; Aksentijević, D.; Sundier, S.Y.; Robb, E.L.; Logan, A.; Nadtochiy, S.M.; Ord, E.N.J.; Smith, A.C.; et al. Ischaemic accumulation of succinate controls reperfusion injury through mitochondrial ROS. Nature 2014, 515, 431–435. [Google Scholar] [CrossRef] [Green Version]
- Bundgaard, A.; James, A.M.; Gruszczyk, A.V.; Martin, J.; Murphy, M.P.; Fago, A. Metabolic adaptations during extreme anoxia in the turtle heart and their implications for ischemia-reperfusion injury. Sci. Rep. 2019, 9, 2850. [Google Scholar] [CrossRef] [Green Version]
- Valls-Lacalle, L.; Barba, I.; Miró-Casas, E.; Ruiz-Meana, M.; Rodríguez-Sinovas, A.; García-Dorado, D. Selective inhibition of succinate dehydrogenase in reperfused myocardium with intracoronary malonate reduces infarct size. Sci. Rep. 2018, 8, 2442. [Google Scholar] [CrossRef] [Green Version]
- Beach, T.E.; Prag, H.A.; Pala, L.; Logan, A.; Huang, M.M.; Gruszczyk, A.V.; Martin, J.L.; Mahbubani, K.; Hamed, M.O.; Hosgood, S.A.; et al. Targeting succinate dehydrogenase with malonate ester prodrugs decreases renal ischemia reperfusion injury. Redox Biol. 2020, 36, 101640. [Google Scholar] [CrossRef]
- Mitzen, E.J.; Koeppen, A.H. Malonate, Malonyl-coenzyme A, and acetyl-coenzyme A in developing rat brain. J. Neurochem. 1984, 43, 499–506. [Google Scholar] [CrossRef]
- Riley, K.M.; Dickson, A.C.; Koeppen, A.H. The origin of free brain malonate. Neurochem. Res. 1991, 16, 117–122. [Google Scholar] [CrossRef]
- Polinati, P.P.; Valanne, L.; Tyni, T. Malonyl-CoA decarboxylase deficiency: Long-term follow-up of a patient new clinical features and novel mutations. Brain Dev. 2015, 37, 107–113. [Google Scholar] [CrossRef] [PubMed]
- Nelson, D.L.; Cox, M.M. Lehninger Principles of Biochemistry, 4th ed.; Freeman and Company: New York, NY, USA, 2005; ISBN 0-7167-4339-6. [Google Scholar]
- Mora-Ortiz, M.; Trichard, M.; Oregioni, A.; Claus, S.P. Thanatometabolomics: Introducing NMR-based metabolomics to identify metabolic biomarkers of the time of death. Metabolomics 2019, 15, 37. [Google Scholar] [CrossRef] [PubMed] [Green Version]
- Zelentsova, E.A.; Yanshole, L.V.; Melnikov, A.D.; Kudryavtsev, I.S.; Novoselov, V.P.; Tsentalovich, Y.P. Post-mortem changes in metabolomic profiles of human serum, aqueous humor and vitreous humor. Metabolomics 2020, 16, 80. [Google Scholar] [CrossRef] [PubMed]
- Zelentsova, E.A.; Yanshole, L.V.; Snytnikova, O.A.; Yanshole, V.V.; Tsentalovich, Y.P.; Sagdeev, R.Z. Post-mortem changes in the metabolomic compositions of rabbit blood, aqueous and vitreous humors. Metabolomics 2016, 12, 172. [Google Scholar] [CrossRef]
- Hermes-Lima, M.; Moreira, D.C.; Rivera-Ingraham, G.A.; Giraud-Billoud, M.; Genaro-Mattos, T.C.; Campos, É.G. Preparation for oxidative stress under hypoxia and metabolic depression: Revisiting the proposal two decades later. Free Radic. Biol. Med. 2015, 89, 1122–1143. [Google Scholar] [CrossRef]
- Oliveira, M.F.; Geihs, M.A.; França, T.F.A.; Moreira, D.C.; Hermes-Lima, M. Is “Preparation for Oxidative Stress” a case of physiological conditioning hormesis? Front. Physiol. 2018, 9, 945. [Google Scholar] [CrossRef] [Green Version]
- Baker, P.J.; Costanzo, J.P.; Lee, R.E. Oxidative stress and antioxidant capacity of a terrestrially hibernating hatchling turtle. J. Comp. Physiol. B 2007, 177, 875–883. [Google Scholar] [CrossRef]
- Krivoruchko, A.; Storey, K.B. Activation of antioxidant defenses in response to freezing in freeze-tolerant painted turtle hatchlings. Biochim. Biophys. Acta 2010, 1800, 662–668. [Google Scholar] [CrossRef]
- Hermes-Lima, M.; Storey, K.B. Antioxidant defenses in the tolerance of freezing and anoxia by garter snakes. Am. J. Physiol. Integr. Comp. Physiol. 1993, 265, R646–R652. [Google Scholar] [CrossRef]
- Voituron, Y.; Servais, S.; Romestaing, C.; Douki, T.; Barré, H. Oxidative DNA damage and antioxidant defenses in the European common lizard (Lacerta vivipara) in supercooled and frozen states. Cryobiology 2006, 52, 74–82. [Google Scholar] [CrossRef]
- Joanisse, D.R.; Storey, K.B. Oxidative damage and antioxidants in Rana sylvatica, the freeze-tolerant wood frog. Am. J. Physiol. Integr. Comp. Physiol. 1996, 271, R545–R553. [Google Scholar] [CrossRef] [PubMed]
- Wu, C.-W.; Tessier, S.N.; Storey, K.B. Stress-induced antioxidant defense and protein chaperone response in the freeze-tolerant wood frog Rana sylvatica. Cell Stress Chaperones 2018, 23, 1205–1217. [Google Scholar] [CrossRef] [PubMed]
- Swanson, D.L.; Graves, B.M.; Koster, K.L. Freezing tolerance/intolerance and cryoprotectant synthesis in terrestrially overwintering anurans in the Great Plains, USA. J. Comp. Physiol. B 1996, 166, 110–119. [Google Scholar] [CrossRef] [PubMed]


| T, °C | Duration, Days |
|---|---|
| 5 | 30 |
| 1 | 15 |
| −1 | 20 |
| −2 | 2 |
| −3 | 2 |
| −5 | 10 |
| Liver | Muscle | |||
|---|---|---|---|---|
| Compound | Control | Frozen | Control | Frozen |
| 2-aminoadipate | n/a | n/a | 126 ± 21 | 180 ± 50 |
| 2,3-butanediol | 2.4 ± 0.4 | 800 ± 400 ** | 1.6 ± 0.4 | 4000 ± 3000 |
| Acetate | 1000 ± 190 | 1500 ± 300 | 1110 ± 130 | 2700 ± 1000 |
| ADP | 99 ± 18 | 75 ± 24 | 179 ± 27 | 460 ± 210 |
| Alanine | 210 ± 90 | 3700 ± 1100 ** | 1400 ± 300 | 7000 ± 3000 * |
| α-aminobutyrate | 2.9 ± 0.8 | 8 ± 3 | 6.8 ± 0.9 | 18 ± 9 |
| AMP | 33 ± 9 | 190 ± 70 | 8.0 ± 1.0 | 190 ± 50 ** |
| Anserine | 550 ± 140 | 300 ± 60 | 3700 ± 700 | 2100 ± 900 |
| Ascorbate | 82 ± 21 | 38 ± 5 ** | n/a | n/a |
| Asparagine | 60 ± 40 | 32 ± 16 | 190 ± 50 | 290 ± 170 |
| Aspartate | 800 ± 600 | 114 ± 11 ** | 370 ± 60 | 80 ± 40 * |
| ATP | 220 ± 60 | 27 ± 8 | 450 ± 70 | 340 ± 180 |
| β-alanine | 44 ± 17 | 129 ± 20 ** | 97 ± 26 | 600 ± 500 |
| β-aminoisobutyrate | 0.5 ± 0.4 | 3.1 ± 1.3 | 6.3 ± 0.9 | 28 ± 14 |
| Carnosine | 1.2 ± 0.3 | 420 ± 90 * | 3500 ± 600 | 8400 ± 2800 |
| Choline | 12 ± 4 | 87 ± 14 ** | 11.7 ± 2.0 | 220 ± 140 |
| Creatine | 35 ± 8 | 540 ± 180 ** | 4700 ± 600 | 24,000 ± 7000 * |
| Ergothioneine | 32 ± 10 | 131 ± 13 ** | 14 ± 3 | 61 ± 25 |
| Ethanol | 8 ± 4 | 106 ± 20 ** | 11 ± 3 | 23 ± 4 |
| Formate | 46 ± 12 | 54 ± 16 | 52 ± 7 | 113 ± 40 |
| Fumarate | 115 ± 28 | 6.0 ± 2.0 ** | 15 ± 7 | 12 ± 5 |
| GABA | 21 ± 7 | 48 ± 13 | 8 ± 4 | 29 ± 12 |
| Glucose | 540 ± 180 | 71,000 ± 7000 ** | 480 ± 190 | 24,000 ± 12,000 ** |
| Glutamate | 2090 ± 220 | 950 ± 220 ** | 1600 ± 400 | 900 ± 600 |
| Glutamine | 70 ± 50 | 75 ± 27 | 118 ± 21 | 320 ± 170 |
| Glycerol | 190 ± 130 | 74,000 ± 14,000 ** | 200 ± 90 | 72,000 ± 28,000 ** |
| Glycerophosphocholine | 1820 ± 150 | 6200 ± 400 ** | 1090 ± 230 | 4300 ± 1700 |
| Glycine | 34 ± 9 | n/a | 360 ± 40 | n/a |
| GSH | 170 ± 40 | 204 ± 18 ** | 96 ± 15 | 150 ± 60 |
| GTP | 3.6 ± 0.5 | 24 ± 5 ** | 23 ± 4 | 17 ± 8 |
| Histidine | 53 ± 9 | 150 ± 50 | 40 ± 7 | 400 ± 300 |
| Hypoxanthine | 8.8 ± 0.9 | 78 ± 14 | 3.1 ± 0.5 | 270 ± 220 ** |
| Inosinate | 7 ± 4 | 28 ± 8 | 7.4 ± 1.8 | 1000 ± 400 ** |
| Inosine | n/a | 49 ± 9 | 1 ± 1 | 643 ± 506 ** |
| Isobutyrate | 1.9 ± 0.4 | 6.9 ± 1.8 ** | 0.9 ± 0.3 | 9 ± 3 ** |
| Isoleucine | 7 ± 5 | 25 ± 6 * | 15 ± 4 | 150 ± 130 |
| Lactate | 460 ± 160 | 14,000 ± 3000 ** | 470 ± 160 | 16,000 ± 9000 ** |
| Leucine | 23 ± 11 | 95 ± 18 ** | 34 ± 8 | 500 ± 400 |
| Malate | 860 ± 160 | 92 ± 20 ** | 131 ± 25 | 300 ± 100 |
| Malonate | n/a | n/a | 38 ± 5 | 360 ± 160 ** |
| Maltitol | 3.1 ± 1.1 | 116 ± 28 ** | n/a | 8 ± 3 ** |
| Maltose | 107 ± 12 | 250 ± 21 ** | 104 ± 18 | 240 ± 140 |
| Mannose | 6 ± 3 | 220 ± 70 ** | 52 ± 24 | 900 ± 700 |
| Methionine | 63 ± 7 | 53 ± 13 | 60 ± 15 | 120 ± 110 |
| Methionine sulfoxide | 16.0 ± 0.9 | 54 ± 16 * | 2.2 ± 0.3 | 10 ± 5 |
| NAD | 31 ± 7 | 76 ± 6 | 86 ± 13 | 120 ± 40 |
| NADH | 3.8 ± 1.0 | 4.4 ± 0.9 | 4.1 ± 0.7 | 20 ± 7 ** |
| Nicotinamide | 4 ± 4 | 25 ± 6 | 14 ± 4 | 130 ± 50 * |
| O-Acetylcarnitine | n/a | n/a | 8.9 ± 2.9 | 80 ± 40 ** |
| Pantothenate | 0.5 ± 0.3 | 5.3 ± 1.8 | 1.9 ± 0.4 | 15 ± 10 |
| Phenylalanine | 6.2 ± 0.7 | 20 ± 8 | 10 ± 3 | 170 ± 150 |
| Phosphocreatine | 27 ± 6 | 9 ± 4 * | 3200 ± 700 | 590 ± 190 ** |
| Pyruvate | 2.0 ± 0.3 | 1.7 ± 0.4 | 9 ± 5 | 14 ± 9 |
| S-adenosylhomocysteine | n/a | 24 ± 3 ** | n/a | 26 ± 11 ** |
| Serine-phosphoethanolamine | n/a | n/a | 1250 ± 260 | 2300 ± 1000 |
| Succinate | 15 ± 6 | 380 ± 60 ** | 21 ± 8 | 570 ± 170 ** |
| Threonine | 80 ± 23 | 330 ± 60 ** | 220 ± 40 | 590 ± 190 |
| Tyrosine | 4.8 ± 0.7 | 24 ± 9 * | 9 ± 3 | 130 ± 100 |
| UMP | 8.8 ± 1.0 | 59 ± 14 ** | n/a | n/a |
| Uracil | n/a | 24 ± 5 ** | n/a | 70 ± 40 ** |
| Valine | 16 ± 8 | 39 ± 10 | 29 ± 6 | 250 ± 210 |
| Xanthine | 4.3 ± 0.6 | 42 ± 10 ** | n/a | n/a |
| Compound | Concentration, nM |
|---|---|
| Glycerol | 18,000 |
| Glucose | 8000 |
| Lactate | 1400 |
| Creatine | 260 |
| Alanine | 160 |
| Glycerophosphocholine | 160 |
| 2,3-Butanediol | 62 |
| Succinate | 57 |
| Carnosine | 52 |
| Acetate | 51 |
| Glutamine | 24 |
| Creatine phosphate | 18 |
| Pyruvate | 2.9 |
Publisher’s Note: MDPI stays neutral with regard to jurisdictional claims in published maps and institutional affiliations. |
© 2022 by the authors. Licensee MDPI, Basel, Switzerland. This article is an open access article distributed under the terms and conditions of the Creative Commons Attribution (CC BY) license (https://creativecommons.org/licenses/by/4.0/).
Share and Cite
Shekhovtsov, S.V.; Bulakhova, N.A.; Tsentalovich, Y.P.; Zelentsova, E.A.; Meshcheryakova, E.N.; Poluboyarova, T.V.; Berman, D.I. Metabolomic Analysis Reveals That the Moor Frog Rana arvalis Uses Both Glucose and Glycerol as Cryoprotectants. Animals 2022, 12, 1286. https://doi.org/10.3390/ani12101286
Shekhovtsov SV, Bulakhova NA, Tsentalovich YP, Zelentsova EA, Meshcheryakova EN, Poluboyarova TV, Berman DI. Metabolomic Analysis Reveals That the Moor Frog Rana arvalis Uses Both Glucose and Glycerol as Cryoprotectants. Animals. 2022; 12(10):1286. https://doi.org/10.3390/ani12101286
Chicago/Turabian StyleShekhovtsov, Sergei V., Nina A. Bulakhova, Yuri P. Tsentalovich, Ekaterina A. Zelentsova, Ekaterina N. Meshcheryakova, Tatiana V. Poluboyarova, and Daniil I. Berman. 2022. "Metabolomic Analysis Reveals That the Moor Frog Rana arvalis Uses Both Glucose and Glycerol as Cryoprotectants" Animals 12, no. 10: 1286. https://doi.org/10.3390/ani12101286
APA StyleShekhovtsov, S. V., Bulakhova, N. A., Tsentalovich, Y. P., Zelentsova, E. A., Meshcheryakova, E. N., Poluboyarova, T. V., & Berman, D. I. (2022). Metabolomic Analysis Reveals That the Moor Frog Rana arvalis Uses Both Glucose and Glycerol as Cryoprotectants. Animals, 12(10), 1286. https://doi.org/10.3390/ani12101286