
Changes of Plasma Analytes Reflecting Metabolic Adaptation to the Different Stages of the Lactation Cycle in Healthy Multiparous Holstein Dairy Cows Raised in High-Welfare Conditions

 , , , and
Simple Summary
Abstract
1. Introduction
2. Materials and Methods
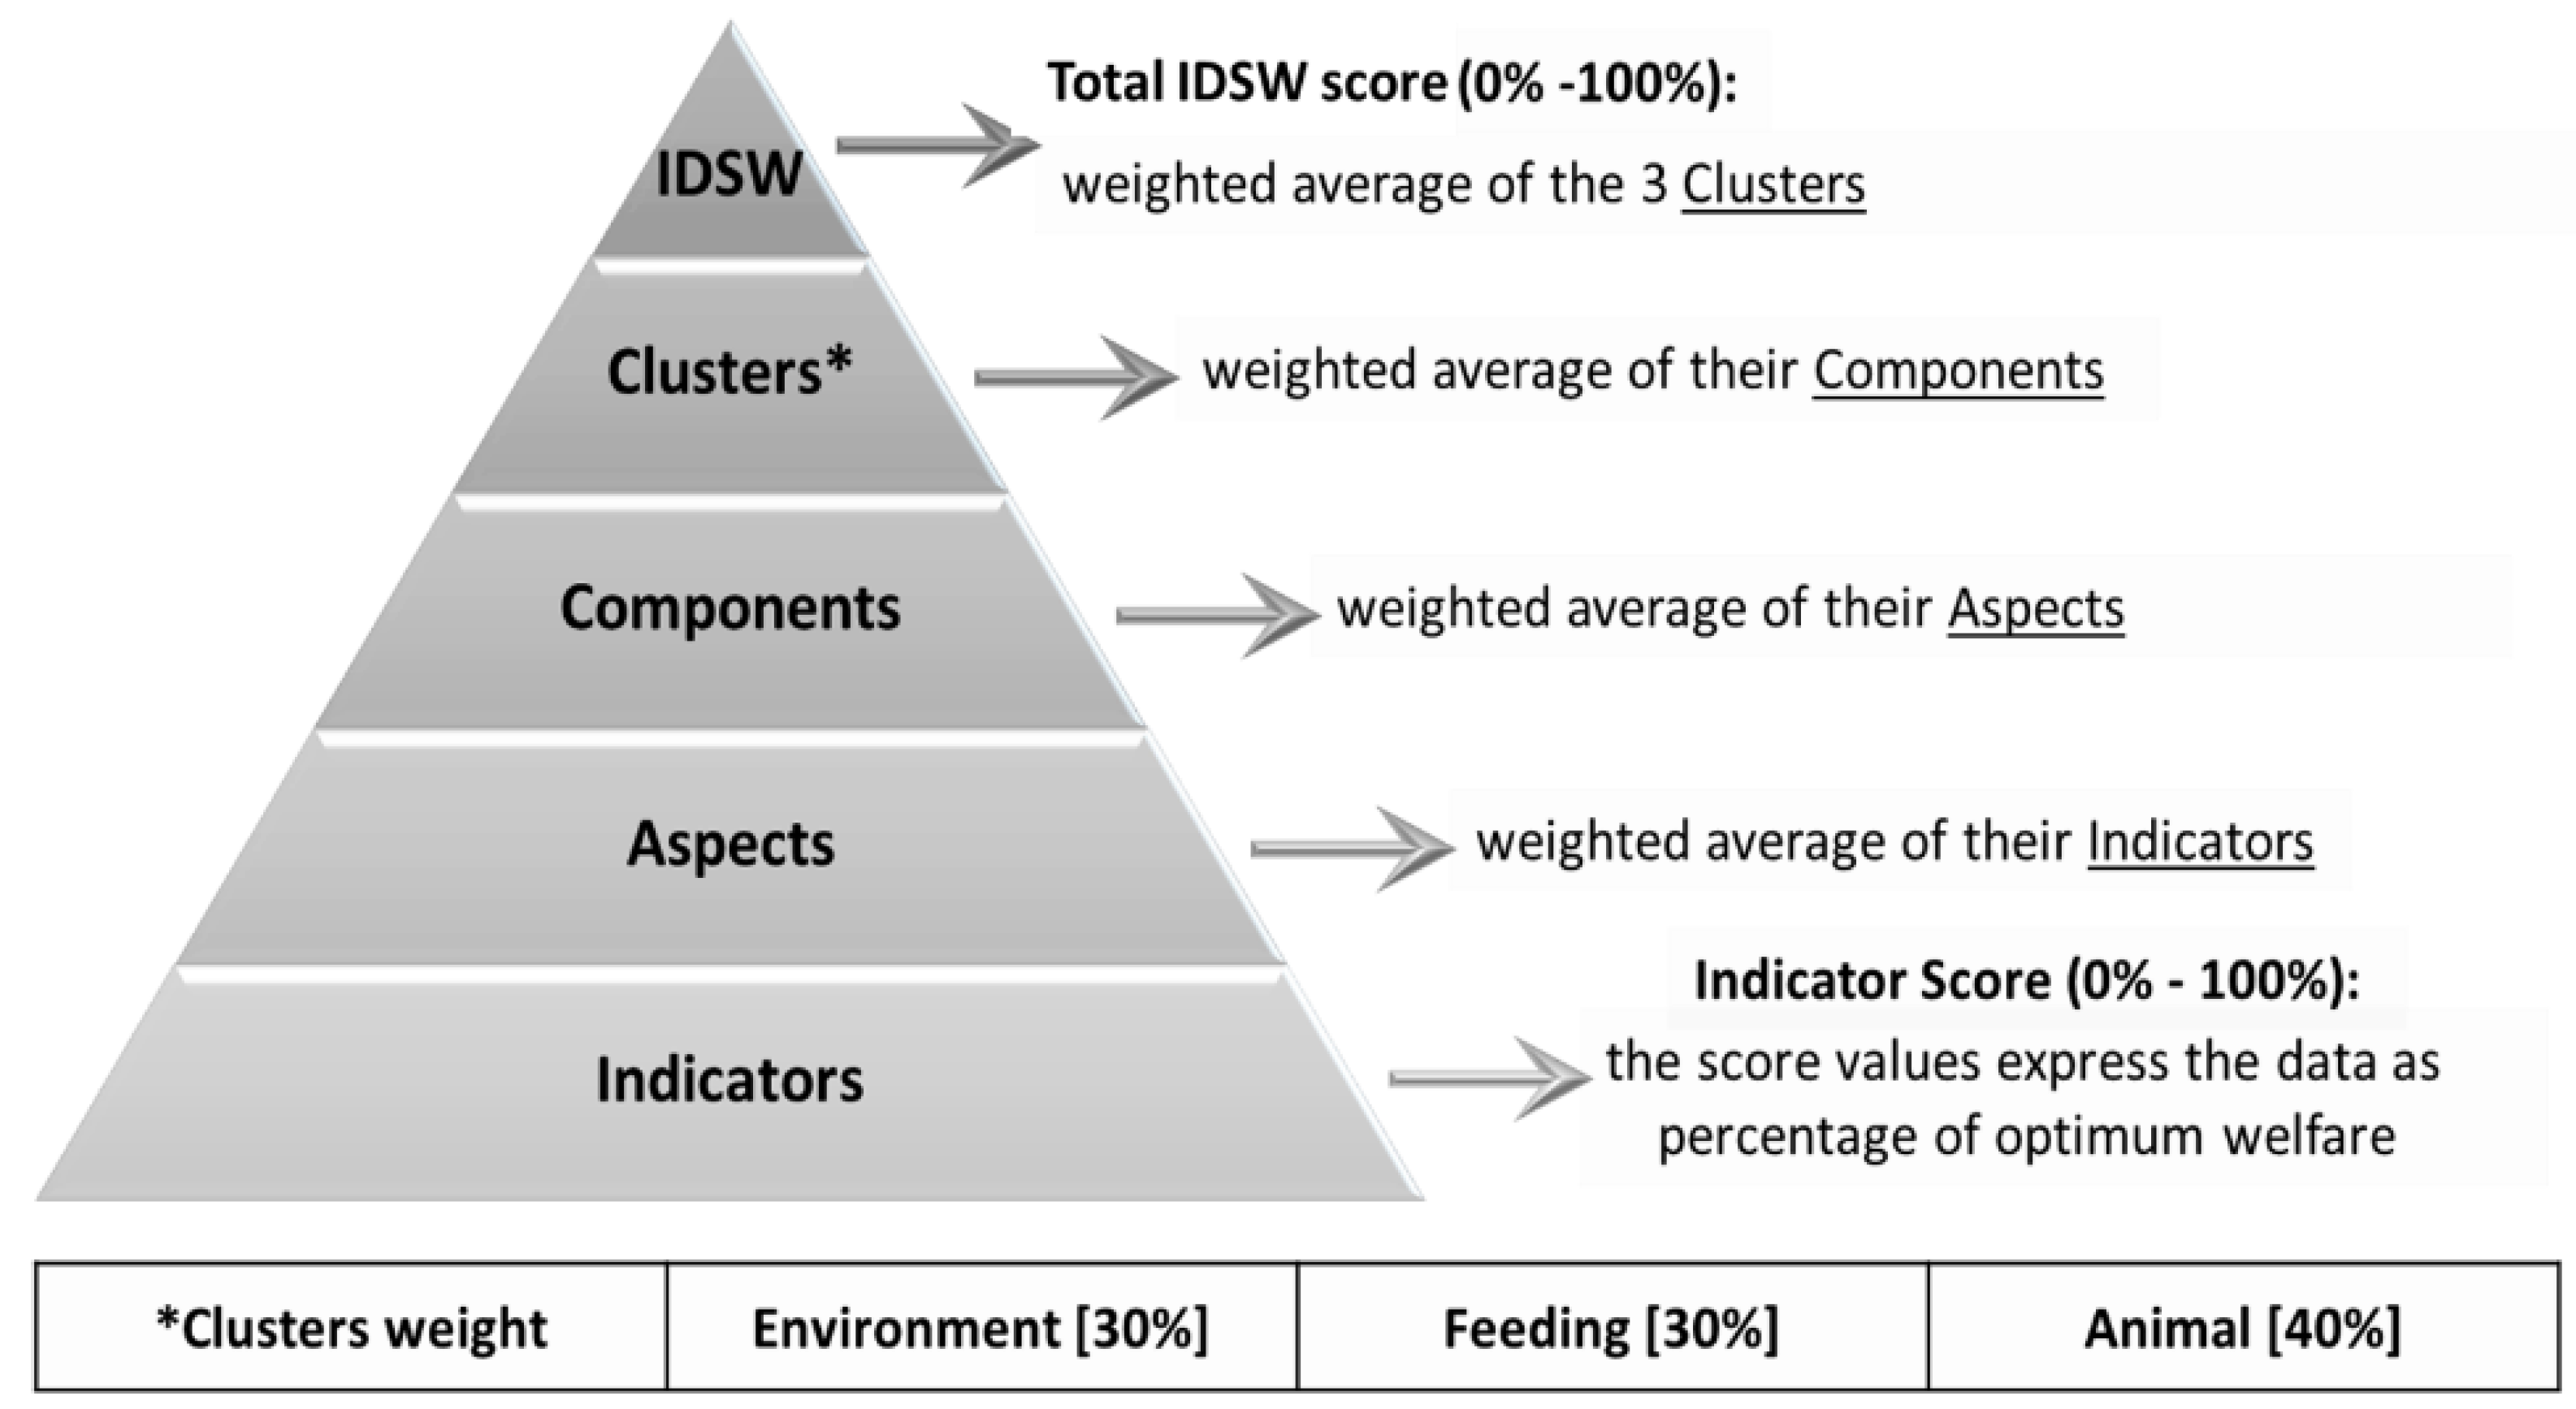
2.1. Welfare Status Evaluation and Criteria for Farm Inclusion
2.2. Criteria for Animal Recruitment
2.3. Blood Sample Collection and Analyses
2.4. Criteria for Retrospective Exclusion, Statistical Analysis and Reference Intervals Calculation
3. Results and Discussion
3.1. Effect of the Phase of the Lactation Cycle on the Plasma Analytes Concentrations
3.1.1. Packed Cell Volume
3.1.2. Energy Metabolism Biomarkers
3.1.3. Protein Metabolism and Kidney Function Biomarkers
3.1.4. Mineral Metabolism Biomarkers
3.1.5. Liver Function Biomarkers
3.1.6. Inflammation and Acute Phase Proteins Biomarkers
3.1.7. Oxidant Status Biomarkers
3.2. Reference Intervals Calculation
4. Conclusions
Supplementary Materials
Author Contributions
Funding
Institutional Review Board Statement
Data Availability Statement
Conflicts of Interest
References
- Herdt, T.H. Variability characteristics and test selection in herdlevel nutritional and metabolic profile testing. Vet. Clin. N. Am. Food Anim. Pract. 2000, 16, 387–403. [Google Scholar] [CrossRef]
- Bertoni, G. Welfare, health and management of dairy cows. In Recent Progress in Animal Production Science; Piva, G., Bertoni, G., Masoero, F., Bani, P., Calamari, L., Eds.; FrancoAngeli: Milan, Italy, 1999; pp. 59–78. [Google Scholar]
- Quiroz-Rocha, G.F.; LeBlanc, S.J.; Duffield, T.F.; Wood, D.; Leslie, K.E.; Jacobs, R.M. Reference limits for biochemical and hematological analytes of dairy cows one week before and one week after parturition. Can. Vet. J. La Rev. Vet. Can. 2009, 50, 383–388. [Google Scholar]
- Brscic, M.; Cozzi, G.; Lora, I.; Stefani, A.L.; Contiero, B.; Ravarotto, L.; Gottardo, F. Short communication: Reference limits for blood analytes in Holstein late-pregnant heifers and dry cows: Effects of parity, days relative to calving, and season. J. Dairy Sci. 2015, 98, 7886–7892. [Google Scholar] [CrossRef]
- Moretti, P.; Paltrinieri, S.; Trevisi, E.; Probo, M.; Ferrari, A.; Minuti, A.; Giordano, A. Reference intervals for hematological and biochemical parameters, acute phase proteins and markers of oxidation in Holstein dairy cows around 3 and 30 days after calving. Res. Vet. Sci. 2017, 114, 322–331. [Google Scholar] [CrossRef]
- Cozzi, G.; Ravarotto, L.; Gottardo, F.; Stefani, A.L.; Contiero, B.; Moro, L.; Brscic, M.; Dalvit, P. Short communication: Reference values for blood parameters in Holstein dairy cows: Effects of parity, stage of lactation, and season of production. J. Dairy Sci. 2011, 94, 3895–3901. [Google Scholar] [CrossRef] [PubMed]
- Bertoni, G.; Trevisi, E. Use of the liver activity index and other metabolic variables in the assessment of metabolic health in dairy herds. Vet. Clin. N. Am. Food Anim. Pract. 2013, 29, 413–431. [Google Scholar] [CrossRef] [PubMed]
- Drackley, J.K. Biology of dairy cows during the transition period: The final frontier? J. Dairy Sci. 1999, 82, 2259–2273. [Google Scholar] [CrossRef]
- Drackley, J.K.; Dann, H.M.; Douglas, N.; Guretzky, N.A.J.; Litherland, N.B.; Underwood, J.P.; Loor, J.J. Physiological and pathological adaptations in dairy cows that may increase susceptibility to periparturient diseases and disorders. Ital. J. Anim. Sci. 2005, 4, 323–344. [Google Scholar] [CrossRef]
- Mezzetti, M.; Bionaz, M.; Trevisi, E. Interaction between inflammation and metabolism in periparturient dairy cows. J. Anim. Sci. 2020, 98, S155–S174. [Google Scholar] [CrossRef]
- Ametaj, B.N.; Bradford, B.J.; Bobe, G.; Nafikov, R.A.; Lu, Y.; Young, J.W.; Beitz, D.C. Strong relationships between mediators of the acute phase response and fatty liver in dairy cows. Can. J. Anim. Sci. 2005, 85, 165–175. [Google Scholar] [CrossRef]
- Huzzey, J.M.; Nydam, D.V.; Grant, R.J.; Overton, T.R. Associations of prepartum plasma cortisol, haptoglobin, fecal cortisol metabolites, and nonesterified fatty acids with postpartum health status in Holstein dairy cows. J. Dairy Sci. 2011, 94, 5878–5889. [Google Scholar] [CrossRef] [PubMed]
- Calamari, L.; Bertoni, G. Model to evaluate welfare in dairy cow farms. Ital. J. Anim. Sci. 2009, 8, 301–323. [Google Scholar] [CrossRef]
- Welfare Quality® Consortium. Welfare Quality® Assessment Protocol for Cattle; Welfare Quality: Lelystad, The Netherlands, 2009. [Google Scholar]
- Jordan, K.; Cook, N.; Darr, D.; DeCoite, C.; Doak, R.; Endres, M.; Humphrey, P.; Keyserlingk, N.V.; Maddox, S.; Mahoney, J.; et al. Farmers Assuring Responsible Management: Animal Care Reference Manual; FARM: Arlington, VA, USA, 2016. [Google Scholar]
- Krueger, A.; Cruickshank, J.; Trevisi, E.; Bionaz, M. Systems for evaluation of welfare on dairy farms. J. Dairy Res. 2020, 87, 13–19. [Google Scholar] [CrossRef] [PubMed]
- Duffield, T.F. Subclinical ketosis in lactating dairy cattle. Vet. Clin. N. Am. Food Anim. Pract. 2000, 16, 231–253. [Google Scholar] [CrossRef]
- Goff, J.P. The monitoring, prevention, and treatment of milk fever and subclinical hypocalcemia in dairy cows. Vet. J. 2008, 176, 50–57. [Google Scholar] [CrossRef] [PubMed]
- Mezzetti, M.; Minuti, A.; Piccioli-Cappelli, F.; Amadori, M.; Bionaz, M.; Trevisi, E. The role of altered immune function during the dry period in promoting the development of subclinical ketosis in early lactation. J. Dairy Sci. 2019, 102, 9241–9258. [Google Scholar] [CrossRef] [PubMed]
- Ingvartsen, K.L.; Moyes, K. Nutrition, immune function and health of dairy cattle. Animal 2013, 7, 112–122. [Google Scholar] [CrossRef]
- Calamari, L.; Bionaz, M.; Trevisi, E.; Bertoni, G. Preliminary study to validate a model of animal welfare assessment in dairy farms. In Proceedings of the Fifth Congress of the European Society for Agricultural and Food Ethics (EURSAFE), Leuven, Belgium, 2–4 September 2004; pp. 38–42. [Google Scholar]
- Wagner, S.A.; Schimek, D.E.; Cheng, F.C. Body temperature and white blood cell count in postpartum dairy cows. Bov. Pract. 2008, 42, 18–26. [Google Scholar]
- Smith, B.I.; Risco, C.A. Management of periparturient disorders in dairy cattle. Vet. Clin. N. Am. Food Anim. Pract. 2005, 21, 503–521. [Google Scholar] [CrossRef] [PubMed]
- Edwards, J.L.; Tozer, P.R. Using activity and milk yield as predictors of fresh cow disorders. J. Dairy Sci. 2004, 87, 524–531. [Google Scholar] [CrossRef]
- Agricultural Development and Advisory Service Condition scoring of dairy cows. In Proceedings of the Publication 612; Ministry of Agriculture, Fisheries Food: Alhwick, Northumberland, UK, 1986.
- Roche, J.R.; Friggens, N.C.; Kay, J.K.; Fisher, M.W.; Stafford, K.J.; Berry, D.P. Invited review: Body condition score and its association with dairy cow productivity, health, and welfare. J. Dairy Sci. 2009, 92, 5769–5801. [Google Scholar] [CrossRef]
- Calamari, L.; Ferrari, A.; Minuti, A.; Trevisi, E. Assessment of the main plasma parameters included in a metabolic profile of dairy cow based on Fourier Transform mid-infrared spectroscopy: Preliminary results. BMC Vet. Res. 2016, 12, 4. [Google Scholar] [CrossRef]
- Jacometo, C.B.; Osorio, J.S.; Socha, M.; Corrêa, M.N.; Piccioli-Capelli, F.; Trevisi, E.; Loor, J.J. Maternal consumption of organic trace minerals (4-Plex) alters calf systemic and neutrophil mRNA and microRNA indicators of inflammation and oxidative stress. J. Dairy Sci. 2015, 98, 7717–7729. [Google Scholar] [CrossRef] [PubMed]
- Bionaz, M.; Trevisi, E.; Calamari, L.; Librandi, F.; Ferrari, A.; Bertoni, G. Plasma paraoxonase, health, inflammatory conditions, and liver function in transition dairy cows. J. Dairy Sci. 2007, 90, 1740–1750. [Google Scholar] [CrossRef]
- Minuti, A.; Ahmed, S.; Trevisi, E.; Piccioli-Cappelli, F.; Bertoni, G.; Jahan, N.; Bani, P. Experimental acute rumen acidosis in sheep: Consequences on clinical, rumen, and gastrointestinal permeability conditions and blood chemistry. J. Anim. Sci. 2014, 92, 3966–3977. [Google Scholar] [CrossRef] [PubMed]
- Bradley, P.P.; Priebat, D.A.; Christensen, R.D.; Rothsein, G. Measurement of cutaneous inflammation: Estimation of neutrophil content with an enzyme marker. J. Investig. Dermatol. 1982, 78, 206–209. [Google Scholar] [CrossRef] [PubMed]
- Bertoni, G.; Trevisi, E.; Han, X.; Bionaz, M. Effects of inflammatory conditions on liver activity in puerperium period and consequences for performance in dairy cows. J. Dairy Sci. 2008, 91, 3300–3310. [Google Scholar] [CrossRef]
- Caré, S.; Trevisi, E.; Minuti, A.; Ferrari, A.; Loor, J.J.; Calamari, L. Plasma fructosamine during the transition period and its relationship with energy metabolism and inflammation biomarkers in dairy cows. Livest. Sci. 2018, 216, 138–147. [Google Scholar] [CrossRef]
- Hanasand, M.; Omdal, R.; Norheim, K.B.; Gøransson, L.G.; Brede, C.; Jonsson, G. Improved detection of advanced oxidation protein products in plasma. Clin. Chim. Acta 2012, 413, 901–906. [Google Scholar] [CrossRef]
- Jahan, N.; Minuti, A.; Trevisi, E. Assessment of immune response in periparturient dairy cows using ex vivo whole blood stimulation assay with lipopolysaccharides and carrageenan skin test. Vet. Immunol. Immunopathol. 2015, 165, 119–126. [Google Scholar] [CrossRef]
- The R Core Team. R: A Language and Environment for Statistical Computing; R Project for Statistical Computing: Vienna, Austria, 2012. [Google Scholar]
- Friedrichs, K.R.; Harr, K.E.; Freeman, K.P.; Szladovits, B.; Walton, R.M.; Barnhart, K.F.; Blanco-Chavez, J. ASVCP reference interval guidelines: Determination of de novo reference intervals in veterinary species and other related topics. Vet. Clin. Pathol. 2012, 41, 441–453. [Google Scholar] [CrossRef] [PubMed]
- Herdt, T.H.; Stevens, J.B.; Olson, W.G.; Larson, V. Blood concentrations of beta hydroxybutyrate in clinically normal Holstein-Friesian herds and in those with a high prevalence of clinical ketosis. Am. J. Vet. Res. 1981, 42, 503–506. [Google Scholar] [PubMed]
- Reinhardt, T.A.; Lippolis, J.D.; McCluskey, B.J.; Goff, J.P.; Horst, R.L. Prevalence of subclinical hypocalcemia in dairy herds. Vet. J. 2011, 188, 122–124. [Google Scholar] [CrossRef] [PubMed]
- Signorell, A.; Aho, K.; Alfons, A.; Anderegg, N.; Aragon, T.; Arachchige, C.; Arppe, A.; Baddeley, A.; Barton, K.; Bolker, B.; et al. DescTools: Tools for Descriptive Statistics. R Package version 0.99.41. 2019. Available online: https://cran.r-project.org/package=DescTools (accessed on 7 June 2021).
- Dimauro, C.; Macciotta, N.P.P.; Rassu, S.P.G.; Patta, C.; Pulina, G. A bootstrap approach to estimate reference intervals of biochemical variables in sheep using reduced sample sizes. Small Rumin. Res. 2009, 83, 34–41. [Google Scholar] [CrossRef]
- Wohlt, J.E.; Evans, J.L.; Trout, J.R. Blood constituents in lactating holstein cows influenced by hematocrit, sampling site, and diet protein and calcium. J. Dairy Sci. 1984, 67, 2236–2246. [Google Scholar] [CrossRef]
- Shalit, U.; Maltz, E.; Silanikove, N.; Berman, A. Water, sodium, potassium, and chlorine metabolism of dairy cows at the onset of lactation in hot weather. J. Dairy Sci. 1991, 74, 1874–1883. [Google Scholar] [CrossRef]
- Baker, J.R.; O’Connor, J.P.; Metcalf, P.A.; Lawson, M.R.; Johnson, R.N. Clinical usefulness of estimation of serum fructosamine concentration as a screening test for diabetes mellitus. BMJ 1983, 287, 863–867. [Google Scholar] [CrossRef]
- Armbruster, D.A. Fructosamine: Structure, analysis, and clinical usefulness. Clin. Chem. 1987, 33, 2153–2163. [Google Scholar] [CrossRef] [PubMed]
- Herdt, T.H. Ruminant adaptation to negative energy balance. Influences on the etiology of ketosis and fatty liver. Vet. Clin. N. Am. Food Anim. Pract. 2000, 16, 215–230. [Google Scholar] [CrossRef]
- Vazquez-Añon, M.; Bertics, S.; Luck, M.; Grummer, R.R.; Pinheiro, J. Peripartum liver triglyceride and plasma metabolites in dairy cows. J. Dairy Sci. 1994, 77, 6. [Google Scholar] [CrossRef]
- Butler, W.R. Nutrition, negative energy balance and fertility in the postpartum dairy cow. Cattle Pract. 2005, 13, 13–18. [Google Scholar]
- Bell, A.W.; Bauman, D.E. Adaptations of glucose metabolism during pregnancy and lactation. J. Mammary Gland Biol. Neoplasia 1997, 2, 265–278. [Google Scholar] [CrossRef] [PubMed]
- Kvidera, S.K.; Horst, E.A.; Abuajamieh, M.; Mayorga, E.J.; Fernandez, M.V.S.; Baumgard, L.H. Glucose requirements of an activated immune system in lactating Holstein cows. J. Dairy Sci. 2017, 100, 2360–2374. [Google Scholar] [CrossRef]
- Youssef, M.; El-Ashker, M. Significance of insulin resistance and oxidative stress in dairy cattle with subclinical ketosis during the transition period. Trop. Anim. Health Prod. 2017, 49, 239–244. [Google Scholar] [CrossRef] [PubMed]
- Grum, D.E.; Drackley, J.K.; Younker, R.S.; LaCount, D.W.; Veenhuizen, J.J. Nutrition during the dry period and hepatic lipid metabolism of periparturient dairy cows. J. Dairy Sci. 1996, 13, 13–18. [Google Scholar] [CrossRef]
- Reist, M.; Erdin, D.; Von Euw, D.; Tschuemperlin, K.; Leuenberger, H.; Chilliard, Y.; Hammon, H.M.; Morel, C.; Philipona, C.; Zbinden, Y.; et al. Estimation of energy balance at the individual and herd level using blood and milk traits in high-yielding dairy cows. J. Dairy Sci. 2002, 85, 3314–3327. [Google Scholar] [CrossRef]
- Janovick, N.A.; Boisclair, Y.R.; Drackley, J.K. Prepartum dietary energy intake affects metabolism and health during the periparturient period in primiparous and multiparous Holstein cows. J. Dairy Sci. 2011, 94, 1385–1400. [Google Scholar] [CrossRef] [PubMed]
- Bertics, S.J.; Grummer, R.R.; Cadorniga-Valino, C.; Stoddard, E.E. Effect of prepartum dry matter intake on liver triglyceride concentration and early lactation. J. Dairy Sci. 1992, 75, 1914–1922. [Google Scholar] [CrossRef]
- Skaar, T.C.; Grummer, R.R.; Dentine, M.R.; Stauffacher, R.H. Seasonal effects of prepartum and postpartum fat and niacin feeding on lactation performance and lipid metabolism. J. Dairy Sci. 1989, 72, 2028–2038. [Google Scholar] [CrossRef]
- Herdt, T.H. Gastrointestinal physiology and metabolism. In Textbook of Veterinary Physiology; Saunders, W.B., Ed.; Elsevier: Amsterdam, The Netherlands, 2002; pp. 222–224. [Google Scholar]
- Marini, J.C.; Van Amburgh, M.E. Nitrogen metabolism and recycling in Holstein heifers. J. Anim. Sci. 2003, 81, 545–552. [Google Scholar] [CrossRef]
- Odensten, M.O.; Chilliard, Y.; Holtenius, K. Effects of two different feeding strategies during dry-off on metabolism in high-yielding dairy cows. J. Dairy Sci. 2005, 88, 2072–2082. [Google Scholar] [CrossRef]
- Osorio, J.S.; Trevisi, E.; Ji, P.; Drackley, J.K.; Luchini, D.; Bertoni, G.; Loor, J.J. Biomarkers of inflammation, metabolism, and oxidative stress in blood, liver, and milk reveal a better immunometabolic status in peripartal cows supplemented with Smartamine M or MetaSmart. J. Dairy Sci. 2014, 97, 7437–7450. [Google Scholar] [CrossRef] [PubMed]
- Pires, J.A.A.; Delavaud, C.; Faulconnier, Y.; Pomiès, D.; Chilliard, Y. Effects of body condition score at calving on indicators of fat and protein mobilization of periparturient Holstein-Friesian cows. J. Dairy Sci. 2013, 96, 6423–6439. [Google Scholar] [CrossRef] [PubMed]
- McCabe, C.J.; Boerman, J.P. Invited review: Quantifying protein mobilization in dairy cows during the transition period. Appl. Anim. Sci. 2020, 36, 389–396. [Google Scholar] [CrossRef]
- Zoccali, C.; Maio, R.; Tripepi, G.; Mallamaci, F.; Perticone, F. Inflammation as a mediator of the link between mild to moderate renal insufficiency and endothelial dysfunction in essential hypertension. J. Am. Soc. Nephrol. 2006, 4, S64–S68. [Google Scholar] [CrossRef] [PubMed]
- Davison, J.M.; Hytten, F.E. Glomerular filtration during and after pregnancy. BJOG An. Int. J. Obstet. Gynaecol. 1974, 81, 588–595. [Google Scholar] [CrossRef]
- Thompson, M.; Ray, U.; Yu, R.; Hudspeth, A.; Smillie, M.; Jordan, N.; Bartle, J. Kidney function as a determinant of HDL and triglyceride concentrations in the australian population. J. Clin. Med. 2016, 5, 35. [Google Scholar] [CrossRef] [PubMed]
- Horst, R.L.; Goff, J.P.; Reinhardt, T.A. Calcium and vitamin D metabolism during lactation. J. Mammary Gland Biol. Neoplasia 1997, 2, 253–263. [Google Scholar] [CrossRef]
- Ramberg, C.F.; Mayer, G.P.; Kronfeld, D.S.; Phang, J.M.; Berman, M. Calcium kinetics in cows during late pregnancy, parturition, and early lactation. Am. J. Physiol. 1970, 219, 1166–1177. [Google Scholar] [CrossRef] [PubMed]
- Cavestany, D.; Blanc, J.E.; Kulcsar, M.; Uriarte, G.; Chilibroste, P.; Meikle, A.; Febel, H.; Ferraris, A.; Krall, E. Studies of the transition cow under a pasture-based milk production system: Metabolic profiles. J. Vet. Med. Ser. A Physiol. Pathol. Clin. Med. 2005, 52, 1–7. [Google Scholar] [CrossRef]
- Peterson, A.B.; Orth, M.W.; Goff, J.P.; Beede, D.K. Periparturient responses of multiparous holstein cows fed different dietary phosphorus concentrations prepartum. J. Dairy Sci. 2005, 88, 3582–3594. [Google Scholar] [CrossRef]
- Goff, J.P.; Liesegang, A.; Horst, R.L. Diet-induced pseudohypoparathyroidism: A hypocalcemia and milk fever risk factor. J. Dairy Sci. 2014, 97, 1520–1528. [Google Scholar] [CrossRef] [PubMed]
- Goff, J.P. Treatment of calcium, phosphorus, and magnesium balance disorders. Vet. Clin. N. Am. Food Anim. Pract. 1999, 15, 619–639. [Google Scholar] [CrossRef]
- Calamari, L.; Soriani, N.; Panella, G.; Petrera, F.; Minuti, A.; Trevisi, E. Rumination time around calving: An early signal to detect cows at greater risk of disease. J. Dairy Sci. 2014, 97, 3635–3647. [Google Scholar] [CrossRef] [PubMed]
- Moyer, J.H.; Mills, L.C.; Smith, C.P. Hexamethonium—Its effect on glomerular filtration rate, maximal tubular function, and renal excretion of electrolytes. J. Clin. Investig. 1953, 32, 172–184. [Google Scholar] [CrossRef]
- Weeth, H.J.; Lesperance, A.L. Renal function of cattle under various water and salt loads. J. Anim. Sci. 1965, 24, 441–447. [Google Scholar] [CrossRef]
- Harshfield, G.A.; Dong, Y.; Kapuku, G.K.; Zhu, H.; Hanevold, C.D. Stress-induced sodium retention and hypertension: A review and hypothesis. Curr. Hypertens. Rep. 2009, 11, 29–34. [Google Scholar] [CrossRef]
- Committee on Mineral Nutrition. Tracing and Treating Mineral. Disorders in Dairy Cattle; Centre for Agricultural Publishing and Documentation: Wageningen, The Netherlands, 1973. [Google Scholar]
- Pryor, W.J. Plasma zinc status of dairy cattle in the periparturient period. N. Z. Vet. J. 1976, 24, 57–58. [Google Scholar] [CrossRef]
- Dufty, J.H.; Bingley, J.B.; Cove, L.Y. The plasma zinc concentration of nonpregnant, pregnant and parturient hereford cattle. Aust. Vet. J. 1977, 53, 519–522. [Google Scholar] [CrossRef]
- Rodriguez-Jimenez, S.; Haerr, K.J.; Trevisi, E.; Loor, J.J.; Cardoso, F.C.; Osorio, J.S. Prepartal standing behavior as a parameter for early detection of postpartal subclinical ketosis associated with inflammation and liver function biomarkers in peripartal dairy cows. J. Dairy Sci. 2018, 101, 8224–8235. [Google Scholar] [CrossRef]
- Graugnard, D.E.; Moyes, K.M.; Trevisi, E.; Khan, M.J.; Keisler, D.; Drackley, J.K.; Bertoni, G.; Loor, J.J. Liver lipid content and inflammometabolic indices in peripartal dairy cows are altered in response to prepartal energy intake and postpartal intramammary inflammatory challenge. J. Dairy Sci. 2013, 96, 918–935. [Google Scholar] [CrossRef] [PubMed]
- Lumeij, J.T.; De Bruijne, J.J.; Slob, A.; Wolfswinkel, J.; Rothuizen, J. Enzyme activities in tissues and elimination half-lives of homologous muscle and liver enzymes in the racing pigeon (Columba Livia domestica). Avian Pathol. 1988, 17, 851–864. [Google Scholar] [CrossRef]
- Sordillo, L.M.; Raphael, W. Significance of metabolic stress, lipid mobilization, and inflammation on transition cow disorders. Vet. Clin. N. Am. Food Anim. Pract. 2013, 29, 267–278. [Google Scholar] [CrossRef] [PubMed]
- Faith, M.; Sukumaran, A.; Pulimood, A.B.; Jacob, M. How reliable an indicator of inflammation is myeloperoxidase activity? Clin. Chim. Acta 2008, 396, 23–25. [Google Scholar] [CrossRef] [PubMed]
- Schreiber, G.; Howlettf, G.; Nagashima, M.; Millership, A.; Martin, H.; Urban, J.; Kotlerg, L. The acute phase response of plasma protein synthesis during experimental inflammation. J. Biol. Chem. 1982, 257, 10271–10277. [Google Scholar] [CrossRef]
- Fleck, A. Clinical and nutritional aspects of changes in acute-phase proteins during inflammation. Proc. Nutr. Soc. 1989, 48, 347–354. [Google Scholar] [CrossRef] [PubMed]
- Ceciliani, F.; Ceron, J.J.; Eckersall, P.D.; Sauerwein, H. Acute phase proteins in ruminants. J. Proteomics 2012, 75, 4207–4231. [Google Scholar] [CrossRef] [PubMed]
- Giblett, E.R. Haptoglobin: A review. Int. J. Transfus. Med. 1961, 6, 513–524. [Google Scholar] [CrossRef] [PubMed]
- Humblet, M.-F.; Guyot, H.; Boudry, B.; Mbayahi, F.; Hanzen, C.; Rollin, F.; Godeau, J.-M. Relationship between haptoglobin, serum amyloid A, and clinical status in a survey of dairy herds during a 6-month period. Vet. Clin. Pathol. 2006, 35, 188–193. [Google Scholar] [CrossRef]
- Trevisi, E.; Bertoni, G. Some physiological and biochemical methods for acute and chronic stress evaluationin dairy cows. Ital. J. Anim. Sci. 2009, 8, 265–286. [Google Scholar] [CrossRef]
- Ghiselli, A.; Serafini, M.; Maiani, G.; Azzini, E.; Ferro-Luzzi, A. A fluorescence-based method for measuring total plasma antioxidant capability. Free Radic. Biol. Med. 1995, 18, 29–36. [Google Scholar] [CrossRef]
- Benzie, I.F.; Strain, J.J. The ferric reducing ability of plasma (FRAP) as a measure of “antioxidant power”: The FRAP assay. Anal. Biochem. 1996, 239, 70–76. [Google Scholar] [CrossRef] [PubMed]
- Sordillo, L.M.; Aitken, S.L. Impact of oxidative stress on the health and immune function of dairy cattle. Vet. Immunol. Immunopathol. 2009, 128, 104–109. [Google Scholar] [CrossRef] [PubMed]
- Celi, P.; Gabai, G. Oxidant/antioxidant balance in animal nutrition and health: The role of protein oxidation. Front. Vet. Sci. 2015, 2, 48. [Google Scholar] [CrossRef] [PubMed]
- Celi, P. Oxidative stress in ruminants. In Studies on Veterinary Medicine. Oxidative Stress in Applied Basic Research and Clinical Practice; Mandelker, L., Vajdovich, P., Eds.; Humana Press: Totowa, NJ, USA, 2011; pp. 191–231. ISBN 978-1-61779-070-6. [Google Scholar]
- Sordillo, L.M.; Contreras, G.A.; Aitken, S.L. Metabolic factors affecting the inflammatory response of periparturient dairy cows. Anim. Health Res. Rev. 2009, 10, 53–63. [Google Scholar] [CrossRef] [PubMed]
- Reid, D.; Toole, B.J.; Knox, S.; Talwar, D.; Harten, J.; O’Reilly, D.S.J.; Blackwell, S.; Kinsella, J.; McMillan, D.C.; Wallace, A.M. The relation between acute changes in the systemic inflammatory response and plasma 25-hydroxyvitamin D concentrations after elective knee arthroplasty. Am. J. Clin. Nutr. 2011, 93, 1006–1011. [Google Scholar] [CrossRef]
- Bertoni, G.; Grossi, P.; Trevisi, E. Use of nutraceuticals for improving animal health during the transition period of dairy cows. In Enhancing Animal Welfare and Farmer Income through Strategic Animal Feeding. Some Case Studies; Harinder, P.S., Makkar, Eds.; Food and Agriculture Organization of the United Nations (FAO): Rome, Italy, 2013; pp. 79–83. ISBN 9789251074527. [Google Scholar]
- Jones, M.L.; Allison, R.W. Evaluation of the ruminant complete blood cell count. Vet. Clin. N. Am. Food Anim. Pract. 2007, 23, 377–402. [Google Scholar] [CrossRef] [PubMed]
- Skinner, J.G.; Brown, R.A.; Roberts, L. Bovine haptoglobin response in clinically defined field conditions. Vet. Rec. 1991, 128, 147–149. [Google Scholar] [CrossRef] [PubMed]
- Sunderman, F.W.; Nomoto, S. Measurement of human serum ceruloplasmin by its p-phenylenediamine oxidase activity. Clin. Chem. 1970, 16, 903–910. [Google Scholar] [CrossRef]
- Ferré, N.; Camps, J.; Prats, E.; Vilella, E.; Paul, A.; Figuera, L.; Joven, J. Serum paraoxonase activity: A new additional test for the improved evaluation of chronic liver damage. Clin. Chem. 2002, 48, 261–268. [Google Scholar] [CrossRef]


| Farm | 1 | 2 | 3 | 4 | 5 | 6 | 7 | 8 | 9 | 10 | 11 |
|---|---|---|---|---|---|---|---|---|---|---|---|
| Average characteristics, unit | |||||||||||
| Milking system 1 | MP | MP | MP | MP | MP | AU | MP | MP | MP | MP | MP |
| MF 2, number | 2 | 2 | 2 | 2 | 2 | 2.9 | 2 | 2 | 2 | 2 | 2 |
| Days open, d | 99 | 109 | 93 | 104 | 119 | 120 | 139 | 118 | 129 | 112 | 128 |
| Lactating cows, number | 184 | 210 | 394 | 864 | 280 | 107 | 311 | 304 | 175 | 378 | 338 |
| ECM 3, kg | 11,291 | 10,349 | 12,435 | 10,841 | 11,203 | 10,055 | 10,007 | 10,098 | 10,025 | 10,147 | 9695 |
| Welfare score, % | |||||||||||
| Environment cluster | 75 | 75 | 70 | 80 | 70 | 77 | 75 | 66 | 67 | 70 | 66 |
| Feeding cluster | 88 | 87 | 83 | 76 | 87 | 86 | 82 | 83 | 89 | 76 | 84 |
| Animal cluster | 79 | 74 | 80 | 74 | 73 | 67 | 71 | 76 | 70 | 72 | 70 |
| Total IDSW score 4 | 80 | 78 | 78 | 77 | 76 | 76 | 76 | 75 | 75 | 73 | 73 |
| Cows enrolled, number | |||||||||||
| Dry phase | 6 | 6 | 6 | 21 | 10 | 6 | 7 | 6 | 10 | 6 | 8 |
| Postpartum phase | 6 | 6 | 4 | 28 | 10 | 5 | 6 | 6 | 7 | 7 | 18 |
| Early lactation phase | 7 | 6 | 8 | 13 | 10 | 6 | 6 | 2 | 6 | 6 | 14 |
| Late lactation phase | 8 | 6 | 8 | 11 | 8 | 6 | 8 | 6 | 8 | 6 | 7 |
| Item, Unit 1 | Physiological Phases (Days from Calving) | |||||||||||
|---|---|---|---|---|---|---|---|---|---|---|---|---|
| Dry (−30; −10) | Postpartum (+3; +7) | Early Lactation (+28; +45) | Late Lactation (+160; +305) | |||||||||
| n | Skew 2 | Kurt 3 | n | Skew 2 | Kurt 3 | n | Skew 2 | Kurt 3 | n | Skew 2 | Kurt 3 | |
| PCV, L/L | 75 | 0.16 | −0.69 | 78 | 0.36 | −0.39 | 59 | −0.13 | −0.68 | 65 | 0.12 | −0.20 |
| Glucose, mmol/L | 74 | 0.10 | −0.26 | 81 | 0.18 | −0.14 | 60 | 0.27 | −0.40 | 64 | 0.26 | −0.19 |
| Fructosamine, mmol/L | 75 | 0.46 | −0.18 | 80 | 0.38 | −0.59 | 62 | 0.37 | −0.34 | 65 | −0.11 | −0.35 |
| NEFA, mmol/L | 75 | 0.93 | −0.10 | 80 | 1.10 | 0.92 | 63 | 1.17 | 1.33 | 64 | 1.16 | 1.22 |
| BHB ‡, mmol/L | 75 | 0.25 | −0.33 | 80 | −0.25 | −0.52 | 63 | 0.21 | 0.37 | 64 | 0.53 | −0.48 |
| Triglycerides, mmol/L | 76 | 0.52 | −0.65 | 75 | 0.32 | −0.36 | 63 | −0.21 | −0.21 | 65 | 0.06 | −0.57 |
| Urea, mmol/L | 76 | 0.31 | −0.55 | 81 | 0.52 | −0.51 | 63 | 0.07 | −0.49 | 65 | −0.06 | −0.41 |
| Creatinine, µmol/L | 75 | 0.29 | −0.44 | 80 | 0.24 | −0.41 | 63 | 0.16 | −0.45 | 64 | 0.06 | −0.59 |
| Ca, mmol/L | 76 | 0.30 | −0.32 | 78 | −0.08 | −0.42 | 62 | −0.05 | −0.40 | 65 | −0.33 | −0.36 |
| P, mmol/L | 65 | 0.14 | −0.20 | 81 | 0.45 | −0.15 | 63 | −0.42 | −0.38 | 65 | −0.09 | −0.58 |
| Mg, mmol/L | 75 | 0.19 | −0.57 | 81 | 0.02 | −0.91 | 63 | 0.02 | −0.91 | 65 | −0.04 | −0.68 |
| Na, mmol/L | 76 | −0.11 | −1.09 | 80 | 0.05 | −0.73 | 63 | 0.07 | −0.86 | 65 | 0.39 | −0.69 |
| K, mmol/L | 75 | 0.29 | −0.67 | 79 | 0.13 | −0.26 | 62 | 0.07 | −0.35 | 63 | −0.26 | −0.44 |
| Cl, mmol/L | 76 | −0.26 | −0.73 | 79 | −0.22 | −0.89 | 63 | −0.27 | −0.38 | 64 | −0.03 | −0.68 |
| Zn ‡, mmol/L | 76 | −0.15 | −0.05 | 81 | 0.18 | −0.13 | 63 | −0.10 | 0.78 | 62 | 1.19 | 3.84 |
| Total bilirubin, µmol/L | 73 | 0.03 | −0.82 | 75 | 0.52 | −0.74 | 61 | 0.28 | −0.22 | 65 | −0.05 | −0.49 |
| AST, U/L | 75 | 0.62 | −0.12 | 72 | 0.44 | −0.30 | 56 | 0.16 | −0.73 | 58 | 0.40 | −0.70 |
| GGT, U/L | 75 | 0.57 | −0.49 | 71 | 0.30 | −0.14 | 57 | 0.08 | 0.04 | 57 | 0.25 | −0.25 |
| ALP, U/L | 70 | 0.18 | −0.56 | 78 | 0.33 | −0.69 | 62 | 0.68 | −0.21 | 65 | 0.36 | −0.26 |
| Myeloperoxidase, U/L | 73 | 0.08 | −0.42 | 77 | −0.10 | −0.44 | 57 | 0.37 | −0.61 | 64 | −0.10 | −0.29 |
| Total protein, g/L | 76 | −0.18 | −0.26 | 81 | 0.01 | −0.27 | 63 | 0.22 | −0.63 | 62 | 0.09 | −0.22 |
| Globulin, g/L | 76 | 0.28 | −0.12 | 80 | 0.01 | −0.27 | 63 | 0.40 | −0.51 | 65 | 0.70 | 0.10 |
| Haptoglobin, g/L | 71 | 0.56 | 0.09 | 81 | 0.37 | −0.71 | 53 | 0.20 | −0.07 | 55 | 0.61 | −0.59 |
| Ceruloplasmin, µmol/L | 76 | 0.26 | 0.09 | 81 | 0.16 | −0.41 | 63 | 0.15 | −0.32 | 62 | 0.24 | −0.21 |
| Albumin, g/L | 75 | −0.14 | −0.68 | 77 | −0.30 | −0.15 | 63 | −0.29 | −0.15 | 63 | −0.15 | −0.38 |
| Cholesterol, mmol/L | 69 | 0.35 | −0.08 | 80 | 0.20 | −0.22 | 63 | 0.15 | −0.36 | 61 | −0.28 | −0.41 |
| Retinol, µmol/L 4 | 73 | −0.26 | −0.51 | 81 | 0.29 | −0.73 | 57 | −0.25 | −0.54 | 65 | 0.32 | −0.61 |
| Paraoxonase, U/mL | 72 | 0.48 | −0.30 | 81 | 0.44 | 0.03 | 61 | 0.10 | −0.09 | 65 | 0.65 | −0.29 |
| Tocopherol, µmol/L | 73 | 0.18 | −0.46 | 80 | 0.45 | −0.40 | 61 | 0.39 | −0.62 | 65 | 0.16 | −0.75 |
| β-Carotene, µmol/L | 70 | 0.82 | −0.30 | 69 | 0.81 | 0.28 | 59 | 0.49 | −0.21 | 59 | 0.21 | −1.01 |
| FRAP, mmol/L | 73 | 0.29 | −0.74 | 78 | 0.29 | −0.97 | 62 | 0.58 | −0.34 | 65 | −0.47 | −0.53 |
| Thiol groups, mmol/L | 75 | 0.40 | −0.46 | 81 | 0.15 | −0.34 | 62 | 0.31 | −0.50 | 64 | −0.18 | −0.84 |
| ROMt, mg H2O2/dL | 75 | 0.28 | −0.26 | 77 | 0.03 | −0.34 | 63 | −0.01 | −0.82 | 65 | −0.05 | −0.81 |
| AOPP ‡, mmol/L | 76 | 0.23 | −1.13 | 81 | 0.57 | −1.05 | 62 | 0.04 | −1.65 | 65 | −0.14 | −1.11 |
| Item 1 | R2 | Physiological Phases (Days from Calving) | p-Value 2 | ||||||||
|---|---|---|---|---|---|---|---|---|---|---|---|
| Dry (−30; −10) | Postpartum (+3; +7) | Early Lactation (+28; +45) | Late Lactation (+160; +305) | DP × PP | DP × EL | DP × LP | PP × EL | PP × LP | EL × LP | ||
| PCV, L/L | 0.29 | 0.34 ± 0.03 | 0.34 ± 0.02 | 0.30 ± 0.02 | 0.33 ± 0.03 | ns | *** | *** | *** | *** | *** |
| Glucose, mmol/L | 0.29 | 4.22 ± 0.23 | 3.87 ± 0.34 | 4.15 ± 0.26 | 4.35 ± 0.28 | *** | ns | *** | *** | *** | *** |
| Fructosamine, mmol/L | 0.11 | 288 ± 22.3 | 273 ± 27.2 | 278 ± 28.8 | 298 ± 28.2 | *** | * | ns | ns | *** | *** |
| NEFA, mmol/L | 0.55 | 0.18 ± 0.11 | 0.67 ± 0.33 | 0.33 ± 0.19 | 0.11 ± 0.04 | *** | *** | *** | *** | *** | *** |
| BHB ‡, mmol/L | 0.26 | 0.42 ± 0.10 | 0.67 ± 0.21 | 0.50 ± 0.19 | 0.45 ± 0.17 | *** | ns | ns | *** | *** | ns |
| Triglycerides, mmol/L | 0.71 | 0.22 ± 0.05 | 0.10 ± 0.02 | 0.10 ± 0.02 | 0.10 ± 0.02 | *** | *** | *** | ns | ns | ns |
| Urea, mmol/L | 0.11 | 4.22 ± 1.37 | 4.36 ± 1.20 | 4.98 ± 1.28 | 5.22 ± 0.78 | ns | *** | *** | *** | *** | ns |
| Creatinine, µmol/L | 0.31 | 97.5 ± 10.5 | 91.0 ± 8.47 | 84.3 ± 6.29 | 84.8 ± 5.50 | *** | *** | *** | *** | *** | ns |
| Ca, mmol/L | 0.23 | 2.57 ± 0.11 | 2.40 ± 0.15 | 2.55 ± 0.13 | 2.56 ± 0.13 | *** | ns | ns | *** | *** | ns |
| P, mmol/L | 0.20 | 2.02 ± 0.20 | 1.62 ± 0.45 | 1.63 ± 0.34 | 1.86 ± 0.29 | *** | *** | *** | ns | *** | *** |
| Mg, mmol/L | 0.32 | 0.99 ± 0.08 | 0.91 ± 0.13 | 1.09 ± 0.10 | 1.06 ± 0.10 | *** | *** | *** | *** | *** | ns |
| Na, mmol/L | 0.15 | 145 ± 4.25 | 147 ± 3.56 | 144 ± 4.14 | 143 ± 3.91 | *** | ns | *** | *** | *** | *** |
| K, mmol/L | 0.01 | 4.30 ± 0.35 | 4.23 ± 0.38 | 4.23 ± 0.48 | 4.18 ± 0.30 | ns | ns | ns | ns | ns | ns |
| Cl, mmol/L | 0.19 | 106 ± 3.52 | 106 ± 2.94 | 104 ± 3.15 | 103 ± 2.68 | ns | *** | *** | *** | *** | *** |
| Zn ‡, mmol/L | 0.04 | 14.3 ± 2.54 | 12.6 ± 3.69 | 13.2 ± 2.71 | 13.6 ± 3.74 | *** | * | * | ns | ns | ns |
| Total bilirubin, µmol/L | 0.54 | 1.67 ± 0.75 | 5.65 ± 2.79 | 2.31 ± 1.00 | 1.54 ± 0.51 | *** | *** | ns | *** | *** | *** |
| AST, U/L | 0.28 | 83.8 ± 14.9 | 109 ± 15.5 | 95.2 ± 12.7 | 105 ± 21.4 | *** | *** | *** | *** | ns | *** |
| GGT, U/L | 0.34 | 24.3 ± 6.81 | 20.5 ± 4.03 | 25.4 ± 4.52 | 31.6 ± 6.21 | *** | ns | *** | *** | *** | *** |
| ALP, U/L | 0.04 | 48.5 ± 13.9 | 49.2 ± 15.6 | 42.8 ± 13.6 | 49.7 ± 12.8 | ns | ns | ns | ns | ns | ns |
| Myeloperoxidase, U/L | 0.17 | 438 ± 54.4 | 504 ± 53.3 | 461 ± 55.5 | 458 ± 61.0 | *** | ns | ns | *** | *** | ns |
| Total protein, g/L | 0.41 | 80.0 ± 5.23 | 74.0 ± 4.82 | 82.3 ± 4.35 | 83.8 ± 3.84 | *** | *** | *** | *** | *** | ns |
| Globulin, g/L | 0.24 | 43.4 ± 5.51 | 38.6 ± 4.14 | 44.6 ± 5.18 | 45.7 ± 5.01 | *** | * | *** | *** | *** | ns |
| Haptoglobin, g/L | 0.55 | 0.17 ± 0.06 | 0.84 ± 0.51 | 0.18 ± 0.07 | 0.13 ± 0.07 | *** | ns | ns | *** | *** | ns |
| Ceruloplasmin, µmol/L | 0.25 | 2.22 ± 0.39 | 2.93 ± 0.51 | 2.46 ± 0.56 | 2.39 ± 0.45 | *** | *** | * | *** | *** | ns |
| Albumin, g/L | 0.27 | 36.6 ± 1.60 | 35.3 ± 2.17 | 37.6 ± 2.21 | 38.5 ± 1.75 | *** | *** | *** | *** | *** | *** |
| Cholesterol, mmol/L | 0.73 | 3.05 ± 0.65 | 2.06 ± 0.46 | 4.66 ± 1.34 | 6.13 ± 1.22 | *** | *** | *** | *** | *** | *** |
| Retinol, µmol/L 3 | 0.46 | 1.04 ± 0.20 | 0.81 ± 0.27 | 1.23 ± 0.22 | 1.41 ± 0.28 | *** | *** | *** | *** | *** | *** |
| Paraoxonase, U/mL | 0.27 | 87.1 ± 16.1 | 73.2 ± 18.1 | 101.6 ± 20.3 | 95.0 ± 16.7 | *** | *** | *** | *** | *** | *** |
| Tocopherol, µmol/L | 0.56 | 5.03 ± 2.03 | 3.49 ± 1.13 | 7.26 ± 2.63 | 10.93 ± 3.80 | *** | *** | *** | *** | *** | *** |
| β-Carotene, µmol/L | 0.41 | 4.02 ± 1.94 | 2.32 ± 0.98 | 3.64 ± 1.60 | 6.74 ± 2.84 | *** | ns | *** | *** | *** | *** |
| FRAP, mmol/L | 0.21 | 126 ± 13.6 | 150 ± 25.4 | 149 ± 21.7 | 149 ± 18.0 | *** | *** | *** | ns | ns | ns |
| Thiol groups, mmol/L | 0.02 | 338 ± 59.1 | 351 ± 73.3 | 354 ± 61.8 | 361 ± 64.9 | ns | ns | ns | ns | ns | ns |
| ROMt, mg H2O2/dL | 0.18 | 13.5 ± 3.10 | 16.6 ± 3.40 | 13.5 ± 3.63 | 12.9 ± 2.71 | *** | ns | ns | *** | *** | ns |
| AOPP ‡, mmol/L | 0.11 | 63.8 ± 23.3 | 46.6 ± 18.7 | 59.0 ± 22.5 | 63.9 ± 19.0 | *** | ns | ns | *** | *** | ns |
| Item, Unit 1 | Physiological Phases (Days from Calving) | |||||||||||||||
|---|---|---|---|---|---|---|---|---|---|---|---|---|---|---|---|---|
| Dry (−30; −10) | Postpartum (+3; +7) | Early Lactation (+28; +45) | Late (+160; +305) | |||||||||||||
| Lower Limit | Upper Limit | Lower Limit | Upper Limit | Lower Limit | Upper Limit | Lower Limit | Upper Limit | |||||||||
| PCV, L/L | 0.28 | (0.28–0.29) | 0.39 | (0.38–0.40) | 0.28 | (0.28–0.29) | 0.39 | (0.38–0.40) | 0.25 | (0.24–0.26) | 0.34 | (0.33–0.35) | 0.27 | (0.26–0.29) | 0.37 | (0.36–0.39) |
| Glucose, mmol/L | 3.70 | (3.63–3.77) | 4.68 | (4.60–4.75) | 3.19 | (3.06–3.32) | 4.55 | (4.43–4.68) | 3.70 | (3.63–3.77) | 4.68 | (4.60–4.75) | 3.80 | (3.69–3.92) | 4.90 | (4.78–5.02) |
| Fructosamine, mmol/L | 242 | (235–250) | 343 | (336–351) | 220 | (212–228) | 331 | (323–339) | 220 | (212–228) | 331 | (323–339) | 242 | (235–250) | 343 | (336–351) |
| NEFA, mmol/L | 0.00 | (0.00–0.01) | 0.39 | (0.34–0.43) | 0.01 | (0.00–0.14) | 1.33 | (1.21–1.46) | 0.00 | (0.00–0.03) | 0.70 | (0.62–0.78) | 0.02 | (0.01–0.04) | 0.18 | (0.17–0.20) |
| BHB, mmol/L | 0.13 | (0.10–0.17) | 0.77 | (0.74–0.81) | 0.26 | (0.19–0.34) | 1.08 | (1.00–1.16) | 0.13 | (0.10–0.17) | 0.77 | (0.74–0.81) | 0.13 | (0.10–0.17) | 0.77 | (0.74–0.81) |
| Triglycerides, mmol/L | 0.11 | (0.09–0.13) | 0.32 | (0.30–0.34) | 0.06 | (0.06–0.06) | 0.14 | (0.13–0.14) | 0.06 | (0.06–0.06) | 0.14 | (0.13–0.14) | 0.06 | (0.06–0.06) | 0.14 | (0.13–0.14) |
| Urea, mmol/L | 1.70 | (1.35–2.05) | 6.88 | (6.53–7.23) | 1.70 | (1.35–2.05) | 6.88 | (6.53–7.23) | 3.04 | (2.73–3.35) | 7.17 | (6.86–7.48) | 3.04 | (2.73–3.35) | 7.17 | (6.86–7.48) |
| Creatinine, µmol/L | 76.6 | (72.5–80.7) | 118 | (114–122) | 74.2 | (71.0–77.4) | 108 | (105–111) | 72.9 | (71.1–74.7) | 96.2 | (94.4–97.9) | 72.9 | (71.1–74.7) | 96.2 | (94.4–97.9) |
| Ca, mmol/L | 2.32 | (2.29–2.35) | 2.81 | (2.78–2.84) | 2.11 | (2.05–2.16) | 2.7 | (2.64–2.76) | 2.32 | (2.29–2.35) | 2.81 | (2.78–2.84) | 2.32 | (2.29–2.35) | 2.81 | (2.78–2.84) |
| P, mmol/L | 1.62 | (1.54–1.70) | 2.42 | (2.33–2.50) | 0.80 | (0.69–0.92) | 2.44 | (2.32–2.55) | 0.80 | (0.69–0.92) | 2.44 | (2.32–2.55) | 1.30 | (1.18–1.42) | 2.43 | (2.31–2.55) |
| Mg, mmol/L | 0.8 | (0.81–0.87) | 1.14 | (1.11–1.17) | 0.67 | (0.62–0.71) | 1.16 | (1.11–1.21) | 0.88 | (0.85–0.91) | 1.27 | (1.24–1.30) | 0.88 | (0.85–0.91) | 1.27 | (1.24–1.30) |
| Na, mmol/L | 2.32 | (2.29–2.35) | 2.81 | (2.78–2.84) | 140 | (139–141) | 154 | (153–156) | 2.32 | (2.29–2.35) | 2.81 | (2.78–2.84) | 135 | (133–136) | 150 | (149–152) |
| K, mmol/L | 3.47 | (3.40–3.55) | 5.00 | (4.92–5.08) | 3.47 | (3.40–3.55) | 5.00 | (4.92–5.08) | 3.47 | (3.40–3.55) | 5.00 | (4.92–5.08) | 3.47 | (3.40–3.55) | 5.00 | (4.92–5.08) |
| Cl, mmol/L | 99.6 | (98.7–101) | 113 | (112–114) | 99.6 | (98.7–101) | 113 | (112–114) | 97.7 | (96.3–99.0) | 110 | (109–112) | 97.3 | (96.2–98.5) | 108 | (107–109) |
| Zn, mmol/L | 9.26 | (8.28–10.3) | 19.4 | (18.4–20.3) | 6.15 | (5.34–6.97) | 20.0 | (19.2–20.8) | 6.15 | (5.34–6.97) | 20.0 | (19.2–20.8) | 6.15 | (5.34–6.97) | 20.0 | (19.2–20.8) |
| Total bilirubin, µmol/L | 0.33 | (0.14–0.51) | 2.89 | (2.71–3.08) | 0.21 | (0.00–1.28) | 11.1 | (10.0–12.2) | 0.33 | (0.00–0.76) | 4.29 | (3.86–4.72) | 0.33 | (0.14–0.51) | 2.89 | (2.71–3.08) |
| AST, U/L | 54.2 | (48.3–60.0) | 113 | (108–119) | 70.8 | (65.4–76.2) | 143 | (138–149) | 69.8 | (64.1–75.6) | 120 | (115–126) | 70.8 | (65.4–76.2) | 143 | (138–149) |
| GGT, U/L | 12.9 | (11.1–14.6) | 36.7 | (34.9–38.4) | 12.5 | (10.8–14.1) | 28.5 | (26.8–30.1) | 12.9 | (11.1–14.6) | 36.7 | (34.9–38.4) | 19.3 | (16.5–22.1) | 44.0 | (41.2–46.7) |
| ALP, U/L | 19.5 | (16.6–22.4) | 75.9 | (73.0–78.8) | 19.5 | (16.6–22.4) | 75.9 | (73.0–78.8) | 19.5 | (16.6–22.4) | 75.9 | (73.0–78.8) | 19.5 | (16.6–22.4) | 75.9 | (73.0–78.8) |
| Myeloperoxidase, U/L | 336 | (322–350) | 566 | (552–580) | 398 | (378–419) | 609 | (589–630) | 336 | (322–350) | 566 | (552–580) | 336 | (322–350) | 566 | (552–580) |
| Total protein, g/L | 69.5 | (67.4–71.6) | 90.5 | (88.4–92.5) | 64.3 | (62.5–66.1) | 83.6 | (81.8–85.4) | 74.7 | (73.4–75.9) | 91.4 | (90.1–92.7) | 74.7 | (73.4–75.9) | 91.4 | (90.1–92.7) |
| Globulin, g/L | 32.5 | (30.4–34.7) | 54.4 | (52.2–56.5) | 30.4 | (28.9–32.0) | 46.8 | (45.3–48.4) | 35.1 | (33.6–36.6) | 55.2 | (53.7–56.7) | 35.1 | (33.6–36.6) | 55.2 | (53.7–56.7) |
| Haptoglobin, g/L | 0.02 | (0.00–0.03) | 0.30 | (0.28–0.32) | 0.00 | (0.00–0.02) | 1.86 | (1.66–2.05) | 0.02 | (0.00–0.03) | 0.30 | (0.28–0.32) | 0.02 | (0.00–0.03) | 0.30 | (0.28–0.32) |
| Ceruloplasmin, µmol/L | 1.44 | (1.29–1.59) | 3.00 | (2.84–3.15) | 1.92 | (1.73–2.11) | 3.94 | (3.75–4.13) | 1.42 | (1.27–1.58) | 3.43 | (3.28–3.59) | 1.42 | (1.27–1.58) | 3.43 | (3.28–3.59) |
| Albumin, g/L | 33.4 | (32.8–34.1) | 39.9 | (39.2–40.5) | 31.0 | (30.2–31.9) | 39.6 | (38.8–40.5) | 33.2 | (32.3–34.2) | 42.0 | (41.1–43.0) | 35.0 | (34.2–35.7) | 42.0 | (41.2–42.7) |
| Cholesterol, mmol/L | 1.75 | (1.49–2.02) | 4.34 | (4.07–4.60) | 1.14 | (0.97–1.32) | 2.97 | (2.80–3.14) | 1.98 | (1.40–2.56) | 7.35 | (6.77–7.93) | 3.68 | (3.15–4.22) | 8.57 | (8.03–9.10) |
| Retinol, µmol/L 2 | 0.65 | (0.57–0.73) | 1.43 | (1.36–1.51) | 0.29 | (0.19–0.39) | 1.34 | (1.24–1.44) | 0.78 | (0.68–0.88) | 1.67 | (1.57–1.77) | 0.86 | (0.75–0.98) | 1.96 | (1.84–2.07) |
| Paraoxonase, U/mL | 55.1 | (48.6–61.5) | 119 | (113–126) | 37.1 | (30.2–43.9) | 109 | (102–116) | 61.7 | (52.9–70.4) | 142 | (133–150) | 61.9 | (54.9–68.9) | 128 | (121–135) |
| Tocopherol, µmol/L | 1.04 | (0.24–1.84) | 9.03 | (8.23–9.83) | 1.26 | (0.83–1.68) | 5.72 | (5.30–6.15) | 2.09 | (0.96–3.22) | 12.4 | (11.3–13.6) | 3.38 | (1.78–4.98) | 18.5 | (16.9–20.1) |
| β-Carotene, µmol/L | 0.25 | (0.00–0.79) | 7.43 | (6.89–7.97) | 0.38 | (0.00–0.77) | 4.25 | (3.86–4.65) | 0.25 | (0.00–0.79) | 7.43 | (6.89–7.97) | 1.10 | (0.15–2.36) | 12.4 | (11.1–13.6) |
| FRAP, mmol/L | 98.6 | (93.2–104) | 153 | (147–158) | 105 | (99.9–110) | 193 | (188–198) | 105 | (99.9–110) | 193 | (188–198) | 105 | (99.9–110) | 193 | (188–198) |
| Thiol groups, mmol/L | 221 | (208–234) | 480 | (467–493) | 221 | (208–234) | 480 | (467–493) | 221 | (208–234) | 480 | (467–493) | 221 | (208–234) | 480 | (467–493) |
| ROMt, mg H2O2/dL | 7.00 | (6.25–7.75) | 19.6 | (18.8–20.3) | 9.78 | (8.47–11.1) | 23.3 | (22.0–24.7) | 7.00 | (6.25–7.75) | 19.6 | (18.8–20.3) | 7.00 | (6.25–7.75) | 19.6 | (18.8–20.3) |
| AOPP, mmol/L | 19.0 | (13.8–24.2) | 106 | (101–111) | 9.20 | (2.10–16.3) | 83.8 | (76.8–90.9) | 19.0 | (13.8–24.2) | 106 | (101–111) | 19.0 | (13.8–24.2) | 106 | (101–111) |
Publisher’s Note: MDPI stays neutral with regard to jurisdictional claims in published maps and institutional affiliations. |
© 2021 by the authors. Licensee MDPI, Basel, Switzerland. This article is an open access article distributed under the terms and conditions of the Creative Commons Attribution (CC BY) license (https://creativecommons.org/licenses/by/4.0/).
Share and Cite
Premi, M.; Mezzetti, M.; Ferronato, G.; Barbato, M.; Piccioli Cappelli, F.; Minuti, A.; Trevisi, E. Changes of Plasma Analytes Reflecting Metabolic Adaptation to the Different Stages of the Lactation Cycle in Healthy Multiparous Holstein Dairy Cows Raised in High-Welfare Conditions. Animals 2021, 11, 1714. https://doi.org/10.3390/ani11061714
Premi M, Mezzetti M, Ferronato G, Barbato M, Piccioli Cappelli F, Minuti A, Trevisi E. Changes of Plasma Analytes Reflecting Metabolic Adaptation to the Different Stages of the Lactation Cycle in Healthy Multiparous Holstein Dairy Cows Raised in High-Welfare Conditions. Animals. 2021; 11(6):1714. https://doi.org/10.3390/ani11061714
Chicago/Turabian StylePremi, Michele, Matteo Mezzetti, Giulia Ferronato, Mario Barbato, Fiorenzo Piccioli Cappelli, Andrea Minuti, and Erminio Trevisi. 2021. "Changes of Plasma Analytes Reflecting Metabolic Adaptation to the Different Stages of the Lactation Cycle in Healthy Multiparous Holstein Dairy Cows Raised in High-Welfare Conditions" Animals 11, no. 6: 1714. https://doi.org/10.3390/ani11061714
APA StylePremi, M., Mezzetti, M., Ferronato, G., Barbato, M., Piccioli Cappelli, F., Minuti, A., & Trevisi, E. (2021). Changes of Plasma Analytes Reflecting Metabolic Adaptation to the Different Stages of the Lactation Cycle in Healthy Multiparous Holstein Dairy Cows Raised in High-Welfare Conditions. Animals, 11(6), 1714. https://doi.org/10.3390/ani11061714