
Milk Quality and Carbon Footprint Indicators of Dairy Sheep Farms Depend on Grazing Level and Identify the Different Management Systems

 ,
,  , ,
, ,  , and
, and 
Abstract
Simple Summary
Abstract
1. Introduction
2. Materials and Methods
2.1. Data Collection
2.2. Milk Quality Parameters
2.3. Carbon Footprint Indicators
2.4. Management System
2.5. Statistical Analysis
3. Result and Discussion
3.1. Procedure Grounds
3.2. Factor Analysis
3.3. Cluster Analysis
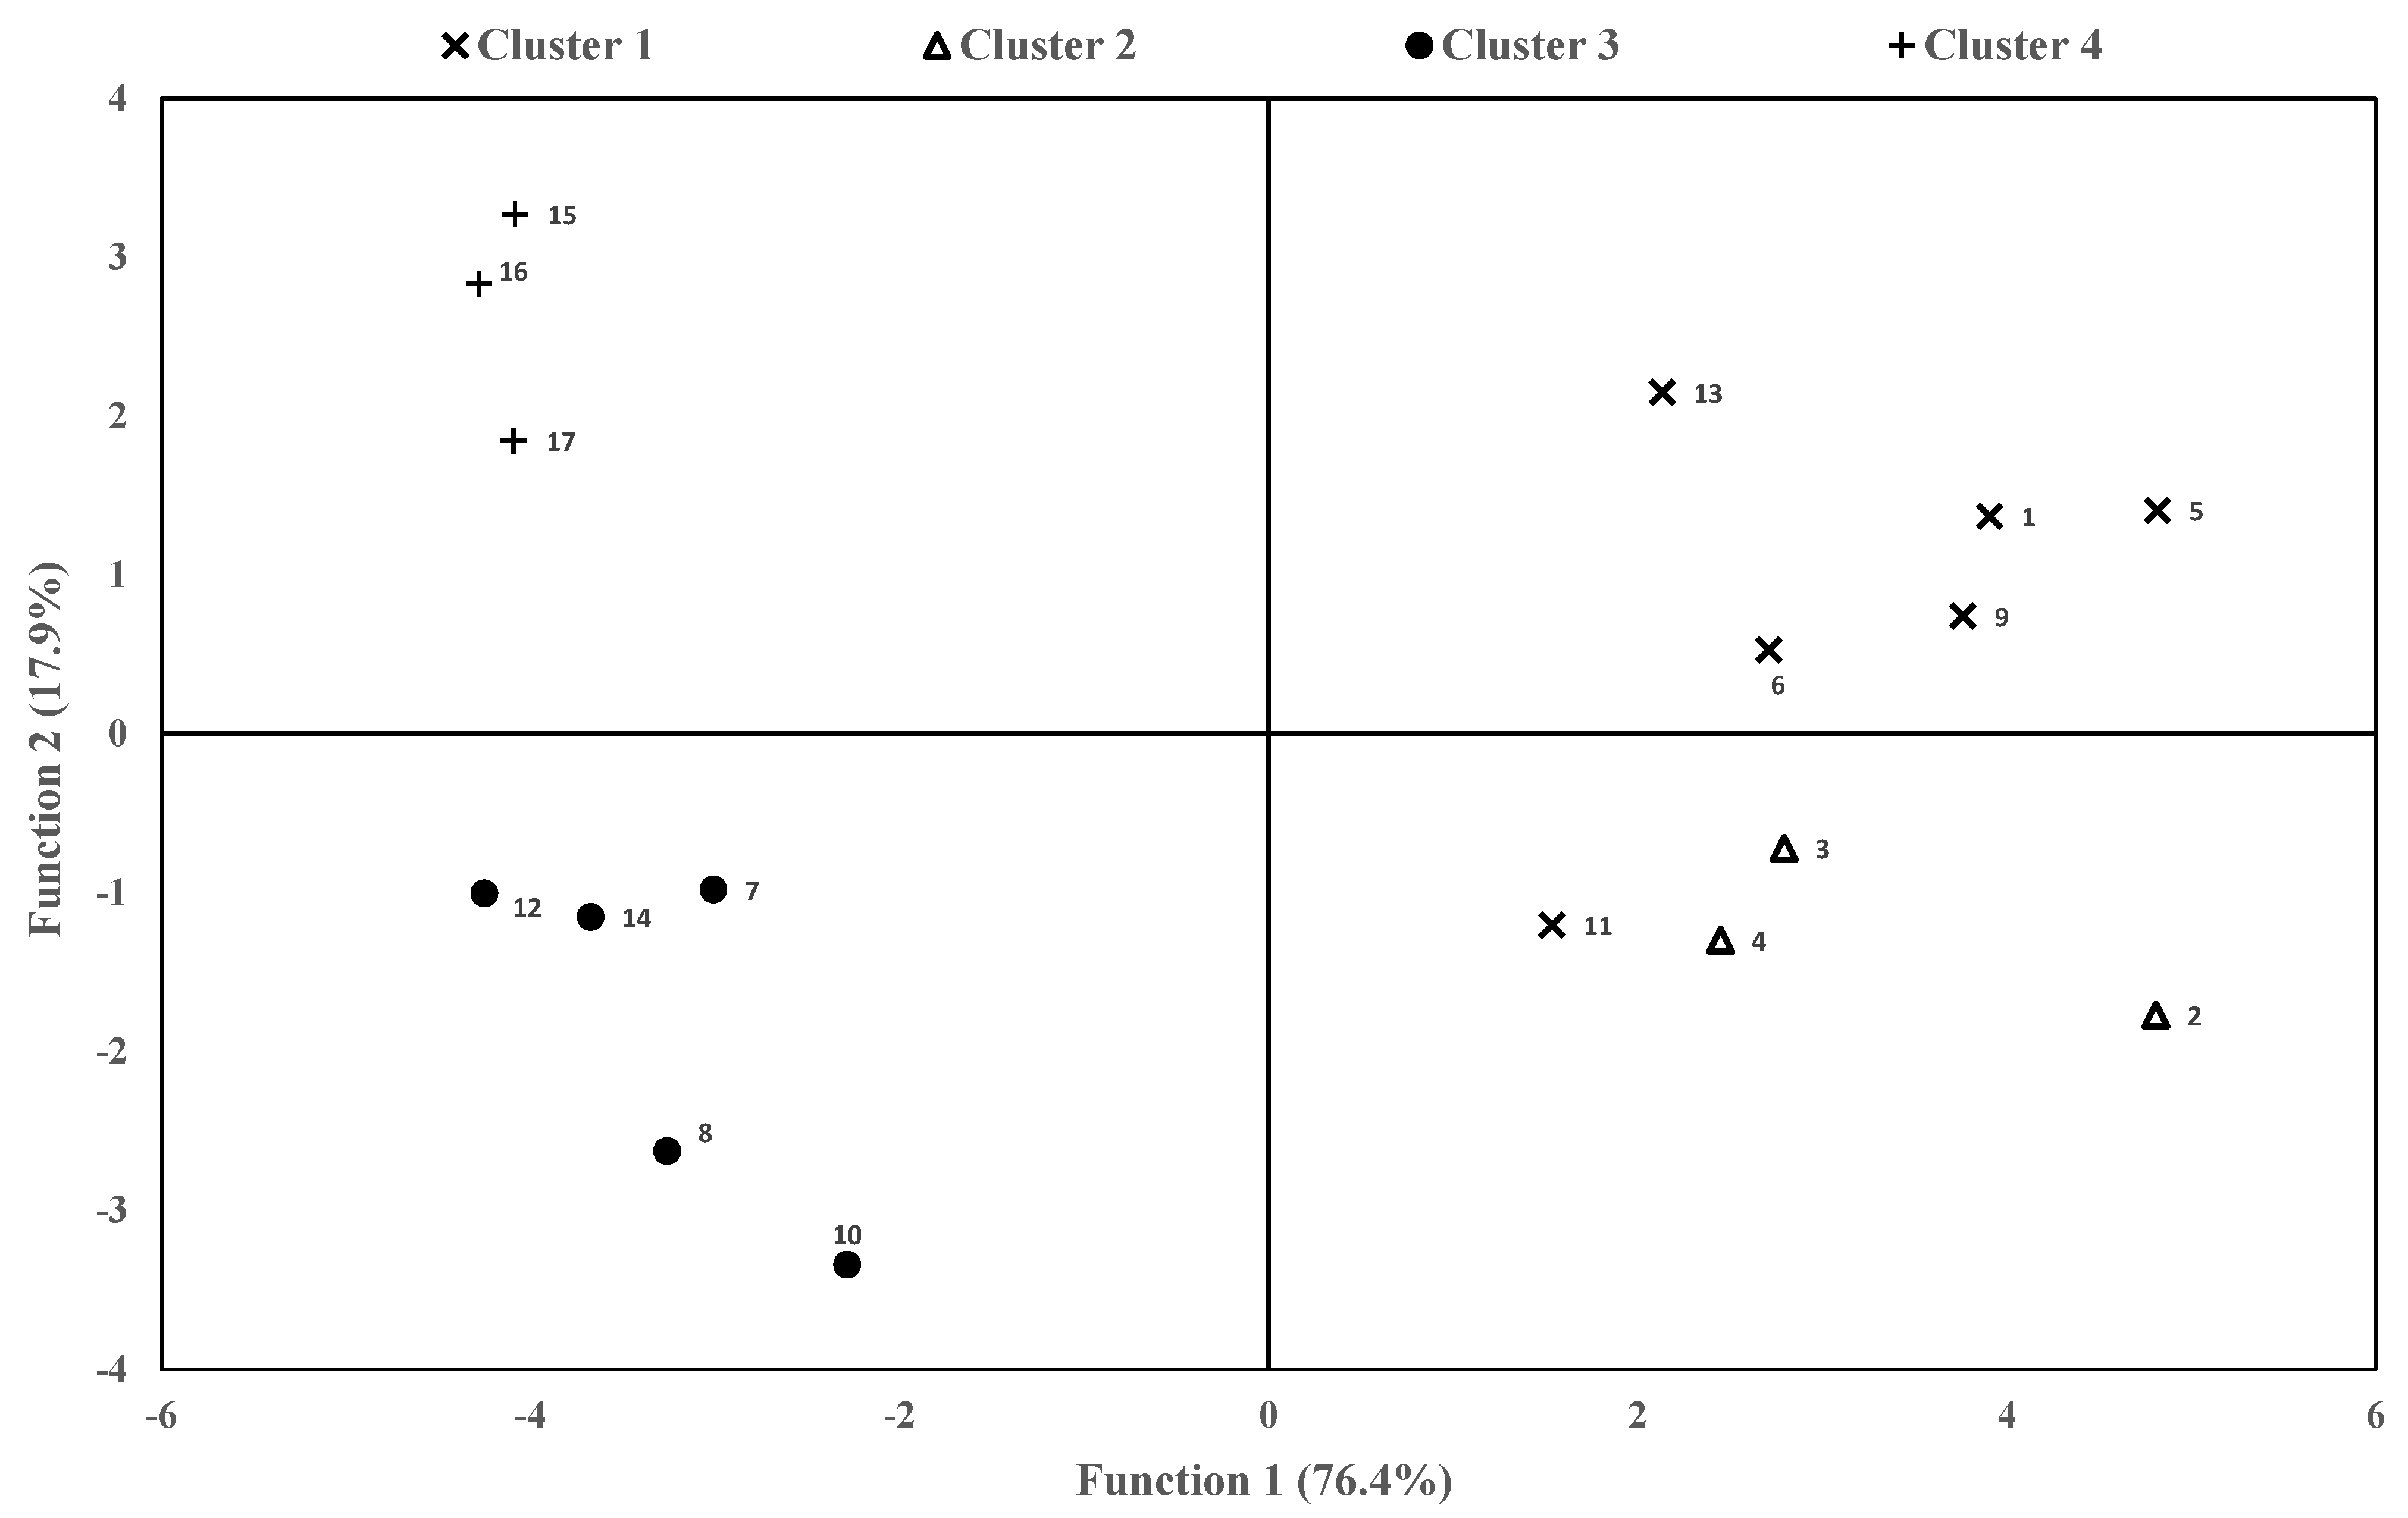
3.4. Canonical Population Analysis
3.5. Cluster’s Management Characteristics
3.6. Cluster’s Milk Quality
3.7. Cluster’s Carbon Footprint Indicators
4. Conclusions
Author Contributions
Funding
Institutional Review Board Statement
Data Availability Statement
Acknowledgments
Conflicts of Interest
References
- Mantecón, A.R.; Díez, P.; Villadangos, B.; Martínez, Y.; Lavín, P. Flock Size and Importance of Production Factors in Sheep Dairy Production Systems in León; Govern de les Illes Balears: Palma de Mallorca, Spain, 2007; pp. 125–128. (In Spanish) [Google Scholar]
- Morand-Fehr, P.; Fedele, V.; Decandia, M.; Le Frileux, Y. Influence of farming and feeding systems on composition and quality of goat and sheep milk. Small Rumin. Res. 2007, 68, 20–34. [Google Scholar] [CrossRef]
- Zervas, G.; Tsiplakou, E. The effect of feeding systems on the characteristics of products from small ruminants. Small Rumin. Res. 2011, 101, 140–149. [Google Scholar] [CrossRef]
- Lombardi, G. Optimum Management and Quality Pastures for Sheep and Goat in Mountain Areas. Available online: https://om.ciheam.org/article.php?IDPDF=6600015 (accessed on 10 September 2020).
- Zervas, G.; Fegeros, K.; Papadopoulos, G. Feeding system of sheep in a mountainous area of Greece. Small Rumin. Res. 1996, 21, 11–17. [Google Scholar] [CrossRef]
- Angeles-Hernandez, J.C.; Alberto, R.V.; Kebreab, E.; Appuhamy, J.A.D.R.N.; Dougherty, H.C.; Castelan-Ortega, O.; Gonzalez-Ronquillo, M. Effect of forage to concentrate ratio and fat supplementation on milk composition in dairy sheep: A meta-analysis. Livest. Sci. 2020, 238, 104069. [Google Scholar] [CrossRef]
- Delgado-Pertíñez, M.; Gutiérrez-Peña, R.; Mena, Y.; Fernández-Cabanás, V.; Laberye, D. Milk production, fatty acid composition and vitamin E content of Payoya goats according to grazing level in summer on Mediterranean shrublands. Small Rumin. Res. 2013, 114, 167–175. [Google Scholar] [CrossRef]
- De Renobales, M.; Amores, G.; Arranz, J.; Virto, M.; Barrón, L.; Bustamante, M.; de Gordoa, J.R.; Nájera, A.; Valdivielso, I.; Abilleira, E.; et al. Part-time grazing improves sheep milk production and its nutritional characteristics. Food Chem. 2012, 130, 90–96. [Google Scholar] [CrossRef]
- Butler, G.; Nielsen, J.H.; Slots, T.; Seal, C.; Eyre, M.D.; Sanderson, R.; Leifert, C. Fatty acid and fat-soluble antioxidant concentrations in milk from high- and low-input conventional and organic systems: Seasonal variation. J. Sci. Food Agric. 2008, 88, 1431–1441. [Google Scholar] [CrossRef]
- Butler, G.; Collomb, M.; Rehberger, B.; Sanderson, R.; Eyre, M.; Leifert, C. Conjugated linoleic acid isomer concentrations in milk from high- and low-input management dairy systems. J. Sci. Food Agric. 2009, 89, 697–705. [Google Scholar] [CrossRef]
- Gutiérrez-Peña, R.; Fernández-Cabanás, V.M.; Mena, Y.; Delgado-Pertíñez, M. Fatty acid profile and vitamins A and E contents of milk in goat farms under Mediterranean wood pastures as affected by grazing conditions and seasons. J. Food Compos. Anal. 2018, 72, 122–131. [Google Scholar] [CrossRef]
- Revilla, I.; Lurueña-Martínez, M.; Blanco-Lopez, M.; Viñuela-Serrano, J.; Vivar-Quintana, A.M.; Palacios, C. Changes in Ewe’s Milk Composition in Organic versus Conventional Dairy Farms. Czech J. Food Sci. 2009, 27, S263–S266. [Google Scholar] [CrossRef]
- De Rancourt, M.; Fois, N.; Lavín, M.; Tchakérian, E.; Vallerand, F. Mediterranean sheep and goats production: An uncertain future. Small Rumin. Res. 2006, 62, 167–179. [Google Scholar] [CrossRef]
- Escribano, M.; Elghannam, A.; Mesias, F. Dairy sheep farms in semi-arid rangelands: A carbon footprint dilemma between intensification and land-based grazing. Land Use Policy 2020, 95, 104600. [Google Scholar] [CrossRef]
- Buratti, C.; Fantozzi, F.; Barbanera, M.; Lascaro, E.; Chiorri, M.; Cecchini, L. Carbon footprint of conventional and organic beef production systems: An Italian case study. Sci. Total Environ. 2017, 576, 129–137. [Google Scholar] [CrossRef]
- Sabia, E.; Gauly, M.; Napolitano, F.; Serrapica, F.; Cifuni, G.F.; Claps, S. Dairy sheep carbon footprint and ReCiPe end-point study. Small Rumin. Res. 2020, 185, 106085. [Google Scholar] [CrossRef]
- Bellarby, J.; Tirado, R.; Leip, A.; Weiss, F.; Lesschen, J.P.; Smith, P. Livestock greenhouse gas emissions and mitigation potential in Europe. Glob. Chang. Biol. 2012, 19, 3–18. [Google Scholar] [CrossRef] [PubMed]
- Bailey, A.; Basford, W.; Penlington, N.; Park, J.; Keatinge, J.; Rehman, T.; Tranter, R.; Yates, C. A comparison of energy use in conventional and integrated arable farming systems in the UK. Agric. Ecosyst. Environ. 2003, 97, 241–253. [Google Scholar] [CrossRef]
- Haas, G.; Wetterich, F.; Köpke, U. Comparing intensive, extensified and organic grassland farming in southern Germany by process life cycle assessment. Agric. Ecosyst. Environ. 2001, 83, 43–53. [Google Scholar] [CrossRef]
- Nemecek, T.; Huguenin-Elie, O.; Dubois, D.; Gaillard, G.; Schaller, B.; Chervet, A. Life cycle assessment of Swiss farming systems: II. Extensive and intensive production. Agric. Syst. 2011, 104, 233–245. [Google Scholar] [CrossRef]
- International Organization for Standardization Milk and Milk Products. Extraction Methods for Lipids and Liposoluble Compounds (ISO Standard No. 14156:2001). Available online: https://www.iso.org/standard/23746.html (accessed on 13 January 2021).
- Lurueña-Martínez, M.; Palacios, C.; Vivar-Quintana, A.; Revilla, I. Effect of the addition of calcium soap to ewes’ diet on fatty acid composition of ewe milk and subcutaneous fat of suckling lambs reared on ewe milk. Meat Sci. 2010, 84, 677–683. [Google Scholar] [CrossRef]
- Herrero-Barbudo, M.; Granado-Lorencio, F.; Blanco-Navarro, I.; Olmedilla-Alonso, B. Retinol, α- and γ-tocopherol and carotenoids in natural and vitamin A- and E-fortified dairy products commercialized in Spain. Int. Dairy J. 2005, 15, 521–526. [Google Scholar] [CrossRef]
- Chauveau-Duriot, B.; Doreau, M.; Nozière, P.; Graulet, B. Simultaneous quantification of carotenoids, retinol, and tocopherols in forages, bovine plasma, and milk: Validation of a novel UPLC method. Anal. Bioanal. Chem. 2010, 397, 777–790. [Google Scholar] [CrossRef]
- BSI Group. PAS 2050:2011 Specification for the Assessment of the Life Cycle Greenhouse Gas Emissions of Goods and Services; BSI Group: London, UK, 2011. [Google Scholar]
- Intergovernmental Panel on Climate Change (IPCC). Agriculture, Forestry and Other Land Use. In IPCC Guidelines for National Greenhouse Gas Inventories; IPCC: Kanagawa, Japan, 2006; Volume 4, p. 6. [Google Scholar]
- Batalla, I.; Knudsen, M.T.; Mogensen, L.; del Hierro, Ó.; Pinto, M.; Hermansen, J.E. Carbon footprint of milk from sheep farming systems in Northern Spain including soil carbon sequestration in grasslands. J. Clean. Prod. 2015, 104, 121–129. [Google Scholar] [CrossRef]
- Pulina, G.; Macciotta, N.; Nudda, A. Milk composition and feeding in the Italian dairy sheep. Ital. J. Anim. Sci. 2005, 4, 5–14. [Google Scholar] [CrossRef]
- Merino, P.; Ramirez-Fanlo, E.; Arriaga, H.; Del Hierro, O.; Artetxe, A.; Viguria, M. Regional inventory of methane and nitrous oxide emission from ruminant livestock in the Basque Country. Anim. Feed. Sci. Technol. 2011, 166–167, 628–640. [Google Scholar] [CrossRef]
- Intergovernmental Panel on Climate Change (IPCC). Refinement to the 2006 IPCC Guidelines for National Greenhouse Gas Inventories. In Proceedings of the 49th Session of the IPCC, Kyoto, Japan, 8–12 May 2019. [Google Scholar]
- Intergovernmental Panel on Climate Change (IPCC). Climate Change 2014: Synthesis Report. Contribution of Working Groups I, II and III to the Fifth Assessment Report of the Intergovernmental Panel on Climate Change. In Fifth Assessment Report (AR5); Intergovernmental Panel on Climate Change: Geneva, Switzerland, 2014; p. 151. [Google Scholar]
- International Committee for Animal Recording (ICAR). Section 16—Guidelines for Performance Recording in Dairy Sheep and Dairy Goats. In the Global Standard for Livestock Data; International Committee for Animal Recording: Valais, Switzerland, 2016; p. 37. [Google Scholar]
- Mena, Y.; Gutierrez-Peña, R.; Ruiz, F.A.; Delgado-Pertíñez, M. Can dairy goat farms in mountain areas reach a satisfactory level of profitability without intensification? A case study in Andalusia (Spain). Agroecol. Sustain. Food Syst. 2017, 41, 614–634. [Google Scholar] [CrossRef]
- Anderson, T.W.; Rubin, H. The Asymptotic Properties of Estimates of the Parameters of a Single Equation in a Complete System of Stochastic Equations. Ann. Math. Stat. 1950, 21, 570–582. [Google Scholar] [CrossRef]
- Kaiser, H.F. A second generation little jiffy. Psychometrika 1970, 35, 401–415. [Google Scholar] [CrossRef]
- Bartlett, M.S. The effect of standardization on a χ2 approximation in factor analysis. Biometrika 1951, 38, 337–344. [Google Scholar] [CrossRef]
- Ward, J.H. Hierarchical Grouping to Optimize an Objective Function. J. Am. Stat. Assoc. 1963, 58, 236–244. [Google Scholar] [CrossRef]
- Nelder, J.A.; Wedderburn, R.W.M. Generalized Linear Models. J. R. Stat. Soc. Ser. A 1972, 135, 370–384. [Google Scholar] [CrossRef]
- Tukey, J.W. Comparing Individual Means in the Analysis of Variance. Biometrics 1949, 5, 99–114. [Google Scholar] [CrossRef]
- Cuadras, C. Clasificación. In Nuevos Métodos de Análisis Multivariantes; CMC Editions: Barcelona, Spain, 2014; pp. 187–208. [Google Scholar]
- Ma, Y.; Lin, H.; Wang, Y.; Huang, H.; He, X. A multi-stage hierarchical clustering algorithm based on centroid of tree and cut edge constraint. Inf. Sci. 2021, 557, 194–219. [Google Scholar] [CrossRef]
- Cuadras, C. Análisis de Componentes Principales. In Nuevos Métodos de Análisis Multivariantes; CMC Editions: Barcelona, Spain, 2014; pp. 77–92. [Google Scholar]
- O’Brien, B.; Dillon, P.; Murphy, J.J.; Mehra, R.K.; Guinee, T.P.; Connolly, J.F.; Kelly, A.; Joyce, P. Effects of stocking density and concentrate supplementation of grazing dairy cows on milk production, composition and processing characteristics. J. Dairy Res. 1999, 66, 165–176. [Google Scholar] [CrossRef]
- O’Callaghan, T.F.; Hennessy, D.; McAuliffe, S.; Kilcawley, K.N.; O’Donovan, M.; Dillon, P.; Ross, R.; Stanton, C. Effect of pasture versus indoor feeding systems on raw milk composition and quality over an entire lactation. J. Dairy Sci. 2016, 99, 9424–9440. [Google Scholar] [CrossRef]
- Martínez, J.A.A.; Riocerezo, C.P.; de la Fuente, F. Efecto de la conversión a la producción ecológica sobre los parámetros cuantitativos y cualitativos de la leche de oveja. Inf. Tec. Econ. Agrar. 2017, 113, 122–137. [Google Scholar] [CrossRef]
- Atti, N.; Rouissi, H.; Othmane, M. Milk production, milk fatty acid composition and conjugated linoleic acid (CLA) content in dairy ewes raised on feedlot or grazing pasture. Livest. Sci. 2006, 104, 121–127. [Google Scholar] [CrossRef]
- Othmane, M.H.; Carriedo, J.A.; de la Fuente, L.F.; Primitivio, F.S. Factors affecting test-day milk composition in dairy ewes, and relationships amongst various milk components. J. Dairy Res. 2002, 69. [Google Scholar] [CrossRef] [PubMed]
- Sutton, J.D.; Oldham, J.D.; Hart, I.C. Products of digestion, hormones and energy utilization in milking cows given concentrates containing varying proportions of barley or maize. Publ. Eur. Assoc. Anim. Prod. 1980, 26, 303–306. [Google Scholar]
- Schmidely, D.; Sauvant, D. Fat content yield andcomposition of milk in small ruminants: Effects of concentrate level and addition of fat. INRA 2001, 14, 337–354. [Google Scholar]
- Rapetti, L.; Falaschi, U.; Lodi, R.; Vezzoli, F.; Tamburini, A.; Greppi, G.; Enne, G. The effect of liquid whey fed to dairy goats on milk yield and quality. Small Rumin. Res. 1995, 16, 215–220. [Google Scholar] [CrossRef]
- Casals, R.; Caja, G. Interés Del Empleo de Los Suplementos Lipídicos En La Alimentación de Ovino y Caprino En Zonas Áridas. In Nutrición de Rumiantes en Zonas Áridas y de Montaña y Su Relación Con La Conservación del Medio Natural; Consejería de Agricultura y Pesca: Andalucía, Spain, 1993; pp. 173–193. [Google Scholar]
- Sales-Duval, M.; Danon, V.; Goby, J.P.; Rochon, J.J. Influence of Food Systems of the Catalan Maquis Area of the Composition of the Milk Fat of Goat. In Proceedings of the FAO-CIHEAM Seminar on Sustainable Grazing, Nutritional Utilization and Quality of Sheep and Goat Products and Rangelands, Granada, Spain, 2–4 October 2003. [Google Scholar]
- Bocquier, F.; Caja, G. Recent Advances on Nutrition and Feeding of Dairy Sheep. In Proceedings of the 5th International Symposium on Machine Milking of Small Ruminants, Budapes, Hungary, 14–20 May 1993; pp. 580–607. [Google Scholar]
- Reynolds, C. Production and metabolic effects of site of starch digestion in dairy cattle. Anim. Feed. Sci. Technol. 2006, 130, 78–94. [Google Scholar] [CrossRef]
- Rodríguez-Nogales, J.; Vivar-Quintana, A.; Revilla, I. Influence of Somatic Cell Count and Breed on Capillary Electrophoretic Protein Profiles of Ewes’ Milk: A Chemometric Study. J. Dairy Sci. 2007, 90, 3187–3196. [Google Scholar] [CrossRef]
- Vivar-Quintana, A.M.; Revilla, I.; Pérez-Rodrigo, J.L.; Rodríguez-Nogales, J.M. Composición de la leche en función de la raza de la oveja y los recuentos en células somáticas (RCS). In Influencia de La Leche de Oveja en La Elaboración de Queso Zamorano; Montecasino: Zamora, Spain, 2008; p. 232. [Google Scholar]
- Tsiplakou, E.; Kotrotsios, V.; Hadjigeorgiou, I.; Zervas, G. Differences in sheep and goats milk fatty acid profile between conventional and organic farming systems. J. Dairy Res. 2010, 77, 343–349. [Google Scholar] [CrossRef] [PubMed]
- Couvreur, S.; Hurtaud, C.; Lopez, C.; Delaby, L.; Peyraud, J. The Linear Relationship Between the Proportion of Fresh Grass in the Cow Diet, Milk Fatty Acid Composition, and Butter Properties. J. Dairy Sci. 2006, 89, 1956–1969. [Google Scholar] [CrossRef]
- Revilla, I.; Sanjuán, D.; Palacios, C.; Hidalgo, C.; Alvarez, R.; Rodríguez, P. Comparison of Fatty Acid Composition of Ewe’s Organic and Conventional Milk and Its Evolution throughout the Year. Available online: https://fqh2013.fqhresearch.org/fileadmin/documents-fqhconference/2013/fqh2013-book-of-abstracts.pdf (accessed on 2 February 2021).
- Palmquist, D.L.; Lock, A.L.; Shingfield, K.J.; Bauman, D.E. Biosynthesis of Conjugated Linoleic Acid in Ruminants and Humans. In Advances in Food and Nutrition Research; Elsevier: Amsterdam, The Netherlands, 2005; pp. 179–217. [Google Scholar]
- Dewhurst, R.; Shingfield, K.; Lee, M.; Scollan, N. Increasing the concentrations of beneficial polyunsaturated fatty acids in milk produced by dairy cows in high-forage systems. Anim. Feed. Sci. Technol. 2006, 131, 168–206. [Google Scholar] [CrossRef]
- Cabiddu, A.; de Candia, M.; Addis, M.; Piredda, G.; Pirisi, A.; Molle, G. Managing Mediterranean pastures in order to enhance the level of beneficial fatty acids in sheep milk. Small Rumin. Res. 2005, 59, 169–180. [Google Scholar] [CrossRef]
- Bonanno, A.; Grigoli, A.D.; Mazza, F.; de Pasquale, C.; Giosuè, C.; Vitale, F.; Alabiso, M. Effects of ewes grazing sulla or ryegrass pasture for different daily durations on forage intake, milk production and fatty acid composition of cheese. Animal 2016, 10, 2074–2082. [Google Scholar] [CrossRef] [PubMed]
- Valdivielso, I.; Bustamante, M.; Aldezabal, A.; Amores, G.; Virto, M.; de Gordoa, J.R.; de Renobales, M.; Barron, L. Case study of a commercial sheep flock under extensive mountain grazing: Pasture derived lipid compounds in milk and cheese. Food Chem. 2016, 197, 622–633. [Google Scholar] [CrossRef]
- Sharma, Y.K.; Goyal, K.C.; Misra, U.K. Vitamin A and RBP Contents of Milk of Goats given a Single Massive Dose of Vitamin A Orally. Nutr. Rep. Int. 1983, 28, 593–596. [Google Scholar]
- Rossetti, L.; Langman, L.; Leandro, E.; Grigioni, G.M.; Biolatto, A.; Sancho, A.M.; Comeron, E.A.; Descalzo, A.M. Antioxidant Status and Odor Profile in Milk from Silage or Alfalfa-Fed Cows. Aust. J. Dairy Technol. 2010, 65, 3–9. [Google Scholar]
- Askar, A.; Salama, R.; El-Shaer, H.; Raef, O. Effects of supplementary feeding level on digestion and energy utilization by sheep and goats grazing arid-area rangelands. Anim. Feed. Sci. Technol. 2021, 271, 114695. [Google Scholar] [CrossRef]
- Eldesouky, A.; Mesias, F.; Elghannam, A.; Escribano, M. Can extensification compensate livestock greenhouse gas emissions? A study of the carbon footprint in Spanish agroforestry systems. J. Clean. Prod. 2018, 200, 28–38. [Google Scholar] [CrossRef]
- National Academies of Sciences, Engineering, and Medicine. Nutrient Requirements of Beef Cattle; The National Academies Press: Washington, WA, USA, 2016. [Google Scholar]
- O’Brien, D.; Capper, J.; Garnsworthy, P.; Grainger, C.; Shalloo, L. A case study of the carbon footprint of milk from high-performing confinement and grass-based dairy farms. J. Dairy Sci. 2014, 97, 1835–1851. [Google Scholar] [CrossRef] [PubMed]
- Gutiérrez-Peña, R.; Mena, Y.; Batalla, I.; Mancilla-Leytón, J.M. Carbon footprint of dairy goat production systems: A comparison of three contrasting grazing levels in the Sierra de Grazalema Natural Park (Southern Spain). J. Environ. Manag. 2019, 232, 993–998. [Google Scholar] [CrossRef] [PubMed]
- Robertson, K.; Symes, W.; Garnham, M. Carbon footprint of dairy goat milk production in New Zealand. J. Dairy Sci. 2015, 98, 4279–4293. [Google Scholar] [CrossRef] [PubMed]


| Farm | Breed | Sheep Per Farm | Milk Production (l/Sheep/Year) | Total Forage (%) | Total Concentrate (%) | Grazing Time (%) | Stabling Time (%) |
|---|---|---|---|---|---|---|---|
| 1 | Assaf | 774 | 417 | 52.95 | 47.05 | 0.00 | 100.00 |
| 2 | Assaf | 1000 | 373 | 40.80 | 59.20 | 0.00 | 100.00 |
| 3 | Assaf | 600 | 417 | 64.90 | 35.09 | 0.00 | 100.00 |
| 4 | Assaf | 743 | 535 | 75.97 | 24.02 | 10.00 | 90.00 |
| 5 | Assaf | 699 | 185 | 78.94 | 21.05 | 0.00 | 100.00 |
| 6 | Assaf | 1200 | 295 | 68.26 | 31.74 | 0.00 | 100.00 |
| 7 | Assaf | 675 | 226 | 59.15 | 40.84 | 32.00 | 68.00 |
| 8 | Assaf | 452 | 101 | 68.41 | 31.59 | 5.00 | 95.00 |
| 9 | Assaf | 625 | 283 | 82.65 | 17.34 | 25.00 | 75.00 |
| 10 | Assaf | 574 | 265 | 29.08 | 70.91 | 23.00 | 73.00 |
| 11 | Churra | 1040 | 174 | 60.67 | 27.23 | 0.00 | 100.00 |
| 12 | Churra | 920 | 121 | 86.15 | 13.84 | 43.00 | 57.00 |
| 13 | Churra | 280 | 100 | 92.63 | 7.37 | 32.00 | 68.00 |
| 14 | Churra | 474 | 108 | 75.04 | 24.96 | 44.00 | 56.00 |
| 15 | Churra | 1300 | 24 | 81.82 | 18.17 | 98.64 | 11.36 |
| 16 | Churra | 1000 | 53 | 51.17 | 48.82 | 96.80 | 13.20 |
| 17 | Churra | 476 | 54 | 78.86 | 21.13 | 66.00 | 44.00 |
| Parameter | CO2 | CH4 | N2O | CO2eq | EC |
|---|---|---|---|---|---|
| F (%) | 0.02 | 0.10 | 0.04 | 0.12 | −0.13 |
| P (%) | 0.05 | 0.46 ** | 0.25 ** | 0.49 ** | −0.31 ** |
| DE (%) | 0.06 | 0.30 ** | 0.16 * | 0.32 ** | −0.18 * |
| SFA (%) | 0.05 | −0.14 * | −0.05 | −0.12 | 0.05 |
| MUFA (%) | −0.02 | 0.07 | 0.04 | 0.05 | 0.00 |
| PUFA (%) | −0.10 | 0.34 ** | 0.12 | 0.31 ** | −0.29 ** |
| CLA (%) | −0.08 | 0.53 ** | 0.21 ** | 0.55 ** | −0.40 ** |
| ω3 (%) | −0.04 | 0.35 ** | 0.14 * | 0.43 ** | −0.36 ** |
| ω6 (%) | −0.07 | 0.02 | −0.01 | −0.08 | 0.02 |
| α-Tocopherol (μg/100 g) | −0.08 | 0.28 ** | 0.04 | 0.37 ** | −0.32 ** |
| β+γ-Tocopherol (μg/100 g) | 0.04 | 0.02 | 0.05 | −0.04 | −0.01 |
| Parameter | Factor 1 | Factor 2 | Factor 3 | Factor 4 | Factor 5 | Factor 6 |
|---|---|---|---|---|---|---|
| Fat content (%) | 0.718 | |||||
| Protein content (%) | 0.869 | |||||
| Dry extract (%) | 0.941 | |||||
| SFA (%) | −0.915 | |||||
| MUFA (%) | 0.704 | |||||
| PUFA (%) | 0.813 | |||||
| CLA (%) | 0.678 | |||||
| ω3 (%) | 0.827 | |||||
| ω6 (%) | 0.649 | |||||
| α-tocopherol (μg/100 g) | 0.861 | |||||
| β+γ-tocopherol (μg/100 g) | −0.847 | |||||
| Energy consumed (MJ/sheep/year) | 0.854 | |||||
| CO2 (kg/sheep/year) | 0.952 | |||||
| CH4 (kg/sheep/year) | 0.987 | |||||
| N2O (kg/sheep/year) | 0.901 | |||||
| CO2eq (kg/sheep/year) | 0.762 | |||||
| KMO = 0.698 BTS = 0.000 Variance = 85.34% | ||||||
| Parameter | Cluster 1 (n = 6) | Cluster 2 (n = 3) | Cluster 3 (n = 5) | Cluster 4 (n = 3) | Total (N = 17) | Significance |
|---|---|---|---|---|---|---|
| Sheep per farm | 778 ± 295 b | 781 ± 168 b | 622 c ± 183 c | 925 ± 345 a | 760 ± 276 | 0.000 |
| Milk production (l/sheep/year) | 243.7 ± 103.2 b | 441.7 ± 69.3 a | 163.6 ± 67.8 c | 43.7 ± 14.1 d | 220.1 ± 146.7 | 0.000 |
| Total forage (%) | 72.3 ± 13.5 a | 60.6 ± 14.9 c | 64.0 ± 19.3 b,c | 70.6 ± 14.0 a,b | 67.5 ± 16.3 | 0.000 |
| Pasture in total forage (%) | 1.5 ± 2.3 b | 0.1 ± 0.1 b | 7.9 ± 6.7 b | 46.4 ± 35.3 a | 11.2 ± 22.7 | 0.000 |
| Total concentrate (%) | 25.6 ± 12.4 c | 39.4 ± 14.9 a | 36.0 ± 19.3 a,b | 29.4 ± 14.0 b,c | 31.8 ± 16.3 | 0.000 |
| Grazing time (%) | 9.0 ± 13.5 c | 3.3 ± 4.8 c | 29.9 ± 14.4 b | 87.1 ± 15.2 a | 28.1 ± 32.2 | 0.000 |
| Stabling time (%) | 91.0 ± 13.5 a | 96.7 ± 4.8 a | 70.1 ± 14.4 b | 12.9 ± 15.2 c | 71.9 ± 32.2 | 0.000 |
| UAL (ha) | 79.4 ± 62.0 b | 38.3 ± 11.5 b | 51.8 ± 34.4 b | 874.3 ± 885.2 a | 206.9 ± 487.7 | 0.000 |
| NEB (MJ) | −4,301,705 ± 1,662,001 b | −4,681,787 ± 3,053,319 b | −1,210,717 ± 334,462 a | −895,728 ± 47,008 a | −2,860,497 ± 2,335,021 | 0.000 |
| Net margin (EUR/sheep/year) | 42.8 ± 75.6 b | 47.7 ± 127.8 a,b | 30.0 ± 42.6 b | 88.8 ± 97.8 a | 48.2 ± 86.4 | 0.008 |
| Parameter | Cluster 1 (n = 6) | Cluster 2 (n = 3) | Cluster 3 (n = 5) | Cluster 4 (n = 3) | Total (N = 17) | Significance |
|---|---|---|---|---|---|---|
| Fat content (%) | 7.00 ± 0.22 a,b | 6.75 ± 0.20 b | 6.77 ± 0.29 b | 7.33 ± 0.25 a | 6.94 ± 0.30 | 0.032 |
| Protein content (%) | 5.47 ± 0.18 a,b | 5.32 ± 0.14 b | 5.59 ± 0.17 a,b | 6.00 ± 0.55 a | 5.57 ± 0.33 | 0.040 |
| Dry extract (%) | 18.12 ± 0.17 a,b | 17.82 ± 0.29 b | 17.92 ± 0.32 b | 18.91 ± 0.80 a | 18.15 ± 0.52 | 0.017 |
| SFA (%) | 71.46 ± 0.96 | 70.19 ± 1.26 | 70.35 ± 2.02 | 71.32 ± 1.67 | 70.88 ± 1.48 | 0.522 |
| MUFA (%) | 23.69 ± 1.17 | 25.22 ± 1.50 | 24.57 ± 1.34 | 23.40 ± 1.05 | 24.17 ± 1.32 | 0.258 |
| PUFA (%) | 4.59 ± 0.52 | 4.58 ± 0.39 | 5.00 ± 0.73 | 4.81 ± 0.79 | 4.75 ± 0.59 | 0.709 |
| CLA (%) | 0.54 ± 0.06 | 0.56 ± 0.04 | 0.72 ± 0.11 | 0.84 ± 0.34 | 0.65 ± 0.18 | 0.070 |
| ω3 (%) | 0.68 ± 0.11 a,b | 0.50 ± 0.21 b | 0.81 ± 0.22 a,b | 1.01 ± 0.21 a | 0.74 ± 0.23 | 0.026 |
| ω6 (%) | 3.012 ± 0.475 | 3.15 ± 0.17 | 3.04 ± 0.63 | 2.53 ± 0.20 | 2.96 ± 0.47 | 0.395 |
| α-tocopherol (μg/100 g) | 71.38 ± 35.60 c | 64.29 ± 28.50 c | 91.24 ± 45.40 b | 185.03 ± 44.70 a | 103.09 ± 53.84 | 0.011 |
| β+γ-tocopherol (μg/100 g) | 10.79 ± 3.96 | 13.17 ± 5.77 | 8.30 ± 1.80 | 11.34 ± 2.35 | 10.57 ± 3.68 | 0.337 |
| Parameter | Cluster 1 (n = 6) | Cluster 2 (n = 3) | Cluster 3 (n = 5) | Cluster 4 (n = 3) | Total (N = 17) | Significance |
|---|---|---|---|---|---|---|
| Energy consumed (MJ/sheep/year) | 7711.91 ± 2741.27 a | 7164.57 ± 1963.30 a,b | 3082.79 ± 977.44 b,c | 1545.15 ± 873.29 c | 5165.56 ± 3187.20 | 0.001 |
| CO2 (kg/sheep/year) | 294.60 ± 141.52 b | 578.29 ± 119.50 a | 250.61 ± 118.97 b | 63.84 ± 23.69 c | 291.01 ± 193.18 | 0.001 |
| CH4 (kg/sheep/year) | 2.32 ± 0.35 | 2.37 ± 0.32 | 2.27 ± 0.39 | 2.38 ± 0.41 | 2.32 ± 0.47 | 0.159 |
| N2O (kg/sheep/year) | 0.46 ± 0.07 a | 0.36 ± 0.02 a,b | 0.29 ± 0.06 b,c | 0.18 ± 0.03 c | 0.34 ± 0.11 | 0.000 |
| CO2eq (kg/sheep/year) | 768.12 ± 103.56 b | 925.76 ± 122.10 a | 597.60 ± 102,50 b | 352.11 ± 196.23 c | 672.32 ± 205.34 | 0.000 |
| Carbon footprint (kgCO2eq/kgFPCM) | 2.45 ± 2.13 b | 1.73 ± 0.38 b | 3.55 ± 1.37 a,b | 6.58 ± 2.78 a | 3.37 ± 2.37 | 0.028 |
Publisher’s Note: MDPI stays neutral with regard to jurisdictional claims in published maps and institutional affiliations. |
© 2021 by the authors. Licensee MDPI, Basel, Switzerland. This article is an open access article distributed under the terms and conditions of the Creative Commons Attribution (CC BY) license (https://creativecommons.org/licenses/by/4.0/).
Share and Cite
Plaza, J.; Revilla, I.; Nieto, J.; Hidalgo, C.; Sánchez-García, M.; Palacios, C. Milk Quality and Carbon Footprint Indicators of Dairy Sheep Farms Depend on Grazing Level and Identify the Different Management Systems. Animals 2021, 11, 1426. https://doi.org/10.3390/ani11051426
Plaza J, Revilla I, Nieto J, Hidalgo C, Sánchez-García M, Palacios C. Milk Quality and Carbon Footprint Indicators of Dairy Sheep Farms Depend on Grazing Level and Identify the Different Management Systems. Animals. 2021; 11(5):1426. https://doi.org/10.3390/ani11051426
Chicago/Turabian StylePlaza, Javier, Isabel Revilla, Jaime Nieto, Cristina Hidalgo, Mario Sánchez-García, and Carlos Palacios. 2021. "Milk Quality and Carbon Footprint Indicators of Dairy Sheep Farms Depend on Grazing Level and Identify the Different Management Systems" Animals 11, no. 5: 1426. https://doi.org/10.3390/ani11051426
APA StylePlaza, J., Revilla, I., Nieto, J., Hidalgo, C., Sánchez-García, M., & Palacios, C. (2021). Milk Quality and Carbon Footprint Indicators of Dairy Sheep Farms Depend on Grazing Level and Identify the Different Management Systems. Animals, 11(5), 1426. https://doi.org/10.3390/ani11051426