Article

Genome-Wide Identification of Candidate Genes for Milk Production Traits in Korean Holstein Cattle

1
Department of Animal Science and Technology, Chung-Ang University, Anseong 17546, Gyeonggi-do, Korea
2
Dairy Cattle Genetic Improvement Center, Nonghyup, Goyang 10292, Gyeonggi-do, Korea
3
Animal Genetics and Breeding Division, National Institute of Animal Science, RDA, Cheonan 31000, Chungcheongnam-do, Korea
4
Animal Welfare Research Team, National Institute of Animal Science, RDA, Wanju 55365, Jeollabuk-do, Korea
*
Authors to whom correspondence should be addressed.
These authors contributed equally to this study.
Animals 2021, 11(5), 1392; https://doi.org/10.3390/ani11051392
Submission received: 6 April 2021 / Revised: 7 May 2021 / Accepted: 11 May 2021 / Published: 13 May 2021

Abstract

:

Simple Summary

Milk production traits that are economically important in the dairy industry have been considered the main selection criteria for breeding. The present genome-wide association study was performed to identify chromosomal loci and candidate genes with potential effects on milk production phenotypes in a Korean Holstein population. A total of eight significant quantitative trait locus regions were identified for milk yield (Bos taurus autosome (BTA) 7 and 14), adjusted 305-d fat yield (BTA 3, 5, and 14), adjusted 305-d protein yield (BTA 8), and somatic cell score (BTA 8 and 23) of milk production traits. Furthermore, we discovered three main candidate genes (diacylglycerol O-acyltransferase 1 (DGAT1), phosphodiesterase 4B (PDE4B), and anoctamin 2 (ANO2)) through bioinformatics analysis. These genes may help to understand better the underlying genetic and molecular mechanisms for milk production phenotypes in the Korean Holstein population.

Abstract

We performed a genome-wide association study and fine mapping using two methods (single marker regression: frequentist approach and Bayesian C (BayesC): fitting selected single nucleotide polymorphisms (SNPs) in a Bayesian framework) through three high-density SNP chip platforms to analyze milk production phenotypes in Korean Holstein cattle (n = 2780). We identified four significant SNPs for each phenotype in the single marker regression model: AX-311625843 and AX-115099068 on Bos taurus autosome (BTA) 14 for milk yield (MY) and adjusted 305-d fat yield (FY), respectively, AX-428357234 on BTA 18 for adjusted 305-d protein yield (PY), and AX-185120896 on BTA 5 for somatic cell score (SCS). Using the BayesC model, we discovered significant 1-Mb window regions that harbored over 0.5% of the additive genetic variance effects for four milk production phenotypes. The concordant significant SNPs and 1-Mb window regions were characterized into quantitative trait loci (QTL). Among the QTL regions, we focused on a well-known gene (diacylglycerol O-acyltransferase 1 (DGAT1)) and newly identified genes (phosphodiesterase 4B (PDE4B), and anoctamin 2 (ANO2)) for MY and FY, and observed that DGAT1 is involved in glycerolipid metabolism, fat digestion and absorption, metabolic pathways, and retinol metabolism, and PDE4B is involved in cAMP signaling. Our findings suggest that the candidate genes in QTL are strongly related to physiological mechanisms related to the fat production and consequent total MY in Korean Holstein cattle.

1. Introduction

Milk production is an economically important trait affecting profitability in Holstein dairy cattle. Holstein selection for genetic improvement with economic characteristics in the past was based on a traditional best linear unbiased prediction together with an estimated breeding value (EBV), a traditional animal breeding program that depends only on phenotypic and pedigree information [1]. Recent advances in DNA-based marker technology have allowed us to identify quantitative trait loci (QTL), which are genomic regions related to complex characteristics such as milk yield in dairy cows, and it was reported that integrating detected QTL into genetic evaluations would promote the genetic improvement of productivity by providing a means to increase the accuracy of an estimation of an individual’s genetic ability.
For dairy cattle, since Georges et al. [2] reported a QTL mapping study on milk yield characteristics, more than 1350 QTL for traits related to milk production were reported (https://www.animalgenome.org/cgi-bin/QTLdb/BT/index accessed on 1 October 2020). The specific genes or mechanisms involved in the detection of QTL, however, have not been sufficiently characterized because of the low resolution of the traditional positional cloning approach using microsatellite markers [3] and the lack of whole-genome sequences. In addition, the limitations of QTL mapping using linkage analysis or linkage disequilibrium (LD) based on panels of low- to moderate-density markers are well documented [4].
Advances in DNA analysis technology led to the emergence of genome-wide panels containing hundreds of thousands of single nucleotide polymorphisms (SNPs), which have been widely used for detecting QTL for complex traits in many species [5], and its usefulness for detecting mutations has been demonstrated. Genome-wide association studies (GWAS) that use this high-density SNP chip technology were used to locate genes related to complex traits and have advantages in detecting effective causal alterations and defining narrow genomic regions containing causal alterations compared with the traditional QTL mapping strategies [6]. These techniques make it possible to detect SNPs and candidate gene markers related to the economic traits of dairy cattle accurately.
Previous GWAS were performed using various SNP chip platforms in cattle breeds. Two SNPs related to milk yield on Bos taurus autosome 4 (BTA 4), two SNPs related to fat yield on BTA 14/2, and one SNP related to fat percentage on BTA 1 were identified using the Bovine SNP50K BeadChip platform (Illumina, San Diego, CA, USA) in the Braunvieh cattle breed [7]. Dozens of SNPs related to milk yield or fat yield were found on BTA 14 (1.2–2.8 Mb) in Italian Holstein cattle, also through GWAS [8]. In addition, GWAS performed using the BovineHD SNP777K BeadChip in Canadian Holstein cattle for milk production, fat production, and protein production traits found many candidate SNPs and chromosomal regions [9], and many other candidate genes related to milk production, such as diacylglycerol O-acyltransferase 1 (DGAT1), transcriptional repressor GATA binding 1 (TRPS1), stearoyl-CoA desaturase (SCD), and growth hormone receptor (GHR) were found in GWAS using a high-density SNP chip platform [10,11,12,13,14,15]. GWAS of Korean Holstein were also performed using the Bovine SNP50K BeadChip platform (Illumina), indicating significant genetic regions such as DGAT1 related to milk production, fat, and protein [16,17].
The ultimate goal of GWAS is to elucidate the causative alteration rather than the locus, and high-density SNPs are required to identify such causative alterations closely. Furthermore, higher-density fine mapping was performed recently using a customized SNP array in which SNPs were included in the existing commercialized SNP chip platform through whole-genome sequencing methods or other genotyping techniques [18,19,20]. Although causal alterations are not always directly identified by this approach, this GWAS fine mapping method can highlight a narrower genomic region as potentially containing the causal alteration [21,22].
Bioinformatics analysis provides useful information for understanding the biological and biochemical mechanisms of genes at the molecular level [23]. Recent studies reported highly reliable results by analyzing the pathway or protein-protein interaction (PPI) based on candidate genes associated with milk production in dairy cattle [24,25,26,27,28]. The aim of the present study was to identify chromosome regions and candidate genes related to four milk production traits—adjusted 305-day milk yield (MY), adjusted 305-day fat yield (FY), adjusted 305-day protein yield (PY), and somatic cell score (SCS)—in a Korean Holstein population using high-density SNP chip platforms and two models to perform GWAS and fine mapping.

2. Materials and Methods

2.1. Animals and Phenotypes

The multi-lactation single-trait model considering parity, provided by the National Institute of Animal Science, was applied to MY, FY, PY, and SCS traits. The estimates for genetic, residual variances and heritability for each trait are shown in Table S1. The deregressed EBV (DEBVs), as response variables used in this study, were re-estimated using the EBVs and the reliabilities of each individual. In addition, to explain the heterogeneous variance resulting from the different reliabilities for each individual from the re-estimated response variables, the weighting factor was calculated using the following formula [29] and was applied to GWAS:
ω i = 1 h 2 c + 1 r i 2 r i 2 h 2
where r i 2 is the reliability of EBVs; h 2 is the heritability estimated for each trait; and c is the genetic variance ratio explained by the SNP marker information (assumed as 0.4) [30]. After converting response variables into DEBVs and excluding individuals with reliability (reliability EBVs—reliability of parent average) of 0.1 or less, the analysis of model for GWAS was performed with a group of 2780 animals (926 bulls and 1854 cows) whose genotype and phenotype data were available. The distributions of reliabilities are shown in Figure S1.

2.2. Genotyping

DNA samples (200 ng adjusted to 50 ng/µL) from 2780 Korean Holsteins (926 bulls and 1854 cows) were prepared from sampled hair according to standard protocols. DNA concentration and quality were measured using a NanoDrop ND-1000 spectrophotometer (NanoDrop Technologies, Wilmington, DE, USA). Genotypic data were obtained using three SNP panels: Illumina Bovine SNP50K v2 (n = 1095), Illumina Bovine SNP50K v3 (n = 1013), and Affymetrix Axiom Bovine Custom300K (n = 672) (Table S2).
Genome-wide SNP genotyping based on Ensembl Bos taurus UMD3.1 (http://oct2018.archive.ensembl.org/Bos_taurus/Info/Index accessed on 1 October 2020) was performed using either the Axiom Bovine Custom SNP300K array (Affymetrix Inc., Santa Clara, CA, USA) containing 297,424 SNPs or the Illumina Bovine SNP50K v2 and v3 BeadChip (Illumina, San Diego, CA, USA) containing 53,218 and 54,609 SNPs, respectively. To construct the customized Axiom array, SNPs were collected from previous commercial SNP genotyping platforms (i.e., Illumina Bovine50K versions and Affymetrix Bovine Genotyping array) and ranges of QTL regions (DGAT1, melanocortin 1 receptor (MC1R), EvC ciliary complex subunit 2 (EVC2), annexin A10 (ANXA10), GDNF family receptor alpha 2 (GFRA2), neurotrophin 3 (NTF3), argininosuccinate synthase 1 (ASS1), LDL receptor related protein 4 (LRP4), integrin subunit beta 2 (ITGB2), uridine monophosphate synthetase (UMPS), COPI coat complex subunit alpha (COPA), coagulation factor XI (F11), enoyl-CoA hydratase, short chain 1 (ECHS1), DNA polymerase lambda (POLL), myostatin (MSTN), zinc finger imprinted 2 (ZIM2), and anoctamin 2 (ANO2)) associated with various phenotypes in cattle including Holstein. Affymetrix Axiom Bovine Custom SNP300K Information of total SNPs in Affymetrix Axiom Bovine Custom SNP300K is described in Table S3.

2.3. Quality Control (QC) and Imputation

QC was performed with the SNPs and animals in each genotyping platform. First, for SNPs, the unmapped SNPs and sex chromosome SNPs were excluded, and then SNPs with a call rate < 0.95, minor allele frequency (MAF) < 0.01, and Hardy–Weinberg equilibrium (HWE) with p-value < 0.0001 were removed. Secondly, 57 individuals did not pass the call rate < 0.95 criterion, and additionally, 109 individuals whose genomic information differed from their pedigree information were also excluded based on a paternity test. After that, the imputation was performed based on the Affymetrix Axiom Bovine Custom SNP300K using FImputeV3 [31]. Finally, 2614 individuals with 201,704 SNPs were used for further analyses. Multidimensional scaling (MDS) was performed based on SNPs to indicate similarities between individuals.

2.4. GWAS

2.4.1. Single Marker Regression (SMR)

PLINK 1.9 [32] was used to perform an association analysis between SNP markers and DEBVs for each trait, which was tested with a single marker regression as follows:
y   =   μ   + X g + e
where y is a vector of DEBVs for each trait (MY, FY, PY, and SCS); μ is overall mean; X is a design matrix allocating records to the marker effect; g is the effect of the SNP marker; and e is a vector of the random deviate e i j ~ N 0 , σ e 2 , where σ e 2 is the error variance. In this additive model, the marker effect is treated as a fixed effect (0, 1, and 2). The results were also clumped based on LD between SNPs using—clump flag in PLINK 1.9 with the default option (index variants were formed with p-values < 0.0001, and SNPs which are less than 250 kb away from an index variant and have r2 larger than 0.5 with it were removed). The significance threshold of the −log10 p-value ≥ 6.61 was determined based on Bonferroni correction. In addition, Quantile-Quantile (Q-Q) plots for each phenotype were performed to identify population stratification or cryptic relatedness.

2.4.2. Bayesian C (BayesC) Approach

The general statistical model for the BayesC method was used with a π value of 0.997 and was fitted as follows:
y   =   μ   + k   =   1 K Z k α k + e
where y is an N × 1 vector of DEBVs for each trait (MY, FY, PY, and SCS); μ is the overall mean; K is the number of SNP markers; Z is an N × 1 vector of genotypes at SNP k ; α is the additive effect of that SNP marker; and e is a vector of residual effects. In the present study, SNP genotypes were coded as the number of copies of one of the SNP alleles (i.e., −10, 0, and 10) using GenSel4R software [33]. The BayesC method assumes that SNP effects follow a normal distribution as a priori, and all SNPs have common variance. SNP marker effects were obtained using Gibbs sampling, and the initial 10,000 iterations out of a total of 110,000 Markov chain Monte Carlo (MCMC) iterations were excluded as part of the burn-in period with a thinning interval of five iterations. The significance level of the informative 1 Mb window region was 0.5% of the additive genetic variance, which was estimated as a portion of the total genetic variance explained by all SNPs.

2.5. Functional Annotations

The PPI analysis was performed based on each candidate gene with the 20 most interactive genes using the Bos taurus database and STRING v11.0 [34]. To investigate the functions of candidate genes, the Kyoto Encyclopedia of Genes and Genomes (KEGG) [35] pathway analysis was performed using the Database for Annotation, Visualization and Integrated Discovery (DAVID) v6.8 [36].

3. Results

3.1. General Statistics

Statistical information of phenotypes (DEBVs) in Korean Holstein is indicated in Table S4. The genotypes of the Korean Holstein population were analyzed using the imputed genotype data, and after QC, 201,704 out of 297,424 SNPs were used in the GWAS. For a total of 29 BTA autosomes, the average interval (± standard deviation) was 13,048.3 ± 14,905.6 bp. Among the 29 BTA autosomes after excluding sex chromosomes, BTA 8 had the largest number of SNPs (n = 15,260), and BTA 27 had the smallest number of SNPs (n = 2959). As for the average interval between SNPs, the longest and shortest were found on BTA 15 (16,344.2 bp) and BTA 23 (3881.9 bp), respectively. In the MDS plot, high similarities between individuals were identified (Figure S2).

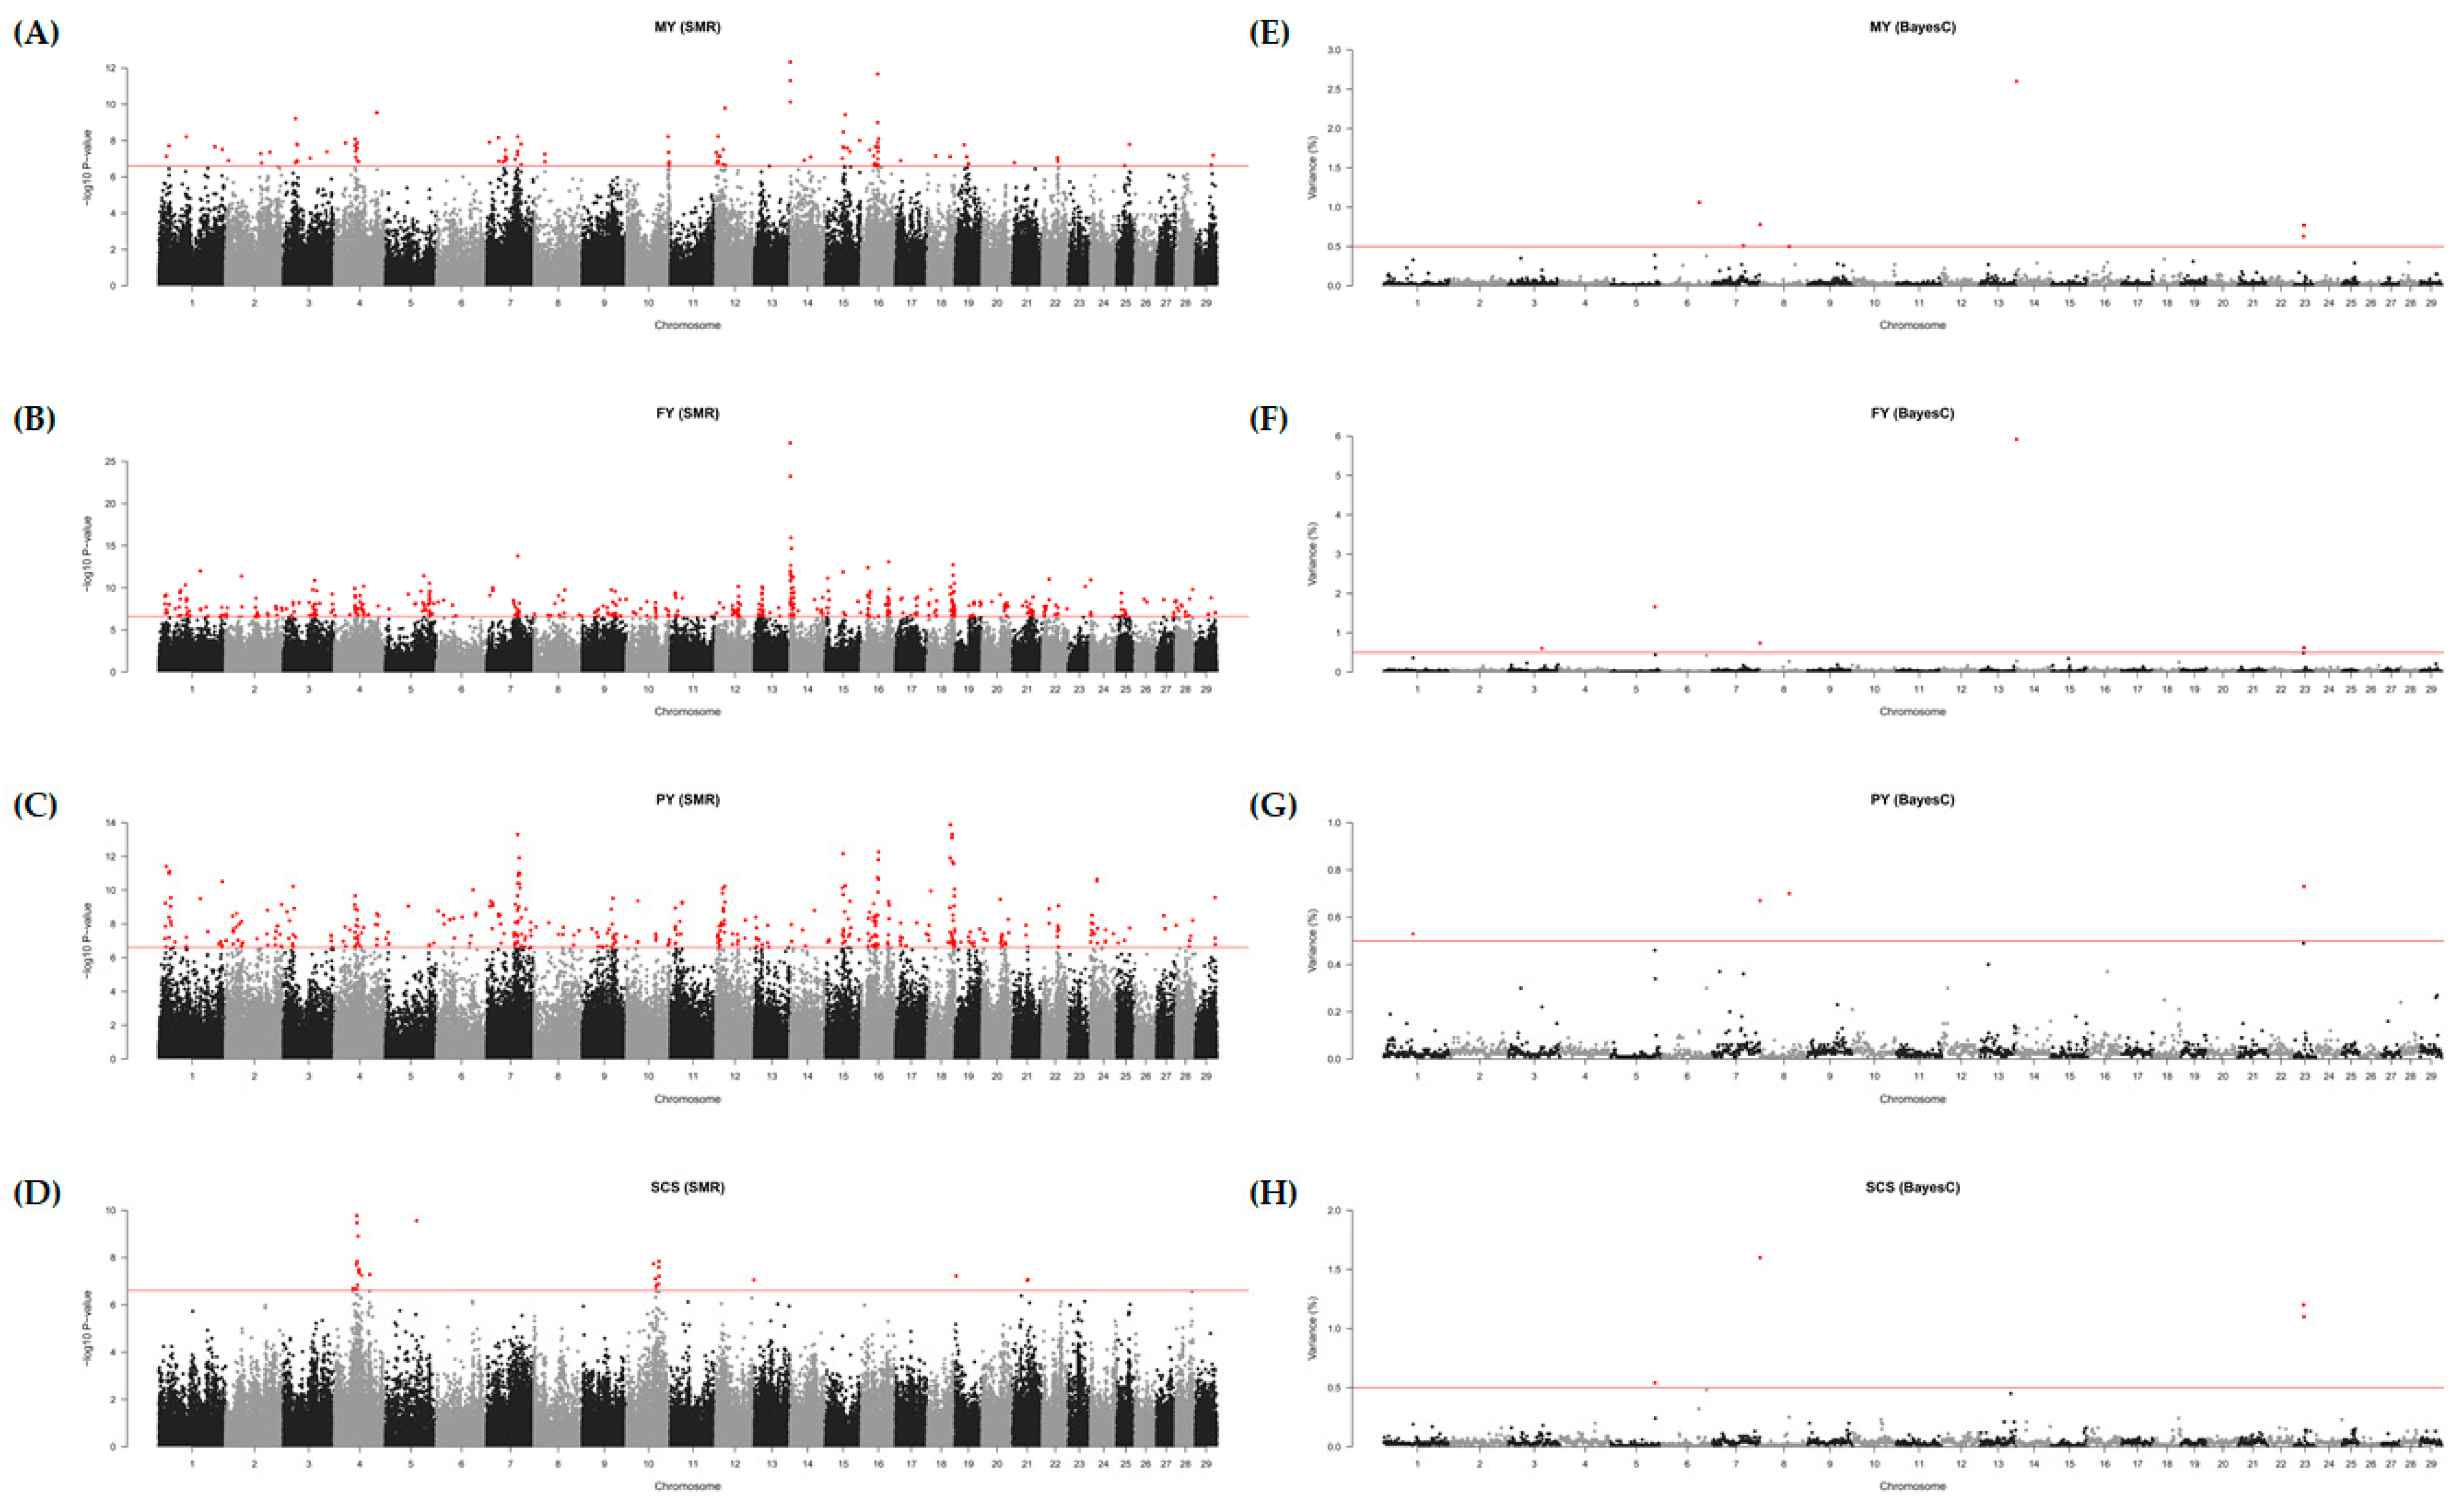
3.2. GWAS Based on the SMR

For the four DEBV phenotypes (MY, FY, PY, and SCS) related to milk production, significant SNPs were identified based on the SMR determined by the Bonferroni correction (−log10 p-value ≥ 6.61) (Table S5 and Figure 1A–D). Q-Q plots for each phenotype indicated the possibility of a spurious association by population stratification or cryptic relatedness (Figure S3). The numbers of significant SNPs were 104, 491, 409, and 26 for MY, FY, PY, and SCS, respectively. For the MY phenotype, the most significant SNP was AX-311625843 (rs211223469, 1.7 Mb on BTA 14) with MAF of 0.266 located in the intron of DGAT1, and the highest SNP effect was observed in AX-115105679 (rs109608009, 39.0 Mb on BTA 16) with MAF of 0.015 located in the intron of paired related homeobox 1 (PRRX1). For the FY phenotype, the most significant SNP was AX-115099068 (rs109146371, 1.6 Mb on BTA 14) with MAF of 0.284 located in the upstream region of forkhead box H1 (FOXH1), and the highest SNP effect was observed in AX-320911501 (rs42774899, 46.8 Mb on BTA 17) with MAF of 0.016 located in the intergenic region. For the PY phenotype, the most significant SNP was AX-429486957 (rs383397306, 55.5 Mb on BTA 18) with MAF of 0.068 located in the intron of transmembrane protein 143 (TMEM143), and the highest SNP effect was observed in AX-429404258 (rs211516787, 45.0 Mb on BTA 19) with MAF of 0.010 located in the exon of the meiosis specific with coiled-coil domain (MEIOC). For the SCS phenotype, the most significant SNP was the AX-429899067 (rs210219823, 53.2 Mb on BTA 4) with MAF of 0.399 located in the intergenic region, and the highest SNP effect was observed in AX-310577007 (rs209990081, 35.9 Mb on BTA 21) with MAF of 0.053 located in the intergenic region. The abovementioned SNPs are marked in red in Table S5.

3.3. GWAS Based on the BayesC

To identify the significant 1-Mb windows including SNPs, GWAS were performed with four DEBV phenotypes (MY, FY, PY, and SCS) based on BayesC. We found 20 window regions including 40 informative SNPs based on their genetic effects (Table 1 and Figure 1E–H). For the MY phenotype, seven significant windows (≥0.5% genetic variance) were identified on BTA 14 (1 Mb), 6 (88 Mb), 8 (0 Mb), 23 (24 Mb), 23 (23 Mb), 7 (73 Mb), and 8 (69 Mb) (Figure 1E). Seven informative SNPs (AX-371638654, AX-311625833, AX-419656711, AX-311625845, AX-371657011, and AX-419792758) were identified in the window on BTA 14, which were annotated in heat shock transcription factor 1 (HSF1) and DGAT1. In addition, two SNPs (AX-185121607 and AX-106735408) were identified in the window on BTA 6, which were located in the intergenic regions. The remaining five windows presented one informative SNP each, indicating relatively low genetic effects. For the FY phenotype, five significant windows were identified on BTA 14 (1 Mb), 5 (104 Mb), 8 (0 Mb), 23 (24 Mb), and 3 (79 Mb) (Figure 1F). Thirteen informative SNPs (AX-429953677, AX-115099034, AX-371657011, AX-419793247, AX-419656711, AX-212342341, AX-419792758, AX-117081655, AX-124353826, AX-311625843, AX-311625845, AX-311625833, and AX-371638654) were identified in the window on BTA 14, which were annotated in spermatogenesis and centriole associated 1 (SPATC1), DGAT1, and HSF1. In addition, two SNPs (AX-106724308 and AX-169413290) were identified in the window on BTA 3, which were located in phosphodiesterase 4B (PDE4B). The remaining three windows presented one informative SNP each, indicating relatively low genetic effects. For the PY phenotype, four significant windows were identified on BTA 23 (24 Mb), 8 (69 Mb), 8 (0 Mb), and 1 (69 Mb) (Figure 1G), and for the SCS phenotype, four significant windows were identified on BTA 8 (0 Mb), 23 (23 Mb), 23 (24 Mb), and 5 (104 Mb) (Figure 1H). Those windows in the PY and SCS presented one informative SNP each, showing low genetic effects.

3.4. Fine Mapping and Candidate Genes

To identify the common significant regions, we compared the GWAS results between SMR and BayesC in each phenotype (MY, FY, PY, and SCS). For the MY phenotype, the common significant regions were the 1–2 Mb on BTA 14 and 73–74 Mb on BTA 7. It was noted that AX-311625843 (rs211223469) in DGAT1 on BTA 14 showed significant effects in both methods (Figure S4A). For the FY phenotype, the common significant regions were the 1–2 Mb on BTA 14, 104–105 Mb on BTA 5, and 79–80 Mb on BTA 3 (Figure S4B). AX-419663582 (rs43454033) in ANO2 on BTA 5 and AX-106724308 (rs42314807) in PDE4B on BTA 3 were shown to have significant effects in both methods. Although no common SNPs between SMR and BayesC were found on BTA 14, many significant and informative SNPs were found in each method. The other significant region was the 69–70 Mb on BTA 8 for the PY (Figure S4C). That region in PY was indicated to contain no common SNPs but was closely located. Contrary to the MY and FY phenotypes, the BayesC results of the PY and SCS showed that the informative SNPs had lower genetic effects (Table 1).

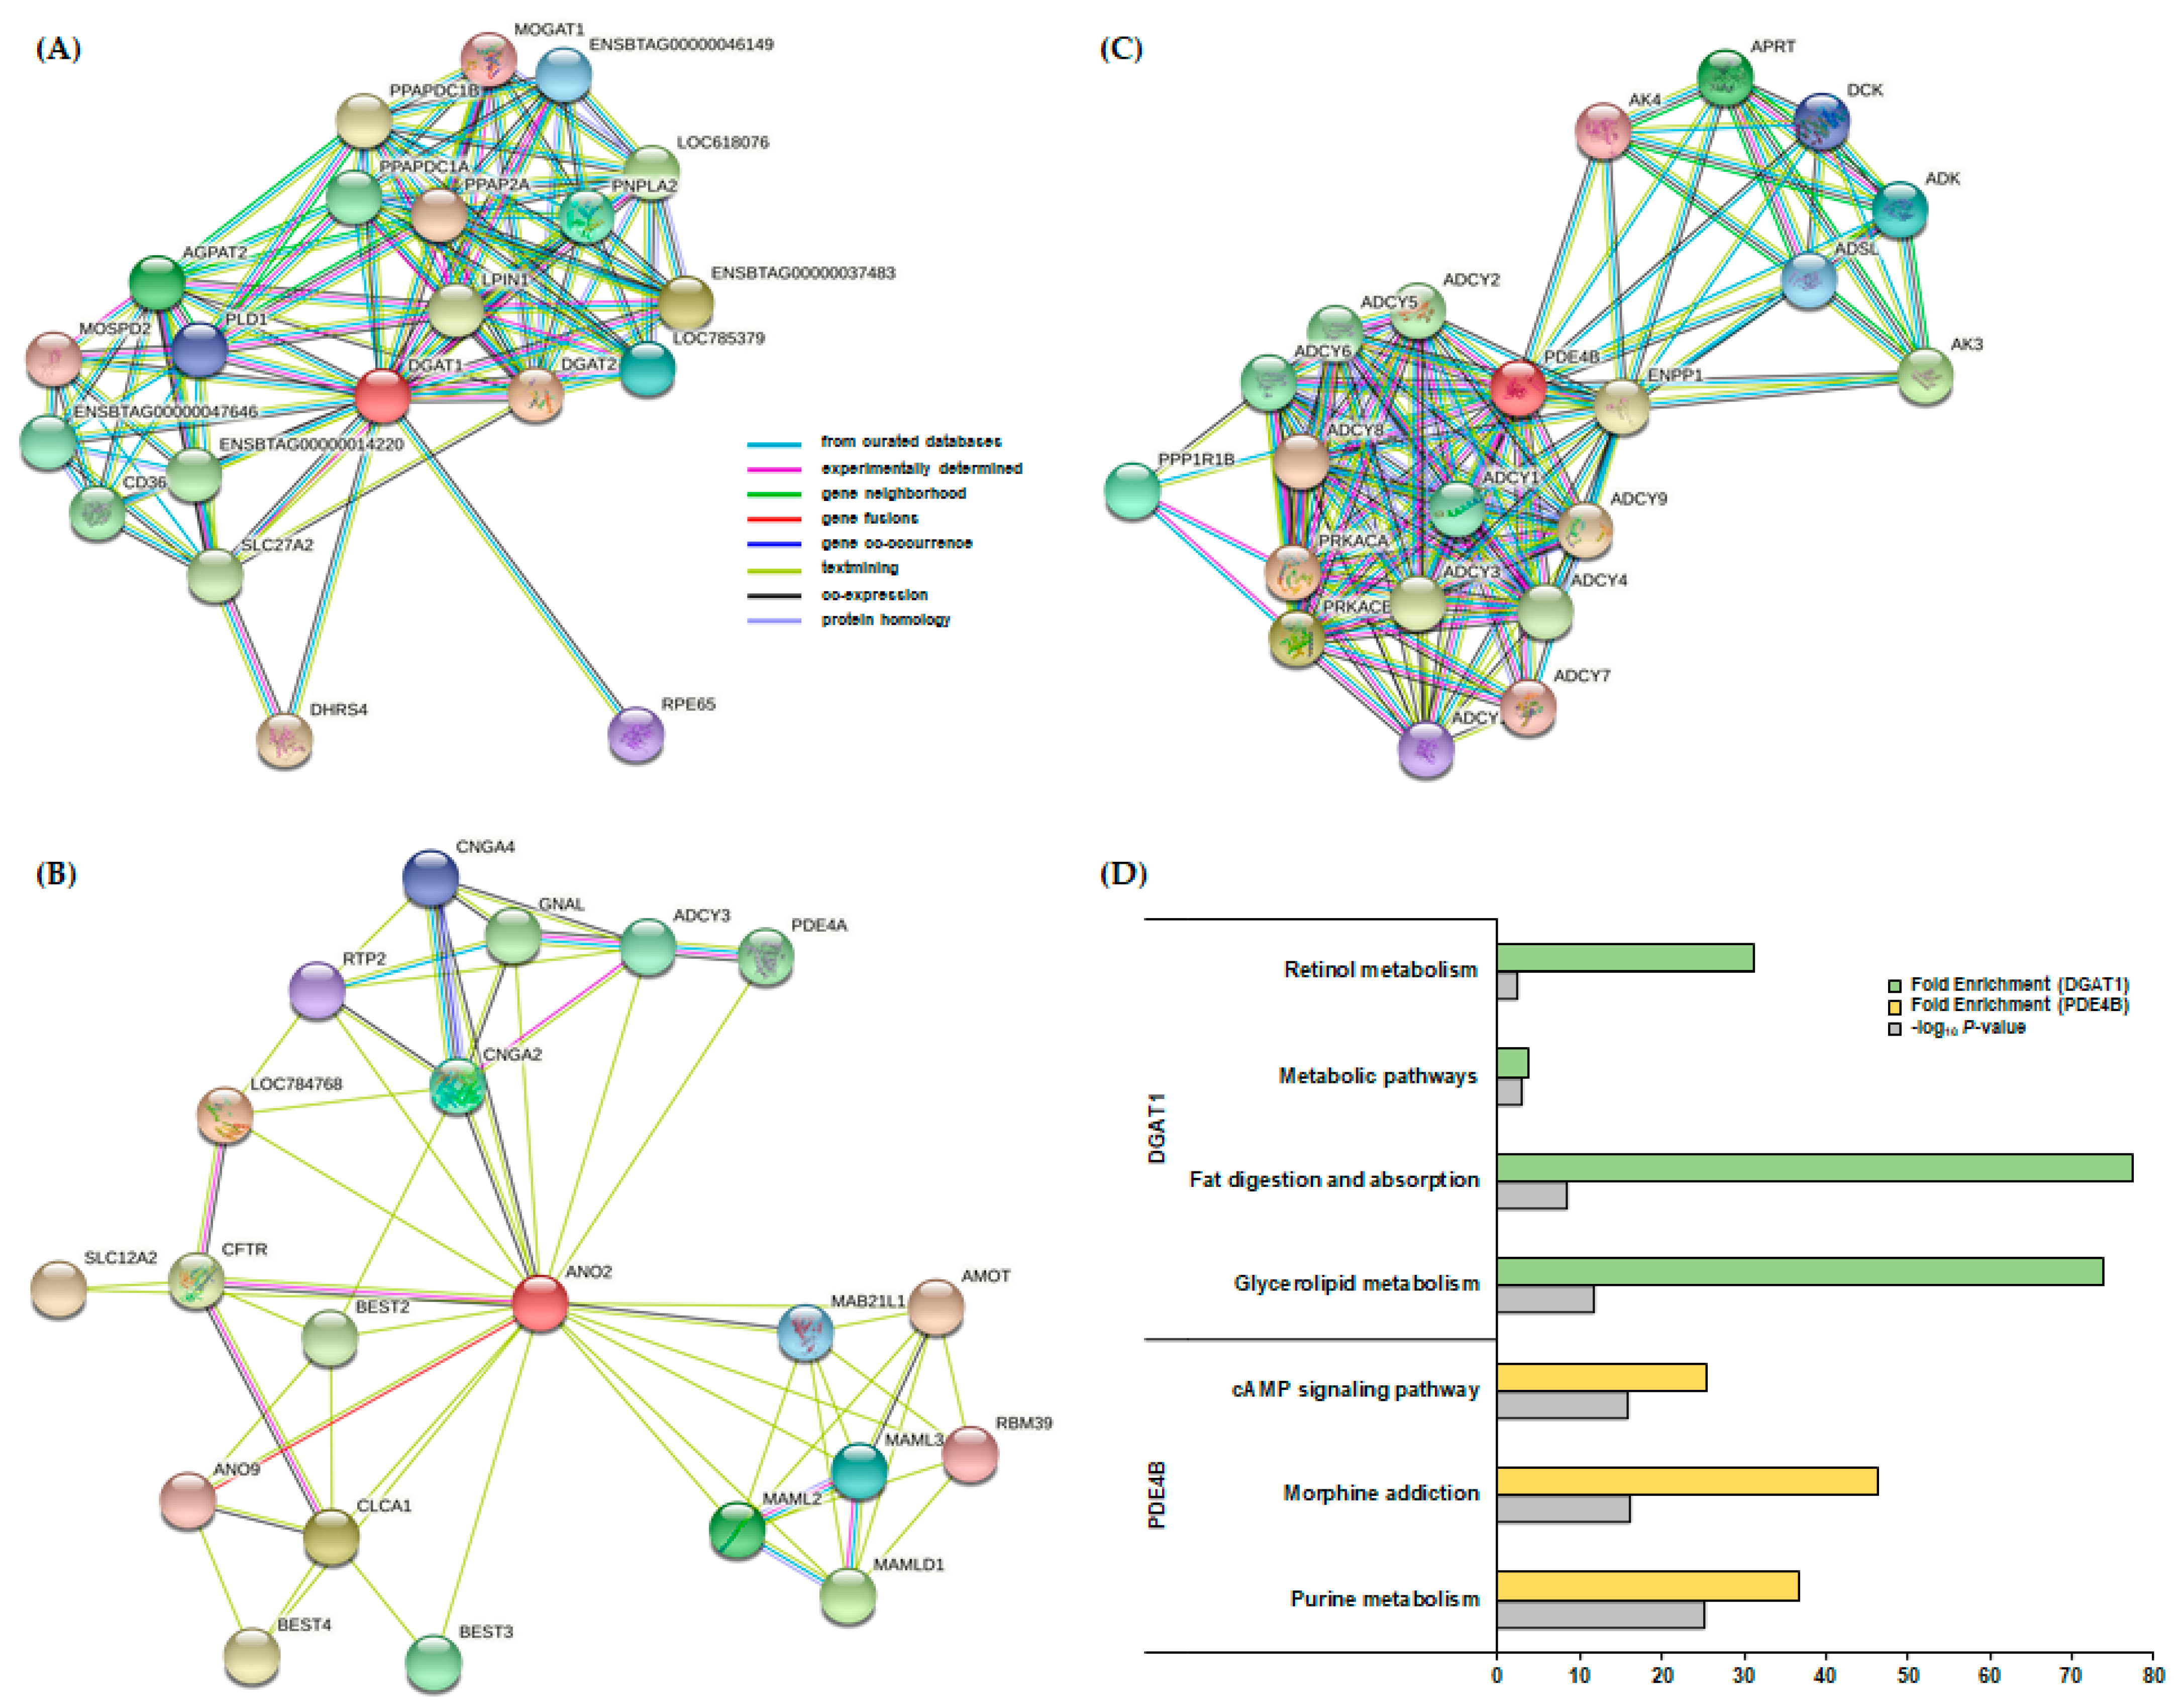
3.5. PPI and KEGG Pathway Analysis

The three candidate genes (DGAT1, ANO2, and PDE4B) were selected based on GWAS using the two methods (SMR and BayesC) and were subjected to PPI identification (Figure 2A–C). Twenty interactors for each gene were determined in PPI, and a KEGG enrichment analysis was performed. DGAT1, the candidate gene for MY and FY, had interactor genes annotated in four significant KEGG pathways (p-value < 0.1): glycerolipid metabolism, fat digestion and absorption, metabolic pathways, and retinol metabolism (Figure 2D). PDE4B, the candidate gene for FY, had interactor genes annotated in three significant KEGG pathways: purine metabolism, morphine addiction, and cAMP signaling (Figure 2D). ANO2, the candidate gene for FY, had interactor genes that were not annotated in any significant KEGG pathways. Detailed information of the significantly enriched pathways is indicated in Table S6.

4. Discussion

We developed the Affymetrix Axiom Bovine Custom300K customized chip for dairy cattle to utilize fine mapping methods and performed GWAS for four milk production phenotypes (MY, FY, PY, and SCS) in a Korean Holstein population. The associations between SNPs and phenotypes were analyzed based on two methods (SMR and BayesC). Many previous studies reported comparisons between these two methods [37,38,39,40,41].
The SMR has been used in many studies to address data from GWAS. The SMR and its modified methods were developed to detect the large effects of each SNP, but they are likely to overestimate the genetic effect of SNPs because they ignore the effects of other SNPs [42]. Although the Q-Q plots showed inflations by population stratification or cryptic relatedness (Figure S3), it can be postulated by features of the Axiom Bovine Custom300K involving high-density SNPs in QTL regions such as DGAT1 that MDS indicated high similarities in this population (Figure S2). The BayesC method that estimates all feasible genetic effects has been used as an alternative or improved method for QTL mapping or GWAS [42,43,44]. Although both SMR and BayesC methods are effective for detecting markers with large effects, the latter is more effective for detecting markers without overestimation [45,46]. BayesC with a high π value tends to highlight SNPs with large effects (variance), as they assume the prior distribution of the selected SNP effects (variances), suggesting that the SNP effect may be detected more clearly in the BayesC method than in the SMR [43]. Considering that these two methods have their own strengths and weakness, the present study focused on common regions and SNPs detected by both methods.
Five regions were identified to have significant effects in both methods in the GWAS and fine mapping of four phenotypes (MY, FY, PY, and SCS) (Figure S3). The BTA 14 (1–2 Mb) region that was found to be significant in both MY and FY has been reported to be significant in Chinese and U.S. Holstein populations [14,47]. In addition, BTA 7 (73–74 Mb) for MY and BTA 5 (104–105 Mb) for FY have also been reported to be significant in a Chinese Holstein population [11,48]. However, two remaining regions (BTA 3: 79–80 Mb and BTA 8: 69–70 Mb) were first reported in the present study.
AX-311625843 (rs211223469) at the 1–2 Mb in DGAT1 on BTA 14, in particular, is one of the most important SNPs, as it affects both MY and FY phenotypes. It was suggested that BTA 14 is an important QTL region [49,50,51] and that the DGAT1 gene is a causal gene related to the QTL region [52,53,54]. The DGAT1 gene produces an enzyme that catalyzes the final step in synthesizing triglyceride, which makes up about 98% of milk fat [55,56], and plays an important role in synthesizing triglyceride in mammary glands [57,58]. In addition, the DGAT1 gene encodes a key metabolic enzyme catalyzing the biosynthesis of triacylglycerols and participates in glycerolipid metabolism, retinol metabolism, and fat digestion and absorption as indicated by the KEGG pathway analysis and as reported previously [11,59]. The DGAT1 gene is considered to affect FY as well as MY in dairy cattle through physiological mechanisms.
AX-106724308 (rs42314807) at the 79–80 Mb in PDE4B on BTA 3 was identified to have a significant effect on FY in both methods. Previous studies observed a significantly strong relationship between the PDE4B gene and milk-related traits (MY, FY, and PY) [60,61,62]. PDE4 is cAMP-specific, known to be inhibited by rolipram [63,64], and is the biggest PDE family encoded by four genes (PDE4A, PDE4B, PDE4C, and PDE4D), which has been reported to be involved in various functional activities such as cell desensitization or adaptation, signaling cross-talk and cAMP signal compartmentalization. Although the correlation between the level of PDE4 and cAMP concentration remains unclear, this family is considered to be an important cAMP homeostatic regulator [65]. PDE4 transcripts and proteins were previously detected in cattle mammary glands, as were active enzymes, suggesting a functional role [66]. There were three significant KEGG pathways (purine metabolism, morphine addiction, and cAMP signaling pathway) based on the PDE4B with 20 interactor genes revealed by the KEGG enrichment analysis. Among the significant KEGG pathways, the cAMP signaling pathway was related to FY through the regulation of AMP-activated protein kinases by cAMP in adipocytes. This physiological mechanism was reported in previous studies [66,67,68].
AX-419663582 (rs43454033) at the 104–105 Mb in ANO2 on BTA 5 was identified to have a significant effect on FY in both methods. In previous studies, this region of BTA 5 was shown to have many QTL related to milk fat content, a characteristic of milk production [9,54,62,69]. The functions of the ANO2 gene in this region, however, were not reported in relation to milk content.
The region identified by both methods to have a significant effect on PY was the 69–70 Mb region on BTA 8, which was also shown to be a QTL region related to PY in previous studies [11,70]. The results of BayesC showed that, among the 2,288 SNPs across 1 Mb, there were almost no differences between the largest marker effect and the remaining ones. Therefore, these results indicate that the PY phenotype has a lower genetic effect than the MY and FY phenotypes.
As milk is produced through mammary glands, the health status of these glands is especially important, and the SCS is used as an index of health status. The somatic cells refer to the leukocytes of milk in cows. For example, as the leukocytes around the mammary glands of a dairy cow suffering from mastitis increase rapidly, and these leukocytes are reflected in the SCS of milk, this score indicates the presence of infection and the health status of the cow. A lower SCS represents a healthier cow as well as a higher quality of milk [71,72,73,74,75]. QTLs related to SCS were previously detected on BTA 5, 6, 8, 11, 17, 18, 20, and 23, and we detected them on BTA 8 (0–1 Mb), BTA 23 (23–25 Mb), and BTA 5 (104–105 Mb) associated with the SCS phenotype [76,77,78]. Similar to the results for the PY phenotype, the BayesC results showed no specific SNPs with significantly high genetic effects which were shared without noticeable difference. Therefore, we recommend that additional fine mapping should be performed, and the candidate gene approach should be more precisely applied to detect causal genes of PY and SCS phenotypes in Korean Holstein.

5. Conclusions

A GWAS was performed to analyze milk production phenotypes (MY, FY, PY, and SCS) in a Korean Holstein population, and six QTL regions (MY: 1–2 Mb on BTA 14 and 73–74 Mb on BTA 7; FY: 1–2 Mb on BTA 14, 104–105 Mb on BTA 5, and 79–80 Mb on BTA 3; PY: 69–70 Mb on BTA 8) were detected. In addition, DGAT1, ANO2, and PDE4B were subjected to PPI network and KEGG enrichment analyses, and the results showed that the DGAT1 gene is involved in glycerolipid metabolism, fat digestion and absorption, metabolic pathways, and retinol metabolism pathways, affecting the MY and FY phenotypes. The PDE4B gene was found to be closely involved in metabolic activity through the cAMP signaling pathway, affecting the FY phenotype. No strong candidate genes, however, were selected for the PY and SCS phenotypes, though significant regions were identified, suggesting the necessity of further studies. Our findings are expected to provide important information for the genomic selection of those phenotypes to improve milk production in Korean Holstein cattle.

Supplementary Materials

The following are available online at https://www.mdpi.com/article/10.3390/ani11051392/s1, Figure S1: The distribution for reliabilities of EBVs in each phenotype: (A) MY, (B) FY, (C) PY, and (D) SCS; Figure S2: Multidimensional scaling (MDS) plot based on SNPs for Korean Holstein population; Figure S3: Quantile-Quantile (Q-Q) plots for 4 milk production phenotypes based on single marker regression (SMR). (A) Q-Q plot for MY. (B) Q-Q plot for FY. (C) Q-Q plot for PY. (D) Q-Q plot for SCS; Figure S4: Visualization of the fine mapping in common significant regions by genome-wide association studies (GWAS) based on single marker regression (SMR) and Bayesian C (BayesC). (A) Common significant regions for MY. (B) Common significant regions for FY. (C) Common significant region for PY. Left Y- and Right Y-axis present effect (β, blue) in SMR and 1-Mb window genetic variance (red) in BayesC, respectively. Genes included in 1-Mb windows were annotated; Table S1: Variance components and heritability for four milk production phenotypes in Korean Holstein (n = 2780); Table S2: Summary of genotyped animals in each SNP genotyping platform; Table S3: Information of total SNPs in the Affymetrix Axiom Bovine Custom300K chip platform; Table S4: General statistics of DEBVs for 4 milk production phenotypes in Korean Holstein; Table S5: Summary of significant SNPs associated with DEBV phenotypes (MY, FY, PY, and SCS) based on SMR; Table S6: Significantly enriched KEGG pathways based on DGAT1 and PDE4B with 20 interactors.

Author Contributions

Conceptualization, S.K., J.-M.K. and J.L.; methodology, S.K., J.-M.K. and J.L.; formal analysis, S.K. and B.L.; writing—original draft preparation, S.K., J.-M.K. and J.L.; writing—review and editing, J.-M.K. and J.L.; supervision, J.C., S.L., C.-G.D., J.-H.J., J.-M.K. and J.L. All authors have read and agreed to the published version of the manuscript.

Funding

This work was carried out with the support of the “Cooperative Research Program for Agriculture Science and Technology Development (Project No. PJ0142582020)” Rural Development Administration, Republic of Korea, and the “Cooperative Research Program for Agriculture Science and Technology Development (Project No. PJ01496602)” Rural Development Administration, Korea. This research was supported by the Chung-Ang University Graduate Research Scholarship in 2019.

Institutional Review Board Statement

For sampling cattle breeds, the study protocol and standard operating procedures were reviewed and approved by the National Institute of Animal Science’s Institutional Animal Care and Use Committee (No. NIAS2016-189).

Informed Consent Statement

Not applicable.

Conflicts of Interest

The authors declare no conflict of interest.

References

  1. Henderson, C. Theoretical Basis and Computational Methods for a Number of Different Animal Models. J. Dairy Sci. 1988, 71, 1–16. [Google Scholar] [CrossRef]
  2. Georges, M.; Nielsen, D.; MacKinnon, M.; Mishra, A.; Okimoto, R.; Pasquino, A.T.; Sargeant, L.S.; Sorensen, A.; Steele, M.R.; Zhao, X. Mapping quantitative trait loci controlling milk production in dairy cattle by exploiting progeny testing. Genetics 1995, 139, 907–920. [Google Scholar] [CrossRef] [PubMed]
  3. Sellner, E.; Kim, J.; McClure, M.; Taylor, K.; Schnabel, R.; Taylor, J. Board-invited review: Applications of genomic information in livestock. J. Anim. Sci. 2007, 85, 3148–3158. [Google Scholar] [CrossRef] [PubMed]
  4. Meuwissen, T.H.; Goddard, M.E. Prediction of identity by descent probabilities from marker-haplotypes. Genet. Sel. Evol. 2001, 33, 1–30. [Google Scholar] [CrossRef] [Green Version]
  5. Daw, E.W.; Heath, S.C.; Lu, Y. Single-nucleotide polymorphism versus microsatellite markers in a combined linkage and segregation analysis of a quantitative trait. BMC Genet. 2005, 6, S32–S33. [Google Scholar] [CrossRef] [Green Version]
  6. Hirschhorn, J.N.; Daly, M.J. Genome-wide association studies for common diseases and complex traits. Nat. Rev. Genet. 2005, 6, 95–108. [Google Scholar] [CrossRef]
  7. Maxa, J.; Neuditschko, M.; Russ, I.; Förster, M.; Medugorac, I. Genome-wide association mapping of milk production traits in Braunvieh cattle. J. Dairy Sci. 2012, 95, 5357–5364. [Google Scholar] [CrossRef] [Green Version]
  8. Minozzi, G.; Nicolazzi, E.L.; Stella, A.; Biffani, S.; Negrini, R.; Lazzari, B.; Ajmone-Marsan, P.; Williams, J.L. Genome Wide Analysis of Fertility and Production Traits in Italian Holstein Cattle. PLoS ONE 2013, 8, e80219. [Google Scholar] [CrossRef] [Green Version]
  9. Nayeri, S.; Sargolzaei, M.; Abo-Ismail, M.K.; May, N.; Miller, S.P.; Schenkel, F.; Moore, S.S.; Stothard, P. Genome-wide association for milk production and female fertility traits in Canadian dairy Holstein cattle. BMC Genet. 2016, 17, 1–11. [Google Scholar] [CrossRef] [Green Version]
  10. Pausch, H.; Emmerling, R.; Gredler-Grandl, B.; Fries, R.; Daetwyler, H.D.; Goddard, M.E. Meta-analysis of sequence-based association studies across three cattle breeds reveals 25 QTL for fat and protein percentages in milk at nucleotide resolution. BMC Genom. 2017, 18, 853. [Google Scholar] [CrossRef] [Green Version]
  11. Liu, L.; Zhou, J.; Chen, C.; Zhang, J.; Wen, W.; Tian, J.; Zhang, Z.; Gu, Y. GWAS-Based Identification of New Loci for Milk Yield, Fat, and Protein in Holstein Cattle. Animals 2020, 10, 2048. [Google Scholar] [CrossRef]
  12. Buitenhuis, B.; Janss, L.L.G.; Poulsen, N.A.; Larsen, L.B.; Larsen, M.K.; Sørensen, P. Genome-wide association and biological pathway analysis for milk-fat composition in Danish Holstein and Danish Jersey cattle. BMC Genom. 2014, 15, 1–11. [Google Scholar] [CrossRef] [Green Version]
  13. Strucken, E.M.; Bortfeldt, R.H.; Tetens, J.; Thaller, G.; Brockmann, G.A. Genetic effects and correlations between production and fertility traits and their dependency on the lactation-stage in Holstein Friesians. BMC Genet. 2012, 13, 108. [Google Scholar] [CrossRef] [Green Version]
  14. Jiang, L.; Liu, J.; Sun, D.; Ma, P.; Ding, X.; Yu, Y.; Zhang, Q. Genome Wide Association Studies for Milk Production Traits in Chinese Holstein Population. PLoS ONE 2010, 5, e13661. [Google Scholar] [CrossRef] [Green Version]
  15. Wang, T.; Li, J.; Gao, X.; Song, W.; Chen, C.; Yao, D.; Ma, J.; Xu, L.; Ma, Y. Genome-wide association study of milk compo-nents in Chinese Holstein cows using single nucleotide polymorphism. Livest. Sci. 2020, 233, 103951. [Google Scholar] [CrossRef]
  16. Lee, S.; Dang, C.; Choy, Y.; Do, C.; Cho, K.; Kim, J.; Kim, Y.; Lee, J. Comparison of genome-wide association and genomic prediction methods for milk production traits in Korean Holstein cattle. Asian-Australas. J. Anim. Sci. 2019, 32, 913–921. [Google Scholar] [CrossRef]
  17. Shin, D.; Lee, C.; Park, K.-D.; Kim, H.; Cho, K.-H. Genome-association analysis of Korean Holstein milk traits using genomic estimated breeding value. Asian-Australas. J. Anim. Sci. 2015, 30, 309–319. [Google Scholar] [CrossRef]
  18. Li, Y.; Li, B.; Yang, M.; Han, H.; Chen, T.; Wei, Q.; Miao, Z.; Yin, L.; Wang, R.; Shen, J.; et al. Genome-Wide Association Study and Fine Mapping Reveals Candidate Genes for Birth Weight of Yorkshire and Landrace Pigs. Front. Genet. 2020, 11, 183. [Google Scholar] [CrossRef]
  19. Tribout, T.; Croiseau, P.; Lefebvre, R.; Barbat, A.; Boussaha, M.; Fritz, S.; Boichard, D.; Hoze, C.; Sanchez, M.-P. Confirmed effects of candidate variants for milk production, udder health, and udder morphology in dairy cattle. Genet. Sel. Evol. 2020, 52, 55. [Google Scholar] [CrossRef]
  20. Dutta, P.; Talenti, A.; Young, R.; Jayaraman, S.; Callaby, R.; Jadhav, S.K.; Dhanikachalam, V.; Manikandan, M.; Biswa, B.B.; Low, W.Y.; et al. Whole genome analysis of water buffalo and global cattle breeds highlights convergent signatures of domestication. Nature Commun. 2020, 11, 1–13. [Google Scholar] [CrossRef]
  21. Fang, M.; Georges, M. BayesFM: A software program to fine-map multiple causative variants in GWAS identified risk loci. bioRxiv 2016, 067801. [Google Scholar] [CrossRef] [Green Version]
  22. Huang, H.; International Inflammatory Bowel Disease Genetics Consortium; Fang, M.; Jostins, L.; Mirkov, M.U.; Boucher, G.; Anderson, C.A.; Andersen, V.; Cleynen, I.; Cortes, A.; et al. Fine-mapping inflammatory bowel disease loci to single-variant resolution. Nature 2017, 547, 173–178. [Google Scholar] [CrossRef] [Green Version]
  23. Kitano, H. Systems Biology: A Brief Overview. Science 2002, 295, 1662–1664. [Google Scholar] [CrossRef] [Green Version]
  24. Sanchez, M.-P.; Govignon-Gion, A.; Croiseau, P.; Fritz, S.; Hozé, C.; Miranda, G.; Martin, P.; Barbat-Leterrier, A.; Letaïef, R.; Rocha, D.; et al. Within-breed and multi-breed GWAS on imputed whole-genome sequence variants reveal candidate mutations affecting milk protein composition in dairy cattle. Genet. Sel. Evol. 2017, 49, 68. [Google Scholar] [CrossRef] [Green Version]
  25. Zhou, C.; Li, C.; Cai, W.; Liu, S.; Yin, H.; Shi, S.; Zhang, Q.; Zhang, S. Genome-wide association study for milk protein com-position traits in a Chinese Holstein population using a single-step approach. Front. Genet. 2019, 10, 72. [Google Scholar] [CrossRef] [Green Version]
  26. Du, C.; Deng, T.X.; Zhou, Y.; Ghanem, N.; Hua, G.H. Bioinformatics analysis of candidate genes for milk production traits in water buffalo (Bubalus bubalis). Trop. Anim. Health Prod. 2019, 52, 63–69. [Google Scholar] [CrossRef]
  27. Laodim, T.; Elzo, M.A.; Koonawootrittriron, S.; Suwanasopee, T.; Jattawa, D. Pathway enrichment and protein interaction network analysis for milk yield, fat yield and age at first calving in a Thai multibreed dairy population. Asian-Australas. J. Anim. Sci. 2018, 32, 508. [Google Scholar] [CrossRef]
  28. Palombo, V.; Milanesi, M.; Sgorlon, S.; Capomaccio, S.; Mele, M.; Nicolazzi, E.; Ajmone-Marsan, P.; Pilla, F.; Stefanon, B.; D’Andrea, M. Genome-wide association study of milk fatty acid composition in Italian Simmental and Italian Holstein cows using single nucleotide polymorphism arrays. J. Dairy Sci. 2018, 101, 11004–11019. [Google Scholar] [CrossRef] [Green Version]
  29. Garrick, D.J.; Taylor, J.F.; Fernando, R.L. Deregressing estimated breeding values and weighting information for genomic regression analyses. Genet. Sel. Evol. 2009, 41, 55. [Google Scholar] [CrossRef] [Green Version]
  30. Saatchi, M.; Schnabel, R.D.; Rolf, M.M.; Taylor, J.F.; Garrick, D.J. Accuracy of direct genomic breeding values for nationally evaluated traits in US Limousin and Simmental beef cattle. Genet. Sel. Evol. 2012, 44, 38. [Google Scholar] [CrossRef] [Green Version]
  31. Sargolzaei, M.; Chesnais, J.P.; Schenkel, F.S. A new approach for efficient genotype imputation using information from rela-tives. BMC Genom. 2014, 15, 478. [Google Scholar] [CrossRef] [PubMed] [Green Version]
  32. Purcell, S.; Neale, B.; Todd-Brown, K.; Thomas, L.; Ferreira, M.A.R.; Bender, D.; Maller, J.; Sklar, P.; de Bakker, P.I.W.; Daly, M.J.; et al. PLINK: A Tool Set for Whole-Genome Association and Population-Based Linkage Analyses. Am. J. Hum. Genet. 2007, 81, 559–575. [Google Scholar] [CrossRef] [PubMed] [Green Version]
  33. Garrick, D.J.; Fernando, R.L. Implementing a QTL detection study (GWAS) using genomic prediction methodology. In Genome-Wide Association Studies and Genomic Prediction; Humana Press: Totowa, NJ, USA, 2013; pp. 275–298. [Google Scholar]
  34. Szklarczyk, D.; Gable, A.L.; Lyon, D.; Junge, A.; Wyder, S.; Huerta-Cepas, J.; Simonovic, M.; Doncheva, N.T.; Morris, J.H.; Bork, P.; et al. STRING v11: Protein–Protein association networks with increased coverage, supporting functional discovery in genome-wide experimental datasets. Nucleic Acids Res. 2019, 47, D607–D613. [Google Scholar] [CrossRef] [PubMed] [Green Version]
  35. Ogata, H.; Goto, S.; Sato, K.; Fujibuchi, W.; Bono, H.; Kanehisa, M. KEGG: Kyoto Encyclopedia of Genes and Genomes. Nucleic Acids Res. 1999, 27, 29–34. [Google Scholar] [CrossRef] [Green Version]
  36. Dennis, G.; Sherman, B.T.; Hosack, D.A.; Yang, J.; Gao, W.; Lane, H.C.; Lempicki, R.A. DAVID: Database for annotation, visualization, and integrated discovery. Genome Biol. 2003, 4, 1–11. [Google Scholar] [CrossRef] [Green Version]
  37. Ponsuksili, S.; Reyer, H.; Trakooljul, N.; Murani, E.; Wimmers, K. Single-and Bayesian multi-marker genome-wide associa-tion for haematological parameters in pigs. PLoS ONE 2016, 11, e0159212. [Google Scholar] [CrossRef] [Green Version]
  38. Toosi, A.; Fernando, R.L.; Dekkers, J.C.M. Genome-wide mapping of quantitative trait loci in admixed populations using mixed linear model and Bayesian multiple regression analysis. Genet. Sel. Evol. 2018, 50, 32. [Google Scholar] [CrossRef] [Green Version]
  39. Yi, H.; Breheny, P.; Imam, N.; Liu, Y.; Hoeschele, I. Penalized multimarker vs. single-marker regression methods for ge-nome-wide association studies of quantitative traits. Genetics 2015, 199, 205–222. [Google Scholar] [CrossRef] [Green Version]
  40. Zare, Y.; Shook, G.E.; Collins, M.T.; Kirkpatrick, B.W. Genome-wide association analysis and genomic prediction of Myco-bacterium avium subspecies paratuberculosis infection in US Jersey cattle. PLoS ONE 2014, 9, e88380. [Google Scholar] [CrossRef] [Green Version]
  41. Gao, Y.; Dong, L.; Xu, S.; Xiao, S.; Fang, M.; Wang, Z. Genome-wide association study using single marker analysis and Bayesian methods for the gonadosomatic index in the large yellow croaker. Aquaculture 2018, 486, 26–30. [Google Scholar] [CrossRef]
  42. Li, J.; Das, K.; Fu, G.; Li, R.; Wu, R. The Bayesian lasso for genome-wide association studies. Bioinformatics 2010, 27, 516–523. [Google Scholar] [CrossRef]
  43. Xu, S. Estimating Polygenic Effects Using Markers of the Entire Genome. Genetics 2003, 163, 789–801. [Google Scholar] [CrossRef]
  44. Yi, N.; George, V.; Allison, D.B. Stochastic Search Variable Selection for Identifying Multiple Quantitative Trait Loci. Genetics 2003, 164, 1129–1138. [Google Scholar] [CrossRef]
  45. Ball, R.D. Bayesian Methods for Quantitative Trait Loci Mapping Based on Model Selection: Approximate Analysis Using the Bayesian Information Criterion. Genetics 2001, 159, 1351–1364. [Google Scholar] [CrossRef]
  46. Meuwissen, T.H.; Hayes, B.J.; Goddard, M.E. Prediction of total genetic value using genome-wide dense marker maps. Genetics 2001, 157, 1819–1829. [Google Scholar] [CrossRef]
  47. Jiang, J.; Ma, L.; Prakapenka, D.; VanRaden, P.M.; Cole, J.B.; Da, Y. A large-scale genome-wide association study in US Holstein cattle. Front. Genet. 2019, 10, 412. [Google Scholar] [CrossRef]
  48. Wang, X.; Ma, P.; Liu, J.; Zhang, Q.; Zhang, Y.; Ding, X.; Jiang, L.; Wang, Y.; Zhang, Y.; Sun, D.; et al. Genome-wide association study in Chinese Holstein cows reveal two candidate genes for somatic cell score as an indicator for mastitis susceptibility. BMC Genet. 2015, 16, 1–9. [Google Scholar] [CrossRef]
  49. Ashwell, M.; Heyen, D.; Sonstegard, T.; Van Tassell, C.; Da, Y.; VanRaden, P.; Ron, M.; Weller, J.; Lewin, H. Detection of Quantitative Trait Loci Affecting Milk Production, Health, and Reproductive Traits in Holstein Cattle. J. Dairy Sci. 2004, 87, 468–475. [Google Scholar] [CrossRef] [Green Version]
  50. Coppieters, W.; Riquet, J.; Arranz, J.-J.; Berzi, P.; Cambisano, N.; Grisart, B.; Karim, L.; Marcq, F.; Moreau, L.; Nezer, C.; et al. A QTL with major effect on milk yield and composition maps to bovine Chromosome 14. Mamm. Genome 1998, 9, 540–544. [Google Scholar] [CrossRef]
  51. Heyen, D.W.; Weller, J.I.; Ron, M.; Band, M.; Beever, J.E.; Feldmesser, E.; Da, Y.; Wiggans, G.R.; VanRaden, P.M.; Lewin, H.A. A genome scan for QTL influencing milk production and health traits in dairy cattle. Physiol. Genom. 1999, 1, 165–175. [Google Scholar] [CrossRef] [Green Version]
  52. Grisart, B.; Farnir, F.; Karim, L.; Cambisano, N.; Kim, J.-J.; Kvasz, A.; Mni, M.; Simon, P.; Frere, J.-M.; Coppieters, W.; et al. Genetic and functional confirmation of the causality of the DGAT1 K232A quantitative trait nucleotide in affecting milk yield and composition. Proc. Natl. Acad. Sci. USA 2004, 101, 2398–2403. [Google Scholar] [CrossRef] [Green Version]
  53. Wang, X.; Wurmser, C.; Pausch, H.; Jung, S.; Reinhardt, F.; Tetens, J.; Thaller, G.; Fries, R. Identification and Dissection of Four Major QTL Affecting Milk Fat Content in the German Holstein-Friesian Population. PLoS ONE 2012, 7, e40711. [Google Scholar] [CrossRef] [Green Version]
  54. Raven, L.-A.; Cocks, B.G.; Hayes, B.J. Multibreed genome wide association can improve precision of mapping causative variants underlying milk production in dairy cattle. BMC Genom. 2014, 15, 62. [Google Scholar] [CrossRef] [Green Version]
  55. Cases, S.; Smith, S.J.; Zheng, Y.-W.; Myers, H.M.; Lear, S.R.; Sande, E.; Novak, S.; Collins, C.; Welch, C.B.; Lusis, A.J. Identification of a gene encoding an acyl CoA: Diacylglycerol acyltransferase, a key enzyme in triacylglycerol synthesis. Proc. Natl. Acad. Sci. USA 1998, 95, 13018–13023. [Google Scholar] [CrossRef] [Green Version]
  56. Cheng, D.; Meegalla, R.L.; He, B.; Cromley, D.A.; Billheimer, J.T.; Young, P.R. Human acyl-CoA: Diacylglycerol acyltransferase is a tetrameric protein. Biochem. J. 2001, 359, 707–714. [Google Scholar] [CrossRef]
  57. Smith, S.J.; Cases, S.; Jensen, D.R.; Chen, H.C.; Sande, E.; Tow, B.; Sanan, D.A.; Raber, J.; Eckel, R.H.; Farese, R.V. Obesity resistance and multiple mechanisms of triglyceride synthesis in mice lacking Dgat. Nat. Genet. 2000, 25, 87–90. [Google Scholar] [CrossRef]
  58. Winter, A.; Krämer, W.; Werner, F.A.; Kollers, S.; Kata, S.; Durstewitz, G.; Buitkamp, J.; Womack, J.E.; Thaller, G.; Fries, R. Association of a lysine-232/alanine polymorphism in a bovine gene encoding acyl-CoA: Diacylglycerol acyltransferase (DGAT1) with variation at a quantitative trait locus for milk fat content. Proc. Natl. Acad. Sci. USA 2002, 99, 9300–9305. [Google Scholar] [CrossRef] [Green Version]
  59. Yen, C.-L.E.; Stone, S.J.; Koliwad, S.; Harris, C.; Farese, R.V., Jr. Thematic review series: Glycerolipids. DGAT enzymes and triacylglycerol biosynthesis. J. Lipid Res. 2008, 49, 2283–2301. [Google Scholar] [CrossRef] [Green Version]
  60. Lee, Y.-S.; Shin, D.; Lee, W.; Taye, M.; Cho, K.; Park, K.-D.; Kim, H. The prediction of the expected current selection coefficient of single nucleotide polymorphism associated with Holstein milk yield, fat and protein contents. Asian-Australas. J. Anim. Sci. 2016, 29, 36. [Google Scholar] [CrossRef] [Green Version]
  61. Kolbehdari, D.; Wang, Z.; Grant, J.R.; Murdoch, B.; Prasad, A.; Xiu, Z.; Marques, E.; Stothard, P.; Moore, S.S. A whole genome scan to map QTL for milk production traits and somatic cell score in Canadian Holstein bulls. J. Anim. Breed. Genet. 2009, 126, 216–227. [Google Scholar] [CrossRef]
  62. Boichard, D.; Grohs, C.; Bourgeois, F.; Cerqueira, F.; Faugeras, R.; Neau, A.; Rupp, R.; Amigues, Y.; Boscher, M.Y.; Levéziel, H. Detection of genes influencing economic traits in three French dairy cattle breeds. Genet. Sel. Evol. 2003, 35, 77–101. [Google Scholar] [CrossRef] [PubMed]
  63. Lugnier, C.; Stierlé, A.; Beretz, A.; Schoeffter, P.; Lebec, A.; Wermuth, C.-G.; Cazenave, J.-P.; Stoclet, J.-C. Tissue and substrate specificity of inhibition by alkoxy-aryl-lactams of platelet and arterial smooth muscle cyclic nucleotide phosphodiesterases relationship to pharmacological activity. Biochem. Biophys. Res. Commun. 1983, 113, 954–959. [Google Scholar] [CrossRef]
  64. Lugnier, C.; Schoeffter, P.; Le Bec, A.; Strouthou, E.; Stoclet, J. Selective inhibition of cyclic nucleotide phosphodiesterases of human, bovine and rat aorta. Biochem. Pharmacol. 1986, 35, 1743–1751. [Google Scholar] [CrossRef]
  65. Conti, M.; Richter, W.; Mehats, C.; Livera, G.; Park, J.-Y.; Jin, C. Cyclic AMP-specific PDE4 Phosphodiesterases as Critical Components of Cyclic AMP Signaling. J. Biol. Chem. 2003, 278, 5493–5496. [Google Scholar] [CrossRef] [Green Version]
  66. Dostaler-Touchette, V.; Bédard, F.; Guillemette, C.; Pothier, F.; Chouinard, P.; Richard, F. Cyclic adenosine monophosphate (cAMP)-specific phosphodiesterase is functional in bovine mammary gland. J. Dairy Sci. 2009, 92, 3757–3765. [Google Scholar] [CrossRef]
  67. Omar, B.; Zmuda-Trzebiatowska, E.; Manganiello, V.; Göransson, O.; Degerman, E. Regulation of AMP-activated protein kinase by cAMP in adipocytes: Roles for phosphodiesterases, protein kinase B, protein kinase A, Epac and lipolysis. Cell. Signal. 2009, 21, 760–766. [Google Scholar] [CrossRef] [Green Version]
  68. Xie, W.; Ye, Y.; Feng, Y.; Xu, T.; Huang, S.; Shen, J.; Leng, Y. Linderane Suppresses Hepatic Gluconeogenesis by Inhibiting the cAMP/PKA/CREB Pathway Through Indirect Activation of PDE 3 via ERK/STAT3. Front. Pharmacol. 2018, 9, 476. [Google Scholar] [CrossRef] [Green Version]
  69. Cochran, S.D.; Cole, J.B.; Null, D.J.; Hansen, P.J. Discovery of single nucleotide polymorphisms in candidate genes associated with fertility and production traits in Holstein cattle. BMC Genet. 2013, 14, 49. [Google Scholar] [CrossRef] [Green Version]
  70. Meredith, B.K.; Kearney, F.J.; Finlay, E.K.; Bradley, D.G.; Fahey, A.G.; Berry, D.P.; Lynn, D.J. Genome-wide associations for milk production and somatic cell score in Holstein-Friesian cattle in Ireland. BMC Genet. 2012, 13, 21. [Google Scholar] [CrossRef] [Green Version]
  71. Hinrichs, D.; Stamer, E.; Junge, W.; Kalm, E. Genetic Analyses of Mastitis Data Using Animal Threshold Models and Genetic Correlation with Production Traits. J. Dairy Sci. 2005, 88, 2260–2268. [Google Scholar] [CrossRef] [Green Version]
  72. Heringstad, B.; Gianola, D.; Chang, Y.; Ødegård, J.; Klemetsdal, G. Genetic associations between clinical mastitis and somatic cell score in early first-lactation cows. J. Dairy Sci. 2006, 89, 2236–2244. [Google Scholar] [CrossRef] [Green Version]
  73. Bloemhof, S.; de Jong, G.; de Haas, Y. Genetic parameters for clinical mastitis in the first three lactations of Dutch Holstein cattle. Vet. Microbiol. 2009, 134, 165–171. [Google Scholar] [CrossRef] [Green Version]
  74. De Haas, Y.; Ouweltjes, W.; Napel, J.T.; Windig, J.; De Jong, G. Alternative Somatic Cell Count Traits as Mastitis Indicators for Genetic Selection. J. Dairy Sci. 2008, 91, 2501–2511. [Google Scholar] [CrossRef] [Green Version]
  75. Koivula, M.; Mäntysaari, E.; Negussie, E.; Serenius, T. Genetic and Phenotypic Relationships Among Milk Yield and Somatic Cell Count Before and After Clinical Mastitis. J. Dairy Sci. 2005, 88, 827–833. [Google Scholar] [CrossRef] [Green Version]
  76. Sender, G.; Korwin-Kossakowska, A.; Pawlik, A.; Hameed, K.G.A.; Oprządek, J. Genetic Basis of Mastitis Resistance in Dairy Cattle–A Review/Podstawy Genetyczne Odporności Krów Mlecznych Na Zapalenie Wymienia–Artykuł Przeglądowy. Ann. Anim. Sci. 2013, 13, 663–673. [Google Scholar] [CrossRef] [Green Version]
  77. Meredith, B.; Lynn, D.; Berry, D.; Kearney, F.; Bradley, D.; Finlay, E.; Fahey, A. A genome-wide association study for somatic cell score using the Illumina high-density bovine beadchip identifies several novel QTL potentially related to mastitis susceptibility. Front. Genet. 2013, 4, 229. [Google Scholar] [CrossRef] [Green Version]
  78. Tal-Stein, R.; Fontanesi, L.; Dolezal, M.; Scotti, E.; Bagnato, A.; Russo, V.; Canavesi, F.; Friedmann, A.; Soller, M.; Lipkin, E. A genome scan for QTL affecting milk somatic cell count in Israeli and Italian Holstein cows by means selective DNA pooling with multiple marker mapping. J. Dairy Sci. 2010, 93, 4913–4927. [Google Scholar] [CrossRef] [Green Version]
Figure 1. Manhattan plots for genome-wide association studies (GWAS) based on the single marker regression (SMR) and Bayesian C (BayesC) methods. GWAS performed in four phenotypes: (A,E) the adjusted 305-day milk yield (MY), (B,F) the adjusted 305-day fat yield (FY), (C,G) the adjusted 305-day protein yield (PY), and (D,H) the log2 transferred somatic cell score (SCS). Red dots represent significant SNPs or windows on SMR and BayesC, respectively.
Animals 11 01392 g001
Figure 2. Protein–protein interaction (PPI) network and Kyoto Encyclopedia of Genes and Genomes (KEGG) pathway analyses for three candidate genes (DGAT1, ANO2, and PDE4B) with 20 interactor genes. (A) DGAT1 with 20 interactors confirmed by PPI. (B) ANO2 with 20 interactors were confirmed by PPI. (C) PDE4B with 20 interactors confirmed by PPI. (D) KEGG enrichment analysis for DGAT1 and PDE4B with 20 interactors.
Animals 11 01392 g002
Table 1. Summary of informative SNPs in the significant 1-Mb windows associated with DEBV phenotypes (MY, FY, PY, and SCS) based on BayesC.
PHENOTYPE (DEBV) aBTA (Mb) bGV (%) cInformative SNPRs NumberPosition dSNP EffectModel FrequencyRegion AnnotationGene Annotation
MY14 (1)2.60AX-371638654rs2110166271,807,65523.91000.1845IntronHSF1
AX-311625833rs3849570471,793,616−22.19000.1717Upstream geneDGAT1
(dist = 1735)
AX-311625843rs2112234691,799,476−20.49000.1617IntronDGAT1
AX-419656711rs2112827451,805,963−17.55000.1415Downstream geneHSF1
(dist = 118)
AX-311625845rs2098761511,800,439−15.90000.1300IntronDGAT1
AX-371657011rs2086402921,806,87512.80000.1095SynonymousHSF1
AX-419792758rs2076557441,806,34012.33000.10573 prime UTRHSF1
6 (88)1.03AX-185121607rs11077560188,952,08978.44000.6617IntergenicNPFFR2
(dist = 100,121)
AX-106735408rs11052722488,592,29517.99000.1741IntergenicSLC4A4
(dist = 54,249)
8 (0)0.78AX-419764649rs721532493887,406−1.06400.0183IntronPALLD
23 (24)0.77AX-419655926rs38022371524,021,950−1.30300.0180IntronPKHD1
23 (23)0.63AX-419634159rs51770388723,999,941−1.05600.0169IntronPKHD1
7 (73)0.51AX-169404932rs13547760973,561,3124.04600.0477IntergenicADRA1B
(dist = 49,805)
8 (69)0.50AX-419751453rs52404903769,514,127−1.72100.0251IntronGFRA2
FY14 (1)5.92AX-429953677rs1108121361,991,2251.92900.3670IntronSPATC1
AX-115099034rs1094213001,801,1161.51900.2793IntronDGAT1
AX-371657011rs2086402921,806,875−1.10100.2097SynonymousHSF1
AX-419793247rs2083173641,800,399−0.97660.1922IntronDGAT1
AX-419656711rs2112827451,805,9630.85080.1682Downstream geneHSF1
(dist = 118)
AX-212342341rs1352589191,808,1450.84990.1693MissenseHSF1
AX-419792758rs2076557441,806,340−0.84300.16753 prime UTRHSF1
AX-117081655rs1092342501,802,265−0.77520.1565MissenseDGAT1
AX-124353826rs1093269541,802,266−0.68480.1395MissenseDGAT1
AX-311625843rs2112234691,799,4760.66950.1367IntronDGAT1
AX-311625845rs2098761511,800,4390.63130.1319IntronDGAT1
AX-311625833rs3849570471,793,6160.59410.1243Upstream geneDGAT1
(dist = 1735)
AX-371638654rs2110166271,807,655−0.49480.1052IntronHSF1
5 (104)1.66AX-419663582rs43454033104,831,727−0.17670.0560IntronANO2
8 (0)0.74AX-419764649rs721532493887,406−0.03190.0143IntronPALLD
23 (24)0.62AX-419669189rs43587163924,210,330−0.01680.0086IntronPKHD1
3 (79)0.60AX-106724308rs4231480779,480,234−1.80500.4151IntronPDE4B
AX-169413290rs4159688579,508,4020.70120.1766IntronPDE4B
PY23 (24)0.73AX-419655926rs38022371524,021,950−0.01180.0086IntronPKHD1
8 (69)0.70AX-419606850rs21141940369,542,993−0.02590.0144IntronGFRA2
8 (0)0.67AX-419764649rs721532493887,406−0.02140.0137IntronPALLD
1 (69)0.53AX-419771850rs79907464369,736,6620.06070.0294IntronUMPS
SCS8 (0)1.60AX-419631051rs109008410668,0480.00120.0253IntronPALLD
23 (23)1.20AX-312701115rs46772152023,807,184−0.00060.0150IntronPKHD1
23 (24)1.10AX-106721976rs10982518124,117,682−0.00120.0246IntronPKHD1
5 (104)0.54AX-124344695rs110571898104,682,2380.00050.0127MissenseVWF
a MY: Adjusted-305 days milk yield (kg); FY: Adjusted-305 days fat yield (kg); PY: Adjusted-305 days protein yield (kg); SCS: log2 transferred somatic cell score; b Bos taurus autosome; c Genetic variance; d The positions were based on UMD3.1.
Publisher’s Note: MDPI stays neutral with regard to jurisdictional claims in published maps and institutional affiliations.

