Article

Genetic Variability of Methane Production and Concentration Measured in the Breath of Polish Holstein-Friesian Cattle

Department of Genetics and Animal Breeding, Poznan University of Life Sciences, 60-637 Poznan, Poland
*
Author to whom correspondence should be addressed.
Animals 2021, 11(11), 3175; https://doi.org/10.3390/ani11113175
Submission received: 4 October 2021 / Revised: 29 October 2021 / Accepted: 4 November 2021 / Published: 6 November 2021
(This article belongs to the Section Animal Genetics and Genomics)

Abstract

:

Simple Summary

Methane is one of the main contributors to climate change. A potential to reduce emissions by genetic selection exists; however, the genetic architecture of methane production remains largely unknown. We aimed to estimate its heritability and to perform genome-wide association studies for the identification of candidate genes associated with daily methane production and concentration. Methane was measured in the air exhaled by dairy cows during milking in an automated milking system and was analyzed using genomic information that was available for some of the cows. We showed that methane production and concentration are partly controlled by genes; however, no major genes were found. The estimated heritabilities indicate that selection for lower methane emission could be successful.

Abstract

The genetic architecture of methane (CH4) production remains largely unknown. We aimed to estimate its heritability and to perform genome-wide association studies (GWAS) for the identification of candidate genes associated with two phenotypes: CH4 in parts per million/day (CH4 ppm/d) and CH4 in grams/day (CH4 g/d). We studied 483 Polish Holstein-Friesian cows kept on two commercial farms in Poland. Measurements of CH4 and carbon dioxide (CO2) concentrations exhaled by cows during milking were obtained using gas analyzers installed in the automated milking system on the farms. Genomic analyses were performed using a single-step BLUP approach. The percentage of genetic variance explained by SNPs was calculated for each SNP separately and then for the windows of neighbouring SNPs. The heritability of CH4 ppm/d ranged from 0 to 0.14, with an average of 0.085. The heritability of CH4 g/d ranged from 0.13 to 0.26, with an average of 0.22. The GWAS detected potential candidate SNPs on BTA 14 which explained ~0.9% of genetic variance for CH4 ppm/d and ~1% of genetic variance for CH4 g/d. All identified SNPs were located in the TRPS1 gene. We showed that methane traits are partially controlled by genes; however, the detected SNPs explained only a small part of genetic variation—implying that both CH4 ppm/d and CH4 g/d are highly polygenic traits.

1. Introduction

Methane (CH4) is one of the main contributors to climate change. Its global warming potential over 100 years is 28 times higher than that of carbon dioxide (CO2) [1]. Among various sources of emissions, the livestock industry plays an important role [2]. Although CH4 does not accumulate over time, by reducing its emission the livestock industry can slow down the climate change process [3].
Among enteric methane mitigation strategies, which include nutritional and management strategies, selective breeding to reduce the amount of methane produced per kg of milk is of interest. Genetic reduction of CH4 emission requires measurements of emission from many animals. Emission of CH4 can be measured in several ways. One group of measuring methods is breath analyzing techniques. These are well-documented methods based on the principle that about 90% of enteric CH4 is released during eructation events and by breathing [4]. These methods are cost-effective and non-invasive. Some of them are based on infrared spectroscopy and have been used successfully by several research groups [5,6,7], showing the possibility of acquiring large amounts of data suitable for genetic analysis.
Once the methane measurements are collected, one may define various methane phenotypes, which include: methane production, methane intensity, methane yield, or residual methane production [8]. Commonly, the amount of methane produced by an animal [9,10] is expressed in grams or liters of CH4 per day, which is calculated in accordance to Madsen et al. (2010) [11]. The aforementioned phenotype is based on the CH4/CO2 ratio (ppm) multiplied by CO2 L/day estimated from the heat production unit [11,12]. An alternative solution is to use raw CH4 concentrations, which are obtained without taking into account other traits. Thus far there have been few studies based on direct CH4 emission [13,14], and only the study of van Engelen et al. (2018) [15] provides heritability estimates—but without a focus on more detailed genetic architecture.
The genetic architecture of CH4 remains largely unknown. Several studies have attempted to approach this issue, and results indicate that genes control approximately 20–30% of methane emission variability [9,10,16]. Differences between the estimates may arise from the complexity of the emission process and differences between populations and periods of measurement. In addition, the emission process is affected by several factors, e.g., biological processes in the rumen, type of diet, amount of feed intake, and size of the animal [17].
In this paper, we aim to estimate heritability for two methane phenotypes: CH4 ppm/day (CH4 ppm/d) and CH4 grams/day (CH4 g/d), and to perform genome-wide association studies (GWAS) for the identification of candidate genes associated with CH4 ppm/d and CH4 g/d in the air exhaled by dairy cows.

2. Materials and Methods

We studied 483 Polish Holstein-Friesian cows kept on two commercial farms in Poland. Detailed information on farms, measuring set-up, and data processing of records used in this study can be obtained from Pszczola et al. (2017) [7]. The CH4 and CO2 concentrations were measured on Farm 1 during two periods: from 02 December 2014 to 03 February 2016, and 01 June 2016 to 17 September 2016 from the 15th to 305th day in milk (DIM). Measurements on Farm 2 were taken over the period of 05 February 2016 to 14 March 2016, from the 5th to 305th DIM. Measurements of CH4 and CO2 concentrations were taken during milking using an FTIR gas analyzer (GASMET 4030; Gasmet Technologies Oy, Helsinki, Finland) that was installed in the feeding bin of the Automated Milking System (AMS, Astronaut, Lely Industries, NV, Maassluis, The Netherlands). Cows were milked repeatedly during the experiment.
Measurements of CH4 and CO2 concentrations were corrected for diurnal variation with a Fourier series approach [18,19] using the model described by Pszczola et al. (2017) [7], and averaged per cow per day. Therefore, the analyzed phenotypes were daily average CH4 concentrations (CH4 ppm/d), with a total of 34,359 CH4 measurements. The detailed number of observations and average CH4 emission per farm, along with production parameters, are presented in Table 1. The cows had ad-libitum group access to partial mixed rations, and additional concentrates were given to cows during milking. Further details on the feeding regime can be obtained from Pszczola et al. (2017) [7].
CH4 production was calculated based on Madsen et al. (2010) [11] by multiplying the CH4 to CO2 concentration ratio by the expected CO2 production (liters/day) estimated from heat production [11,12]. This estimation of CO2 production used the milk production, live weight, and day of pregnancy obtained from the AMS system. This resulted in an estimated CH4 production expressed in liters per day, and was converted to grams per day using a CH4 density of 0.668 g/L, which assumes normal temperature (20 °C) and pressure (101.325 kPa). For more details, see Pszczola et al. (2017) [7].
Overall, 330 of the 483 cows were genotyped with the Illumina BovineSNP50 v2.0 BeadChip (Illumina Inc., San Diego, CA, USA). The SNP data were processed with the following quality control checks: (1) being in Hard–Weinberg equilibrium, (2) not being monomorphic, and (3) having an SNP call rate of above 0.95. We also removed SNPs located on the sex chromosomes and unassigned SNPs. Six cows were removed as they had a call rate below 0.9. After quality control, 39,269 SNPs remained for the genome-wide association analysis.
The statistical model used for estimation of (co)variance components included random and fixed effects, which were selected based on the Akaike information criteria obtained from the lme4 package in R software [20,21]. Variance components were estimated using the REML approach in airemlf90 software [22].
The final model was the following:
CH 4 i j k l = LAC j + n = 1 4 β n DIM k n + FYW l + n = 1 3 a n i m a l i n DIM k n + n = 1 3 p e i n DIM k n + e i j k l
in which CH 4 i j k l is the raw average daily CH4 concentration in ppm of the ith cow in the jth lactation, on the kth day in milk (DIM) over a range of 5th to 305th day, and the lth farm-year–week of the measurement; βn are fixed regression coefficients. Lactation (LAC) had two levels: 1 and 2+, for which records up to lactation 8 were included. The general lactation curve was modeled using third-order Legendre polynomials and random animal (animal), and permanent environment (pe) effects were modeled with second-order Legendre polynomials [23].
The covariance structure for model (1) was:
v a r [ a n i m a l p e e ] = [ G H 0 0   0 P I 0   0 0 I σ e 2 ] ,
where G and P are covariance matrices of the random regression coefficients for animal and permanent environment effects, ⊗ is the Kronecker product, H is the combined pedigree and genomic relationship matrix, I is an identity matrix and σ e 2 is the residual variance. The G matrix was defined as:
G = Z Z 2 j p j ( 1 p j ) ,
where Z contains genotypes adjusted with allele frequency and pj is the allele frequency for marker j [24]. The H matrix was created as in [25,26]:
H = ( A 11 A 12 A 22 1 + A 12 A 22 1 G A 22 1 A 21 A 12 A 22 1 G G A 22 1 A 21 G ) ,
where subscripts 1 and 2 represent ungenotyped and genotyped animals, respectively, A is a pedigree matrix and G is a genomic relationship matrix. All three matrices were computed using the BLUPF90 suite of programs [22]. To investigate the existence of a possible population structure, we performed principal component analysis on the calculated G matrix.
Some of the animals with phenotypes were not genotyped. Therefore, to utilize all the available information for estimating SNP effects, we used a single-step genomic BLUP (ssGBLUP) method that integrates phenotypes, genotypes, and pedigree information [25,26]. Genome-wide association studies were conducted with the BLUPF90 suite of programs [27]. The implemented algorithm uses the ssGBLUP procedure, which fits all the SNPs simultaneously and then obtains estimates of marker effects and their associated p-values from the estimated breeding values [28,29]. The main advantage of using ssBLUP for GWAS is the potential for using ungenotyped animals and the lack of need for using de-regressed phenotypes. The threshold for identifying significant SNPs was p ≤ 0.05; therefore, after Bonferroni correction to account for multiple testing (i.e., 0.05/39,269), we obtained a threshold of 5.9 on the -log10 scale.
Next, we calculated the proportion of genetic variance explained by significant SNPs. In addition, we calculated the proportion of genetic variance explained by the moving windows of adjacent SNPs. We used two approaches to define the windows: in the first, window size was arbitrarily fixed to 50 SNPs, and in the second, window size was set according to the average length of the haplotype block. A haplotype block was required to have at least 95% of combinations of SNPs within a region in very high linkage disequilibrium [30]. As the average block length in the bovine genome is 69.7 +/− 7.7 kb, the window size was set to 70 kb. As a result, the number of SNPs grouped per window varied from 1 to 5 SNPs across the chromosomes. In the final step, potential candidate SNPs were checked in the Cow QTL database [31] for linkage to previously detected quantitative trait loci (QTLs) for CH4 production or other traits.

3. Results

3.1. CH4 Measurements

Variances of average daily CH4 ppm/d were 36,401 (CH4 ppm/d)2 for Farm 1 and 27,820 (CH4 ppm/d)2 for Farm 2 and differed significantly (Bartlett test p-value < 0.001). Variances of average daily CH4 g/d were 7789 (CH4 g/d)2 for Farm 1 and 10,962 (CH4 g/d)2 for Farm 2 and differed significantly (Bartlett test p-value < 0.001). Animals on Farm 1 and Farm 2 produced similar amounts of CH4 ppm/d (Table 1). Although Farm 2 had higher CH4 concentrations by about 12 ppm than Farm 1, differences between average CH4 ppm/d per farm were not statistically significant (Welch two-sample t-test). In the case of CH4 g/d (Table 1), Farm 2 had higher CH4 concentrations by 107 g and was significantly different from Farm 1 (p-value < 0.001, Welch two-sample t-test).

3.2. Variance Components

Genetic, permanent environment, and residual variances for CH4 ppm/d throughout lactation—estimated using model (1), identical to Pszczola et al. (2017) [7]—are presented in Figure 1. The genetic variance was, on average, 2928 (ppm/d)2 and systematically rose during lactation—reaching a maximum of 5967 (ppm/d)2 at the end of lactation. Permanent environment variance fluctuated during lactation, with an average of 9832 (ppm/d)2, a maximum of 20,466 (ppm/d)2 on the 5th DIM, a minimum of 7952 (ppm/d)2 on the 85th DIM, and 14,156 (ppm/d)2 on the 305th DIM. The residual variance was estimated at 21,568 (ppm/d)2.
Genetic, permanent environment effect, and residual variances for CH4 g/d throughout lactation, estimated using model (1), are presented in Figure 2. The genetic variance fluctuated during lactation, with an average of 1199 (g/d)2, a maximum of 1486 (g/d)2 on the 5th DIM, and a minimum of 853 (g/d)2 on the 292nd DIM. Permanent environment variance also fluctuated with a mean of 1709 (g/d)2, a maximum of 3397 on the 305th DIM, and a minimum of 1016 on the 102nd DIM. The residual variance was estimated at 2620 (g/d)2.

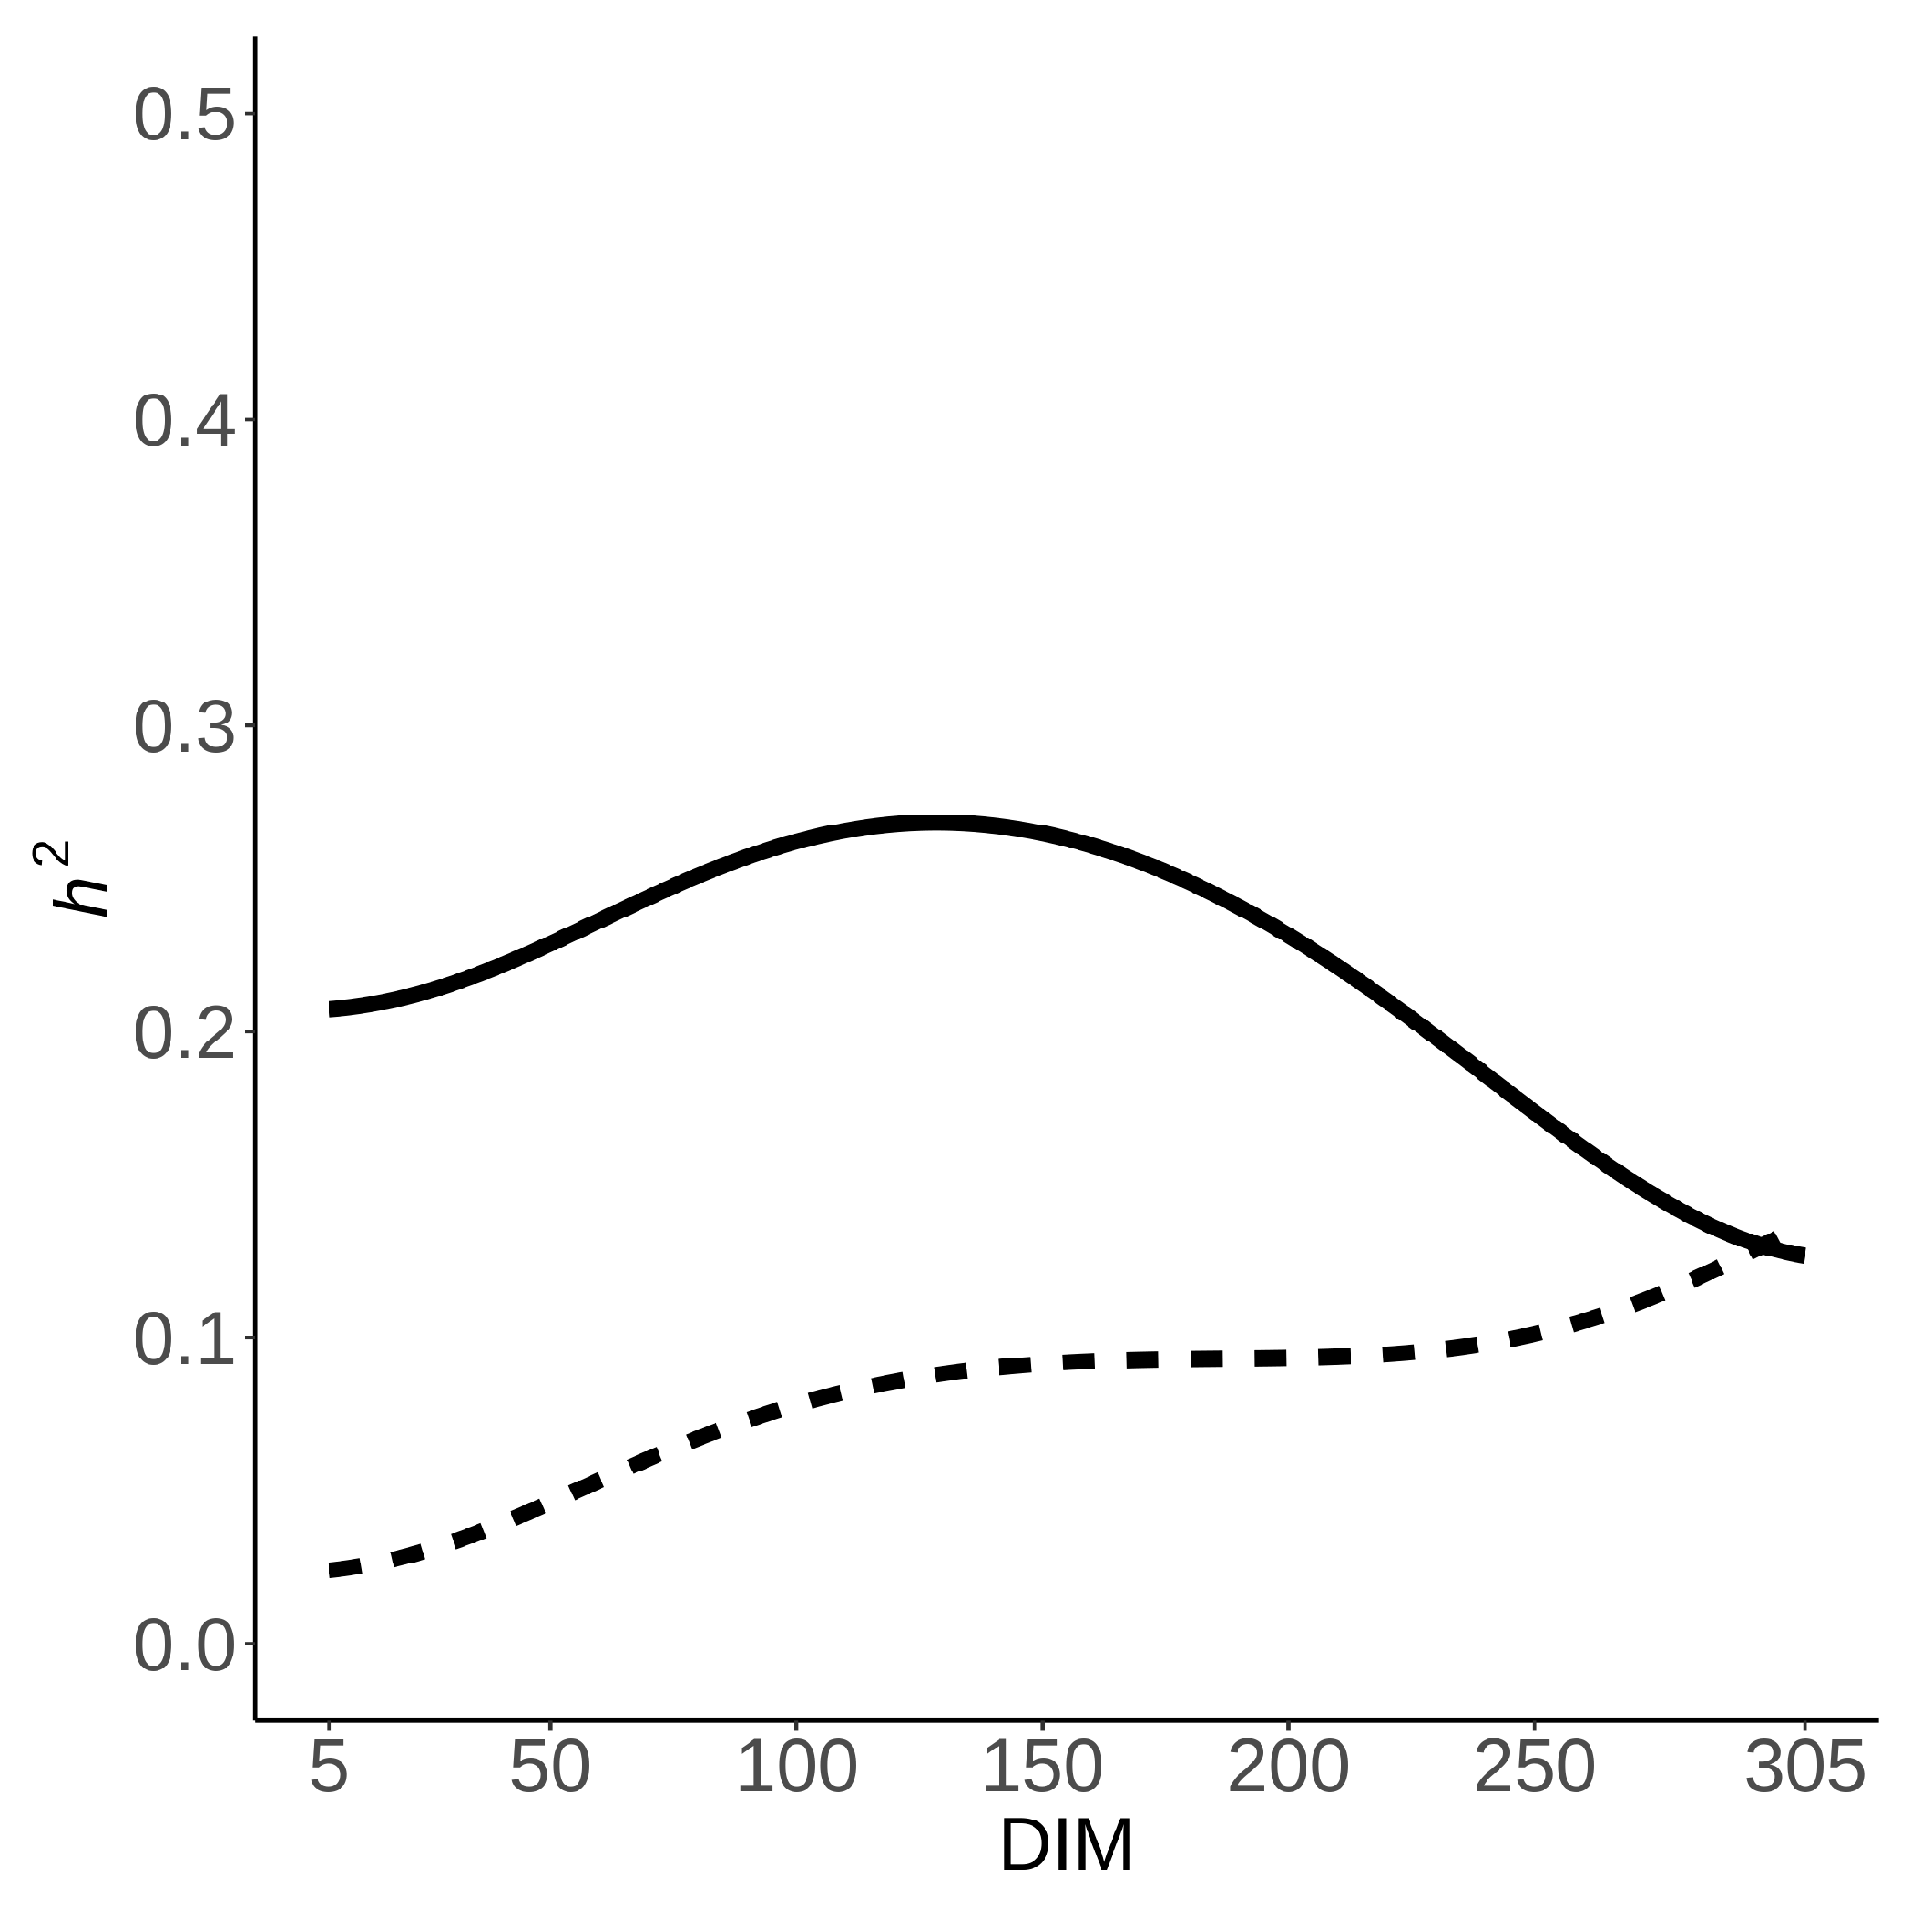
3.3. Heritability Estimates

The heritability of CH4 ppm/d systematically rose during lactation (Figure 3) starting at 0 on the 5th DIM and reaching a maximum of 0.14 at the end. The average heritability was 0.085. The heritability of CH4 g/d (Figure 3) fluctuated with a mean of 0.22, a maximum of 0.26 on the 128th DIM, and a minimum of 0.13 on the 305th DIM.

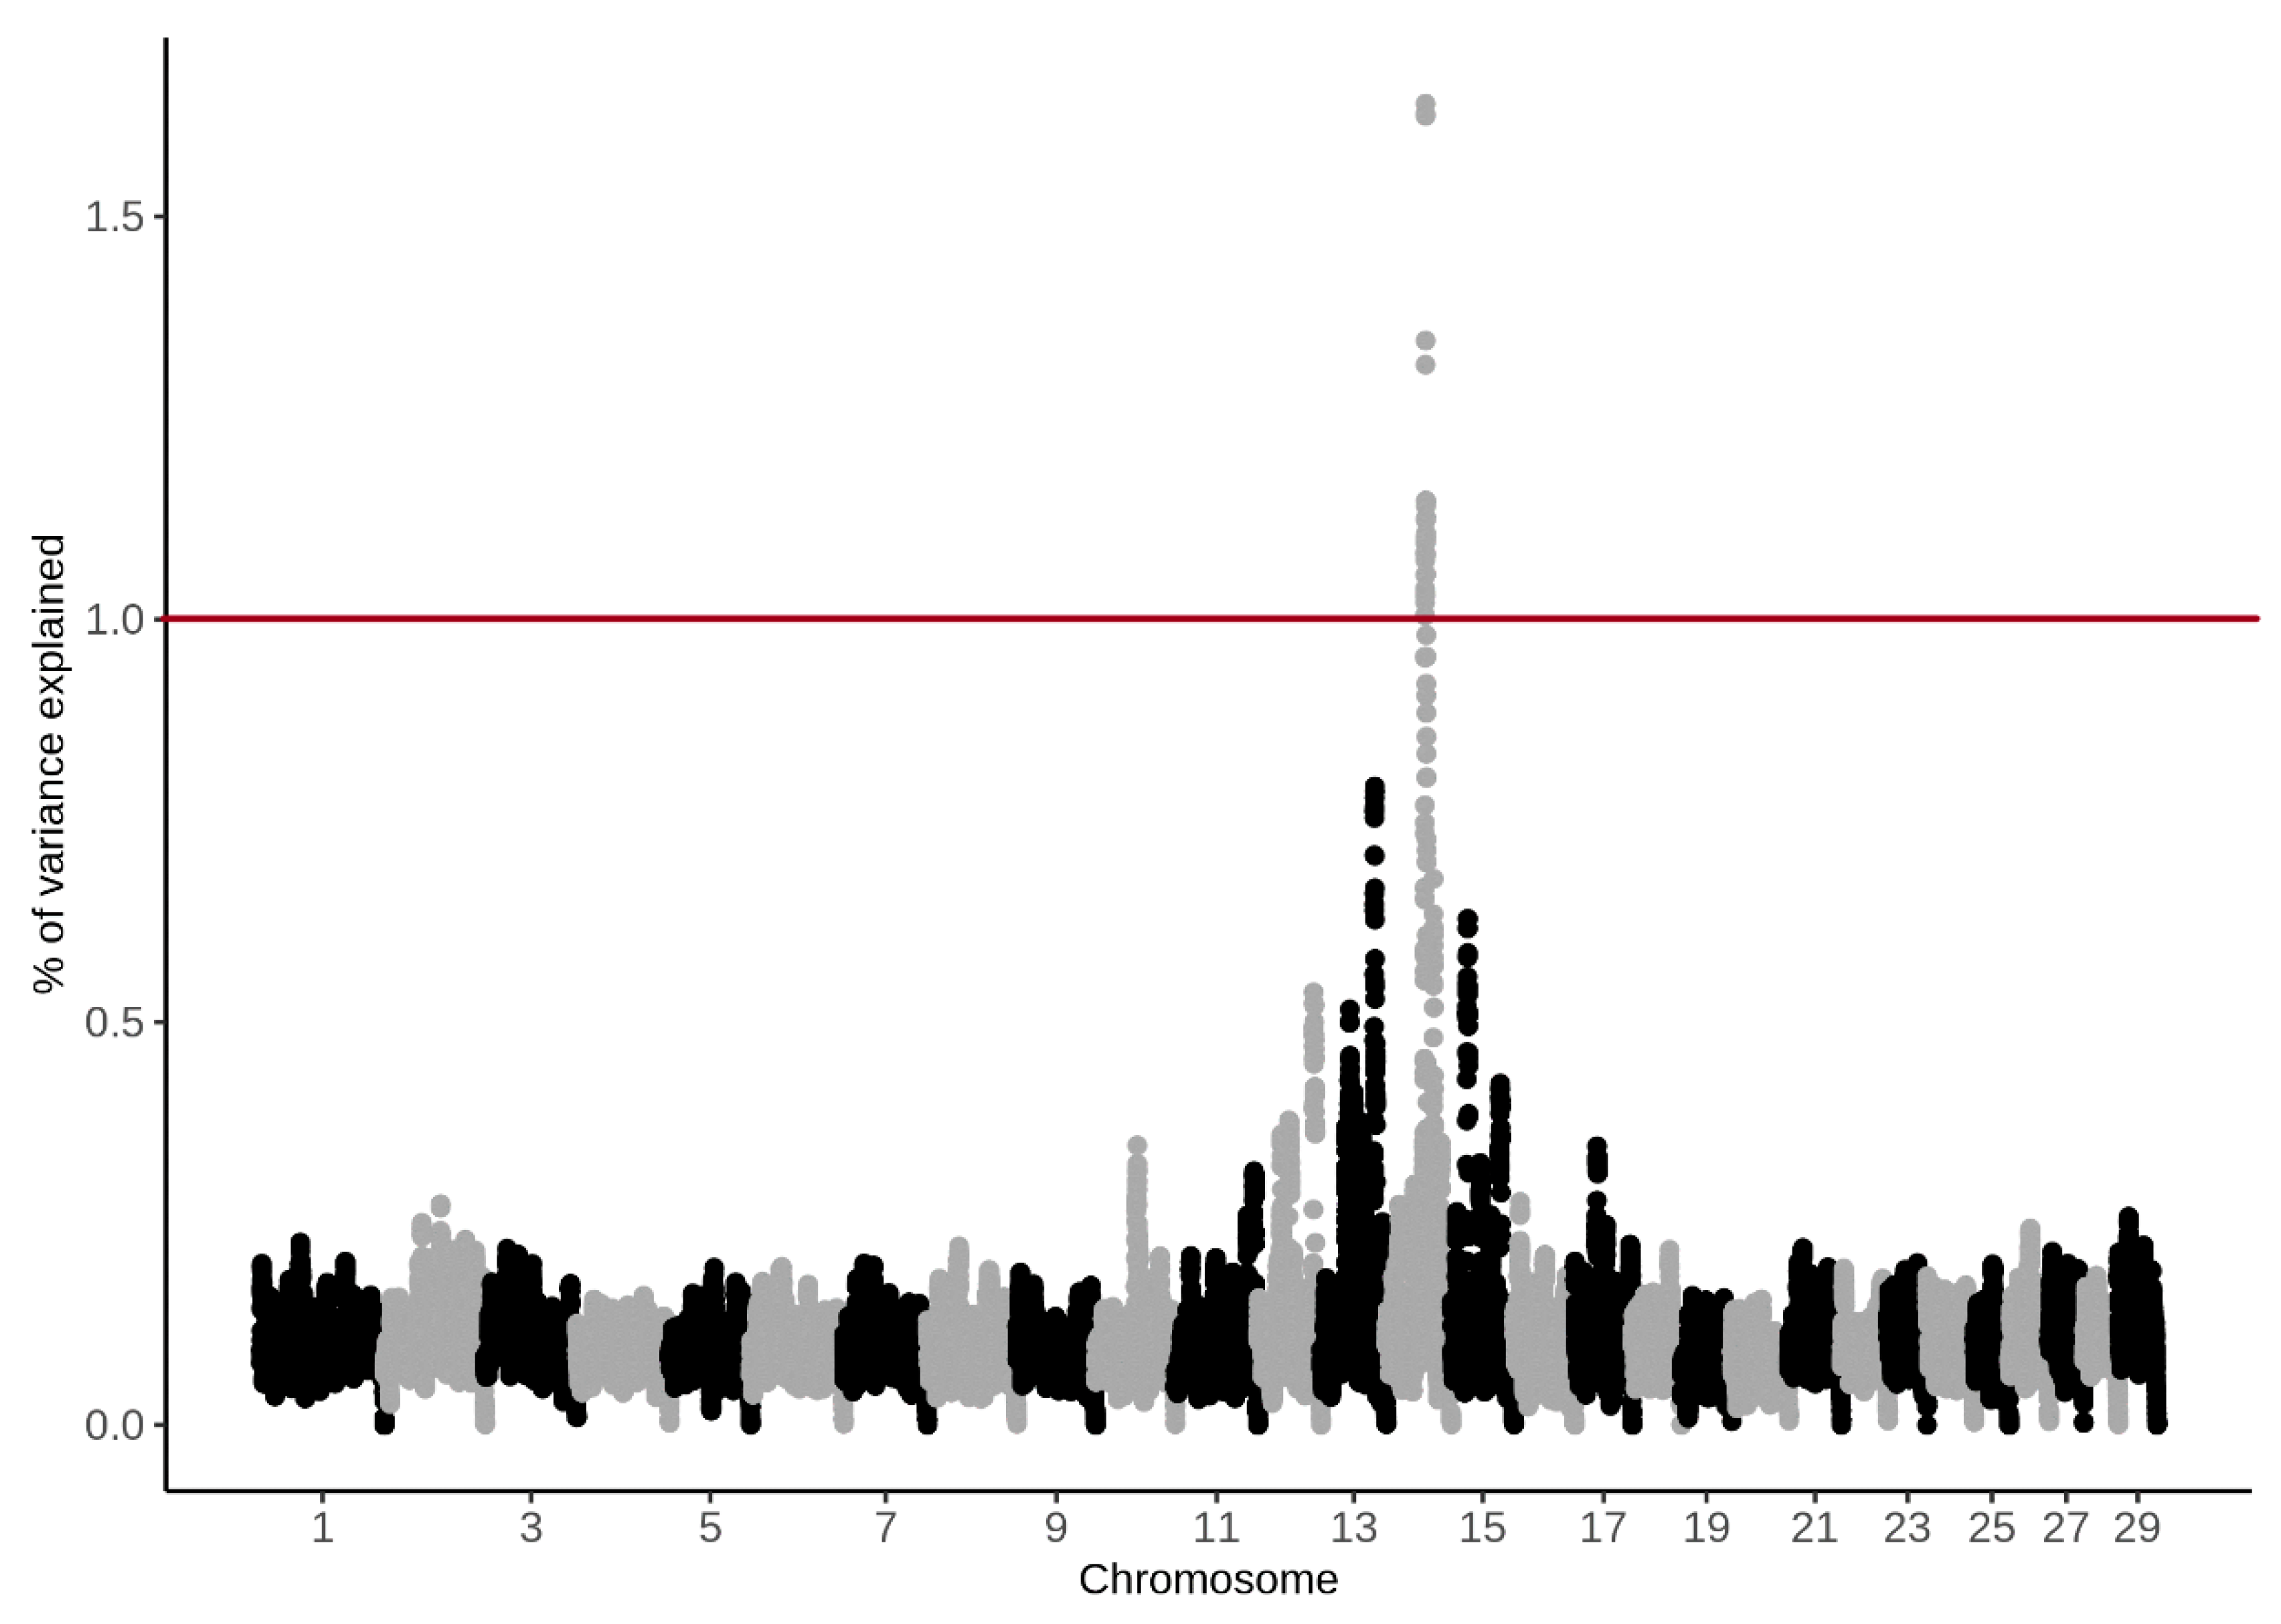
3.4. Genome-Wide Association Study

The principal component analyses showed two clusters (Figure 4), indicating the presence of a family structure. Animals from both farms were present in the two clusters. The obtained PC scores were small and explained 3.4% (PC1) and 2.5% of variance, respectively. p-values were obtained to identify candidate SNPs associated with CH4 ppm/d and with CH4 g/d, and we found that none of the tested SNPs was significantly associated with the phenotypes. To identify candidate regions, we evaluated SNPs in 70 kbp and 50 SNP windows for CH4 ppm/d and CH4 g/d. The analysis using 70 kbp windows did not detect any promising SNPs. However, the 50-SNP window approach detected potential candidate SNPs on BTA 14 which explained more than 0.09% of variance for CH4 ppm/d (Figure 5) and more than 1% of genetic variance for CH4 g/d (Figure 6). The discussed SNPs (Table 2) are located in the TRPS1 gene, which has been previously associated with milk fat yield, as evidenced by QTL:181825 [31].

4. Discussion

4.1. CH4 Measurements

The CH4 measurements varied across farms 1 and 2 for both CH4 ppm/d and CH4 g/d. According to Huhtanen et al. (2015) [32], potential sources of higher differences between farms may be sampling locations with different airflow patterns and cow variation in exhalation rate. Animals at Farm 2 were heavier (about 125 kg) and produced about 3 kg milk more per day (for more details see Table 1). This may indicate differences in feed intake or feed efficiency, although an investigation of this would require feed intake data, which were unavailable as the measurements were taken on commercial farms.

4.2. Variance Components

Estimates of genetic variance for CH4 g/d were lower when compared to the study of Pszczola et al. (2017) [7], who used the same method and data, but no genotypes. Therefore, the use of genotypes lowered the estimates. Fluctuations of permanent environment variance in both traits and high levels of residual variance are probably as a result of unaccounted disturbances such as changes in the exhalation rate of the cows, head movement, or changes in the airflow around the feeding bin that could have been present during the measuring period [32,33].

4.3. Heritability Estimates

Pszczola et al. (2017) [7] reported an average heritability of 0.27 for CH4 g/d for pedigree-based analyses of 483 Polish Holstein-Friesian cows. In this current study, the addition of genotype data for 330 of the 483 animals resulted in a decrease in the heritability estimates, suggesting that the genetic influence on CH4 g/d may be lower than previously estimated. Lassen and Lovendahl [34] reported a heritability of 0.21 for Holstein-Friesian cattle, and heritability estimates for CH4 g/kg of dry matter intake (DMI) predicted from milk fat composition ranged between 0.12 and 0.44 [16]. A possible explanation for these differing results is the higher number of observations (e.g., Lassen and Lovendahl (2016) [13] used records collected from 3121 animals in their study). Direct comparison of CH4 heritability estimates from a range of studies requires traits that are comparable with one another. The CH4 g/kg of DMI in the study of van Engelen et al., 2015 [16] is predicted from milk fat composition; therefore, its heritability estimates depend on production parameters. Genomic studies based on CH4 g/kg of DMI could result in studying production parameters and not CH4 emission itself. An alternative could be studies based on direct CH4 measurements. The CH4 production expressed in CH4 g/d is calculated using a ratio of direct measurements of CH4 and CO2 multiplied by the predicted heat production, which is calculated using production parameters (i.e., fat–protein corrected milk), resulting in higher CH4 emission heritability estimates. Therefore, while the CH4 g/d is based on direct CH4 measurements, it is still to some extent associated with cow production traits. Lassen and Lovendahl (2016) [34] indicated a positive additive genetic correlation of 0.43 ± 0.10 between CH4 g/d and fat–protein corrected milk, which may have an impact on the results of the genetic studies on CH4 g/d. Van Engelen et al. (2017) [15] used log10-transformed CH4 ppm/d and obtained a heritability of 0.11. This was a similar phenotype to that of CH4 ppm/d presented in this current study, since it also is based only on direct CH4 measurements, without any additional traits involved in the calculations. Heritability estimates of both CH4 ppm/d and log10-transformed CH4 ppm/d are relatively low when compared to other CH4 phenotypes. While genetic studies based on CH4 ppm can remain unaffected by other traits, estimates of CH4 ppm/d or log10-transformed CH4 ppm/d are affected by environmental factors and animal behavior during the measuring time. The exhalation rate of the cow, head movement, or changes in the airflow around the feeding bin may affect CH4 ppm/d estimation and, as a result, may affect the estimation of CH4 ppm/d heritability [32,33]. It is, therefore, still unclear which phenotype is more reliable, and more studies are required in this field.

4.4. Genome-Wide Association Study

The principal component analysis showed some stratification in the population; however, the magnitude of PC values was small, and both farms were represented in the two clusters (Figure 4). As shown by Mancin et al. [35], who analyzed the impact of different population structures on GWAS results, the level of stratification present in our data should have no influence on our analyses.
QTLs linked to the development of the digestive tract were identified by Pszczola et al. (2018) [9] using similar data, but with CH4 g/d phenotype and a Bayesian variable selection method [36]. In this study, we used single-step GWAS for post-analyses of ssBLUP, since it allows the inclusion of non-genotyped animals and thus provides more insight into the genetic architecture of the studied trait. The use of different methods on the same dataset also allows for the validation of previous results, as well as providing a reference point for the analysis of the new CH4 phenotype (i.e., CH4 ppm/d). In our current approach, none of the SNPs reported by Pszczola et al. (2018) [9] reappeared, which could indicate that Bayesian variable selection is more sensitive than the single-step GWAS approach.
Several studies [37,38,39] used the GBLUP method for estimation of marker effects for GWAS and Aguilar et al. (2019) [28] indicated an empirical agreement between association studies on beef cattle in the literature and their findings based on single-step GWAS. Legarra et al. (2018) [40] also showed similarities between the results of the Bayesian approach and the GBLUP approach for GWAS studies. Pszczola et al. (2018) [9] used the Bayesian approach for the GWAS analyses of CH4 g/d, for which only genotyped animals could be used. In this current study, we decided to use ssGWAS, as it allowed us to include all the 483 phenotyped animals, of which only 330 were genotyped. A larger number of both genotyped and ungenotyped animals can improve the power of a GWAS analysis; however, in our case, it did not yield a higher number of significant SNPs as compared with Pszczola et al. (2018) [9].
In this study, we detected potentially novel SNPs for both CH4 ppm/d and CH4 g/d. The identification of the same SNPs in both traits—which express CH4 emission differently—may indicate a true association with CH4 emission. However, the found QTLs, similar to previous studies, explained only a small percent of the genetic variation— suggesting either the need for analysis on a larger dataset or a lack of SNPs with a large effect on the analyzed traits. Another possible reason for finding a small number of SNPs with significant effects on the investigated trait is the size of the SNP chip used. In this study we used the Illumina BovineSNP50 v2.0 BeadChip; possibly, a higher density chip would help to pin-point more significant SNPs.

5. Conclusions

This research aimed to study the genetic architecture of the CH4 ppm/day and CH4 g/day phenotypes. The obtained heritabilities of both traits indicated that CH4 emission is partially controlled by genes. While GWAS studies reported potentially novel SNPs associated with both CH4 phenotypes, all SNPs were associated with only one gene and explained only a small percent of the genetic variation. We conclude that both CH4 ppm/d and CH4 g/d are highly polygenic traits; thus, the identification of a specific gene or region will be challenging and will require large datasets.

Author Contributions

Conceptualization, M.P., T.S. and M.S.; methodology, M.P., M.S. and T.S.; software, M.S.; validation, M.P. and T.S.; formal analysis, M.S.; investigation, M.S.; resources, M.P. and T.S.; data curation, M.P. and M.S.; writing—original draft preparation, M.S.; writing—review and editing, M.S., M.P. and T.S.; visualization, M.S.; supervision, M.P. and T.S.; project administration, T.S. and M.S.; funding acquisition, T.S. and M.S. All authors have read and agreed to the published version of the manuscript.

Funding

This study is partly based on the knowledge gained in the networks of COST Action FA1302 “Large-scale methane measurements on individual ruminants for genetic evaluations” (COST Association). This study was partly financed by research grant NCN OPUS 2013/09/B/NZ9/03179 (Nationa Science Centre, Poland) and grant no. 506.534.04.00 of the Young Researcher Program of the Faculty of Veterinary Medicine and Animal Science, Poznan University of Life Sciences, financed by the Polish Ministry of Science and Higher Education.

Institutional Review Board Statement

Not applicable. Ethical review and approval were waived for this study by the decision of the Head of the Local Ethical Commission for Investigations on Animals in Poznan, Poland.

Data Availability Statement

Data available on the reasonable request to the corresponding author.

Acknowledgments

Esinam Nancy Amuzu-Aweh is thanked for their valuable comments on the manuscript.

Conflicts of Interest

The authors declare no conflict of interest.

References

  1. Myhre, G.D.; Shindell, F.-M.; Bréon, W.; Collins, J.; Fuglestvedt, J.; Huang, D.; Koch, J.-F.; Lamarque, D.; Lee, B.M.; Nakajima, T.A.; et al. Anthropogenic and Natural Radiative Forcing. In Climate Change 2013: The Physical Science Basis. Contribution of Working Group I to the Fifth Assessment Report of the Intergovernmental Panel on Climate Change; Cambridge University Press: Cambridge, UK, 2013; pp. 659–740. [Google Scholar]
  2. Steinfeld, H.; Gerber, P.; Wassenaar, T.; Castel, V.; Rosales, M.; de Haan, C. Livestock’s long shadow: Environmental issues and options. Renew. Resour. J. 2006. [Google Scholar] [CrossRef]
  3. Allen, M.R.; Shine, K.P.; Fuglestvedt, J.S.; Millar, R.J.; Cain, M.; Frame, D.J.; Macey, A.H. A solution to the misrepresentations of CO2-equivalent emissions of short-lived climate pollutants under ambitious mitigation. npj Clim. Atmos. Sci. 2018, 1, 1–8. [Google Scholar] [CrossRef]
  4. Murray, R.M.; Bryant, A.M.; Leng, R.A. Rates of production of methane in the rumen and large intestine of sheep. Br. J. Nutr. 1976, 36, 1–14. [Google Scholar] [CrossRef] [PubMed] [Green Version]
  5. Garnsworthy, P.C.; Craigon, J.; Hernandez-Medrano, J.H.; Saunders, N. On-farm methane measurements during milking correlate with total methane production by individual dairy cows. J. Dairy Sci. 2012, 95, 3166–3180. [Google Scholar] [CrossRef] [Green Version]
  6. Szalanski, M.; Kristensen, T.; Difford, G.; Lassen, J.; Buitenhuis, A.J.; Pszczola, M.; Løvendahl, P. Enteric methane emission from Jersey cows during the spring transition from indoor feeding to grazing. J. Dairy Sci. 2019, 102, 6319–6329. [Google Scholar] [CrossRef] [Green Version]
  7. Pszczola, M.; Rzewuska, K.; Mucha, S.; Strabel, T. Heritability of methane emissions from dairy cows over a lactation measured on commercial farms. J. Anim. Sci. 2017, 95, 4813–4819. [Google Scholar] [CrossRef] [Green Version]
  8. de Haas, Y.; Pszczola, M.; Soyeurt, H.; Wall, E.; Lassen, J. Invited review: Phenotypes to genetically reduce greenhouse gas emissions in dairying. J. Dairy Sci. 2017, 100, 855–870. [Google Scholar] [CrossRef] [Green Version]
  9. Pszczola, M.; Strabel, T.; Mucha, S.; Sell-Kubiak, E. Genome-wide association identifies methane production level relation to genetic control of digestive tract development in dairy cows. Sci. Rep. 2018, 8, 15164. [Google Scholar] [CrossRef] [Green Version]
  10. Difford, G.F.; Plichta, D.R.; Løvendahl, P.; Lassen, J.; Noel, S.J.; Højberg, O.; Wright, A.D.G.; Zhu, Z.; Kristensen, L.; Nielsen, H.B.; et al. Host genetics and the rumen microbiome jointly associate with methane emissions in dairy cows. PLoS Genet. 2018, 14, e1007580. [Google Scholar] [CrossRef] [Green Version]
  11. Madsen, J.; Bjerg, B.S.; Hvelplund, T.; Weisbjerg, M.R.; Lund, P. Methane and carbon dioxide ratio in excreted air for quantification of the methane production from ruminants. Livest. Sci. 2010, 129, 223–227. [Google Scholar] [CrossRef]
  12. Chwalibog, A. Husdyrernæring: Bestemmelse af næringsværdi og næringsbehov; Faculty of Life Sciences, University of Copenhagen, DSR forlag.: Copenhagen, Denmark, 1991. [Google Scholar]
  13. Sorg, D.; Difford, G.F.; Mühlbach, S.; Kuhla, B.; Swalve, H.H.; Lassen, J.; Strabel, T.; Pszczola, M. Comparison of a laser methane detector with the GreenFeed and two breath analysers for on-farm measurements of methane emissions from dairy cows. Comput. Electron. Agric. 2018, 153, 285–294. [Google Scholar] [CrossRef]
  14. Difford, G.F.; Olijhoek, D.W.; Hellwing, A.L.F.; Lund, P.; Bjerring, M.A.; de Haas, Y.; Lassen, J.; Løvendahl, P. Ranking cows’ methane emissions under commercial conditions with sniffers versus respiration chambers. Acta Agric. Scand. Anim. Sci. 2018, 68, 25–32. [Google Scholar] [CrossRef] [Green Version]
  15. van Engelen, S.; Bovenhuis, H.; van der Tol, P.P.J.; Visker, M.H.P.W. Genetic background of methane emission by Dutch Holstein Friesian cows measured with infrared sensors in automatic milking systems. J. Dairy Sci. 2018, 101, 2226–2234. [Google Scholar] [CrossRef] [PubMed] [Green Version]
  16. van Engelen, S.; Bovenhuis, H.; Dijkstra, J.; van Arendonk, J.A.M.; Visker, M.H.P.W. Short communication: Genetic study of methane production predicted from milk fat composition in dairy cows. J. Dairy Sci. 2015, 98, 8223–8226. [Google Scholar] [CrossRef]
  17. Manzanilla-Pech, C.I.V.; De Haas, Y.; Hayes, B.J.; Veerkamp, R.F.; Khansefid, M.; Donoghue, K.A.; Arthur, P.F.; Pryce, J.E. Genomewide association study of methane emissions in angus beef cattle with validation in dairy cattle. J. Anim. Sci. 2016, 94, 4151–4166. [Google Scholar] [CrossRef] [Green Version]
  18. Løvendahl, P.; Bjerring, M.A. Detection of carryover in automated milk sampling equipment. J. Dairy Sci. 2006, 89, 3645–3652. [Google Scholar] [CrossRef]
  19. Lassen, J.; Løvendahl, P.; Madsen, J. Accuracy of noninvasive breath methane measurements using Fourier transform infrared methods on individual cows. J. Dairy Sci. 2012, 95, 890–898. [Google Scholar] [CrossRef] [Green Version]
  20. Bates, D.; Mächler, M.; Bolker, B.M.; Walker, S.C. Fitting linear mixed-effects models using lme4. J. Stat. Softw. 2015, 67, 1–48. [Google Scholar] [CrossRef]
  21. R Core Team. R: A language and Environment for Statistical Computing; R Foundation for Statistical Computing: Vienna, Austria, 2018; Available online: https://www.R-project.org/ (accessed on 1 October 2021).
  22. Aguilar, I.; Tsuruta, S.; Masuda, Y.; Lourenco, D.A.L.; Legarra, A.; Misztal, I. BLUPF90 suite of programs for animal breeding with focus on genomics. In Proceedings of the 11th World Congress on Genetics Applied to Livestock Production, Auckland, New Zeeland, 11–16 February 2018; pp. 11–16. [Google Scholar]
  23. Kirkpatrick, M.; Lofsvold, D.; Bulmer, M. Analysis of the inheritance, selection and evolution of growth trajectories. Genetics 1990, 124, 979–993. [Google Scholar] [CrossRef]
  24. VanRaden, P.M. Efficient methods to compute genomic predictions. J. Dairy Sci. 2008, 91. [Google Scholar] [CrossRef] [PubMed] [Green Version]
  25. Aguilar, I.; Misztal, I.; Johnson, D.L.; Legarra, A.; Tsuruta, S.; Lawlor, T.J. Hot topic: A unified approach to utilize phenotypic, full pedigree, and genomic information for genetic evaluation of Holstein final score. J. Dairy Sci. 2010, 93. [Google Scholar] [CrossRef]
  26. Legarra, A.; Christensen, O.F.; Aguilar, I.; Misztal, I. Single Step, a general approach for genomic selection. Livest. Sci. 2014, 166. [Google Scholar] [CrossRef]
  27. Misztal, I.; Tsuruta, S.; Strabel, T.; Auvray, B.; Druet, T.; Lee, D.H. BLUPF90 and related programs (BGF90). In Proceedings of the 7th World Congress on Genetics Applied to Livestock Production, Montpellier, France, 19–23 August 2002; 2002; p. 33. [Google Scholar]
  28. Aguilar, I.; Legarra, A.; Cardoso, F.; Masuda, Y.; Lourenco, D.; Misztal, I. Frequentist p-values for large-scale-single step genome-wide association, with an application to birth weight in American Angus cattle. Genet. Sel. Evol. 2019, 51, 28. [Google Scholar] [CrossRef] [PubMed] [Green Version]
  29. Gualdrón Duarte, J.L.; Cantet, R.J.C.; Bates, R.O.; Ernst, C.W.; Raney, N.E.; Steibel, J.P. Rapid screening for phenotype-genotype associations by linear transformations of genomic evaluations. BMC Bioinform. 2014, 15, 246. [Google Scholar] [CrossRef] [PubMed] [Green Version]
  30. Khatkar, M.S.; Zenger, K.R.; Hobbs, M.; Hawken, R.J.; Cavanagh, J.A.L.; Barris, W.; McClintock, A.E.; McClintock, S.; Thomson, P.C.; Tier, B.; et al. A primary assembly of a bovine haplotype block map based on a 15,036-single-nucleotide polymorphism panel genotyped in Holstein-Friesian cattle. Genetics 2007, 176. [Google Scholar] [CrossRef] [Green Version]
  31. Hu, Z.L.; Park, C.A.; Reecy, J.M. Building a livestock genetic and genomic information knowledgebase through integrative developments of Animal QTLdb and CorrDB. Nucleic Acids Res. 2019, 47. [Google Scholar] [CrossRef] [Green Version]
  32. Huhtanen, P.; Cabezas-Garcia, E.H.; Utsumi, S.; Zimmerman, S. Comparison of methods to determine methane emissions from dairy cows in farm conditions. J. Dairy Sci. 2015, 98. [Google Scholar] [CrossRef] [Green Version]
  33. Wu, L.; Koerkamp, P.W.G.G.; Ogink, N. Uncertainty assessment of the breath methane concentration method to determine methane production of dairy cows. J. Dairy Sci. 2018, 101. [Google Scholar] [CrossRef] [Green Version]
  34. Lassen, J.; Løvendahl, P. Heritability estimates for enteric methane emissions from Holstein cattle measured using noninvasive methods. J. Dairy Sci. 2016, 99, 1959–1967. [Google Scholar] [CrossRef] [Green Version]
  35. Mancin, E.; Lourenco, D.; Bermann, M.; Mantovani, R.; Misztal, I. Accounting for population structure and phenotypes from relatives in association mapping for farm animals: A simulation study. Front. Genet. 2021, 12. [Google Scholar] [CrossRef] [PubMed]
  36. George, E.I.; McCulloch, R.E. Variable selection via Gibbs sampling. J. Am. Stat. Assoc. 1993, 88. [Google Scholar] [CrossRef]
  37. Dikmen, S.; Cole, J.B.; Null, D.J.; Hansen, P.J. Genome-Wide association mapping for identification of quantitative trait loci for rectal temperature during heat stress in Holstein cattle. PLoS ONE 2013, 8, e69202. [Google Scholar] [CrossRef] [Green Version]
  38. Tiezzil, F.; Parker-Gaddis, K.L.; Cole, J.B.; Clay, J.S.; Maltecca, C. A genome-wide association study for clinical mastitis in first parity US Holstein cows using single-step approach and genomic matrix re-weighting procedure. PLoS ONE 2015, 10, e114919. [Google Scholar] [CrossRef] [Green Version]
  39. Han, Y.; Peñagaricano, F. Unravelling the genomic architecture of bull fertility in Holstein cattle. BMC Genet. 2016, 17, 143. [Google Scholar] [CrossRef] [PubMed] [Green Version]
  40. Legarra, A.; Ricard, A.; Varona, L. GWAS by GBLUP: Single and multimarker EMMAX and bayes factors, with an example in detection of a major gene for horse gait. G3 Genes Genomes Genet. 2018, 8, 2301–2308. [Google Scholar] [CrossRef] [PubMed] [Green Version]
Figure 1. Residual (dotted line), permanent environment (dashed line), and genetic (solid line) variances (ppm/d)2 throughout lactation for CH4 ppm/d.
Animals 11 03175 g001
Figure 2. Residual (dotted line), permanent environment (dashed line), and genetic (solid line) variances (g/d)2 throughout lactation for CH4 g/d.
Animals 11 03175 g002
Figure 3. Heritability estimates for CH4 ppm/d (dashed) and CH4 g/d (solid) throughout lactation.
Animals 11 03175 g003
Figure 4. First (PC1) and second (PC2) principal components of the genomic relationship matrix with different colors for farms (Farm 1 = light, Farm 2 = dark).
Animals 11 03175 g004
Figure 5. Manhattan plot for % of genetic variance explained by 50-SNP windows for CH4 ppm/d, with an arbitrary threshold line of 0.09%.
Animals 11 03175 g005
Figure 6. Manhattan plot for % of genetic variance explained by 50-SNP windows for CH4 g/d, with an arbitrary threshold line of 1%.
Animals 11 03175 g006
Table 1. Average CH4 measurements, live weight, fat–protein corrected milk (FPCM) and number of records per farm.
Farm 1Farm 2
MeanSDMeanSD
CH4 ppm/day505190517166
CH4 g/day39659.7050393.20
Live weight (kg)544115669 73
FPCM (kg)33.706.8236.608.79
No. of records 31,1793180
Table 2. Candidate SNPs detected for both CH4 g/d and CH4 ppm/d, their position in base pairs, and percentage of genetic variance explained by them (%).
BTASNP NamePosition (bp)(%) CH4 g/d(%) CH4 ppm/d
14BTB-00568855488907781.621.19
14Hapmap57707-rs29024913488588641.311.01
14UA-IFASA-9208487266661.050.93
14ARS-BFGL-NGS-45675486793261.090.92
Publisher’s Note: MDPI stays neutral with regard to jurisdictional claims in published maps and institutional affiliations.

