Farming Practices Influence Antibiotic Resistance and Biogenic Amine Capacity of Staphylococci from Bulk Tank Ewe’s Milk

 , , , and
Simple Summary
Abstract
1. Introduction
2. Materials and Methods
2.1. Population and Study Design
2.2. Sampling, Bacterial Isolation, and Genotyping and Identification of the Isolates
2.3. Antibiotic Resitance Assay
2.4. Biogenic Amine Production
2.5. Statistical Analysis
3. Results
3.1. Isolation, Genotyping, and Identification of Isolates
3.2. Antibiotic Resistance Assays
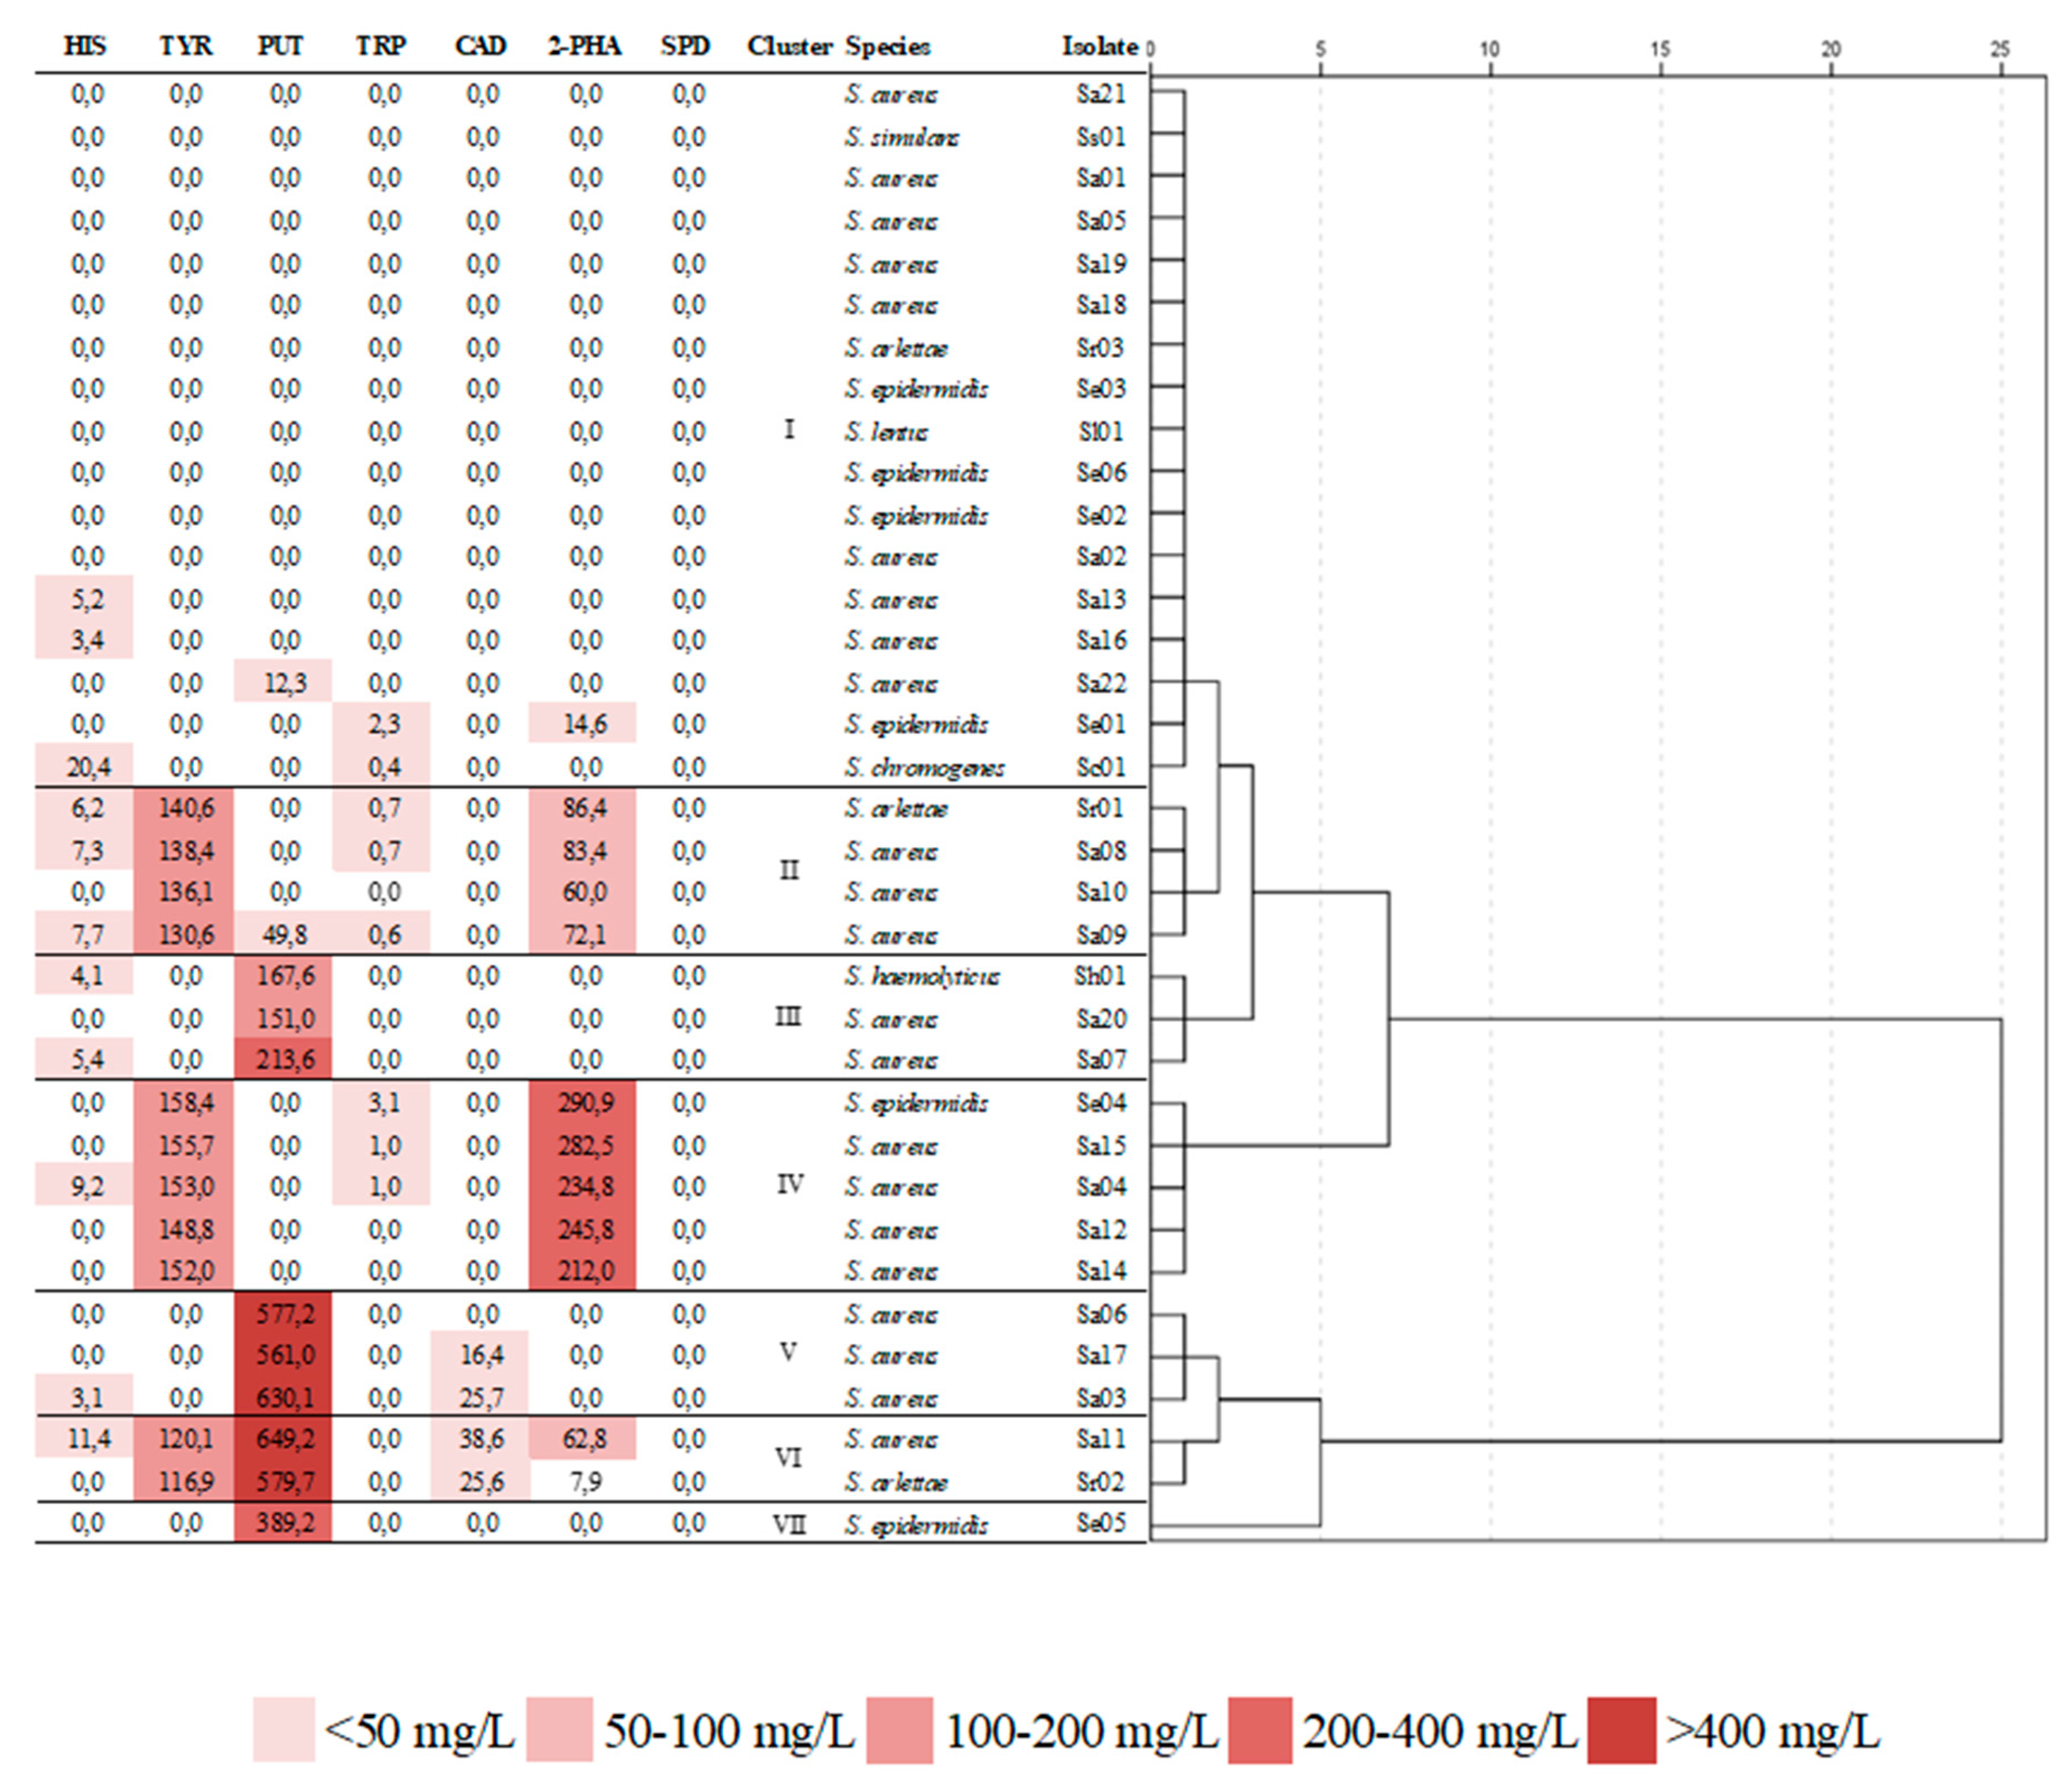
3.3. Biogenic Amine Production
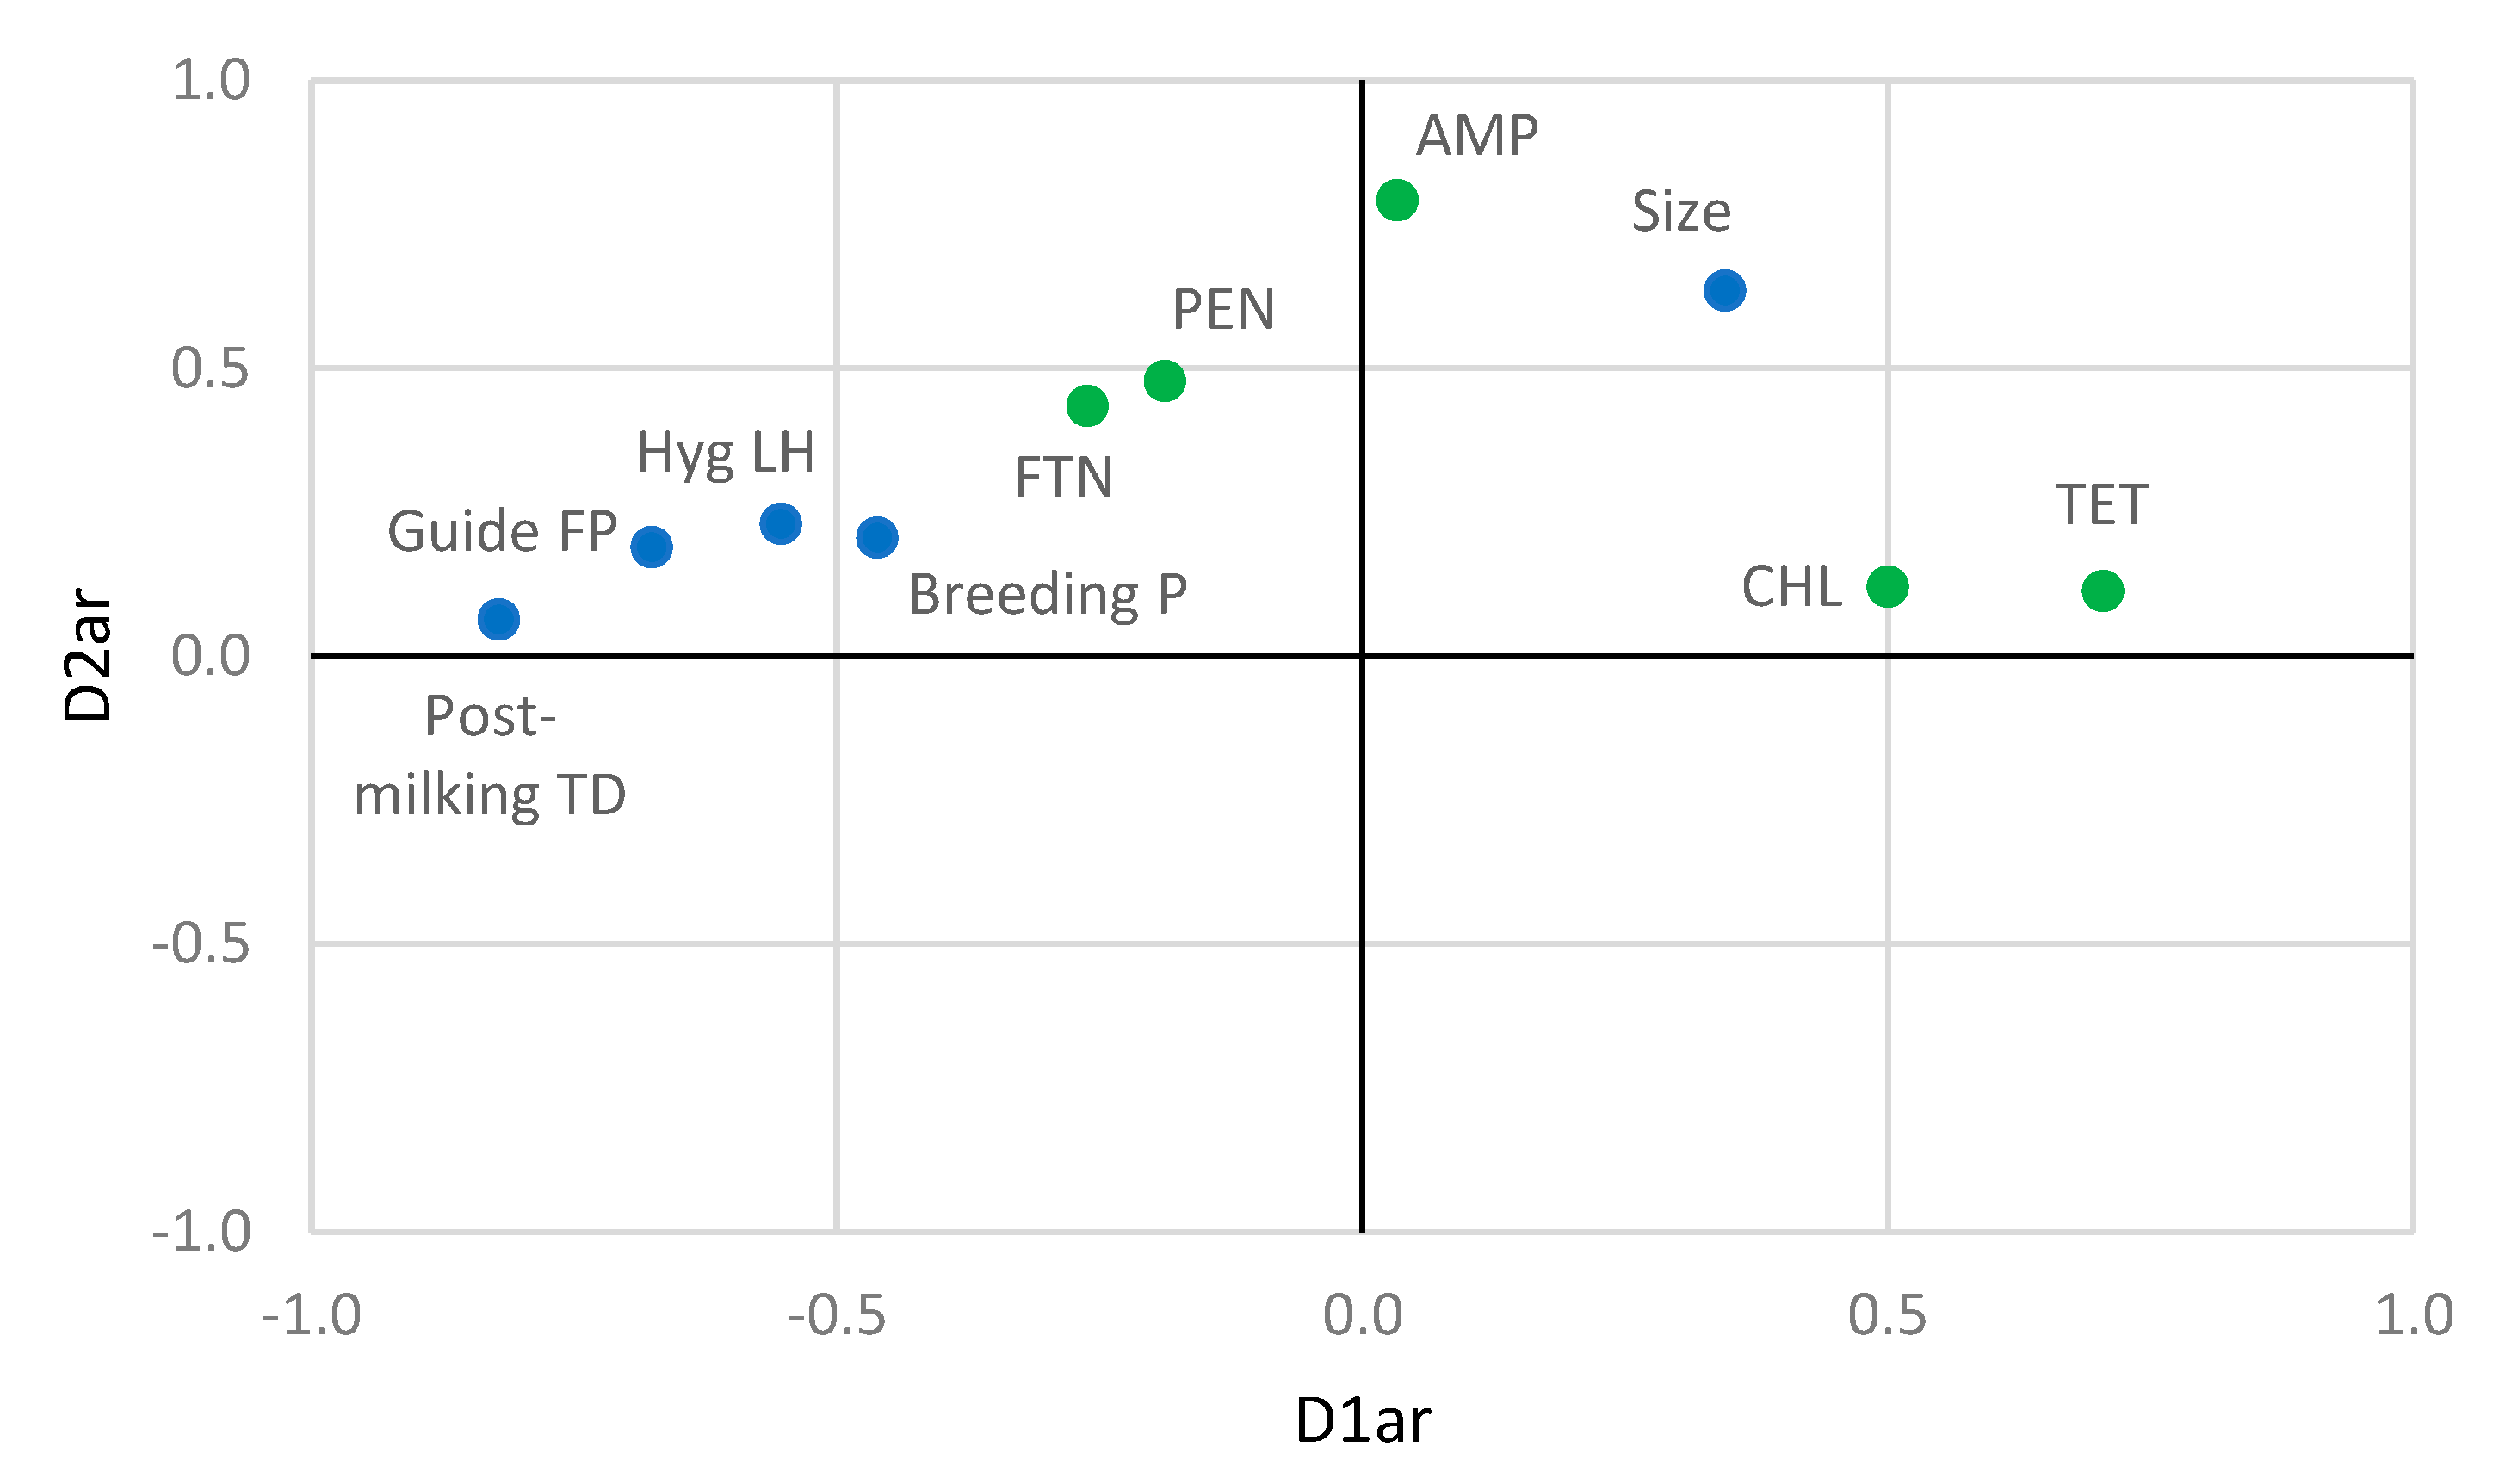
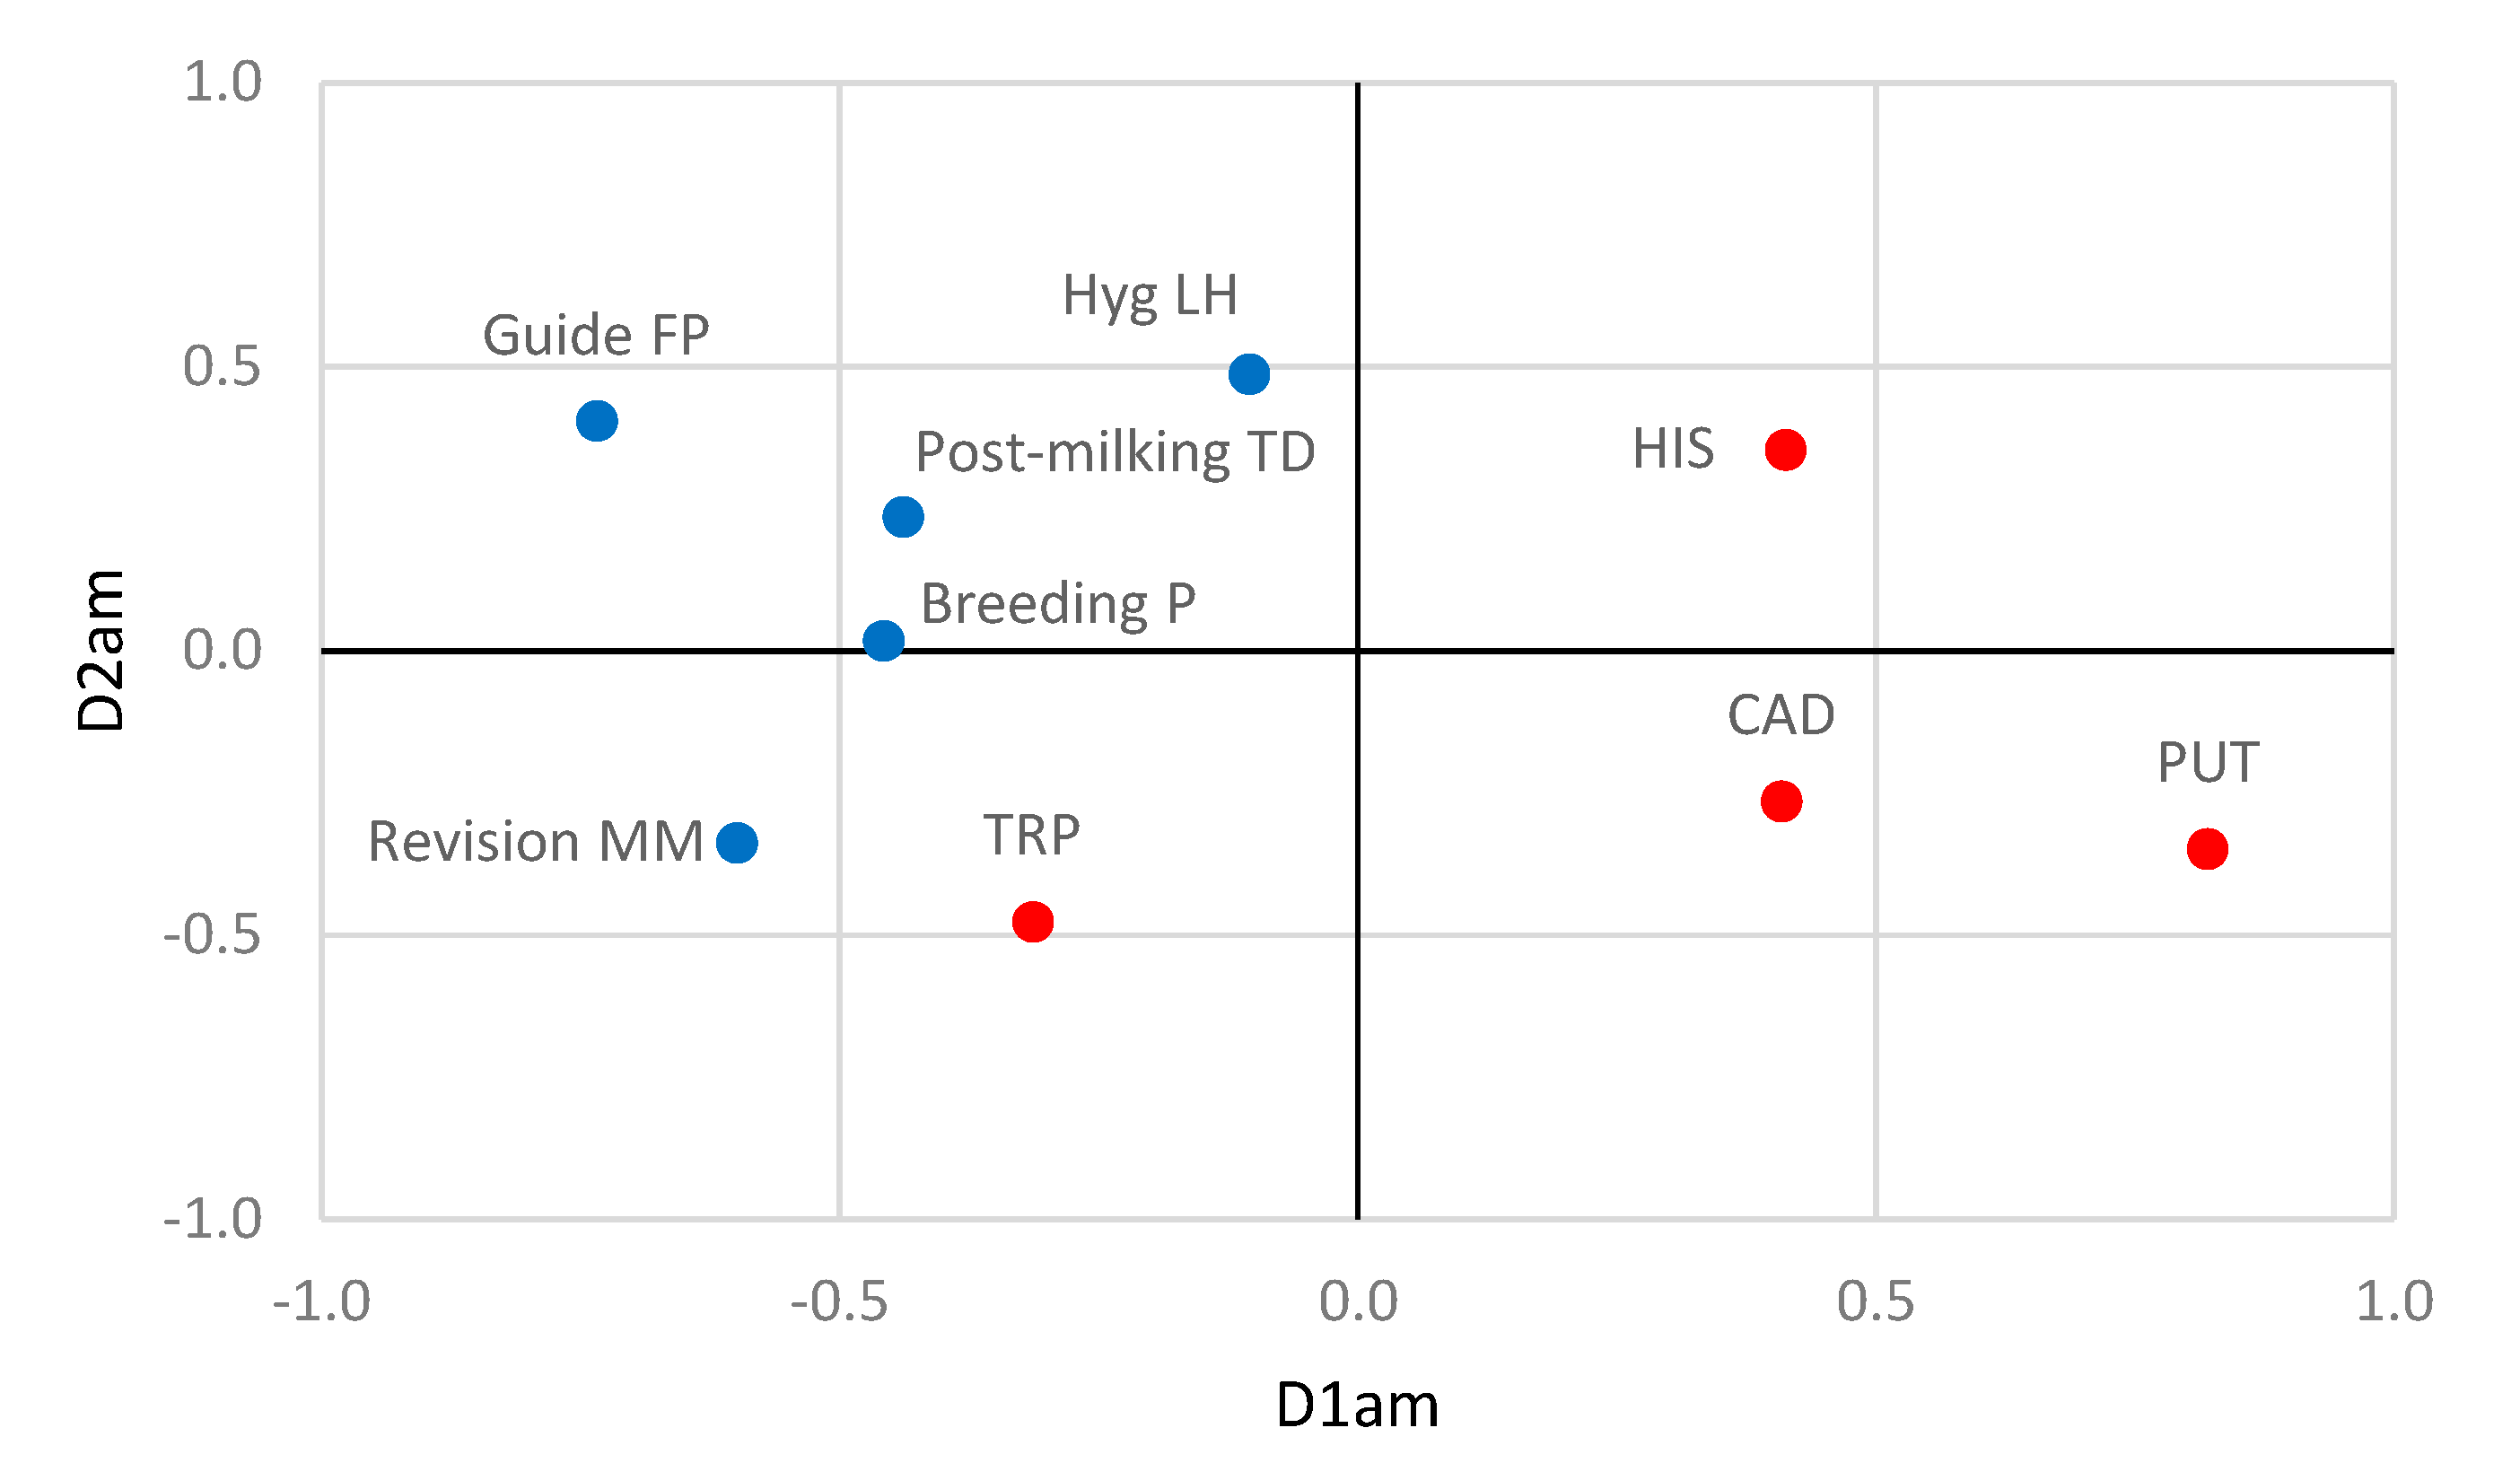
3.4. Relationships between Farming Practices and Antibiotic Resistance and Biogenic Amine Production by Staphylococci
4. Discussion
5. Conclusions
Author Contributions
Funding
Conflicts of Interest
References
- Gelasakis, A.I.; Mavrogianni, V.S.; Petridis, I.G.; Vasileiou, N.G.C.; Fthenakis, G.C. Mastitis in sheep–The last 10 years and the future of research. Vet. Microbiol. 2015, 185, 136–146. [Google Scholar] [CrossRef] [PubMed]
- Bergonier, D.; De Crémoux, R.; Rupp, R.; Lagriffoul, G.; Berthelot, X. Mastitis of dairy small ruminants. Vet. Res. 2003, 34, 689–716. [Google Scholar] [CrossRef] [PubMed]
- Kadariya, J.; Smith, T.C.; Thapaliya, D. Staphylococcus aureus and staphylococcal food-borne disease: An ongoing challenge in public health. BioMed Res. Int. 2014, 827965. [Google Scholar] [CrossRef]
- Jans, C.; Merz, A.; Johler, S.; Younan, M.; Tanner, S.A.; Kaindi, D.W.M.; Wangoh, J.; Bonfoh, B.; Meile, L.; Tasara, T. East and West African milk products are reservoirs for human and livestock-associated Staphylococcus Aureus. Food Microbiol. 2017, 65, 64–73. [Google Scholar] [CrossRef] [PubMed]
- Piasta, A.; Jastrzebska, A.; Krzeminski, M.P.; Muzioł, T.M.; Szłyk, E. New procedure of selected biogenic amines determination in wine samples by HPLC. Anal. Chim. Acta. 2014, 834, 58–66. [Google Scholar] [CrossRef]
- Benkerroum, N. Biogenic Amines in Dairy Products: Origin, Incidence, and Control Means. Compr. Rev. Food Sci. Food Saf. 2016, 15, 801–826. [Google Scholar] [CrossRef]
- Ladero, V.; Calles-Enríquez, M.; Fernández, M.; Álvarez, M.A. Toxicological effects of dietary biogenic amines. Curr. Nutr. Food Sci. 2010, 6, 145–156. [Google Scholar] [CrossRef]
- Fernández-García, E.; Tomillo, J.; Núñez, M. Effect of added proteinases and level of starter culture on the formation of biogenic amines in raw milk Manchego cheese. Int. J. Food Microbiol. 1999, 52, 189–196. [Google Scholar] [CrossRef]
- Poveda, J.M.; Chicón, R.; Cabezas, L. Biogenic amine content and proteolysis in Manchego cheese manufactured with Lactobacillus paracasei subsp. paracasei as adjunct and other autochthonous strains as starters. Int. Dairy. J. 2015, 47, 94–101. [Google Scholar] [CrossRef]
- Ubaldo, J.C.S.R.; Carvalho, A.F.; Fonseca, L.M.; Glória, M.B.A. Bioactive amines in Mozzarella cheese from milk with varying somatic cell counts. Food Chem. 2015, 178, 229–235. [Google Scholar] [CrossRef]
- Regulation, E.C. Regulation (EC) No 2019/6 of 11 December 2018 on veterinary medical products and repealing Directive 2001/82/EC. Off. J. Eur. Union 2018, L4, 43–167. [Google Scholar]
- Regulation, E.C. Regulation (EC) No 2073/2005 of 15 November 2005 on microbiological criteria for foodstuffs. Off. J. Eur. Union 2005, L 338, 1–26. [Google Scholar]
- Gonzalo, C.; Juárez, M.T.; García-Jimeno, M.C.; De La Fuente, L.F. Bulk tank somatic cell count and total bacterial count are affected by target practices and milking machine features in dairy sheep flocks in Castilla-León region, Spain. Small Rumin. Res. 2019, 178, 22–29. [Google Scholar] [CrossRef]
- Quintana, Á.R.; Perea, J.M.; García-Béjar, B.; Jiménez, L.; Garzón, A.; Arias, R. Dominant yeast community in raw sheep’s milk and potential transfers of yeast species in relation to farming practices. Animals 2020, 10, 906. [Google Scholar] [CrossRef] [PubMed]
- Bannerman, T.L.; Hancock, G.A.; Tenover, F.C.; Miller, J.M. Pulsed-field gel electrophoresis as a replacement for bacteriophage typing of Staphylococcus aureus. J. Clin. Microbiol. 1995, 33, 551–555. [Google Scholar] [CrossRef]
- Vauterin, L.; Vauterin, P. Computer-aided objective comparison of electrophoresis patters for grouping and identification of microorganisms. Eur. Microbiol. 1992, 1, 37–42. [Google Scholar]
- Jiménez, E.; de Andrés, J.; Manrique, M.; Pareja-Tobes, P.; Tobes, R.; Martínez-Blanch, J.F.; Codoñer, F.M.; Ramón, D.; Fernández, L.; Rodríguez, J.M. Metagenomic analysis of milk of healthy and mastitis-suffering women. J. Human Lact. 2015, 31, 406–415. [Google Scholar] [CrossRef]
- CLSI. Performance Standards for Antimicrobial Susceptibility Testing, 25th ed.; CLSI supplement M100-S25; Clinical and Laboratory Standards Institute: Delaware, PA, USA, 2015. [Google Scholar]
- Ruiz, P.; Barragán, I.; Seseña, S.; Palop, M.L. Is staphylococci population from milk of healthy goats safe? Int. J. Food Microbiol. 2016, 238, 146–152. [Google Scholar] [CrossRef]
- Even, S.; Leroy, S.; Charlier, C.; Zakour, N.B.; Chacornac, J.P.; Lebert, I.; Jamet, E.; Desmonts, M.H.; Coton, E.; Pochet, S.; et al. Low occurrence of safety hazards in coagulase negative staphylococci isolated from fermented food stuffs. Int. J. Food Microbiol. 2010, 139, 87–95. [Google Scholar] [CrossRef]
- Martineau, F.; Picard, F.J.; Ke, D.; Paradis, S.; Roy, P.H.; Ouellette, M.; Bergeron, M.G. Development of a PCR assay for identification of staphylococci at genus and species levels. J. Clin. Microbiol. 2001, 39, 2541–2547. [Google Scholar] [CrossRef]
- Poveda, J.M.; Ruiz, P.; Seseña, S.; Palop, M.L. Occurrence of biogenic amine-forming lactic acid bacteria during a craft brewing process. LWT Food Sci. Technol. 2017, 85, 129–136. [Google Scholar] [CrossRef]
- Coton, M.; Romano, A.; Spano, G.; Ziegler, K.; Vetrana, C.; Desmarais, C.; Lonvaud-Funel, A.; Lucas, P.; Coton, E. Occurrence of biogenic amine-forming lactic acid bacteria in wine and cider. Food Microbiol. 2010, 27, 1078–1085. [Google Scholar] [CrossRef] [PubMed]
- De las Rivas, B.; Marcobal, A.; Carrascosa, A.V.; Muñoz, R. PCR detection of foodborne bacteria producing the biogenic amines histamine, tyramine, putrescine, and cadaverine. J. Food Prot. 2006, 69, 2509–2514. [Google Scholar] [CrossRef] [PubMed]
- Liu, C.; Wu, W.H.T.; Lee, T.; Chang, H. A novel model for exploring the correlation between patterns and prescriptions in clinical practice of traditional Chinese medicine for systemic lupus erythematosus. Complement. Ther. Med. 2014, 22, 481–488. [Google Scholar] [CrossRef] [PubMed]
- Van der Burg, E.; de Leeuw, J.; Dijksterhuis, G. Overals. Nonlinear canonical correlation with k sets of variables. Comput. Stat. Data Anal. 1994, 18, 141–163. [Google Scholar] [CrossRef]
- Frie, K.G.; Janssen, C. Social inequality, lifestyles and health–a non-linear canonical correlation analysis based on the approach of Pierre Bourdieu. Int. J. Public Health 2009, 54, 213–221. [Google Scholar] [CrossRef]
- Molina, L.; Angón, E.; García, A.; Caballero-Villalobos, J.; Giorgis, A.O.; Moralejo, R.H.; Perea, J.A. Retrospective epidemiological analysis of shared risk factors forbovine trichomoniasis and bovine genital campylobacteriosis in La Pampa province (Argentina). Prev. Vet. Med. 2018, 161, 109–114. [Google Scholar] [CrossRef]
- Statistics for Windows; SPSS Inc.: Chicago, IL, USA; IBM Corp: Armonk, NY, USA, 2017.
- Soares, R.; Pires, C.; Signori, K.; Mere, E.; Flosi, V.M. Identification and molecular phylogeny of coagulase-negative staphylococci isolates from Minas Frescal chesee in southeastern Brazil: Superantigenic toxin production and antibiotic resistance. J. Dairy Sci. 2016, 99, 2641–2653. [Google Scholar] [CrossRef]
- De Garnica, M.L.; Santos, J.A.; Gonzalo, C. Influence of storage and preservation on microbiological quality of silo ovine milk. J. Dairy Sci. 2011, 94, 1922–1927. [Google Scholar] [CrossRef]
- Jiménez, L.; Garzón, A.I.; Pérez-Guzmán, M.D.; García, A.; Arias, R. Calidad microbiológica diferencial de la leche de tanque de oveja. Univ. Del Zulia Rev. Cient. 2018, 28, 11–18. [Google Scholar]
- Ariznabarreta, A.; Gonzalo, C.; San Primitivo, F. Microbiological quality and somatic cell count of ewe milk with special reference to staphylococci. J. Dairy Sci. 2002, 85, 1370–1375. [Google Scholar] [CrossRef]
- Leitner, G.; Chaffer, M.; Shamay, A.; Shapiro, F.; Merin, U.; Ezra, E.; Saran, A.; Silakinove, N. Changes in milk composition as affected by subclinical mastitis in sheep. J. Dairy Sci. 2004, 87, 46–52. [Google Scholar] [CrossRef]
- Sarmah, A.K.; Meyer, M.T.; Boxall, A.B. A global perspective on the use, sales, exposure pathways, occurrence, fate and effects of veterinary antibiotics (VAs) in the environment. Chemosphere 2006, 65, 725–729. [Google Scholar] [CrossRef] [PubMed]
- Roberson, J.R. Establishing treatment protocols for clinical mastitis. Vet. Clin. North. Am. Food Anim. Pract. 2003, 19, 223–234. [Google Scholar] [CrossRef]
- Mavrogianni, V.S.; Menzies, P.I.; Fragkou, I.A.; Fthenakis, G.C. Principles of mastitis treatment in sheep and goats. Vet. Clin. North Am. Food Anim. Pract. 2011, 27, 115–120. [Google Scholar] [CrossRef]
- Rahmdel, S.; Hosseinzadeh, S.; Shekarforoush, S.S.; Torriani, S.; Gatto, V.; Pashangeh, S. Safety hazards in bacteriocinogenic Staphylococcus strains isolated from goat and sheep milk. Microb. Pathog. 2018, 116, 100–108. [Google Scholar] [CrossRef] [PubMed]
- Ed-Dra, A.; Rhazi Filali, F.; Bouymajane, A.; Benhallam, F.; El Allaoui, A.; Chaiba, A.; Giarratana, F. Antibiotic Susceptibility profile of Staphylococcus aureus isolated from sausages in Meknes, Morocco. Vet. World 2018, 11, 1459–1465. [Google Scholar] [CrossRef]
- Regulation, E.C. Regulation (EC) No 853/2004 of the European Parliament and of the Council of 29 April 2004 laying down specific hygiene rules for food of animal origin. Off. J. Eur. Union 2004, 30, 151. [Google Scholar]
- Jiménez, L.; Poveda, J.M.; Garzón, A.I.; Martínez, A.L.; Núñez, N.; Romero, J.; Pérez-Guzmán, M.D.; Arias, R. Composition and color indices of sheep’s bulk-tank milk are influenced by production practices. Ital. J. Anim. Sci 2018, 17, 477–488. [Google Scholar] [CrossRef]
- Jiménez, L. Evaluación de la Calidad Higiénico-Sanitaria y Tecnológica de la Leche de Raza Manchega como Instrumento para la Mejora de la Viabilidad Socioeconómica y Ambiental de los Sistemas Productivos de Ovino Lechero. Ph.D. Thesis, Universidad de Córdoba, Córdoba, Spain, 2019. Available online: https://helvia.uco.es/xmlui/handle/10396/19637 (accessed on 7 September 2020).
- Bermúdez, R.; Lorenzo, J.M.; Fonseca, S.; Franco, I.; Carballo, J. Strains of Staphylococcus and Bacillus isolated from traditional sausages as producers of biogenic amines. Front. Microbiol. 2012, 3, 1–6. [Google Scholar] [CrossRef]
- Jeong, D.W.; Han, S.; Lee, J.H. Safety and technological characterization of Staphylococcus equorum isolates from jeotgal, a Korean high-salt-fermented seafood, for starter development. Int. J. Food Microbiol. 2014, 188, 108–115. [Google Scholar] [CrossRef] [PubMed]
- Alfaia, C.M.; Gouveia, I.M.; Fernandes, M.H.; Fernandes, M.J.; Semedo-Lemsaddek, T.; Barreto, A.S.; Fraqueza, M.J. Assessment of coagulase-negative staphylococci and lactic acid bacteria isolated from Portuguese dry fermented sausages as potential starters based on their biogenic amine profile. J. Food Sci. 2018, 83, 2544–2549. [Google Scholar] [CrossRef]
- Müller, A.; Reichhardt, R.; Fogarassy, G.; Bosse, R.; Gibis, M.; Weiss, J.; Schmidt, H.; Weiss, A. Safety assessment of selected Staphylococcus carnosus strains with regard to their application as meat starter culture. Food Control. 2016, 66, 93–99. [Google Scholar] [CrossRef]
- Van Schothorst, M.; Zwietering, M.H.; Ross, T.; Buchanan, R.L.; Cole, M.B. Relating microbiological criteria to food safety objectives and performance objectives. Food Control. 2009, 20, 967–979. [Google Scholar] [CrossRef]


| Target Gene | Primer Sequence (5′-3′) | Product Size (bp *) | Annealing Temperature (°C) |
|---|---|---|---|
| Antibiotic resistance | |||
| blaTEM | AGGAAGAGTATTCAACA | 635 | 55 |
| CTCGTCGTTTGGTATGG | |||
| Oxa | GTCTTTCAGAG-TACGGCATTA | 822 | 55 |
| GATTTTCTTAGCGGCAACTTA | |||
| mecA | TGGCTCAGGTACTGCTATCC | 533 | 50 |
| CACCTTGTCCGTAACCTGAA | |||
| vanA | ATGAATAGAATAAAAGTTGC | 1032 | 62 |
| TCACCCCTTTAACGCTAATA | |||
| tetM | GTGTGACGAACTTTACCGAA | 501 | 55 |
| GCTTTGTATCTCCAAGAACAC | |||
| gyrA | AATGAACAAGGTATGACACC | 618 | 55 |
| TACGCGCTTCAGTATAACGC | |||
| grlA | ACTTGAAGATGTTTTAGGTGAT | 618 | 55 |
| TTAGGAAATCTTGATGGCAA | |||
| aac6′/aph2″ | CCAAGAGCAATAAGGGCATA | 220 | 45 |
| CACTATCATAACCACTACCG | |||
| ermA | GTTCAAGAACAATCAATACAGAG | 421 | 52 |
| GGATCAGGAAAAGGACATTTTAC | |||
| ermB | CCGTTTACGAAATTGGAACAGGTAAAGGGC | 359 | 55 |
| GAATCGAGACTTGAGTGTGC | |||
| ermC | GCTAATATTGTTTAAATCGTCAATTCC | 572 | 52 |
| GGATCAGGAAAAGGACATTTTAC | |||
| mefA | ACTATCATTAATCACTAGTGC | 346 | 55 |
| TTCTTCTGGTACTAAAAGTGG | |||
| msrA | GGCACAATAAGAGTGTTTAAAGG | 940 | 50 |
| AAGTTATATCATGAATAGATTGTCCTGTT | |||
| CGTGTTTTCAACATTTAATGCAA | |||
| Biogenic amines | |||
| tdc | ACATAGTCAACCATRTTGAA | 1133 | 52 |
| CAAATGGAAGAAGAAGTAGG | |||
| hdc | GATGGTATTGTTTCKTATGA | 435 | 52 |
| CCAAACACCAGCATCTTC | |||
| odc | NCAYAARCAACAAGYNGG | 900 | 52 |
| GRTANGGNTNNGCACCTTC | |||
| ldc | CAYRTNCCNGGNCAYAA | 1185 | 53 |
| GGDATNCCNGGNGGRTA |
| β-Lactams | Glycopeptides | Tetracyclines | Quinolones | Aminoglucosides | Macrolides | Others | |||||||||||||||||||
|---|---|---|---|---|---|---|---|---|---|---|---|---|---|---|---|---|---|---|---|---|---|---|---|---|---|
| Species | Isolate | Phen | Gen | Phen | Gen | Phen | Gen | Phen | Gen | Phen | Phen | Gen | Phen | Phen | Gen | Phen | Phen | ||||||||
| AMP | PEN | blaTEM | oxa | mecA | VAN | vanA | TET | tetM | CIP | gyrA | grlA | SMN | GMN | aac6′/aph2″ | CMN | ERY | ermA | ermB | ermC | mefA | msrA | FTN | CHL | ||
| S. aureus | Sa01 | S | S | − | − | − | S | − | R | + | S | − | + | I | S | − | S | S | − | + | − | − | − | S | S |
| Sa02 | S | S | − | − | − | S | − | S | + | S | − | − | S | S | − | S | I | − | − | − | − | − | S | S | |
| Sa03 | S | S | − | − | − | S | − | S | − | S | − | − | R | S | − | I | I | − | − | − | − | − | S | S | |
| Sa04 | S | S | − | − | − | S | − | S | − | S | − | − | S | S | − | S | I | − | + | − | − | − | S | S | |
| Sa05 | S | S | − | − | − | S | − | S | + | S | − | − | S | S | − | S | S | − | − | + | − | − | S | S | |
| Sa06 | R | R | − | − | − | S | − | R | + | S | − | − | R | S | − | R | I | − | + | − | − | − | R | S | |
| Sa07 | S | S | − | − | − | S | − | R | + | S | − | − | I | S | − | S | I | − | + | − | − | − | S | S | |
| Sa08 | R | R | − | − | − | S | − | S | − | S | − | − | S | S | − | I | S | − | + | − | − | − | S | S | |
| Sa09 | S | S | − | − | − | S | − | R | + | S | − | − | S | S | − | R | R | − | − | + | − | − | S | S | |
| Sa10 | R | R | − | − | − | S | − | S | + | I | − | + | R | S | − | S | I | − | + | − | − | − | S | S | |
| Sa11 | S | S | − | − | − | S | − | S | + | R | − | + | I | S | − | I | I | − | − | + | − | − | S | S | |
| Sa12 | R | R | − | − | − | S | − | R | + | R | − | − | R | S | − | I | I | − | + | − | − | − | S | R | |
| Sa13 | R | R | − | − | − | S | − | I | − | R | − | + | S | S | − | I | I | − | − | − | − | − | I | I | |
| Sa14 | S | S | − | − | − | S | − | S | − | S | − | − | I | S | − | I | I | − | − | − | − | − | S | S | |
| Sa15 | S | S | − | − | − | S | − | S | + | I | − | − | I | S | − | I | I | − | − | − | − | − | S | S | |
| Sa16 | R | S | − | − | − | S | − | S | − | I | − | + | I | S | − | I | I | − | − | − | − | − | S | S | |
| Sa17 | S | S | − | − | − | S | − | R | − | S | − | + | I | S | − | I | I | − | − | − | − | − | S | I | |
| Sa18 | R | R | − | − | − | S | − | S | + | S | − | − | S | S | − | I | S | − | − | + | − | − | S | S | |
| Sa19 | R | S | − | − | − | S | − | S | − | S | − | − | S | S | − | S | I | − | − | − | − | − | S | S | |
| Sa20 | S | S | − | − | − | S | − | S | − | S | − | − | S | S | − | S | S | − | − | − | − | − | S | S | |
| Sa21 | R | S | − | − | − | S | − | S | − | S | − | − | S | S | − | S | S | − | − | − | − | − | S | S | |
| Sa22 | R | S | − | − | − | S | − | R | + | S | − | − | S | S | − | S | S | − | − | − | − | − | S | S | |
| S. epidermidis | Se01 | R | R | − | − | − | S | − | R | − | S | − | − | S | S | − | S | S | − | + | − | − | − | S | S |
| Se02 | R | R | − | − | − | S | − | S | − | I | − | − | S | S | − | S | S | − | + | − | − | − | S | S | |
| Se03 | R | R | − | − | − | S | − | R | + | S | − | − | S | S | − | S | S | − | + | − | − | − | S | S | |
| Se04 | R | R | − | − | − | S | − | S | + | R | − | − | S | S | − | S | S | − | + | − | − | − | S | R | |
| Se05 | R | R | − | − | − | S | − | S | + | S | − | − | R | S | − | S | I | − | + | − | − | − | S | S | |
| Se06 | R | R | − | − | − | S | − | S | + | S | − | − | S | S | − | S | R | − | + | − | − | − | S | S | |
| S. arlettae | Sr01 | S | R | − | − | − | S | − | S | − | I | − | + | R | S | − | S | I | − | + | − | − | − | R | S |
| Sr02 | R | R | − | − | − | S | − | I | + | S | − | − | S | S | − | I | S | − | − | − | − | − | S | S | |
| Sr03 | R | R | − | − | − | S | − | S | + | S | − | − | S | S | − | I | S | − | − | − | − | − | S | S | |
| S. lentus | Sl01 | S | S | − | − | − | S | − | R | − | S | − | − | S | S | − | I | I | − | − | + | − | − | S | S |
| S. haemolyticus | Sh01 | S | S | − | − | − | S | − | S | + | R | − | − | S | S | − | S | I | − | − | + | − | − | S | S |
| S. simulans | Ss01 | R | R | − | − | − | S | − | S | − | S | − | − | S | S | − | S | S | − | − | − | − | − | S | S |
| S. chromogenes | Sc01 | R | R | − | − | − | S | − | R | − | S | − | − | S | S | − | I | R | − | + | − | − | − | S | S |
| Species | Isolate a | Antibiotic Resistance b | MAR Index |
|---|---|---|---|
| S. aureus | Sa01 | TET | 0.09 |
| Sa03 | SMN | 0.09 | |
| Sa06 | AMP, PEN, TET, FTN, CMN, SMN | 0.54 | |
| Sa07 | TET | 0.09 | |
| Sa08 | AMP, PEN | 0.18 | |
| Sa09 | TET, ERY, CMN | 0.27 | |
| Sa10 | AMP, PEN, SMN | 0.09 | |
| Sa11 | CIP | 0.09 | |
| Sa12 | AMP, PEN, TET, CIP, SMN, CHL. | 0.54 | |
| Sa13 | AMP, PEN, CIP | 0.27 | |
| Sa16 | AMP | 0.09 | |
| Sa17 | TET | 0.09 | |
| Sa18 | AMP, PEN | 0.18 | |
| Sa19 | AMP | 0.09 | |
| Sa21 | AMP | 0.09 | |
| Sa22 | AMP, TET | 0.18 | |
| S. epidermidis | Se01 | AMP, PEN, TET | 0.27 |
| Se02 | AMP, PEN | 0.18 | |
| Se03 | AMP, PEN, TET | 0.27 | |
| Se04 | AMP, PEN, CIP, CHL | 0.36 | |
| Se05 | AMP, PEN, SMN | 0.27 | |
| Se06 | AMP, PEN, ERY | 0.27 | |
| S. arlettae | Sr01 | PEN, FTN, SMN | 0.27 |
| Sr02 | AMP, PEN | 0.18 | |
| Sr03 | AMP, PEN | 0.18 | |
| S. lentus | Sl01 | TET | 0.09 |
| S. haemolyticus | Sh01 | CIP | 0.09 |
| S. simulans | Ss01 | AMP, PEN | 0.18 |
| S. chromogenes | Sc01 | AMP, PEN, TET, ERY | 0.36 |
| Variable | Levels | Frequency (%) |
|---|---|---|
| Size | <1300 | 22 (62.9) |
| ≥1300 | 13 (37.1) | |
| Breeding P | Not enrolled | 18 (51.4) |
| Enrolled | 17 (48.6) | |
| Guide FP | No | 12 (34.3) |
| Yes | 23 (65.7) | |
| Hyg LH | Not | 18 (51.4) |
| Adequate | 17 (48.6) | |
| Hyg MP | Not | 20 (57.1) |
| Adequate | 15 (42.9) | |
| Milkline | Mid | 21 (60.0) |
| Low | 14 (40.0) | |
| M Stalls | <48 | 13 (37.1) |
| ≥48 | 22 (62.9) | |
| Ewes/M Stalls | <30 | 22 (62.9) |
| ≥30 | 13 (37.1) | |
| Revision MM | None | 18 (51.4) |
| Periodic | 17 (48.6) | |
| Acid | Less frequently | 28 (80.0) |
| Daily | 7 (20.0) | |
| M Vaccination | No | 25 (71.4) |
| Yes | 10 (28.6) | |
| Postmilking TD | Not | 4 (11.4) |
| Always | 31 (88.6) | |
| Dry-off T | No | 21 (60.0) |
| Yes | 14 (40.0) |
| Set | Variable | D1ar | D2ar | D1am | D2am |
|---|---|---|---|---|---|
| Farming practices | Size | 0.345 | 0.635 | - | - |
| Breeding P | −0.462 | 0.206 | −0.458 | 0.019 | |
| Guide FP | −0.676 | 0.190 | −0.734 | 0.405 | |
| Hyg LH | −0.553 | 0.229 | −0.105 | 0.488 | |
| Hyg MP | - | - | - | - | |
| Milkline | - | - | - | - | |
| M Stalls | - | - | - | - | |
| Ewes/M Stalls | - | - | - | - | |
| Revision MM | - | - | −0.599 | −0.338 | |
| Acid | - | - | - | - | |
| M Vaccination | - | - | - | - | |
| Postmilking TD | −0.822 | 0.064 | −0.439 | 0.236 | |
| Dry-off T | - | - | - | - | |
| Antibiotic resistances | AMP | 0.033 | 0.792 | ||
| PEN | −0.188 | 0.477 | |||
| VAN | - | - | |||
| TET | 0.704 | 0.113 | |||
| CIP | - | - | |||
| SMN | - | - | |||
| GMN | - | - | |||
| CMN | - | - | |||
| ERY | - | - | |||
| FTN | −0.262 | 0.435 | |||
| CHL | 0.499 | 0.121 | |||
| Amines | HIS | 0.413 | 0.354 | ||
| TYR | - | - | |||
| PUT | 0.820 | −0.348 | |||
| TRP | −0.313 | −0.476 | |||
| CAD | 0.409 | −0.265 | |||
| 2-PHA | |||||
| SPD | |||||
| Eigenvalue | 0.860 | 0.720 | 0.808 | 0.736 | |
| Canonical r | 0.789 | 0.577 | 0.617 | 0.472 |
© 2020 by the authors. Licensee MDPI, Basel, Switzerland. This article is an open access article distributed under the terms and conditions of the Creative Commons Attribution (CC BY) license (http://creativecommons.org/licenses/by/4.0/).
Share and Cite
Poveda, J.M.; Jiménez, L.; Perea, J.M.; Arias, R.; Palop, M.L. Farming Practices Influence Antibiotic Resistance and Biogenic Amine Capacity of Staphylococci from Bulk Tank Ewe’s Milk. Animals 2020, 10, 1622. https://doi.org/10.3390/ani10091622
Poveda JM, Jiménez L, Perea JM, Arias R, Palop ML. Farming Practices Influence Antibiotic Resistance and Biogenic Amine Capacity of Staphylococci from Bulk Tank Ewe’s Milk. Animals. 2020; 10(9):1622. https://doi.org/10.3390/ani10091622
Chicago/Turabian StylePoveda, Justa María, Lorena Jiménez, José Manuel Perea, Ramón Arias, and María Llanos Palop. 2020. "Farming Practices Influence Antibiotic Resistance and Biogenic Amine Capacity of Staphylococci from Bulk Tank Ewe’s Milk" Animals 10, no. 9: 1622. https://doi.org/10.3390/ani10091622
APA StylePoveda, J. M., Jiménez, L., Perea, J. M., Arias, R., & Palop, M. L. (2020). Farming Practices Influence Antibiotic Resistance and Biogenic Amine Capacity of Staphylococci from Bulk Tank Ewe’s Milk. Animals, 10(9), 1622. https://doi.org/10.3390/ani10091622