Environmental DNA Metabarcoding as a Means of Estimating Species Diversity in an Urban Aquatic Ecosystem


Simple Summary
Abstract
1. Introduction
2. Materials and Methods
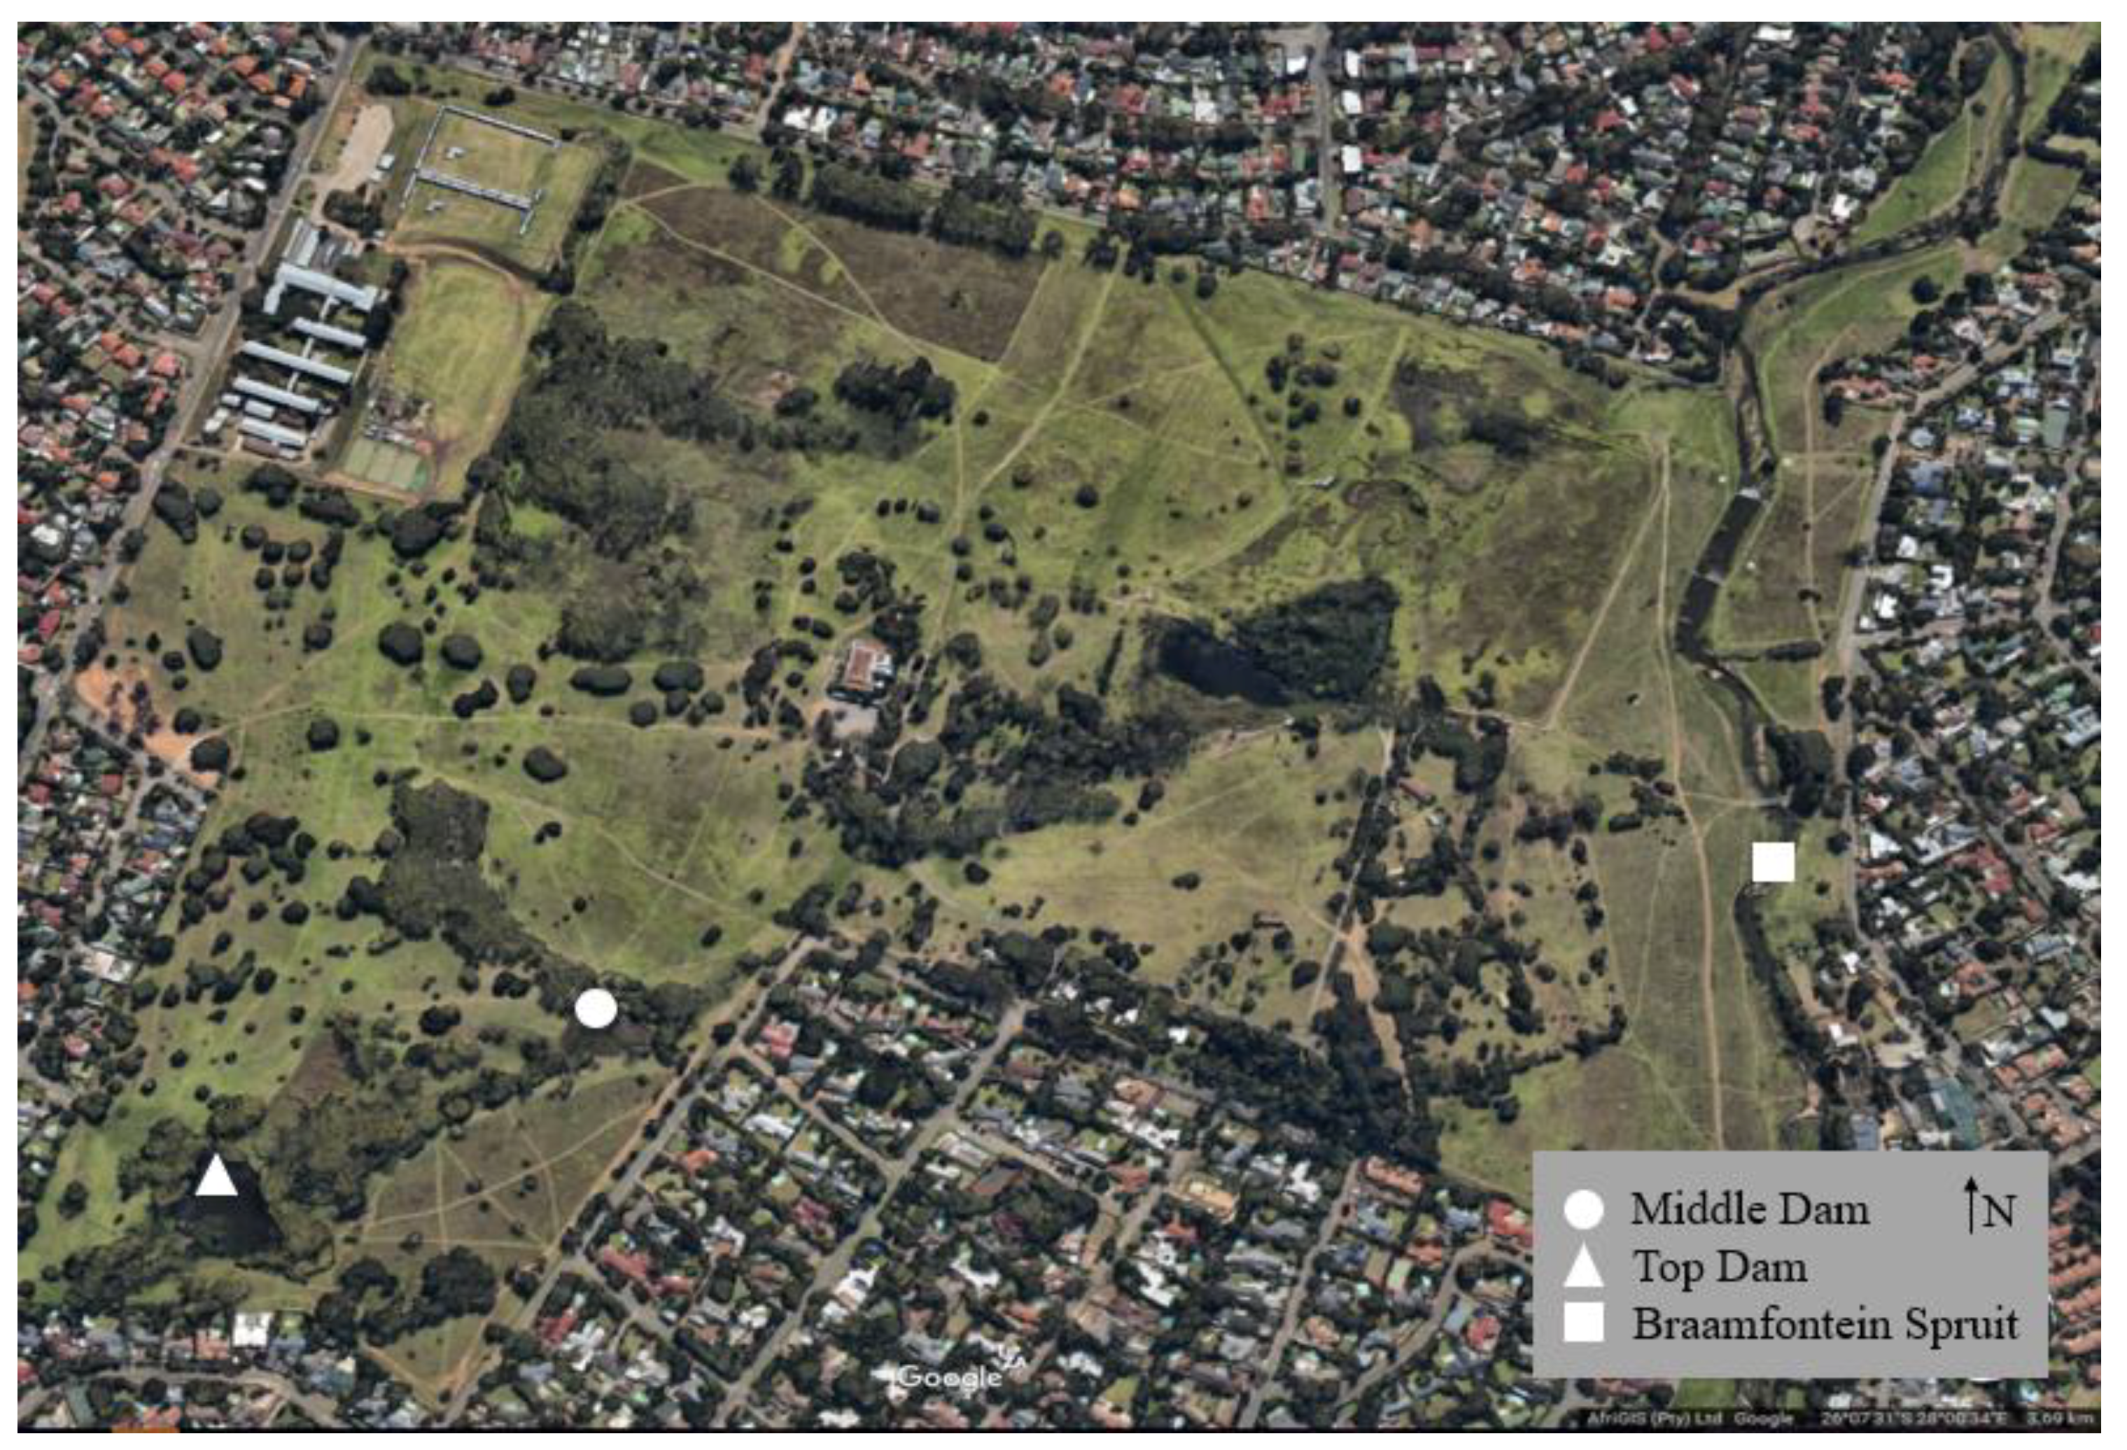
2.1. Study Area
2.2. Sample Collection
2.3. Sequence Assembly and Analysis
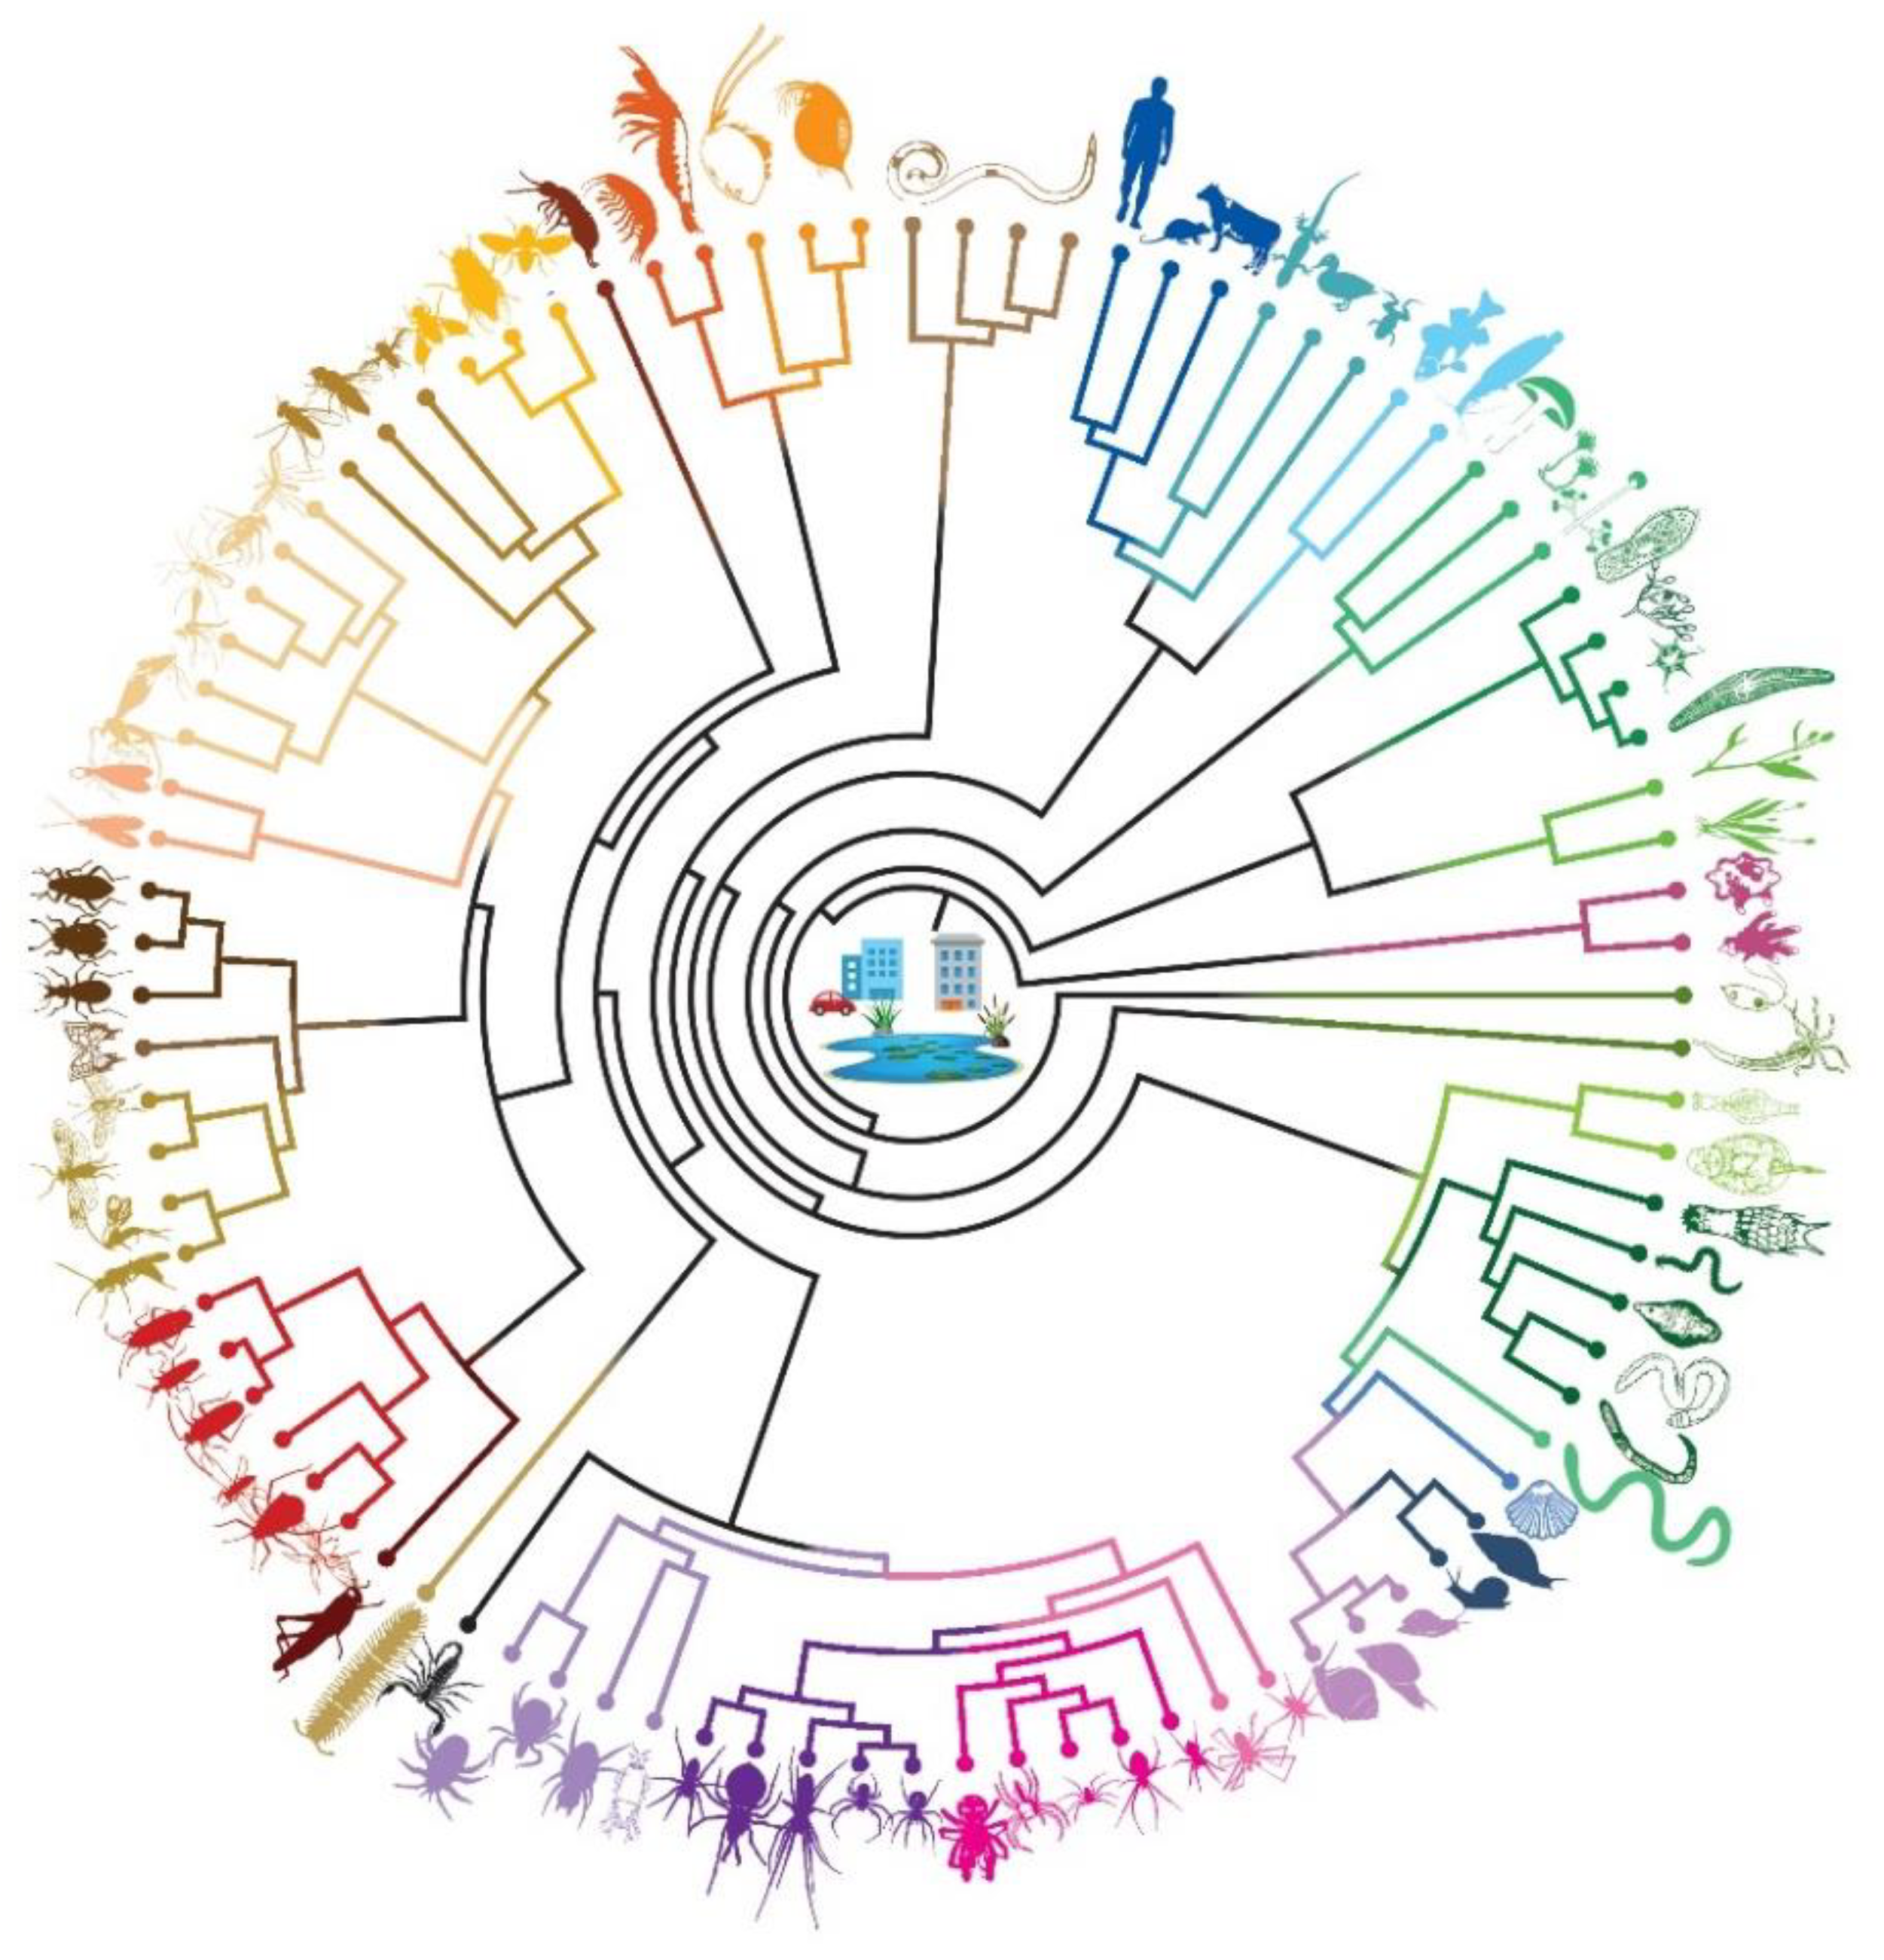
3. Results
4. Discussion
5. Conclusions
Author Contributions
Funding
Acknowledgments
Conflicts of Interest
Appendix A

| Species | BLASTN | MEGABLAST |
|---|---|---|
| Acanthamoeba | Yes | Yes |
| Achatinellidae | Yes | Yes |
| Achlya | Yes | Yes |
| Achlya bisexualis | Yes | Yes |
| Acrididae | Yes | No |
| Actinopteri | Yes | Yes |
| Agaricomycetes | Yes | Yes |
| Agelenidae | Yes | Yes |
| Agelenopsis | Yes | Yes |
| Aglaoctenus | Yes | No |
| Agromyzidae | Yes | Yes |
| Alona | No | Yes |
| Amaurobiidae | Yes | Yes |
| Amaurobioides | Yes | Yes |
| Amphibia | Yes | Yes |
| Amphipoda | Yes | Yes |
| Anacaena | No | Yes |
| Anatidae | Yes | No |
| Anelosimus | Yes | Yes |
| Anisakidae | Yes | Yes |
| Annelida | Yes | Yes |
| Anthocoridae | Yes | No |
| Antrodiaetidae | Yes | Yes |
| Anura | Yes | Yes |
| Aphelenchoides | Yes | Yes |
| Aphelenchoididae | Yes | Yes |
| Aphididae | Yes | Yes |
| Apodemus | No | Yes |
| Arachnida | Yes | Yes |
| Araneae | Yes | Yes |
| Araneidae | Yes | Yes |
| Archaeidae | No | Yes |
| Arthropoda | Yes | Yes |
| Ascomycota | Yes | Yes |
| Aspergillus tubingensis | Yes | No |
| Atemnidae | No | Yes |
| Atomaria | No | Yes |
| Aulodrilus | No | Yes |
| Aves | Yes | No |
| Bacillariaceae | Yes | Yes |
| Bacillariophyta | Yes | Yes |
| Basidiomycota | Yes | Yes |
| Bdelloidea | Yes | Yes |
| Bellamya | No | Yes |
| Biomphalaria glabrata | Yes | Yes |
| Bivalvia | Yes | Yes |
| Blenniidae | No | Yes |
| Boletaceae | No | Yes |
| Bos taurus | Yes | Yes |
| Bosmina | Yes | Yes |
| Bourletiella | No | Yes |
| Bovidae | Yes | Yes |
| Bracon | Yes | Yes |
| Braconidae | Yes | Yes |
| Branchiodrilus | Yes | Yes |
| Branchiopoda | Yes | Yes |
| Bulinus natalensis | Yes | Yes |
| Buthidae | Yes | Yes |
| Calliphoridae | Yes | No |
| Camisiidae | No | Yes |
| Caponiidae | No | Yes |
| Carabidae | Yes | Yes |
| Caraboctonidae | Yes | Yes |
| Cecidomyiidae | Yes | Yes |
| Cerambycidae | No | Yes |
| Ceratopogonidae | Yes | Yes |
| Chaetocerotales | No | Yes |
| Chaetonotida | Yes | Yes |
| Chaoboridae | No | Yes |
| Cheiracanthium | Yes | Yes |
| Cheyletus | Yes | Yes |
| Cheyletus malaccensis | Yes | No |
| Chironomidae | Yes | Yes |
| Chlaenius | No | Yes |
| Chlorophyta | Yes | Yes |
| Chloropidae | Yes | Yes |
| Chordata | Yes | Yes |
| Chromadorea | Yes | Yes |
| Chrysomelidae | Yes | Yes |
| Chrysomya rufifacies | No | Yes |
| Chrysoperla | Yes | Yes |
| Chrysophyceae | Yes | Yes |
| Chydoridae | No | Yes |
| Cicadellidae | No | Yes |
| Cicadidae | No | Yes |
| Ciliophora | Yes | Yes |
| Clarias | Yes | Yes |
| Clitellata | Yes | Yes |
| Clubionidae | No | Yes |
| Cochliopodium | Yes | Yes |
| Coleoptera | Yes | Yes |
| Colletidae | No | Yes |
| Columella | No | Yes |
| Conioscinella | No | Yes |
| Contracaecum | No | Yes |
| Corinnidae | No | Yes |
| Corydalidae | Yes | No |
| Cotesia | Yes | Yes |
| Cottus | No | Yes |
| Crabronidae | Yes | Yes |
| Crambidae | Yes | Yes |
| Cricotopus | Yes | No |
| Cryptophyceae | Yes | Yes |
| Culex | No | Yes |
| Culicidae | Yes | Yes |
| Cybaeus | Yes | No |
| Cyclopidae | Yes | Yes |
| Cyclopoida | Yes | Yes |
| Cypriniformes | No | Yes |
| Daphnia | No | Yes |
| Daphniidae | Yes | Yes |
| Decapoda | Yes | Yes |
| Dictyuchus | No | Yes |
| Dinotrema | No | Yes |
| Diplopoda | Yes | Yes |
| Diptera | Yes | Yes |
| Discosea | Yes | Yes |
| Dolichopodidae | Yes | No |
| Dorylaimida | Yes | Yes |
| Drosophila | Yes | Yes |
| Drosophila hydei | Yes | Yes |
| Drosophilidae | Yes | Yes |
| Elateridae | No | Yes |
| Ellobiidae | No | Yes |
| Ellobium | No | Yes |
| Empoasca | No | Yes |
| Endomychidae | Yes | No |
| Enoplea | Yes | No |
| Enoplognatha | No | Yes |
| Entomobrya | No | Yes |
| Entomobryomorpha | Yes | Yes |
| Erigone | No | Yes |
| Eulipotyphla | No | Yes |
| Eunotiales | No | Yes |
| Euonychophora | No | Yes |
| Fannia canicularis | Yes | No |
| Folsomia | Yes | Yes |
| Formicidae | No | Yes |
| Galaxiidae | No | Yes |
| Gastropoda | Yes | Yes |
| Gastrotricha | Yes | Yes |
| Geckolepis | No | Yes |
| Gekkonidae | Yes | Yes |
| Geometridae | No | Yes |
| Geomitridae | Yes | Yes |
| Glomerida | No | Yes |
| Glyptapanteles | No | Yes |
| Gnaphosidae | Yes | Yes |
| Gyponana | No | Yes |
| Haplotaxida | Yes | Yes |
| Helobdella | Yes | Yes |
| Hemiptera | Yes | Yes |
| Heptageniidae | No | Yes |
| Heterolobosea | Yes | Yes |
| Heteronemertea | Yes | Yes |
| Himatismenida | Yes | Yes |
| Hirudinida | Yes | Yes |
| Homo sapiens | Yes | Yes |
| Hydropsychidae | No | Yes |
| Hydrozetes | No | Yes |
| Hydrozoa | Yes | Yes |
| Hymenoptera | Yes | Yes |
| Insecta | Yes | Yes |
| Isotomidae | Yes | Yes |
| Ixodidae | Yes | Yes |
| Laelapidae | No | Yes |
| Lampyridae | No | Yes |
| Lasiocampidae | No | Yes |
| Lauriidae | No | Yes |
| Lepidoptera | Yes | Yes |
| Leptonetidae | Yes | Yes |
| Linyphiidae | Yes | Yes |
| Longitarsus | No | Yes |
| Luciola | No | Yes |
| Lumbricidae | Yes | No |
| Lutzomyia | No | Yes |
| Lycosidae | Yes | Yes |
| Lygaeidae | Yes | No |
| Lymnaea | No | Yes |
| Lymnaeidae | Yes | Yes |
| Lysianassidae | Yes | Yes |
| Lysiphlebus | Yes | No |
| Macrocentrus | No | Yes |
| Magnoliopsida | Yes | No |
| Maiestas | No | Yes |
| Malacostraca | Yes | Yes |
| Mammalia | Yes | Yes |
| Mecoptera | No | Yes |
| Mesostigmata | Yes | Yes |
| Micropholcommatidae | Yes | No |
| Miridae | Yes | No |
| Moinidae | Yes | Yes |
| Mollusca | Yes | Yes |
| Monogononta | Yes | Yes |
| Mucorales | Yes | Yes |
| Mucoromycota | Yes | Yes |
| Muridae | Yes | Yes |
| Mycetophilidae | Yes | Yes |
| Mycomya | Yes | Yes |
| Naididae | Yes | Yes |
| Naviculales | Yes | Yes |
| Nematoda | Yes | Yes |
| Nemertea | Yes | Yes |
| Nemesiidae | Yes | Yes |
| Neogastropoda | No | Yes |
| Neuroptera | Yes | Yes |
| Nymphalidae | Yes | Yes |
| Oedemera | No | Yes |
| Oomycota | Yes | Yes |
| Opiliones | No | Yes |
| Opistophthalmus boehmi | No | Yes |
| Oppiella | No | Yes |
| Oppiidae | No | Yes |
| Oroperipatus | No | Yes |
| Orthetrum | No | Yes |
| Orthocladius | No | Yes |
| Ostracoda | Yes | Yes |
| Ototyphlonemertes | No | Yes |
| Oxyopes | No | Yes |
| Parabathynellidae | Yes | Yes |
| Paracalliopiidae | No | Yes |
| Paramecium | No | Yes |
| Paraphaenocladius | No | Yes |
| Paratanytarsus | Yes | Yes |
| Perciformes | Yes | Yes |
| Peronosporales | Yes | Yes |
| Philodromus | Yes | Yes |
| Philopotamidae | Yes | Yes |
| Philotrypesis | No | Yes |
| Phyllodocida | Yes | Yes |
| Phytomyza | No | Yes |
| Pinnularia | Yes | Yes |
| Planorbidae | Yes | Yes |
| Plantago | Yes | Yes |
| Platyhelminthes | No | Yes |
| Ploima | Yes | Yes |
| Podocopida | Yes | Yes |
| Poduromorpha | No | Yes |
| Polychaeta | Yes | Yes |
| Polydesmida | Yes | Yes |
| Polygonaceae | Yes | No |
| Polyxenidae | No | Yes |
| Proctophyllodidae | Yes | No |
| Pseudomallada | No | Yes |
| Pseudopoda | No | Yes |
| Psyllidae | Yes | No |
| Pteromalidae | No | Yes |
| Ptiliidae | No | Yes |
| Pythiales | Yes | Yes |
| Rattus | No | Yes |
| Rattus norvegicus | Yes | Yes |
| Resseliella | Yes | No |
| Rhabdias | Yes | Yes |
| Rhabditida | Yes | Yes |
| Rhizoglyphus | No | Yes |
| Rhodophyta | Yes | Yes |
| Rotifera | Yes | Yes |
| Salix | No | Yes |
| Salticidae | Yes | Yes |
| Saprolegniaceae | Yes | Yes |
| Sarcoptiformes | Yes | Yes |
| Scarabaeidae | No | Yes |
| Scatopsidae | No | Yes |
| Schizomida | No | Yes |
| Sciaridae | No | Yes |
| Scincidae | No | Yes |
| Scolopendromorpha | No | Yes |
| Scorpiones | Yes | Yes |
| Selenopidae | Yes | Yes |
| Selenops | Yes | Yes |
| Sergiolus | Yes | No |
| Silphidae | Yes | Yes |
| Simulium | Yes | Yes |
| Streblidae | No | Yes |
| Strongylida | Yes | Yes |
| Synurophyceae | Yes | Yes |
| Tabanidae | No | Yes |
| Tachinidae | Yes | Yes |
| Tardigrada | No | Yes |
| Tectocepheus | No | Yes |
| Tenebrionidae | Yes | No |
| Tenthredinidae | Yes | Yes |
| Tetragnatha | Yes | Yes |
| Tetragnathidae | Yes | Yes |
| Theridiidae | Yes | Yes |
| Thomisidae | No | Yes |
| Tipulidae | No | Yes |
| Tomoceridae | No | Yes |
| Torrenticolidae | No | Yes |
| Trichoceridae | No | Yes |
| Trombidiformes | Yes | Yes |
| Tuberolachnus | Yes | Yes |
| Tuberolachnus salignus | Yes | No |
| Tubulinea | Yes | Yes |
| Uropygi | No | Yes |
| Veneroida | Yes | Yes |
| Xyelidae | Yes | No |
| Xystodesmidae | No | Yes |
References
- Gong, C.; Chen, J.; Yu, S. Biotic homogenization and differentiation of the flora in artificial and near-natural habitats across urban green spaces. Landsc. Urban. Plan. 2013, 120, 158–169. [Google Scholar] [CrossRef]
- Mckinney, M.L. Urbanization as a major cause of biotic homogenization. Biol. Conserv. 2006, 127, 247–260. [Google Scholar] [CrossRef]
- Czech, B.; Krausman, P.R.; Devers, P.K. Economic associations among causes of species endangerment in the United States. Bioscience 2000, 50, 593–601. [Google Scholar] [CrossRef]
- Dale, S. Urban bird community composition influenced by size of urban green spaces, presence of native forest, and urbanization. Urban. Ecosyst. 2018, 1–14. [Google Scholar] [CrossRef]
- Angold, P.G.; Sadler, J.P.; Hill, M.O.; Pullin, A.; Rushton, S.; Austin, K.; Small, E.; Wood, B.; Wadsworth, R.; Sanderson, R.; et al. Biodiversity in urban habitat patches. Sci. Total Environ. 2006, 360, 196–204. [Google Scholar] [CrossRef]
- Goddard, M.A.; Dougill, A.J.; Benton, T.G. Scaling up from gardens: Biodiversity conservation in urban environments. Trends Ecol. Evol. 2009, 25, 90–98. [Google Scholar] [CrossRef] [PubMed]
- Alvey, A.A. Promoting and preserving biodiversity in the urban forest. Urban. For. Urban. Green. 2006, 5, 195–201. [Google Scholar] [CrossRef]
- Ditchkoff, S.S.; Saalfeld, S.T.; Gibson, C.J. Animal behavior in urban ecosystems: Modifications due to human-induced stress. Urban. Ecosyst. 2006, 9, 5–12. [Google Scholar] [CrossRef]
- Hindmarch, S.; Elliott, J.E. A specialist in the city: The diet of barn owls along a rural to urban gradient. Urban. Ecosyst. 2015, 18, 477–488. [Google Scholar] [CrossRef]
- Baxter-Gilbert, J.H.; Whiting, M.J. Street fighters: Bite force, injury rates, and density of urban Australian water dragons (Intellagama lesueurii). Austral. Ecol. 2018, 44, 1–10. [Google Scholar] [CrossRef]
- Luniak, M. Synurbization—Adaptation of animal wildlife to urban development. In Proceedings of the 4th International Urban Wildlife Symposium, Tucson, AZ, USA, 1–5 May 1999; pp. 50–55. [Google Scholar]
- Ives, C.D.; Lentini, P.E.; Threlfall, C.G.; Ikin, K.; Shanahan, D.F.; Garrard, G.E.; Bekessy, S.A.; Fuller, R.A.; Mumaw, L.; Rayner, L.; et al. Cities are hotspots for threatened species. Glob. Ecol. Biogeogr. 2016, 25, 117–126. [Google Scholar] [CrossRef]
- Satterthwaite, D. The impact of urban development on risk in sub-Saharan Africa’s cities with a focus on small and intermediate urban centres. Int. J. Disaster Risk Reduct. 2017, 26, 16–23. [Google Scholar] [CrossRef]
- Mucina, L.; Rutherford, M.C. The Vegetation of South Africa, Lesotho and Swaziland; South African National Biodiversity Institute: Pretoria, South Africa, 2006. [Google Scholar]
- JCP. Birds flock to Delta Park. Available online: https://www.jhbcityparks.com/index.php/news-mainmenu-56/725-birds-flock-to-delta-park (accessed on 19 June 2019).
- Lockwood, G. Florence Bloom Bird Sanctuary. Available online: http://deltaenviro.org.za/florence-bloom-bird-sanctuary/ (accessed on 3 December 2019).
- Brunialti, G.; Giordani, P.; Ferretti, M. Discriminating between the good and the bad: Quality assurance is central in biomonitoring studies. In Environmental Monitoring; Wiersma, B., Ed.; CRC Press: Boca Raton, FL, USA, 2003; pp. 443–464. [Google Scholar]
- Thomsen, P.F.; Willerslev, E. Environmental DNA—An emerging tool in conservation for monitoring past and present biodiversity. Biol. Conserv. 2015, 183, 4–18. [Google Scholar] [CrossRef]
- Taberlet, P.; Coissac, E.; Pompanon, F.; Brochmann, C.; Willerslev, E. Towards next-generation biodiversity assessment using DNA metabarcoding. Mol. Ecol. 2012, 21, 2045–2050. [Google Scholar] [CrossRef] [PubMed]
- Bonk, M.; Bobrek, R.; Dołêga, J.; Strużyński, W. Evaluation of visual encounter surveys of the noble crayfish, Astacus astacus, and the spiny-cheek crayfish, Orconectes limosus. Fish. Aquat. Life 2019, 27, 112–117. [Google Scholar] [CrossRef]
- Lefort, M.C.; Cruickshank, R.H.; Descovich, K.; Adams, N.J.; Barun, A.; Emami-Khoyi, A.; Ridden, J.; Smith, V.R.; Sprague, R.; Waterhouse, B.R.; et al. Blood, sweat and tears: A review of non-invasive DNA sampling. bioRxiv 2019. [Google Scholar] [CrossRef]
- Klymus, K.E.; Marshall, N.T.; Stepien, C.A. Environmental DNA (eDNA) metabarcoding assays to detect invasive invertebrate species in the Great Lakes. PLoS ONE 2017, 12, e0177643. [Google Scholar] [CrossRef]
- Bohmann, K.; Evans, A.; Gilbert, M.T.P.; Carvalho, G.R.; Creer, S.; Knapp, M.; Yu, D.W.; de Bruyn, M. Environmental DNA for wildlife biology and biodiversity monitoring. Trends Ecol. Evol. 2014, 29, 358–367. [Google Scholar] [CrossRef]
- Elbrecht, V.; Leese, F. Can DNA-based ecosystem assessments quantify species abundance? Testing primer bias and biomass—Sequence relationships with an innovative metabarcoding protocol. PLoS ONE 2015, 10, e0130124. [Google Scholar] [CrossRef] [PubMed]
- Hebert, P.D.N.; Cywinska, A.; Ball, S.L.; DeWaard, J.R. Biological identifications through DNA barcodes. Proc. R. Soc. 2003, 270, 313–321. [Google Scholar] [CrossRef]
- Mohammadi, S.; Lutermann, H.; Hoffmann, S.; Emami-Khoyi, A.; Webster, H.J.; Fagir, D.; Bennett, N.C.; Jansen van Vuuren, B. Morphological and molecular characterization of the plague vector Xenopsylla brasiliensis. J. Parasitol. 2020, accepted. [Google Scholar]
- Porco, D.; Bedos, A.; Greenslade, P.; Janion, C.; Skarżyński, D.; Stevens, M.I.; Jansen van Vuuren, B.; Deharveng, L. Challenging species delimitation in Collembola: Cryptic diversity among common springtails unveiled by DNA barcoding. Invertebr. Syst. 2012, 26, 470–477. [Google Scholar] [CrossRef]
- Pieterse, W.; Muller, D.L.; Jansen van Vuuren, B. A molecular identification approach for five species of mealybug (Hemiptera: Pseudococcidae) on citrus fruit exported from South Africa. Afr. Entomol. 2010, 18, 23–28. [Google Scholar] [CrossRef]
- Chown, S.L.; Sinclair, B.J.; Jansen van Vuuren, B. DNA barcoding and the documentation of alien species establishment on sub-Antarctic Marion Island. Polar Biol. 2008, 31, 651–655. [Google Scholar] [CrossRef]
- Voua Otomo, P.; Jansen Van Vuuren, B.; Reinecke, S.A. Usefulness of DNA barcoding in ecotoxicological investigations: Resolving taxonomic uncertainties using Eisenia Malm 1877 as an example. Bull. Environ. Contam. Toxicol. 2009, 82, 261–264. [Google Scholar] [CrossRef]
- Karim, A.; Iqbal, A.; Akhtar, R.; Rizwan, M.; Amar, A.; Qamar, U.; Jahan, S. Barcoding of fresh water fishes from Pakistan. Mitochondrial DNA Part A 2016, 27, 2685–2688. [Google Scholar] [CrossRef]
- Macheriotou, L.; Guilini, K.; Bezerra, T.N.; Tytat, B.; Nguyen, D.T.; Nguyen, T.X.P.; Noppe, F.; Armenteros, M.; Boufahja, F.; Rigaux, A.; et al. Metabarcoding free-living marine nematodes using curated 18S and CO1 reference sequence databases for species-level taxonomic assignments. Ecol. Evol. 2018, 9, 1211–1226. [Google Scholar] [CrossRef]
- Dopheide, A.; Tooman, L.K.; Grosser, S.; Agabiti, B.; Rhode, B.; Xie, D.; Stevens, M.I.; Nelson, N.; Buckley, T.R.; Drummond, A.J.; et al. Estimating the biodiversity of terrestrial invertebrates on a forested island using DNA barcodes and metabarcoding data. Ecol. Appl. 2019, 29, e01877. [Google Scholar] [CrossRef] [PubMed]
- Jerde, C.L.; Mahon, A.R.; Chadderton, W.L.; Lodge, D.M. “Sight-unseen” detection of rare aquatic species using environmental DNA. Conserv. Lett. 2011, 4, 150–157. [Google Scholar] [CrossRef]
- Dejean, T.; Valentini, A.; Miquel, C.; Taberlet, P.; Bellemain, E.; Miaud, C. Improved detection of an alien invasive species through environmental DNA barcoding: The example of the American bullfrog Lithobates catesbeianus. J. Appl. Ecol. 2012, 49, 953–959. [Google Scholar] [CrossRef]
- Turner, C.R.; Uy, K.L.; Everhart, R.C. Fish environmental DNA is more concentrated in aquatic sediments than surface water. Biol. Conserv. 2015, 183, 93–102. [Google Scholar] [CrossRef]
- Andruszkiewicz, E.A.; Starks, H.A.; Chavez, F.P.; Sassoubre, L.M.; Block, B.A.; Boehm, A.B. Biomonitoring of marine vertebrates in Monterey Bay using eDNA metabarcoding. PLoS ONE 2017, 12, e0176343. [Google Scholar] [CrossRef]
- Folmer, O.; Black, M.; Hoeh, W.; Lutz, R.; Vrijenhoek, R. DNA primers for amplification of mitochondrial cytochrome c oxidase subunit I from diverse metazoan invertebrates. Mol. Mar. Biol. Biotechnol. 1994, 3, 294–299. [Google Scholar]
- Amaral-Zettler, L.A.; McCliment, E.A.; Ducklow, H.W.; Huse, S.M. A method for studying protistan diversity using massively parallel sequencing of V9 hypervariable regions of small-subunit ribosomal RNA genes. PLoS ONE 2009, 4, e6372. [Google Scholar] [CrossRef]
- Leray, M.; Yang, J.Y.; Meyer, C.P.; Mills, S.C.; Agudelo, N.; Ranwez, V.; Boehm, J.T.; Machida, R.J. A new versatile primer set targeting a short fragment of the mitochondrial COI region for metabarcoding metazoan diversity: Application for characterizing coral reef fish gut contents. Front. Zool. 2013, 10, 1–14. [Google Scholar] [CrossRef]
- Geller, J.; Meyer, C.; Parker, M.; Hawk, H. Redesign of PCR primers for mitochondrial cytochrome c oxidase subunit I for marine invertebrates and application in all-taxa biotic surveys. Mol. Ecol. Resour. 2013, 13, 851–861. [Google Scholar] [CrossRef]
- Hajibabaei, M.; McKenna, C. DNA Mini-barcodes. In DNA Barcodes. Methods in Molecular Biology (Methods and Protocols); Kress, W., Erickson, D., Eds.; Humana Press: Totowa, NJ, USA, 2012; Volume 858. [Google Scholar] [CrossRef]
- Andrews, S. FastQC: A Quality Control Tool for Higher Throughput Sequence Data. Available online: https://www.bioinformatics.babraham.ac.uk/projects/%0Afastqc (accessed on 13 April 2020).
- Bolger, A.M.; Lohse, M.; Usadel, B. Trimmomatic: A flexible trimmer for Illumina sequence data. BMC Inform. 2014, 30, 2114–2120. [Google Scholar] [CrossRef]
- Li, D.; Liu, C.-M.; Luo, R.; Sadakane, K.; Lam, T. MEGAHIT: An ultra-fast single-node solution for large and complex metagenomics assembly via succinct de Bruijn graph. Bioinformatics 2015, 31, 1674–1676. [Google Scholar] [CrossRef]
- Gurevich, A.; Saveliev, V.; Vyahhi, N.; Tesler, G. QUAST: Quality assessment tool for genome assemblies. Bioinformatics 2013, 29, 1072–1075. [Google Scholar] [CrossRef]
- Langmead, B.; Salzberg, S. Fast gapped-read alignment with Bowtie 2. Nat. Methods 2013, 9, 357–359. [Google Scholar] [CrossRef]
- Li, H.; Handsaker, B.; Wysoker, A.; Fennell, T.; Ruan, J.; Homer, N.; Marth, G.; Abecasis, G.; Durbin, R. Subgroup, 1000 Genome Project Data Processing Subgroup The sequence alignment/map format and SAMtools. Bioinformatics 2009, 25, 2078–2079. [Google Scholar] [CrossRef]
- Rognes, T.; Flouri, T.; Nichols, B.; Quince, C.; Mahé, F. VSEARCH: A versatile open source tool for metagenomics. PeerJ 2016, 4, 1–22. [Google Scholar] [CrossRef]
- Chen, Y.; Ye, W.; Zhang, Y.; Xu, Y. High speed BLASTN: An accelerated MegaBLAST search tool. Nucleic Acids Res. 2015, 43, 7762–7768. [Google Scholar] [CrossRef]
- Kahlke, T.; Ralph, P.J. BASTA—Taxonomic classification of sequences and sequence bins using last common ancestor estimations. Methods Ecol. Evol. 2018, 10, 100–103. [Google Scholar] [CrossRef]
- Letunic, I. phyloT: Phylogenetic Tree Generator. Available online: https://phylot.biobyte.de/ (accessed on 4 March 2020).
- Bouckaert, R.; Heled, J.; Kühnert, D.; Vaughan, T.; Wu, C.-H.; Xie, D.; Suchard, M.A.; Rambaut, A.; Drummond, A.J. BEAST 2: A software platform for Bayesian evolutionary analysis. PLoS ONE 2014, 10, e1003537. [Google Scholar] [CrossRef]
- FASTX-Toolkit: FASTQ/a Short-Reads Pre-Processing Tools. Available online: http://hannonlab.cshl.edu/fastx_toolkit/ (accessed on 23 October 2020).
- Keylock, C.J. Simpson diversity and the Shannon-Wiener index as special cases of a generalized entropy. Oikos 2005, 109, 203–208. [Google Scholar] [CrossRef]
- Jost, L. The relation between evenness and diversity. Diversity 2010, 2, 207–232. [Google Scholar] [CrossRef]
- Guevara, M.R.; Hartmann, D.; Mendoza, M. Diverse: An r package to analyze diversity in complex systems. R J. 2016, 8, 60–78. [Google Scholar] [CrossRef]
- Dearborn, D.C.; Kark, S. Motivations for conserving urban biodiversity. Conserv. Biol. 2009, 24, 432–440. [Google Scholar] [CrossRef] [PubMed]
- Clark, T.E.; Samways, M.J. Sampling arthropod diversity for urban ecological landscaping in a species-rich southern hemisphere botanic garden. J. Insect Conserv. 1997, 1, 221–234. [Google Scholar] [CrossRef]
- Majumder, J.; Das, R.K.; Majumder, P.; Ghosh, D.; Agarwala, B.K. Aquatic insect fauna and diversity in urban fresh water lakes of Tripura, northeast India. Middle East. J. Sci. Res. 2013, 13, 25–32. [Google Scholar] [CrossRef]
- Lotz, L.N. A new species of Afrarchaea (Araneae: Archaeidae) from South Africa. Afr. Invertebr. 2015, 56, 409–414. [Google Scholar] [CrossRef]
- Wood, H.M.; Griswold, C.E.; Gillespie, R.G. Phylogenetic placement of pelian spider (Archaeidae, Araneae), with insight into evoluation of the “neck” and predatory behaviours of the superfamily Palpimanoidea. Cladistics 2012, 1–29. [Google Scholar] [CrossRef]
- Blair, R.B. Land use and avian species diversity along an urban gradient. Ecol. Appl. 1996, 6, 506–519. [Google Scholar] [CrossRef]
- Francis, R.A.; Chadwick, M.A. What makes a species synurbic? Appl. Geogr. 2012, 32, 514–521. [Google Scholar] [CrossRef]
- Teixeira, B.; Hirsch, A.; Goulart, V.D.L.R.; Passos, L.; Teixeira, C.P.; James, P.; Young, R. Good neighbours: Distribution of black-tufted marmoset (Callithrix penicillata) in an urban environment. Wildl. Res. 2015, 42, 579–589. [Google Scholar] [CrossRef]
- Owens, A.C.S.; Cochard, P.; Durrant, J.; Farnworth, B.; Perkin, E.K.; Seymoure, B. Light pollution is a driver of insect declines. Biol. Conserv. 2020, 241, 108259. [Google Scholar] [CrossRef]
- Owens, A.C.S.; Meyer-Rochow, V.B.; Yang, E.-C. Short- and mid-wavelength artificial light influences the flash signals of Aquatica ficta fireflies (Coleoptera: Lampyridae). PLoS ONE 2018, 13, e0191576. [Google Scholar] [CrossRef]
- Firebaugh, A.; Haynes, K.J. Experimental tests of light-pollution impacts on nocturnal insect courtship and dispersal. Oecologia 2016, 1203–1211. [Google Scholar] [CrossRef] [PubMed]
- WHO Schistosomiasis. Available online: http://www.who.int/mediacentre/factsheets/fs115/en/ (accessed on 4 May 2020).
- CDC Parasites—Acanthamoeba—Granulomtous Amebix Encephalitis (GAE); Keratitis. Available online: https://www.cdc.gov/parasites/acanthamoeba/index.html (accessed on 4 May 2020).
- Seifert, K.A.; Samson, R.A.; deWaard, J.R.; Houbraken, J.; Lévesque, C.A.; Moncalvo, J.M.; Louis-Seize, G.; Hebert, P.D.N. Prospects for fungus identification using CO1 DNA barcodes, with Penicillium as a test case. Proc. Natl. Acad. Sci. USA 2007, 104, 3901–3906. [Google Scholar] [CrossRef]
- Derycke, S.; Vanaverbeke, J.; Rigaux, A.; Backeljau, T.; Moens, T. Exploring the use of cytochrome oxidase c subunit 1 (COI) for DNA barcoding of free-living marine nematodes. PLoS ONE 2010, 5, e13716. [Google Scholar] [CrossRef]
- Midgley, J.M.; Hill, M.P.; Villet, M.H. The effect of water hyacinth, Eichhornia crassipes (Martius) Solms-Laubach (Pontederiaceae), on benthic biodiversity in two impoundments on the New Year’s River, South Africa. Afr. J. Aquat. Sci. 2006, 31, 25–30. [Google Scholar] [CrossRef]
- Martins, K.P.; Bandeira, M.G.d.S.; Palma-Silva, C.; Albertoni, E.F. Microcrustacean metacommunities in urban temporary ponds. Aquat. Sci. 2019, 81, 1–12. [Google Scholar] [CrossRef]
- Pont, D.; Rocle, M.; Valentini, A.; Civade, R.; Jean, P.; Maire, A.; Roset, N.; Schabuss, M.; Zornig, H.; Dejean, T. Environmental DNA reveals quantitative patterns of fish biodiversity in large rivers despite its downstream transportation. Sci. Rep. 2018, 8, 1–13. [Google Scholar] [CrossRef]
- Hofreiter, M.; Mead, J.I.; Martin, P.; Poinar, H.N. Molecular caving. Curr. Biol. 2003, 13, 10–13. [Google Scholar] [CrossRef]
- Stoeckle, B.C.; Beggel, S.; Cerwenka, A.F.; Motivans, E.; Kuehn, R.; Geist, J. A systematic approach to evaluate the influence of environmental conditions on eDNA detection success in aquatic ecosystems. PLoS ONE 2017, 12, e0189119. [Google Scholar] [CrossRef]
- Belle, C.C.; Stoeckle, B.C.; Geist, J. Taxonomic and geographical representation of freshwater environmental DNA research in aquatic conservation. Aquat. Conserv. Mar. Freshw. Ecosyst. 2019, 29, 1996–2009. [Google Scholar] [CrossRef]
- Ratnasingham, S.; Hebert, P.D.N. Bold: The barcode of life data system (www.barcodinglife.org). Mol. Ecol. Notes 2007, 7, 355–364. [Google Scholar] [CrossRef]


| Taxonomic Group | Phylum | Class | Order | Family | Genus | Species | Total |
|---|---|---|---|---|---|---|---|
| Annelida | 1 | 2 | 4 | 7 | 12 | 16 | 42 |
| Arthropoda | 1 | 8 | 31 | 102 | 126 | 116 | 384 |
| Ascomycota | 1 | 3 | 2 | 4 | 2 | 3 | 15 |
| Bacillariophyta | 1 | 2 | 4 | 5 | 3 | 6 | 21 |
| Basidiomycota | 1 | 1 | 2 | 2 | 1 | 1 | 8 |
| Bryozoa | 1 | 1 | 1 | 1 | 1 | 1 | 6 |
| Chordata | 1 | 5 | 14 | 21 | 22 | 21 | 84 |
| Ciliophora | 1 | 1 | 1 | 1 | 1 | 1 | 6 |
| Cnidaria | 1 | 3 | 10 | 25 | 25 | 24 | 88 |
| Discosea | 1 | 1 | 3 | 4 | 6 | 18 | 33 |
| Echinodermata | 1 | 4 | 6 | 9 | 10 | 8 | 38 |
| Evosea | 1 | 1 | 1 | 1 | 2 | 2 | 8 |
| Gastrotricha | 1 | 0 | 1 | 1 | 1 | 1 | 5 |
| Heterolobosea | 1 | 0 | 0 | 1 | 1 | 0 | 3 |
| Mollusca | 1 | 2 | 10 | 24 | 28 | 26 | 91 |
| Mucoromycota | 1 | 1 | 1 | 1 | 1 | 0 | 5 |
| Nematoda | 1 | 1 | 2 | 3 | 3 | 2 | 12 |
| Nemertea | 1 | 2 | 2 | 2 | 2 | 2 | 11 |
| Ochrophyta | 1 | 3 | 9 | 17 | 41 | 66 | 137 |
| Onychophora | 1 | 1 | 1 | 2 | 2 | 2 | 9 |
| Oomycota | 1 | 2 | 4 | 5 | 12 | 96 | 120 |
| Porifera | 1 | 2 | 5 | 8 | 5 | 5 | 26 |
| Rhodophyta | 1 | 2 | 15 | 32 | 55 | 71 | 176 |
| Rotifera | 1 | 2 | 2 | 8 | 12 | 29 | 54 |
| Streptophyta | 1 | 1 | 2 | 2 | 2 | 1 | 9 |
| Tubulinea | 1 | 1 | 1 | 1 | 4 | 4 | 12 |
| Environmental Sample | Simpson D | Simpson I | Simpson R | Shannon | Evenness |
|---|---|---|---|---|---|
| Water | 0.188 | 0.812 | 5.318 | 2.025 | 0.730 |
| Sediment | 0.181 | 0.819 | 5.522 | 2.130 | 0.689 |
Publisher’s Note: MDPI stays neutral with regard to jurisdictional claims in published maps and institutional affiliations. |
© 2020 by the authors. Licensee MDPI, Basel, Switzerland. This article is an open access article distributed under the terms and conditions of the Creative Commons Attribution (CC BY) license (http://creativecommons.org/licenses/by/4.0/).
Share and Cite
Webster, H.J.; Emami-Khoyi, A.; van Dyk, J.C.; Teske, P.R.; Jansen van Vuuren, B. Environmental DNA Metabarcoding as a Means of Estimating Species Diversity in an Urban Aquatic Ecosystem. Animals 2020, 10, 2064. https://doi.org/10.3390/ani10112064
Webster HJ, Emami-Khoyi A, van Dyk JC, Teske PR, Jansen van Vuuren B. Environmental DNA Metabarcoding as a Means of Estimating Species Diversity in an Urban Aquatic Ecosystem. Animals. 2020; 10(11):2064. https://doi.org/10.3390/ani10112064
Chicago/Turabian StyleWebster, Heather J., Arsalan Emami-Khoyi, Jacobus C. van Dyk, Peter R. Teske, and Bettine Jansen van Vuuren. 2020. "Environmental DNA Metabarcoding as a Means of Estimating Species Diversity in an Urban Aquatic Ecosystem" Animals 10, no. 11: 2064. https://doi.org/10.3390/ani10112064
APA StyleWebster, H. J., Emami-Khoyi, A., van Dyk, J. C., Teske, P. R., & Jansen van Vuuren, B. (2020). Environmental DNA Metabarcoding as a Means of Estimating Species Diversity in an Urban Aquatic Ecosystem. Animals, 10(11), 2064. https://doi.org/10.3390/ani10112064