
Differentiation of Closely Related Oak-Associated Gram-Negative Bacteria by Label-Free Surface Enhanced Raman Spectroscopy (SERS)


Abstract
:1. Introduction
2. Materials and Methods
2.1. Morphological, Physiological and Biochemical Analysis
2.1.1. Colony Morphology
2.1.2. Biofilm Formation
2.1.3. Carbohydrate Use
2.1.4. Antibiotic Susceptibility
2.2. SERS Analysis
2.2.1. Experimental Set Up for SERS Spectra Acquisition
2.2.2. SERS Substrate Preparation
2.2.3. Bacteria Sample Preparation for SERS
2.2.4. SERS Spectra Acquisition
2.2.5. Multivariate Cluster Analyses
3. Results
3.1. Morphological, Physiological and Biochemical Analysis
3.2. SERS Analysis
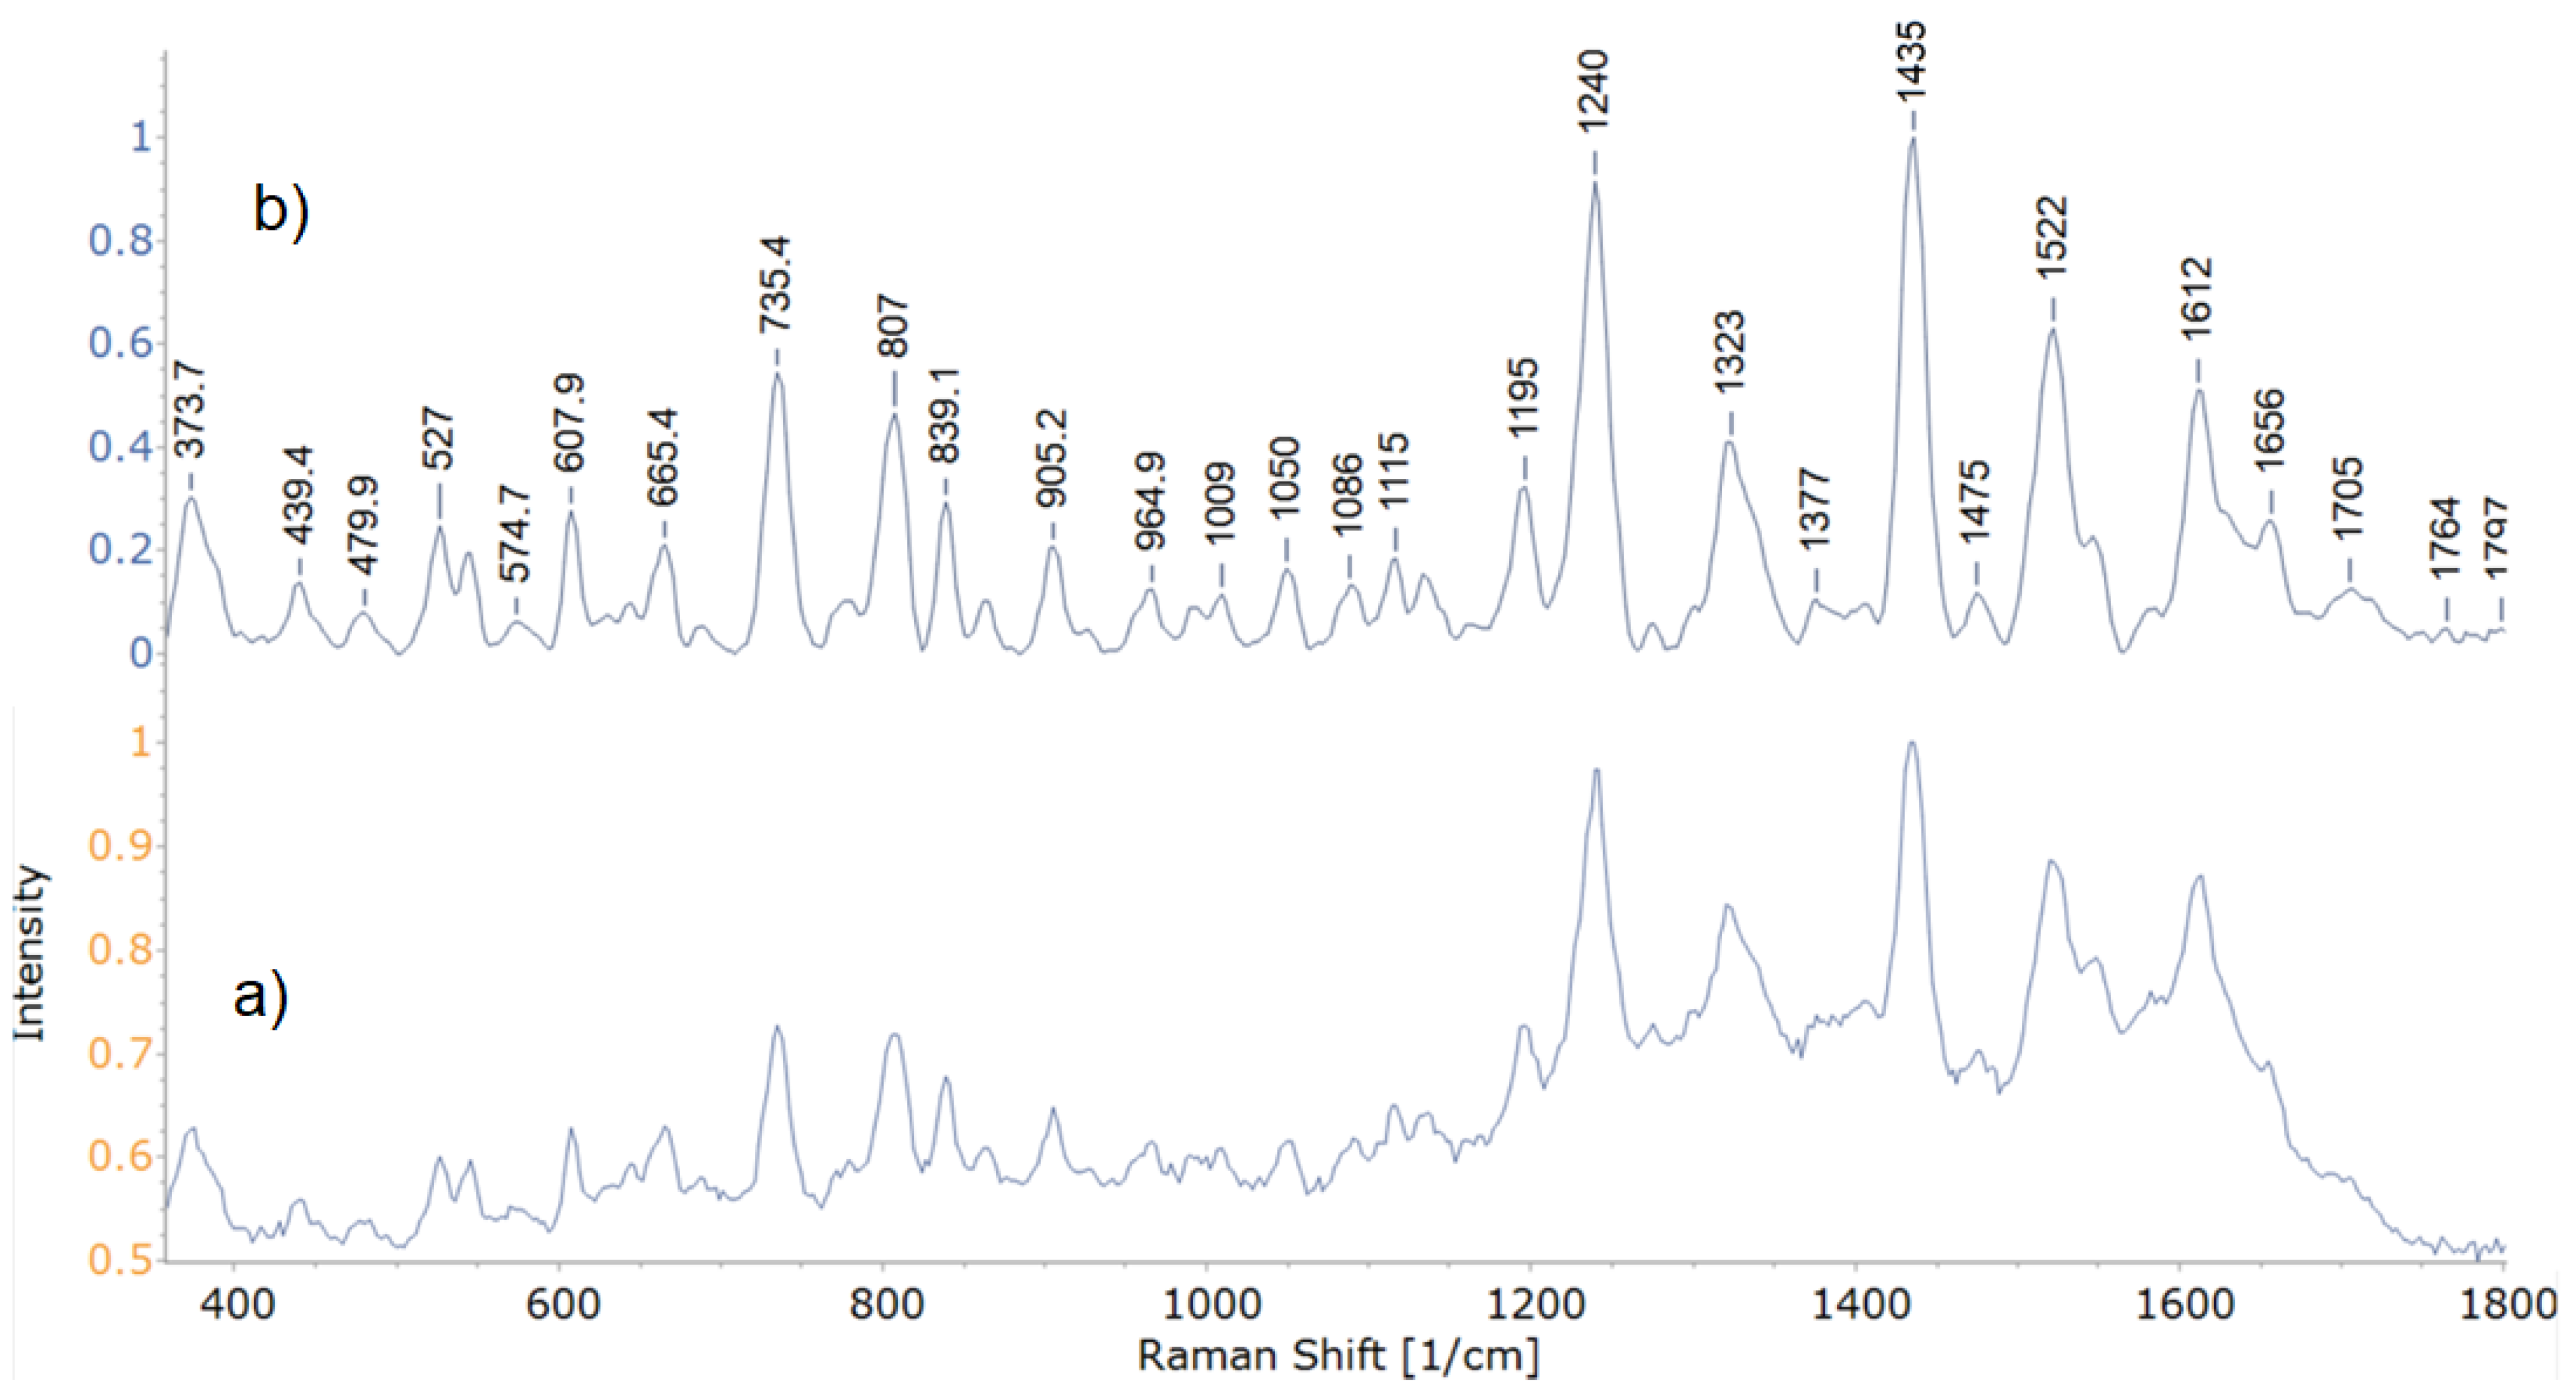
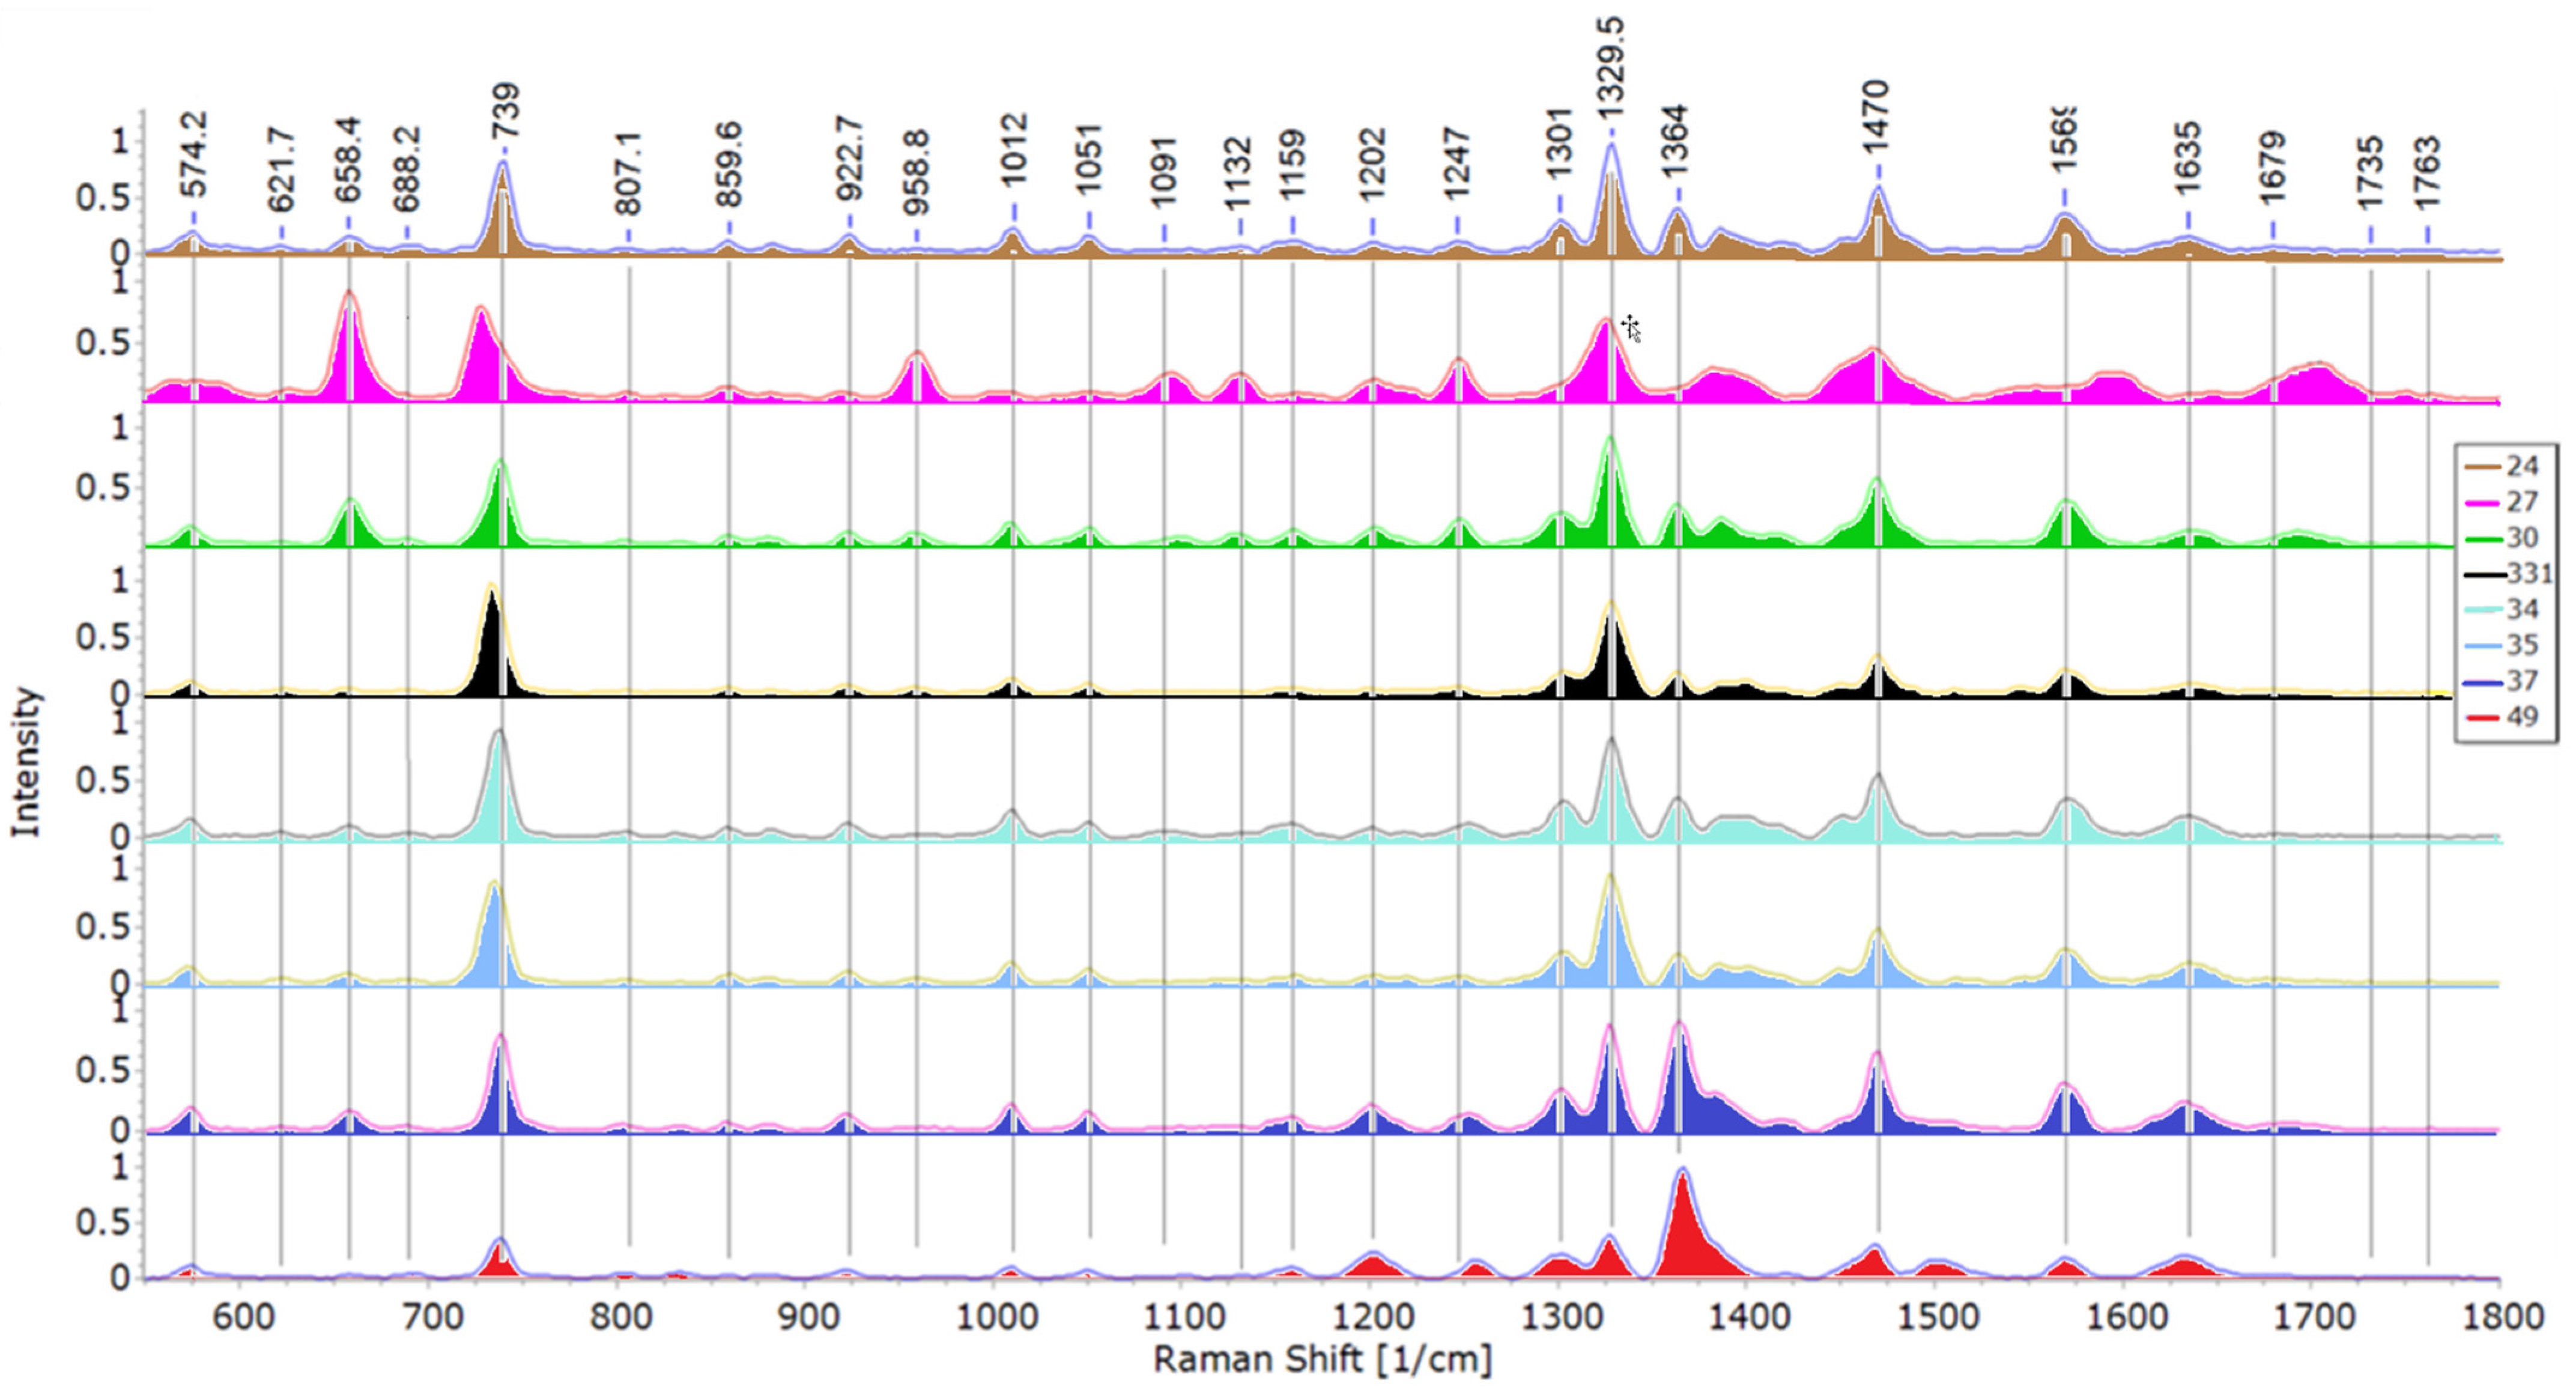
3.2.1. Structural Analysis Based on SERS Spectra
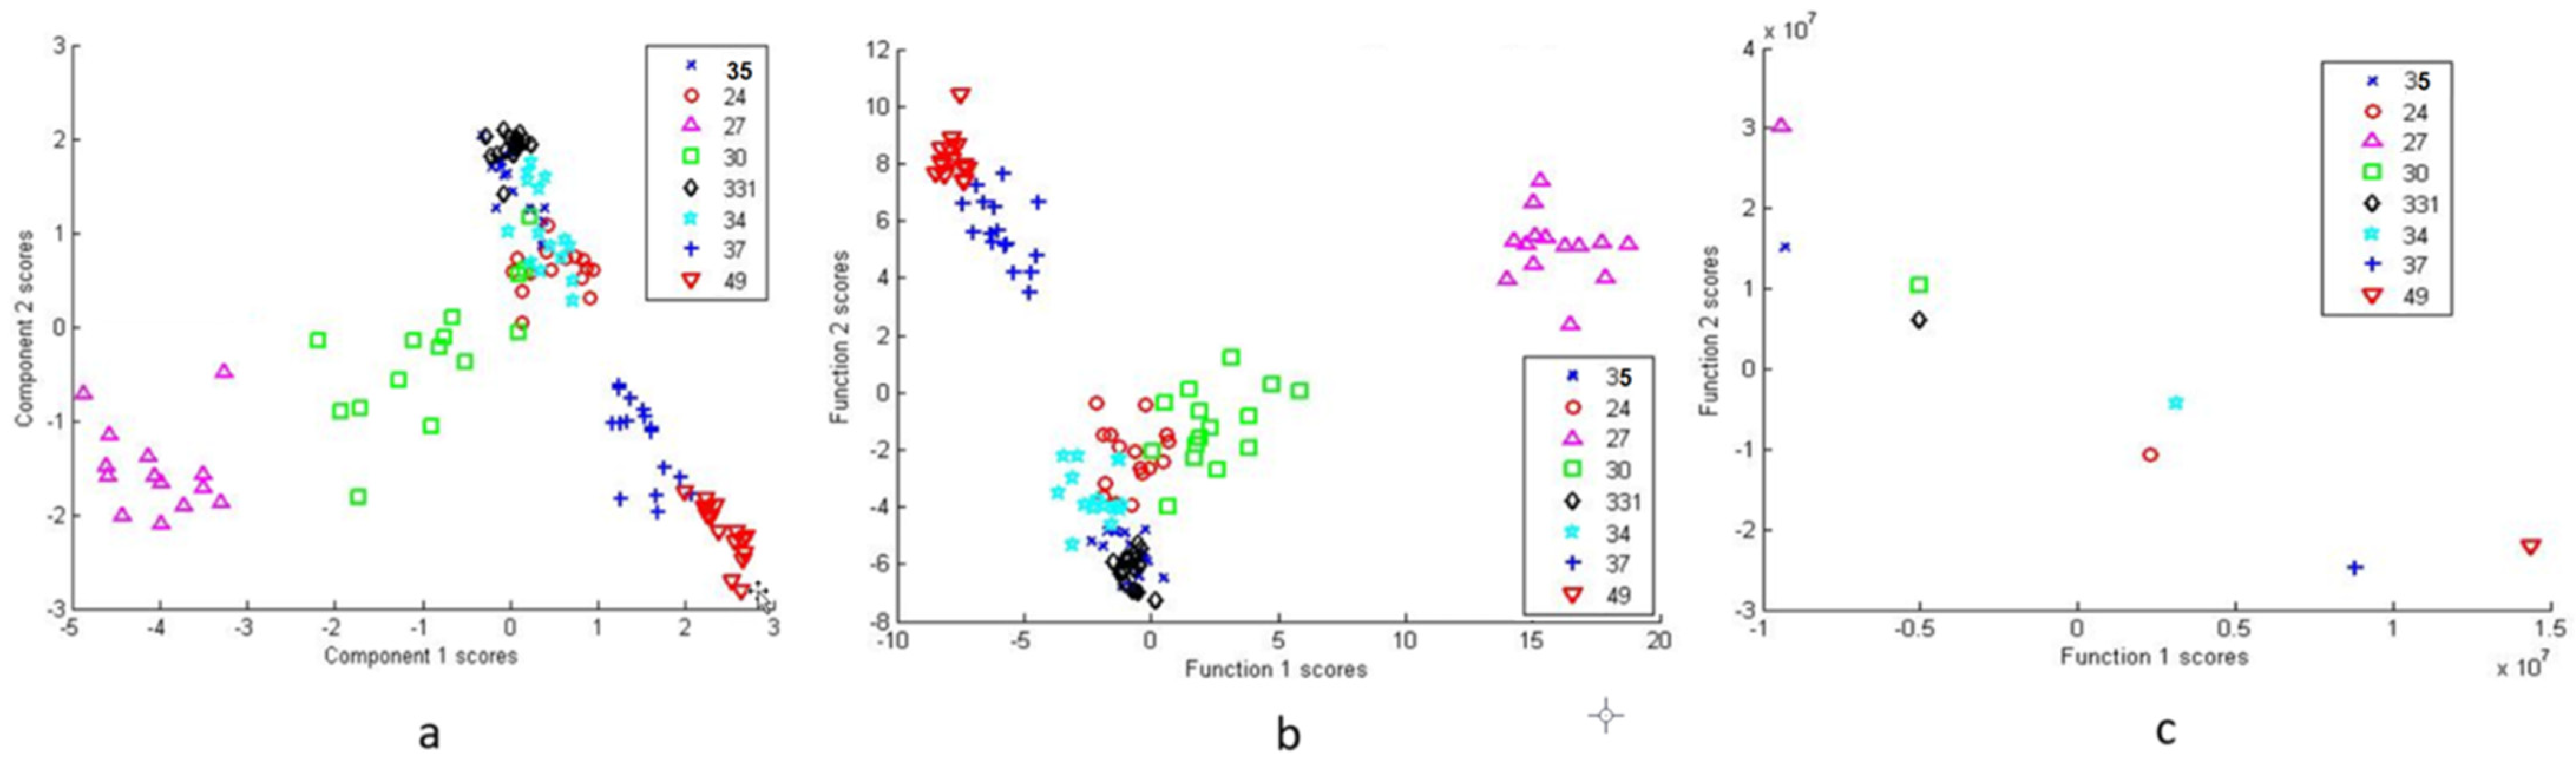
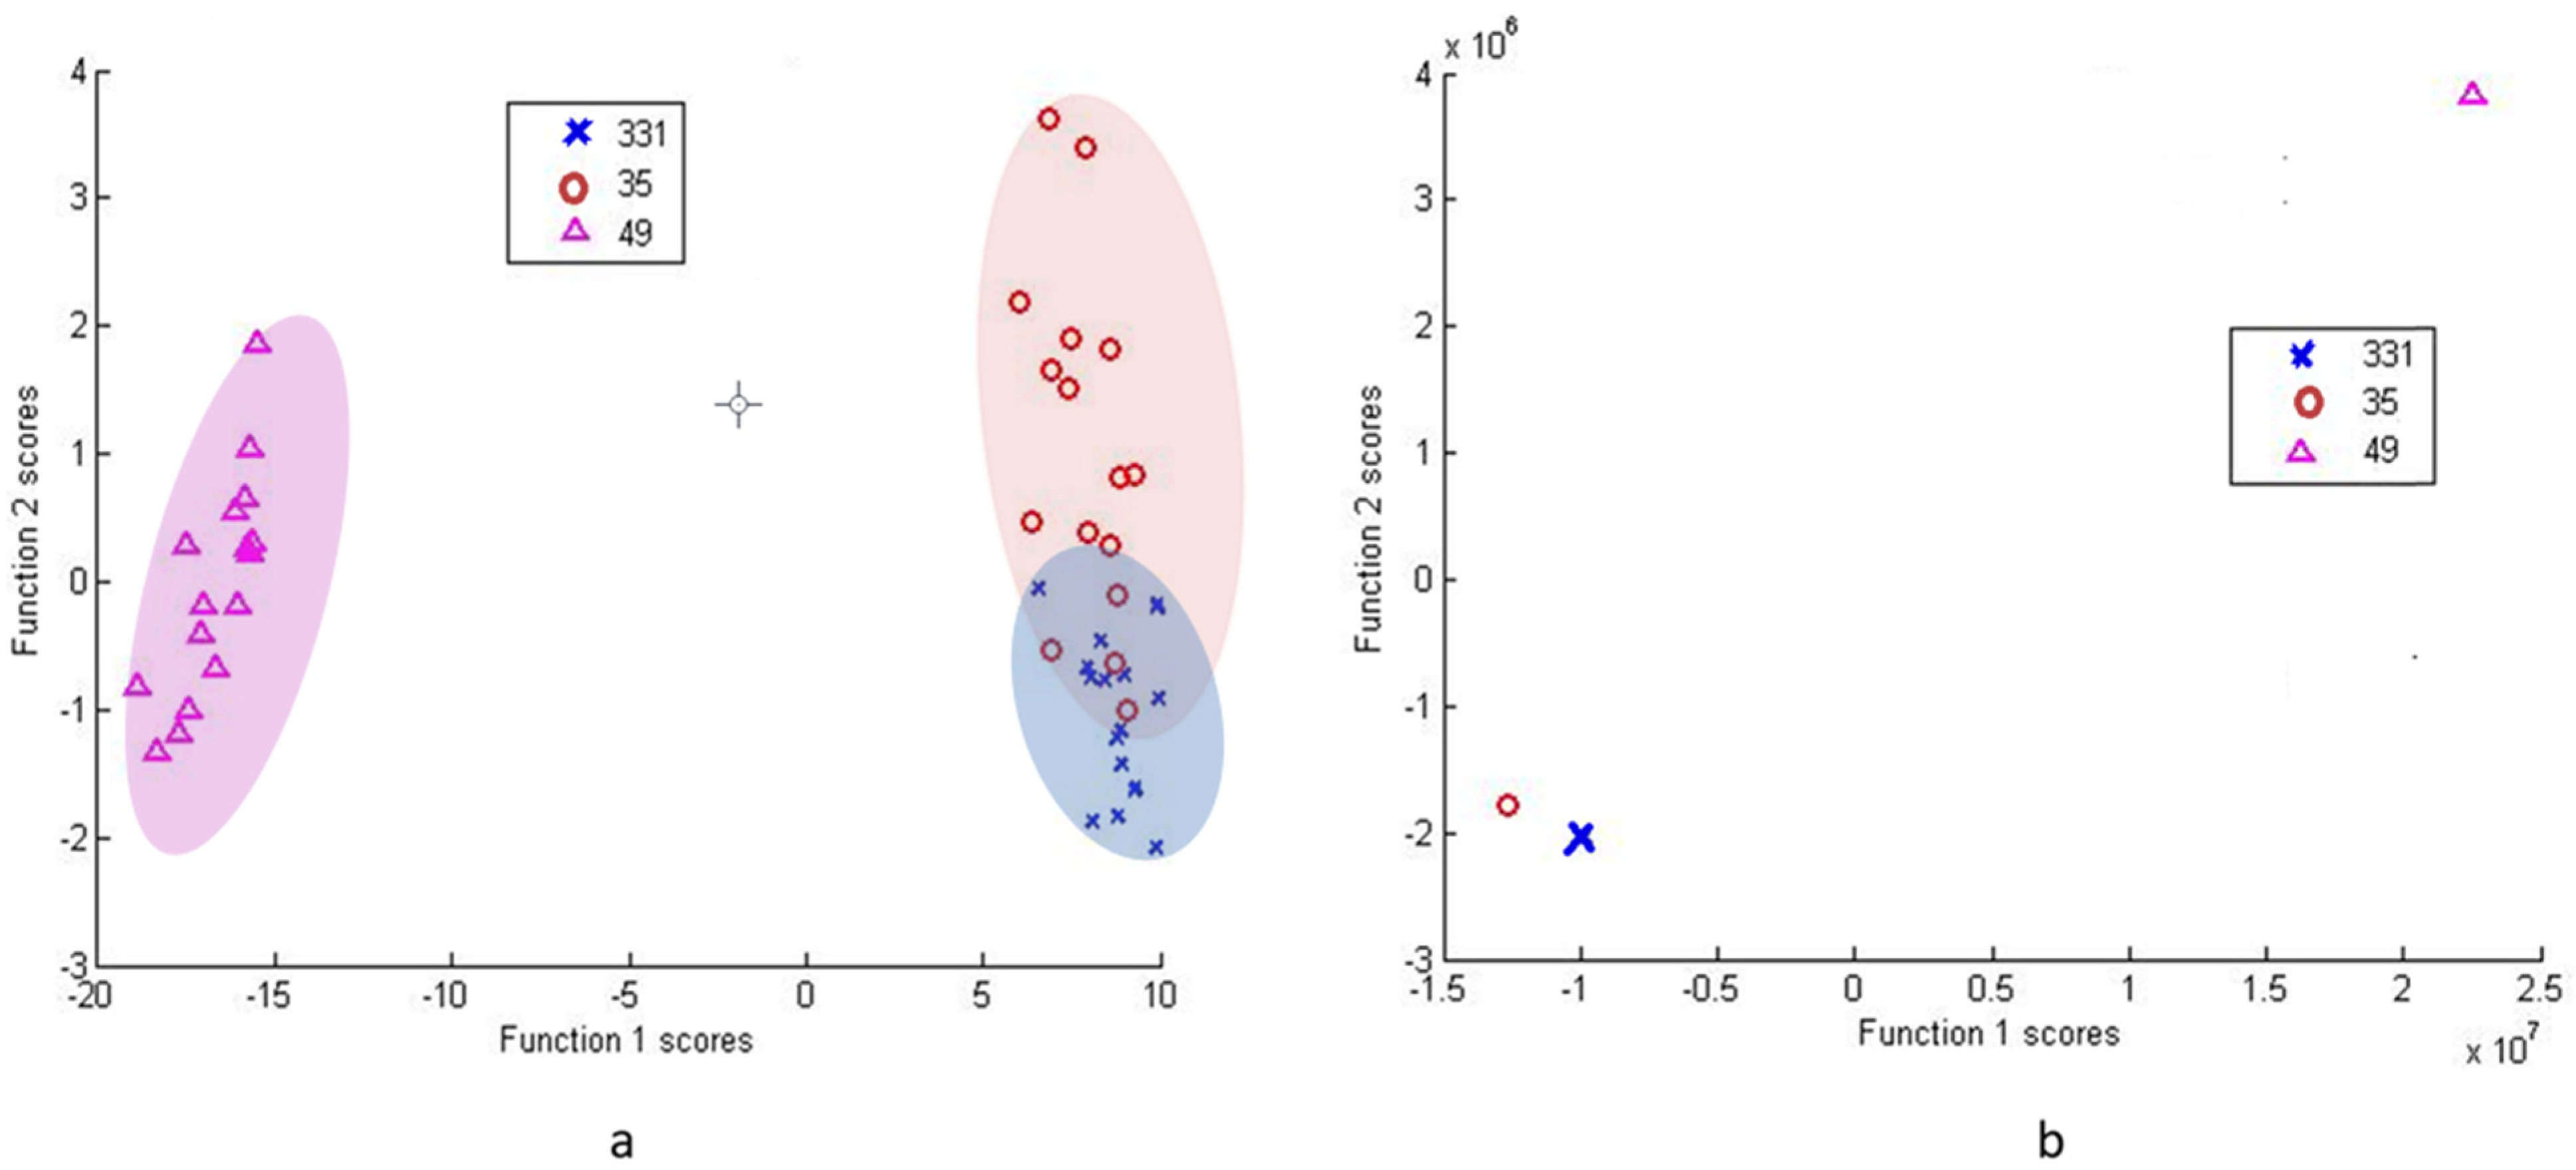
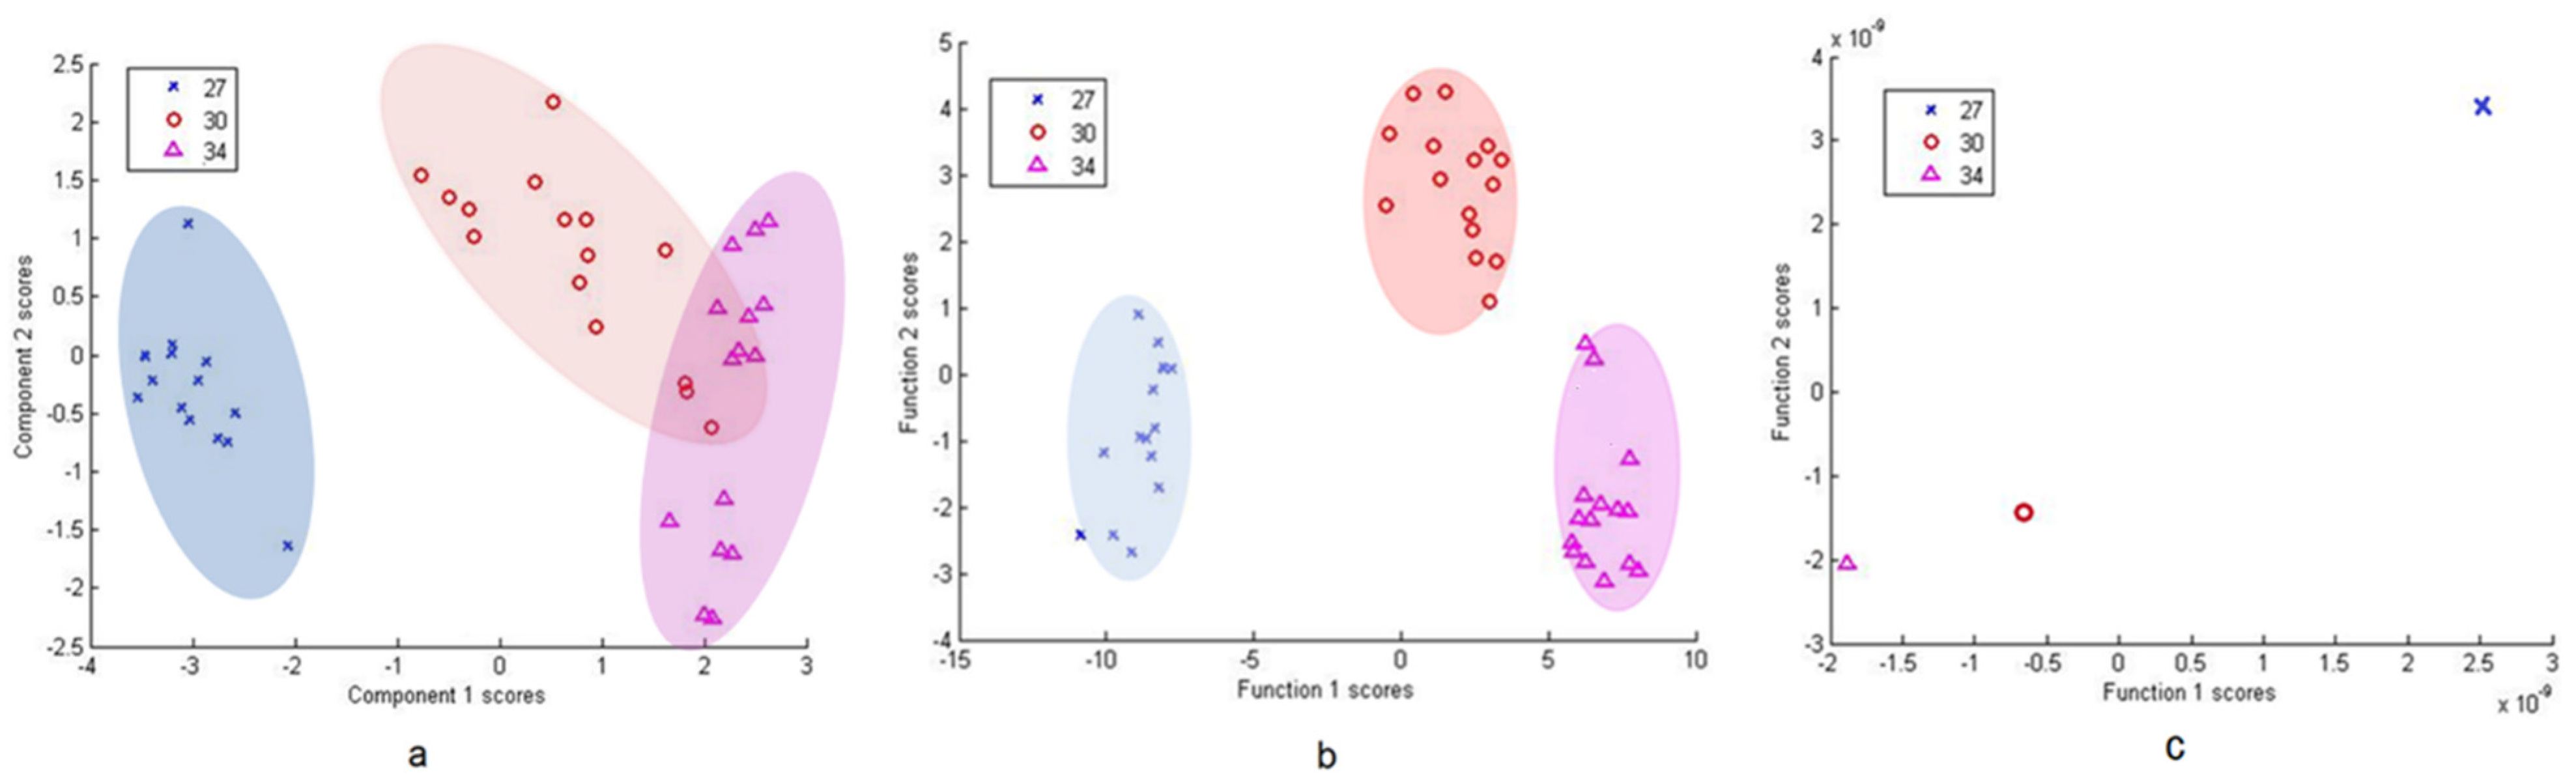
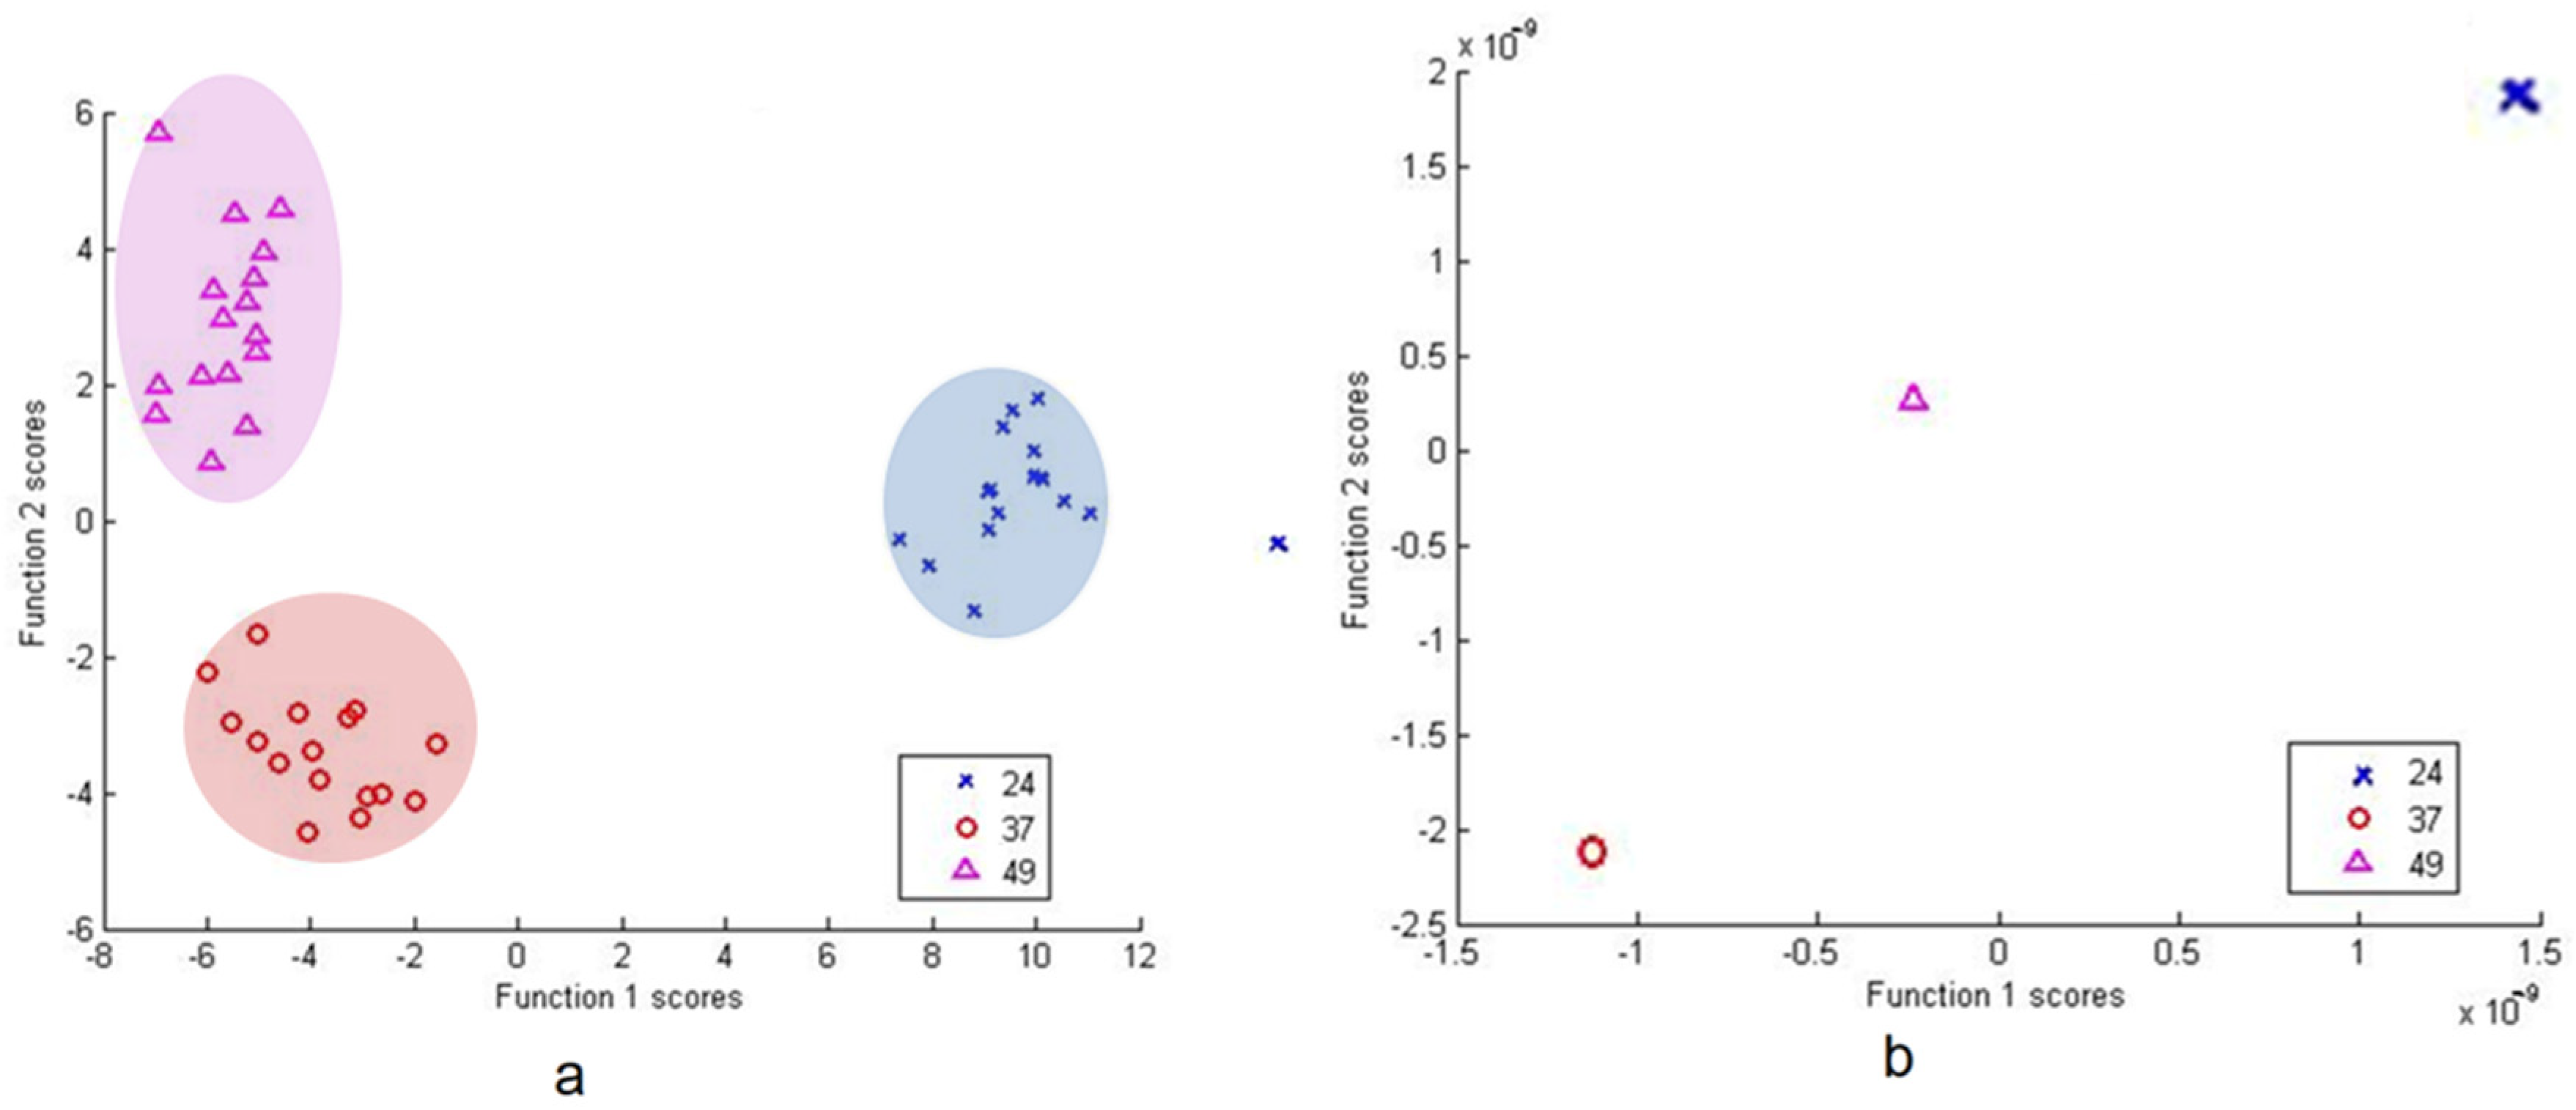
3.2.2. Differentiation via Multivariate Cluster Analyses
4. Discussion
5. Conclusions
Author Contributions
Funding
Institutional Review Board Statement
Informed Consent Statement
Data Availability Statement
Acknowledgments
Conflicts of Interest
References
- Witkowska, E.; Korsak, D.; Kowalska, A.; Księżopolska-Gocalska, M.; Niedziółka-Jönsson, J.; Roźniecka, E.; Michałowicz, W.; Albrycht, P.; Podrażka, M.; Hołyst, R.; et al. Surface-enhanced Raman spectroscopy introduced into the International Standard Organization (ISO) regulations as an alternative method for detection and identification of pathogens in the food industry. Anal. Bioanal Chem. 2017, 409, 1555–1567. [Google Scholar] [CrossRef] [PubMed] [Green Version]
- Ahmad, W.; Wang, J.; Li, H.; Jiao, T.; Chen, Q. Trends in the bacterial recognition patterns used in surface enhanced Raman spectroscopy. TrAC-Trends Anal. Chem. 2021, 142, 116310. [Google Scholar] [CrossRef]
- Chisanga, M.; Muhamadali, H.; Ellis, D.I.; Goodacre, R. Surface-Enhanced Raman Scattering (SERS) in Microbiology: Illumination and Enhancement of the Microbial World. Appl. Spectrosc. 2018, 72, 987–1000. [Google Scholar] [CrossRef] [PubMed]
- Efrima, S.; Zeiri, L. Understanding SERS of bacteria. J. Raman Spectrosc. 2009, 40, 277–288. [Google Scholar] [CrossRef]
- Colniţă, A.; Dina, N.E.; Leopold, N.; Vodnar, D.C.; Bogdan, D.; Porav, S.A.; David, L. Characterization and discrimination of gram-positive bacteria using raman spectroscopy with the aid of principal component analysis. Nanomaterials 2017, 7, 28–31. [Google Scholar] [CrossRef] [PubMed] [Green Version]
- Jarvis, R.; Clarke, S.; Goodacre, R. Rapid analysis of microbiological systems using SERS. Top. Appl. Phys. 2006, 103, 397–408. [Google Scholar] [CrossRef]
- Kairyte, K.; Luksiene, Z.; Pucetaite, M.; Sablinskas, V. Differentiation of bacterial strains by means of surface enhanced ft-raman spectroscopy. Lith. J. Phys. 2012, 52, 276–283. [Google Scholar] [CrossRef]
- Kotanen, C.N.; Martinez, L.; Alvarez, R.; Simecek, J.W. Surface enhanced Raman scattering spectroscopy for detection and identification of microbial pathogens isolated from human serum. Sens. Bio-Sens. Res. 2016, 8, 20–26. [Google Scholar] [CrossRef] [Green Version]
- Dina, N.E.; Zhou, H.; Colniţă, A.; Leopold, N.; Szoke-Nagy, T.; Coman, C.; Haisch, C. Rapid single-cell detection and identification of pathogens by using surface-enhanced Raman spectroscopy. Analyst 2017, 142, 1782–1789. [Google Scholar] [CrossRef]
- Lemma, T.; Saliniemi, A.; Hynninen, V.; Hytönen, V.P.; Toppari, J.J. SERS detection of cell surface and intracellular components of microorganisms using nano-aggregated Ag substrate. Vib. Spectrosc. 2016, 83, 36–45. [Google Scholar] [CrossRef]
- Premasiri, R.; Moir, D.; Jones, G.; Ziegler, L.D. Characterization of the Surface Enhanced Raman Scattering of Bacteria on a Novel Sers Substrate. J. Phys. Chem. B 2005, 109, 312–320. [Google Scholar] [CrossRef]
- De Plano, L.M.; Fazio, E.; Rizzo, M.G.; Franco, D.; Carnazza, S.; Trusso, S.; Neri, F.; Guglielmino, S.P.P. Phage-based assay for rapid detection of bacterial pathogens in blood by Raman spectroscopy. J. Immunol. Methods. 2018, 465, 45–52. [Google Scholar] [CrossRef]
- Yan, Y.; Nie, Y.; An, L.; Tang, Y.Q.; Xu, Z.; Wu, X.L. Improvement of Surface-Enhanced Raman Scattering Method for Single Bacterial Cell Analysis. Front. Bioeng. Biotechnol. 2020, 8, 1–13. [Google Scholar] [CrossRef]
- Zhou, X.; Hu, Z.; Yang, D.; Xie, S.; Jiang, Z.; Niessner, R.; Haisch, C.; Zhou, H.; Sun, P. Bacteria Detection: From Powerful SERS to Its Advanced Compatible Techniques. Adv. Sci. 2020, 7, 1–23. [Google Scholar] [CrossRef]
- Mosier-Boss, P.A. Review on SERS of bacteria. Biosensors 2017, 7, 51. [Google Scholar] [CrossRef] [Green Version]
- Jarvis, R.M.; Brooker, A.; Goodacre, R. Surface-enhanced Raman scattering for the rapid discrimination of bacteria. Faraday Discuss. 2005, 132, 281–292. [Google Scholar] [CrossRef]
- Smith-Palmer, T.; Douglas, C.; Fredericks, P. Rationalizing the SER spectra of bacteria. Vib. Spectrosc. 2010, 53, 103–106. [Google Scholar] [CrossRef] [Green Version]
- Almasoud, N.; Muhamadali, H.; Chisanga, M.; Alrabiah, H.; Lima, C.A.; Goodacre, R. Discrimination of bacteria using whole organism fingerprinting: The utility of modern physicochemical techniques for bacterial typing. Analyst 2021, 146, 770–788. [Google Scholar] [CrossRef] [PubMed]
- Tamer, U.; Torul, H.; Doğan, Ü.; Eryılmaz, M.; Gümüştaş, A.; Boyacı, İ.H.; Özkan, S.A.; Uslu, B. SERS Sensor Applications in Environmental Analysis and Biotechnology. In Nanotechnology Applications in Health and Environmental Sciences; Springer: Cham, Switzerland, 2021; pp. 197–236. [Google Scholar] [CrossRef]
- Liu, Y.; Chen, Y.R.; Nou, X.; Chao, K. Potential of surface-enhanced Raman spectroscopy for the rapid identification of Escherichia Coli and Listeria Monocytogenes cultures on silver colloidal nanoparticles. Appl. Spectrosc. 2007, 61, 824–831. [Google Scholar] [CrossRef]
- Harz, M.; Rösch, P.; Popp, J. Vibrational spectroscopy-A powerful tool for the rapid identification of microbial cells at the single-cell level. Cytom. Part A 2009, 75, 104–113. [Google Scholar] [CrossRef] [PubMed]
- Stöckel, S.; Kirchhoff, J.; Neugebauer, U.; Rösch, P.; Popp, J. The application of Raman spectroscopy for the detection and identification of microorganisms. J. Raman Spectrosc. 2016, 47, 89–109. [Google Scholar] [CrossRef]
- Ashton, L.; Lau, K.; Winder, C.L.; Goodacre, R. Raman spectroscopy: Lighting up the future of microbial identification. Future Microbiol. 2011, 6, 991–997. [Google Scholar] [CrossRef] [PubMed] [Green Version]
- Patel, I.S.; Premasiri, W.R.; Moir, D.T.; Ziegler, L.D. Barcoding bacterial cells: A SERS-based methodology for pathogen identification. J. Raman Spectrosc. 2008, 39, 1660–1672. [Google Scholar] [CrossRef]
- Snitka, V.; Batiuskaite, D.; Bruzaite, I.; Lafont, U.; Butenko, Y.; Semprimoschnig, C. Surface-enhanced Raman scattering sensors for biomedical and molecular detection applications in space. CEAS Sp. J. 2021, 13, 509–520. [Google Scholar] [CrossRef]
- Çulha, M.; Adigüzel, A.; Yazici, M.M.; Kahraman, M.; Şahin, F.; Güllüce, M. Characterization of thermophilic bacteria using surface-enhanced Raman scattering. Appl. Spectrosc. 2008, 62, 1226–1232. [Google Scholar] [CrossRef] [PubMed]
- Franco, D.; De Plano, L.M.; Rizzo, M.G.; Scibilia, S.; Lentini, G.; Fazio, E.; Neri, F.; Guglielmino, S.P.P.; Mezzasalma, A.M. Bio-hybrid gold nanoparticles as SERS probe for rapid bacteria cell identification. Spectrochim. Acta-Part A Mol. Biomol. Spectrosc. 2020, 224, 117394. [Google Scholar] [CrossRef]
- Ho, C.S.; Jean, N.; Hogan, C.A.; Blackmon, L.; Jeffrey, S.S.; Holodniy, M.; Banaei, N.; Saleh, A.A.E.; Ermon, S.; Dionne, J. Rapid identification of pathogenic bacteria using Raman spectroscopy and deep learning. Nat. Commun. 2019, 10, 4927. [Google Scholar] [CrossRef]
- Paret, M.L.; Sharma, S.K.; Green, L.M.; Alvarez, A.M. Biochemical characterization of Gram-positive and Gram-negative plant-associated bacteria with micro-raman spectroscopy. Appl. Spectrosc. 2010, 64, 433–441. [Google Scholar] [CrossRef]
- Polisetti, S.; Bible, A.N.; Morrell-Falvey, J.L.; Bohn, P.W. Raman chemical imaging of the rhizosphere bacterium Pantoea sp. YR343 and its co-culture with Arabidopsis thaliana. Analyst 2016, 141, 2175–2182. [Google Scholar] [CrossRef]
- Kour, D.; Rana, K.L.; Yadav, A.N.; Yadav, N.; Kumar, M.; Kumar, V.; Vyas, P.; Dhaliwal, H.S.; Saxena, A.K. Microbial biofertilizers: Bioresources and eco-friendly technologies for agricultural and environmental sustainability. Biocatal. Agric. Biotechnol. 2020, 23, 101487. [Google Scholar] [CrossRef]
- Pirttilä, A.M.; Mohammad Parast Tabas, H.; Baruah, N.; Koskimäki, J.J. Biofertilizers and Biocontrol Agents for Agriculture: How to Identify and Develop New Potent Microbial Strains and Traits. Microorganisms 2021, 9, 817. [Google Scholar] [CrossRef] [PubMed]
- Fan, D.; Subramanian, S.; Smith, D.L. Plant endophytes promote growth and alleviate salt stress in Arabidopsis thaliana. Sci. Rep. 2020, 10, 12740. [Google Scholar] [CrossRef] [PubMed]
- Takikawa, Y. Studies on identification and taxonomy of plant pathogenic bacteria. J. Gen. Plant. Pathol. 2012, 78, 409–412. [Google Scholar] [CrossRef]
- Vaitiekūnaitė, D.; Kuusienė, S.; Beniušytė, E. Oak (Quercus robur) Associated Endophytic Paenibacillus sp. Promotes Poplar (Populus spp.) Root Growth In Vitro. Microorganisms 2021, 9, 1151. [Google Scholar] [CrossRef]
- Oukala, N.; Aissat, K.; Pastor, V. Bacterial endophytes: The hidden actor in plant immune responses against biotic stress. Plants 2021, 10, 1012. [Google Scholar] [CrossRef]
- Hardoim, P.R.; van Overbeek, L.S.; Berg, G.; Pirttilä, A.M.; Compant, S.; Campisano, S.; Döring, M.; Sessitsch, A. The Hidden World within Plants: Ecological and Evolutionary Considerations for Defining Functioning of Microbial Endophytes. Microbiol. Mol. Biol Rev. 2015, 79, 293–320. [Google Scholar] [CrossRef] [Green Version]
- Bueno-Gonzalez, V.; Brady, C.; Denman, S.; Allainguillaume, J.; Arnold, D. Pseudomonas kirkiae sp. Nov., a novel species isolated from oak in the united kingdom, and phylogenetic considerations of the genera pseudomonas, azotobacter and azomonas. Int. J. Syst. Evol. Microbiol. 2020, 70, 2426–2434. [Google Scholar] [CrossRef]
- Govindasamy, V.; Raina, S.K.; George, P.; Kumar, M.; Rane, J.; Minhas, P.S.; Vittal, K.P.R. Functional and phylogenetic diversity of cultivable rhizobacterial endophytes of sorghum [Sorghum bicolor (L.) Moench]. Antonie Leeuwenhoek 2017, 110, 925–943. [Google Scholar] [CrossRef]
- Compant, S.; Mitter, B.; Colli-Mull, J.G.; Gangl, H.; Sessitsch, A. Endophytes of Grapevine Flowers, Berries, and Seeds: Identification of Cultivable Bacteria, Comparison with Other Plant Parts, and Visualization of Niches of Colonization. Microb. Ecol. 2011, 62, 188–197. [Google Scholar] [CrossRef]
- Premasiri, W.R.; Moir, D.T.; Ziegler, L.D. Vibrational fingerprinting of bacterial pathogens by surface enhanced Raman scattering (SERS). Chem. Biol. Sens. VI 2005, 5795, 19. [Google Scholar] [CrossRef]
- Tamošiūnė, I.; Stanienė, G.; Haimi, P.; Stanys, V.; Rugienius, R.; Baniulis, D. Endophytic Bacillus and Pseudomonas spp. Modulate Apple Shoot Growth, Cellular Redox Balance, and Protein Expression Under in Vitro Conditions. Front. Plant. Sci. 2018, 9, 889. [Google Scholar] [CrossRef] [PubMed] [Green Version]
- Mohamed, A.; Mhand Rajaa, A.; Khalid, Z.; Fouad, M.; Naima, R. Comparison of Three Methods for the Detection of Biofilm Formation by Clinical Isolates of Staphylococcus aureus Isolated in Casablanca. Int. J. Sci. Res. 2013, 5, 2319–7064. [Google Scholar] [CrossRef]
- Johnson, T.R.; Case, C.L. Laboratory Experiments in Microbiology, 11th ed.; Pearson: London, UK, 2015. [Google Scholar]
- Bauer, A.W.; Kirby, W.M.; Sherris, J.C.; Turck, M. Antibiotic susceptibility testing by a standardized single disk method. Am. J. Clin. Pathol. 1966, 45, 493–496. [Google Scholar] [CrossRef]
- Sarker, M.M.R.; Islam, K.N.; Huri, H.Z.; Rahman, M.; Imam, H.; Hosen, M.B.; Mohammad, N.; Sarker, M.Z.I. Studies of the impact of occupational exposure of pharmaceutical workers on the development of antimicrobial drug resistance. J. Occup. Health 2014, 56, 260–270. [Google Scholar] [CrossRef] [Green Version]
- Abdelaziz, E.; Ramadan, H.; Rasha, B.; Shadi, S.; Wael, E.-N. Antimicrobial susceptibility and sodium dodecyl sulfate polyacrylamide gel electrophoresis (SDS-PAGE) typing of Gram negative bacteria isolated from urinary tract infections in Mansoura, Egypt. J. Microbiol. Antimicrob. 2014, 6, 43–50. [Google Scholar] [CrossRef] [Green Version]
- Fouad, Z. Antimicrobial Disk Diffusion Zone Interpretation Guide. 2011. [Google Scholar] [CrossRef]
- Ramanauskaite, L.; Snitka, V. Surface enhanced Raman spectroscopy of l-alanyl-l-tryptophan dipeptide adsorbed on Si substrate decorated with triangular silver nanoplates. Chem. Phys. Lett. 2015, 623, 46–50. [Google Scholar] [CrossRef]
- Premasiri, W.R.; Lee, J.C.; Sauer-Budge, A.; Théberge, R.; Costello, C.E.; Ziegler, L.D. The biochemical origins of the surface-enhanced Raman spectra of bacteria: A metabolomics profiling by SERS. Anal. Bioanal. Chem. 2016, 408, 4631–4647. [Google Scholar] [CrossRef] [Green Version]
- Available online: https://www.effemm2.de/spectragryph/ (accessed on 9 August 2021).
- Reisner, L.A.; Cao, A.; Pandya, A.K. An integrated software system for processing, analyzing, and classifying Raman spectra. Chemom. Intell. Lab. Syst. 2011, 105, 83–90. [Google Scholar] [CrossRef]
- Kurochkin, I.N.; Eremenko, A.V.; Evtushenko, E.G.; Nechaeva, N.L.; Durmanov, N.N.; Guliev, R.R.; Lagarkov, A.N. SERS for Bacteria, Viruses, and Protein Biosensing. In Macro, Micro, and Nano-Biosensors; Rai, M., Reshetilov, A., Plekhanova, Y., Ingle, A.P., Eds.; Springer: Cham, Switzerland, 2021. [Google Scholar] [CrossRef]
- De Gelder, J.; De Gussem, K.; Vandenabeele, P.; Moens, L. Reference database of Raman spectra of biological molecules. J. Raman Spectrosc. 2007, 38, 1133–1147. [Google Scholar] [CrossRef]
- Czamara, K.; Majzner, K.; Pacia, M.Z.; Kochan, K.; Kaczor, A.; Baranska, M. Raman spectroscopy of lipids: A review. J. Raman Spectrosc. 2015, 46, 4–20. [Google Scholar] [CrossRef]
- Movasaghi, Z.; Rehman, S.; Rehman, I.U. Raman spectroscopy of biological tissues. Appl. Spectrosc. Rev. 2007, 42, 493–541. [Google Scholar] [CrossRef]
- Podstawka, E.; Ozaki, Y.; Proniewicz, L.M. Adsorption of S-S containing proteins on a colloidal silver surface studied by surface-enhanced Raman spectroscopy. Appl. Spectrosc. 2004, 58, 1147–1156. [Google Scholar] [CrossRef] [PubMed]
- Tian, H.; Zhuang, G.; Ma, A.; Jing, C. Arsenic interception by cell wall of bacteria observed with surface-enhanced Raman scattering. J. Microbiol. Methods. 2012, 89, 153–158. [Google Scholar] [CrossRef] [PubMed]
- Su, L.; Zhang, P.; Zheng, D.; Wang, Y.; Zhong, R. Rapid detection of Escherichia coli and Salmonella typhimurium by surface-enhanced Raman scattering. Optoelectron. Lett. 2015, 11, 157–160. [Google Scholar] [CrossRef]
- Otto, C.; van den Tweel, T.J.J.; de Mul, F.F.M.; Greve, J. Surface-enhanced Raman spectroscopy of DNA bases. J. Raman Spectrosc. 1986, 17, 289–298. [Google Scholar] [CrossRef] [Green Version]
- Kögler, M.; Paul, A.; Anane, E.; Birkholz, M.; Bunker, A.; Viitala, T.; Maiwald, M.; Junne, S.; Neubauer, P. Comparison of time-gated surface-enhanced raman spectroscopy (TG-SERS) and classical SERS based monitoring of Escherichia coli cultivation samples. Biotechnol. Prog. 2018, 34, 1533–1542. [Google Scholar] [CrossRef] [PubMed]
- Li, J.; Wang, C.; Kang, H.; Shao, L.; Hu, L.; Xiao, R.; Wang, S.; Gu, B. Label-free identification carbapenem-resistant Escherichia coli based on surface-enhanced resonance Raman scattering. RSC Adv. 2018, 8, 4761–4765. [Google Scholar] [CrossRef] [Green Version]
- Yang, D.; Zhou, H.; Dina, N.E.; Haisch, C. Portable bacteria-capturing chip for direct surfaceenhanced Raman scattering identification of urinary tract infection pathogens. R. Soc. Open Sci. 2018, 5, 180955. [Google Scholar] [CrossRef] [Green Version]
- Meng, X.; Wang, H.; Chen, N.; Ding, P.; Shi, H.; Zhai, X.; Su, Y.; He, Y. A Graphene-Silver Nanoparticle-Silicon Sandwich SERS Chip for Quantitative Detection of Molecules and Capture, Discrimination, and Inactivation of Bacteria. Anal. Chem. 2018, 90, 5646–5653. [Google Scholar] [CrossRef] [PubMed]
- Xie, Y.; Xu, L.; Wang, Y.; Shao, J.; Wang, L.; Wang, H.; Qian, H.; Yao, W. Label-free detection of the foodborne pathogens of Enterobacteriaceae by surface-enhanced Raman spectroscopy. Anal. Methods 2013, 5, 946–952. [Google Scholar] [CrossRef]
- Wei, C.; Li, M.; Zhao, X. Surface-enhanced raman scattering (SERS) with silver nano substrates synthesized by microwave for rapid detection of foodborne pathogens. Front. Microbiol. 2018, 9, 1–9. [Google Scholar] [CrossRef] [PubMed]
- Walter, A.; März, A.; Schumacher, W.; Rösch, P.; Popp, J. Towards a fast, high specific and reliable discrimination of bacteria on strain level by means of SERS in a microfluidic device. Lab. Chip. 2011, 11, 1013–1021. [Google Scholar] [CrossRef]
- Rastogi, S.K.; Jabal JM, F.; Zhang, H.; Gibson, C.M.; Haler, K.J.; Qiang, Y.; Branen, A.L. Antibody@silica coated iron oxide nanoparticles: Synthesis, capture of E. coli and SERS titration of biomolecules with antibacterial silver colloid. J. Nanomed. Nanotechnol. 2011, 2, 1000121. [Google Scholar] [CrossRef]
- Cozar, I.B.; Colniţă, A.; Szöke-Nagy, T.; Gherman, A.M.R.; Dina, N.E. Label-Free Detection of Bacteria Using Surface-Enhanced Raman Scattering and Principal Component Analysis. Anal. Lett. 2019, 52, 177–189. [Google Scholar] [CrossRef]
- Mungroo, N.A.; Oliveira, G.; Neethirajan, S. SERS based point-of-care detection of food-borne pathogens. Microchim. Acta 2016, 183, 697–707. [Google Scholar] [CrossRef]
- Ahmed, M.; Almagedi, S.; Yao, W. Sers Signatures of Foodborne Pathogenic Zoonotic Bacteria Using Gold Colloid. Int. J. Eng. Sci. Technol. 2013, 5, 810–821. [Google Scholar]
- Fan, C.; Hu, Z.; Mustapha, A.; Lin, M. Rapid detection of food- and waterborne bacteria using surface-enhanced Raman spectroscopy coupled with silver nanosubstrates. Appl. Microbiol. Biotechnol. 2011, 92, 1053–1061. [Google Scholar] [CrossRef]
- Jin, H.; Wang, J.; Jin, S.; Jiang, L.; Zou, Y. Raman spectroscopy of potential bio-hazards commonly found in bio-aerosols. Spectrochim. Acta-Part A Mol. Biomol. Spectrosc. 2020, 243, 118753. [Google Scholar] [CrossRef]
- Alula, M.T.; Krishnan, S.; Hendricks, N.R.; Karamchand, L.; Blackburn, J.M. Identification and quantitation of pathogenic bacteria via in-situ formation of silver nanoparticles on cell walls, and their detection via SERS. Microchim. Acta 2017, 184, 219–227. [Google Scholar] [CrossRef]
- Huang, H.; Liu, M.; Wang, X.; Zhang, W.; Yang, D.-P.; Cui, L.; Wang, X. Label-Free 3D Ag Nanoflower-Based Electrochemical Immunosensor for the Detection of Escherichia coli O157:H7 Pathogens. Nanoscale Res. Lett. 2016, 11, 507. [Google Scholar] [CrossRef] [PubMed] [Green Version]
- Uusitalo, S.; Kögler, M.; Välimaa, A.L.; Popov, A.; Ryabchikov, Y.; Kontturi, Y.; Siitonen, S.; Petäjä, J.; Virtanen, T.; Laitinen, R.; et al. Detection of: Listeria innocua on roll-to-roll produced SERS substrates with gold nanoparticles. RSC Adv. 2016, 6, 62981–62989. [Google Scholar] [CrossRef] [Green Version]
- Pérez, M.; Contreras, H.; Sosa Herrera, J.A.; Ávila, J.; Tobías, H.; Martínez, F.D.; Ramírez, R.F.; Vázquez, Á. Detection of clavibacter michiganensis subsp. Michiganensis assisted by micro-raman spectroscopy under laboratory conditions. Plant. Pathol. J. 2018, 34, 381–392. [Google Scholar] [CrossRef] [PubMed]
- Liu, S.; Li, H.; Hassan, M.M.; Zhu, J.; Wang, A.; Ouyang, Q.; Zareef, M.; Chen, Q. Amplification of Raman spectra by gold nanorods combined with chemometrics for rapid classification of four Pseudomonas. Int. J. Food Microbiol. 2019, 304, 58–67. [Google Scholar] [CrossRef] [PubMed]
- Kashif, M.; Irfan Majeed, M.; Nawaz, H.; Rashid, N.; Abubakar, M.; Ahmad, S.; Ali, S.; Hyat, H.; Bashir, S.; Batool, F.; et al. Surface-enhanced Raman spectroscopy for identification of food processing bacteria. Spectrochim. Acta. Part A Mol. Biomol. Spectrosc. 2021, 261, 119989. [Google Scholar] [CrossRef]
- Lamrabet, O.; Martin, M.; Lenski, R.E.; Schneider, D. Changes in intrinsic antibiotic susceptibility during a long-term evolution experiment with escherichia coli. MBio 2019, 10, 1–12. [Google Scholar] [CrossRef] [Green Version]
- Blount, Z.D.; Borland, C.Z.; Lenski, R.E. Historical contingency and the evolution of a key innovation in an experimental population of Escherichia coli. Proc. Natl. Acad. Sci. USA 2008, 105, 7899–7906. [Google Scholar] [CrossRef] [Green Version]
- Ramey, B.E.; Koutsoudis, M.; Bodman, S.B.V.; Fuqua, C. Biofilm formation in plant-microbe associations. Curr. Opin. Microbiol. 2004, 7, 602–609. [Google Scholar] [CrossRef] [Green Version]
- Bodelón, G.; Montes-garcía, V.; López-puente, V.; Hill, E.H.; Hamon, C.; Sanz-Ortiz, M.N.; Rodal-Cedeira, S.; Costas, C.; Celiksoy, S.; Pérez-Juste, I.; et al. Detection and imaging of quorum sensing in Pseudomonas aeruginosa biofilm communities by surface-enhanced resonance Raman scattering. Nat. Mater. 2017, 15, 1203–1211. [Google Scholar] [CrossRef] [Green Version]
- Schkolnik, G.; Schmidt, M.; Mazza, M.G.; Harnisch, F.; Musat, N. In situ analysis of a silver nanoparticle-precipitating Shewanella biofilm by surface enhanced confocal raman microscopy. PLoS ONE 2015, 10, 7–12. [Google Scholar] [CrossRef] [Green Version]
- Baig, N.; Polisetti, S.; Morales-Soto, N.; Dunham, S.J.B.; Sweedler, J.V.; Shrout, J.D.; Bohn, P.W. Label-free molecular imaging of bacterial communities of the opportunistic pathogen Pseudomonas aeruginosa. Biosensing Nanomed. IX 2016, 9930, 993004. [Google Scholar] [CrossRef] [Green Version]
- Szymańska, E.; Gerretzen, J.; Engel, J.; Geurts, B.; Blanchet, L.; Buydens, L.M.C. Chemometrics and qualitative analysis have a vibrant relationship. TrAC-Trends Anal. Chem. 2015, 69, 34–51. [Google Scholar] [CrossRef]
- Jolliffe, I.T. Principal Component Analysis. In Encyclopedia of Statistics in Behavioral Science, 2nd ed.; Everitt, B.S., Howell, D.C., Eds.; Springer: NewYork, NY, USA, 2002; Volume 30, p. 487. [Google Scholar] [CrossRef]
- Guo, S.; Rösch, P.; Popp, J.; Bocklitz, T. Modified PCA and PLS: Towards a better classification in Raman spectroscopy–based biological applications. J. Chemom. 2020, 34, 1–10. [Google Scholar] [CrossRef] [Green Version]
- Witkowska, E.; Korsak, D.; Kowalska, A.; Janeczek, A.; Kamińska, A. Strain-level typing and identification of bacteria–a novel approach for SERS active plasmonic nanostructures. Anal. Bioanal. Chem. 2018, 410, 5019–5031. [Google Scholar] [CrossRef] [PubMed] [Green Version]
- Kubryk, P.; Niessner, R.; Ivleva, N.P. The origin of the band at around 730 cm-1 in the SERS spectra of bacteria: A stable isotope approach. Analyst 2016, 141, 2874–2878. [Google Scholar] [CrossRef] [Green Version]
- Brauer, M.J.; Yuan, J.; Bennett, B.D.; Lu, W.; Kimball, E.; Botstein, D.; Rabinowitz, J.D. Conservation of the metabolomic response to starvation across two divergent microbes. Proc. Natl. Acad. Sci. USA 2006, 103, 19302–19307. [Google Scholar] [CrossRef] [Green Version]
- Link, H.; Fuhrer, T.; Gerosa, L.; Zamboni, N.; Sauer, U. Real-time metabolome profiling of the metabolic switch between starvation and growth. Nat. Methods 2015, 12, 1091–1097. [Google Scholar] [CrossRef]
- Sharma, S.K.; Dykes, A.C.; Misra, A.K.; Kamemoto, L.E.; Bates, D.E. Raman discrimination of bacterial strains using multilayered microcavity substrates. Smart Biomed. Physiol. Sens. Technol. VIII 2011, 8025, 802508. [Google Scholar] [CrossRef]
- Guicheteau, J.; Argue, L.; Hyre, A.; Jacobson, M.; Christesen, S.D. Raman and surface-enhanced Raman spectroscopy of amino acids and nucleotide bases for target bacterial vibrational mode identification. Chem. Biol. Sens. VII 2006, 6218, 62180O. [Google Scholar] [CrossRef]
- Polisetti, S.; Baig, N.; Bible, A.; Morrell-Falvey, J.; Doktycz, M.; Bohn, P.W. Using Raman spectroscopy and SERS for in situ studies of rhizosphere bacteria. Biosensing Nanomed. VIII 2015, 9550, 95500D. [Google Scholar] [CrossRef]


| Tree | Site (GPS Coordinates) | Isolate Identification No. |
|---|---|---|
| Alfa (α) | 55.829832, 26.217380 | 21, 27, 30, 32, 33, 33.1,34, 36, 40, 46.1, 46.2, 49 |
| Bravo (β) | 55.8301132, 26.2168633 | 24, 29, 35, 37, 47.1, 47.2 |
| Isolate Identification Code | Colony Morphology | Morphotype | Closest NCBI Match, Accession No., % Identity |
|---|---|---|---|
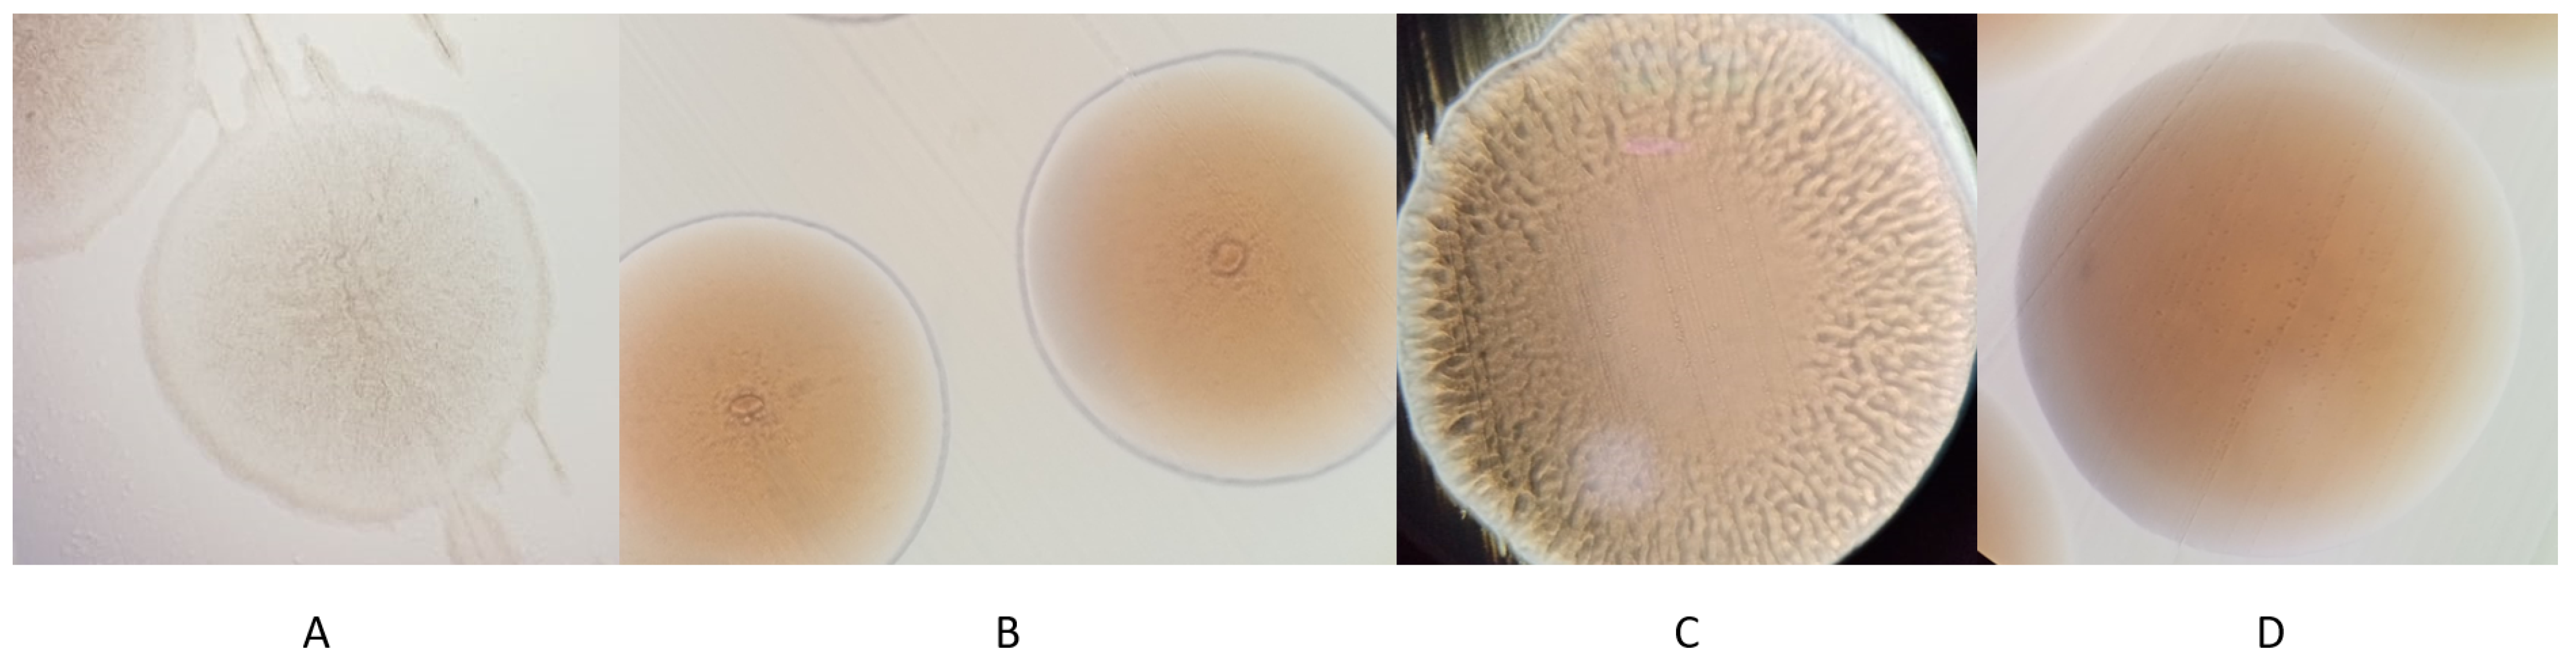
| 21, 33.1, 35 | Colonies are circular, flat with a slightly undulate margin, smooth and glistening, off-white with a grey bull’s eye in the center, translucent and mucoid. | A | Paenibacillus tundrae A10b, NR_044525.1, 99.32–99.46% |
| 27, 30, 34 | Colonies are circular, flat, cream colored, translucent, smooth and glistening, butyrous, the margin is entire. Changes LB agar medium color to bright yellow. A small spindle formation can be observed at the center of the colony with 40× magnification. | B | Pantoea agglomerans DSM 3493, NR_041978.1, 99.64–99.97% |
| 24, 29 | Colonies are circular, raised, buff color, glistening and butyrous, the center of the colony is rough, and the edges are smooth, the margin is entire. The colonies change color of LB agar medium to bright yellow. | C | Pseudomonas brenneri CFML 97–391, NR_025103.1, 99.86%; Pseudomonas proteolytica CMS 64, NR_025588.1, 99.59% |
| 32, 33, 36, 37, 40, 46.1, 46.2, 47.1, 47.2, 49 | Colonies are circular, flat, cream colored, translucent, smooth and glistening, butyrous, the margin is entire. Changes LB agar medium color to bright yellow. | D | Pseudomonas azotoformans NBRC 12693, NR_113600.1, 99.66–99.79% |
| Morphotype | Isolate Identification No. | Average Diameter ± SD, µm | Biofilm Production | Antibiotic Disk Diffusion Test | Carbohydrate Use | |||||||||
|---|---|---|---|---|---|---|---|---|---|---|---|---|---|---|
| AM-10 | CTX-30 | C-30 | K-30 | STP-10 | TIC-75 | L | M | Su | G | F | ||||
| A | 21 | 0.444 ± 0.03 | − | S | R | S | S | R | R | Ac | Ac | Ac | Ac | Ac |
| 33.1 | 0.361 ± 0.039 | − | S | R | S | S | R | R | Ac | Ac | Ac | Ac | Ac | |
| 35 | 0.43 ± 0.042 | − | S | R | S | S | R | R | Ac | Ac | Ac | Ac | Ac | |
| B | 27 | 0.324 ± 0.041 | − | S | S | S | S | S | R | Ac | Ac | Ac | Ac | Ac |
| 30 | 0.352 ± 0.04 | − | S | S | S | S | S | R | Ac | Ac | Ac | Ac | Ac | |
| 34 | 0.438 ± 0.028 | − | S | S | S | S | S | R | Ac | Ac | Ac | Ac | Ac | |
| C | 24 | 0.326 ± 0.033 | moderate | R | R | R | S | R | R | − | − | − | Ac | − |
| 29 | 0.284 ± 0.014 | moderate | R | R | R | S | R | R | − | − | − | Ac | − | |
| D | 32 | 0.366 ± 0.021 | − | R | R | R | S | R | R | − | − | − | Ac | − |
| 33 | 0.338 ± 0.03 | − | R | R | R | S | R | R | − | − | − | Ac | − | |
| 36 | 0.447 ± 0.047 | − | R | R | R | S | R | R | − | − | − | Ac | − | |
| 37 | 0.34 ± 0.023 | − | R | R | R | S | R | R | − | − | − | Ac | − | |
| 40 | 0.427 ± 0.037 | − | R | R | R | S | R | R | − | − | − | Ac | − | |
| 46.1 | 0.426 ± 0.036 | − | R | R | R | S | R | R | − | − | − | Ac | − | |
| 46.2 | 0.338 ± 0.028 | − | R | R | R | S | R | R | − | − | − | Ac | − | |
| 47.1 | 0.43 ± 0.073 | − | R | R | R | S | R | R | − | − | − | Ac | − | |
| 47.2 | 0.45 ± 0.042 | − | R | R | R | S | R | R | − | − | − | Ac | − | |
| 49 | 0.405 ± 0.042 | − | R | R | R | S | R | R | − | − | − | Ac | − | |
| Peak Wavenumber, cm−1 | Tentative Band Assignments * | |||||||
|---|---|---|---|---|---|---|---|---|
| 24 | 27 | 30 | 33.1 | 34 | 35 | 37 | 49 | |
| 563.38 | T, G [10,54] | |||||||
| 574.21 | 573.52 | 573.01 | 573.47 | 572.08 | 573.63 | 573.57 | Deformation of C=O–C in lipids [55] or Trp [54,56,57] or carbohydrates [58] | |
| 621.65 | 625.66 | 622.17 | 623.31 | 620.93 | 622.5 | 622.03 | C–C twisting mode of Phe ring [7,10,29,54,56] | |
| 658.43 | 657.8 | 658.53 | 657.42 | 657.71 | 657.09 | 657.93 | 658.28 | G, ring breathing mode [9,59,60,61] or amino acids COO–[62] |
| 688.19 | 689.83 | 689.18 | 689.93 | 692.23 | C–S stretch [26,57] or Gly [54] | |||
| 739.19 | 727.8 | 737.96 | 733.83 | 737.14 | 734.21 | 738.08 | 737.93 | A, glycosidic ring breathing [9,10,15,26,63,64] |
| 807.14 | 804.25 | 804.8 | 805.45 | 807.23 | 801.95 | 804.72 | O–P–O [1,26] or C–N stretch [20] | |
| 836.42 | 832.58 | 831.81 | 830.52 | 832.87 | O–P–O stretching in T [10,59] or Tyr [29,59] | |||
| 859.65 | 858 | 858 | 859.14 | 859.65 | 858.69 | Phosphodiester, deoxyribose related to T [4,10] or Tyr [29] | ||
| 882.32 | 879.93 | 882.2 | 880.81 | T, ring bending [10], stretching of C–N or C–O–N or deformation of C–C–H [65] | ||||
| 922.65 | 919.72 | 922.49 | 920.2 | 922.4 | 922.32 | 922.51 | 922.53 | C–COO– stretch in carbohydrates [26,66] |
| 958.79 | 959.67 | 957.92 | 958.24 | 958.22 | C–N stretching [7,10,29,67] or C–C/C–O stretching in membrane proteins [10] | |||
| 966.22 | C–N stretch [26] or C=C deformation in G [61] | |||||||
| 1005.6 | Phe [7,10,29] | |||||||
| 1011.9 | 1009.1 | 1009.5 | 1010 | 1009.6 | 1009.5 | 1009.4 | Phe [68,69] or Trp [54,57] | |
| 1051 | 1050.3 | 1050.6 | 1050.9 | 1050.8 | 1051.1 | 1050.4 | 1050 | Phenylalanine (the in-plane C–H bending mode) [69] or stretching of C–O/CH2–OH in lipids [70] |
| 1091.2 | 1094.7 | 1099.2 | 1089.9 | PO2- of nucleic acid stretching [10,20,29] or deformation in carbohydrates(C–C, C–O, –COH) [7,65,67] | ||||
| 1116.4 | 1119.2 | Trp [65] | ||||||
| 1131.1 | 1129.6 | C–N and C–C stretching in carbohydrates [61,69] or =C–C= in unsaturated fatty acids in lipids [16,29] | ||||||
| 1159.3 | 1161.7 | 1159.8 | 1158.5 | 1158.5 | 1159.6 | 1158.3 | 1158.7 | C–C/C–N stretching in proteins [10] or carotenoids [15,29] |
| 1202 | 1201.9 | 1203 | 1200.8 | 1201.5 | 1201.6 | 1201.1 | 1201.7 | =C–C= in lipids [69] or aromatic amino acids in proteins [71] |
| 1247.2 | 1247.4 | 1247.6 | 1246.4 | 1254.8 | 1250.9 | 1252.5 | 1256.9 | Amide III [10,26,29,62,65] |
| 1301.4 | 1301.7 | 1303.1 | 1301.6 | 1300.4 | CH2 twist in lipids [10,55] | |||
| 1328.4 | 1325.2 | 1327.7 | 1328.2 | 1328.5 | 1328 | 1327.4 | 1327.3 | A [9,62,63,70,72] |
| 1363.7 | 1363.3 | 1363.5 | 1363.8 | 1363.8 | 1364.7 | 1366.4 | Trp [10] or C–H deformation in proteins/COO– deformation [5,73] | |
| 1383 | 1387.1 | 1388.8 | 1386.3 | COO– stretching in proteins [66,74] or CH3 bending [29] | ||||
| 1398.8 | COO– symmetric stretching [1,75] or deformation of CH3 [76] | |||||||
| 1421.2 | CH2 deformation in lipids [50,66,68] or A, G [66,71] | |||||||
| 1470.4 | 1467.8 | 1469.6 | 1470 | 1470 | 1470.2 | 1469.6 | 1468.8 | Lipids [9,10] or deformation of C–H in proteins [65,69] |
| 1501.2 | Fatty acids in lipids [5,73] or carotenoids [29] or amino acids [74] | |||||||
| 1511.1 | 1511.5 | Carotenoids [29,77] or Phe [70] | ||||||
| 1569.4 | 1570.5 | 1570.1 | 1570.9 | 1569.9 | 1569.5 | 1569.3 | Tyr/proteins [69,70] or A/G [78] | |
| 1592.4 | Proteins [10] or A/G [1,7] or Tyr [72,79] | |||||||
| 1634.5 | 1634.7 | 1636.8 | 1634.5 | 1635.5 | 1633.1 | 1633 | Amide I in lipids [10,26,72] | |
| 1647.9 | Amide I [69] or T [29,68] | |||||||
| 1679.2 | 1694 | 1681.1 | 1684.3 | 1676.6 | 1682.8 | Amide I [10,62,71,75] | ||
| 1703.4 | C=O [5,71] | |||||||
| 1750.2 | C=O stretching [5,21] | |||||||
Publisher’s Note: MDPI stays neutral with regard to jurisdictional claims in published maps and institutional affiliations. |
© 2021 by the authors. Licensee MDPI, Basel, Switzerland. This article is an open access article distributed under the terms and conditions of the Creative Commons Attribution (CC BY) license (https://creativecommons.org/licenses/by/4.0/).
Share and Cite
Vaitiekūnaitė, D.; Snitka, V. Differentiation of Closely Related Oak-Associated Gram-Negative Bacteria by Label-Free Surface Enhanced Raman Spectroscopy (SERS). Microorganisms 2021, 9, 1969. https://doi.org/10.3390/microorganisms9091969
Vaitiekūnaitė D, Snitka V. Differentiation of Closely Related Oak-Associated Gram-Negative Bacteria by Label-Free Surface Enhanced Raman Spectroscopy (SERS). Microorganisms. 2021; 9(9):1969. https://doi.org/10.3390/microorganisms9091969
Chicago/Turabian StyleVaitiekūnaitė, Dorotėja, and Valentinas Snitka. 2021. "Differentiation of Closely Related Oak-Associated Gram-Negative Bacteria by Label-Free Surface Enhanced Raman Spectroscopy (SERS)" Microorganisms 9, no. 9: 1969. https://doi.org/10.3390/microorganisms9091969
APA StyleVaitiekūnaitė, D., & Snitka, V. (2021). Differentiation of Closely Related Oak-Associated Gram-Negative Bacteria by Label-Free Surface Enhanced Raman Spectroscopy (SERS). Microorganisms, 9(9), 1969. https://doi.org/10.3390/microorganisms9091969